Embed Size (px)
Citation preview
Air Transport Aircraft
Production Outlook
Presented by
Kevin Michaels, Partner
Ann Arbor, Michigan • Amersham, United Kingdom • Singaporewww.AeroStrategy.com
October 6, 2010
Orlando, FL
TITANIUM 2010 Conference - Economics Panel
© 2010 AeroStrategy Titanium 2010 1

© 2010 AeroStrategy Titanium 2010 1
© 2010 AeroStrategy Titanium 2010 1

© 2010 AeroStrategy Titanium 2010 1

© 2010 AeroStrategy Titanium 2010
How Can Air Transport OEMs
Increase Production Rates On The
Heels Of A Global Recession?
6

© 2010 AeroStrategy Titanium 2010
Fuel Costs Have Increased 500% Since 2000…
7
Fuel Costs 1978 to present
(cents per gallon)
0
50
100
150
200
250
300
350
1978 1980 1982 1984 1986 1988 1990 1992 1994 1996 1998 2000 2002 2004 2006 2008
Source: Airline Monitor; Air Transport Association
500%2002: 11% of
airline expenses
2008: 30% of
airline expenses
Production
Outlook

© 2010 AeroStrategy Titanium 2010
…And Over The Same Timeframe Airline Yields Were Flat, Creating A Major Imperative For Fuel Savings…
8
• Yields fell during
the 2002 and 2009
downturns and are
unchanged from
the beginning of
the decade
• Fuel is now 30% of
an airline’s cost
structure compared
to 10-12% earlier in
the decade
Fuel Costs vs. US Major Yields
1999 to presentFuel Cost
(cents/gallon)Yield
(in cents/RPM),
0
2
4
6
8
10
12
14
16
0
50
100
150
200
250
300
350
Yield
Fuel
Source: Airline Monitor; Air Transport Association
Production
Outlook

© 2010 AeroStrategy Titanium 2010
…As Evidenced By A Comparison Of MD-80 And B737NG Operating Economics…
9
Fuel Cost Per Passenger (USD)
DFW – New York LGA (1,447 miles)
MD-80
B737-800
$18/passenger cost difference with fuel at $2.60/gallon
Source: Dallas Morning News
Production
Outlook

© 2010 AeroStrategy Titanium 2010
While Fuel Costs Skyrocketed, Deliveries Of Newer Fuel-Efficient Aircraft Were Below The 2000 Peak…
10
DeliveriesFuel Cost
(cents per gallon)
0
50
100
150
200
250
300
350
0
200
400
600
800
1000
1200
1400
Air Transport Deliveries vs. Fuel Costs
1978 to present
Aircraft
Deliveries
Fuel
Source: Airline Monitor
Production
Outlook

© 2010 AeroStrategy Titanium 2010
…Which Contributed To Record Backlogs For Air Transport Aircraft
11
• Airbus and Boeing
achieved record
backlogs in 2007/08
by maintaining
relatively steady
production during
record orders
• The backlog peaked
at 90 months – far in
excess of the
previous record of
55 months in the
late 1980s
Air Transport Backlog
1970 to presentBacklog
(as a % of Fleet)Production Backlog
(in months)
0
10
20
30
40
50
60
70
80
90
100
0
5
10
15
20
25
30
35
40
45
Source: Airline Monitor Feb 2010
% of Fleet
Months
Production
Outlook

© 2010 AeroStrategy Titanium 2010
High Fuel Costs Have Also Contributed To Early Aircraft Obsolescence And Growing Retirements…
12
• High fuel costs
combined with the
recession have
contributed to higher
retirement rates
• In 2007/08, 400 aircraft
were scrapped each
year – equivalent to
40% of deliveries
• Qantas recently
changed its
depreciation policy to
recognize shorter
aircraft economic life-
spans; will other
airlines follow suit?
Source: Airline Monitor Feb 2010
0
200
400
600
800
1000
1200
1400
1990 1992 1994 1996 1998 2000 2002 2004 2006 2008
Air Transport Retirements and Deliveries
Retired/scrapped
aircraft
Deliveries
Production
Outlook

© 2010 AeroStrategy Aviation Week MRO Europe 2010
12%
88%
…And A Small Portion Of The 1,500+ Parked Fleet Is Economically Viable At Current Fuel Prices…
13
Air Transport Fleet: Temporarily Inactive/ In Storage (Sept 2010)
1,553
High
potential to
return to
service at
current fuel
prices
Low-
moderate
potential /
obsolete
• Despite the large size (1,553) of the parked fleet, only a
small portion – 200 – is likely to return to service at
current fuel prices
• This equates to 1% of global capacity….or
approximately two months of production rates
Source: OAG Aviation
Aircraft Family Sep-10
737-3/4/500 201
MD80 181
DC9 136
737-1/200 106
146 74
727 73
EMB-135/140/145 78
757 54
747-1/2/300 47
747-400 47
CRJ-100/200 56
F100 48
A300-600 43
DC8-6/70 32
DC10 38
F28 31
328JET 29
A310 12
A300 19
MD11 9
717 9
L1011 12
707 10
F70 4
BAC 1-11 2
MD10 5
MD90 6
Total 1,362
Aircraft Family Sep-10
767 67
737-6/7/8/900 15
777 3
A320 Series 64
A330 11
A340 20
CRJ-700/900/1000 4
EMB-170/190 7
Total 191
Production
Outlook
© 2010 AeroStrategy Titanium 2010 14
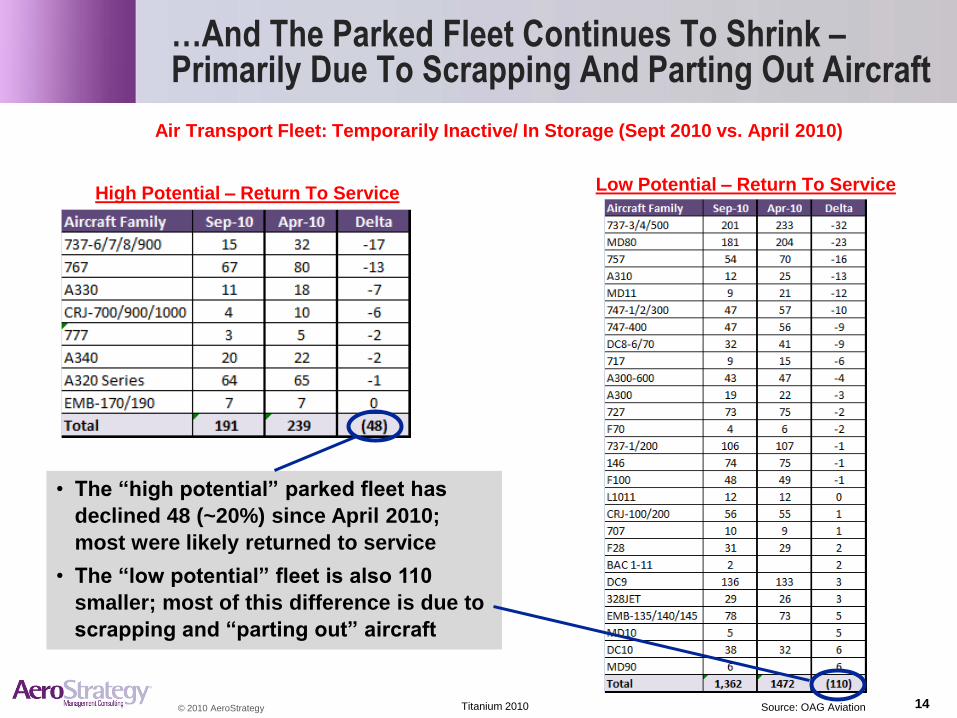
High Potential – Return To Service
Air Transport Fleet: Temporarily Inactive/ In Storage (Sept 2010 vs. April 2010)
Low Potential – Return To Service
• The “high potential” parked fleet has
declined 48 (~20%) since April 2010;
most were likely returned to service
• The “low potential” fleet is also 110
smaller; most of this difference is due to
scrapping and “parting out” aircraft
…And The Parked Fleet Continues To Shrink –Primarily Due To Scrapping And Parting Out Aircraft
Source: OAG Aviation
© 2010 AeroStrategy Titanium 2010
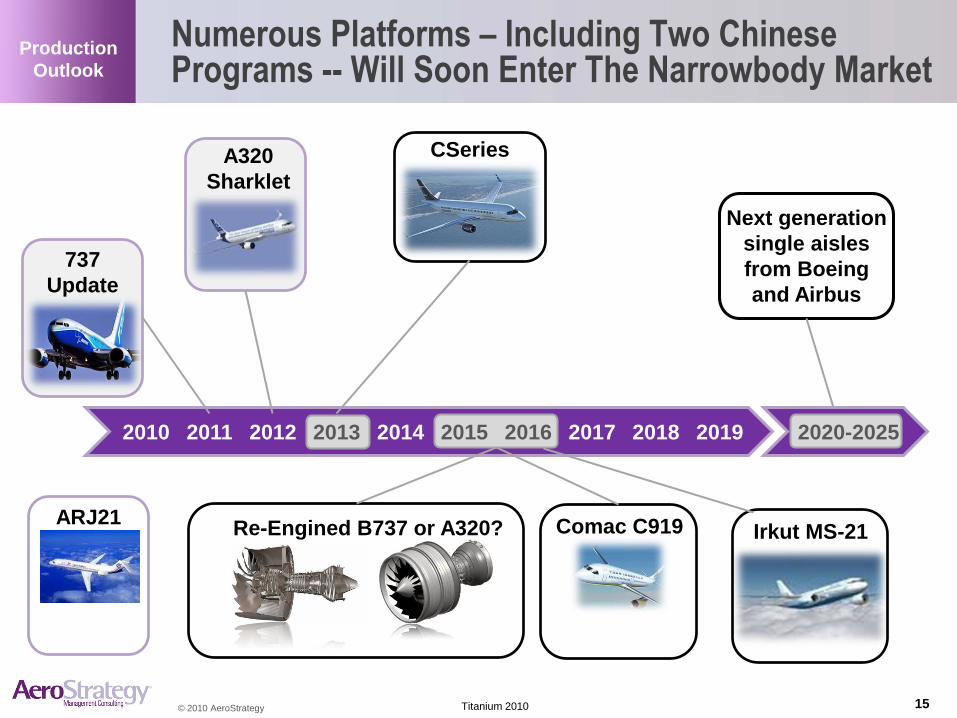
Numerous Platforms – Including Two Chinese Programs -- Will Soon Enter The Narrowbody Market
15
2010 2011 2012 2014 2017 2018 2019 2020
737
Update
Next generation
single aisles
from Boeing
and Airbus
A320
Sharklet
CSeries
Re-Engined B737 or A320?
2015 20162013
Comac C919 Irkut MS-21
2020-2025
Production
Outlook
ARJ21

© 2010 AeroStrategy Titanium 2010
One Other Factor – EADS’s Need For Cash – Will Underpin Air Transport Production Rates
16Source: AeroStrategy analysis
Economic fallout of
skyrocketing fuel prices
Record production
backlogs
EADS need for cash- Mounting losses on A400M and A380
- Need to fund A350 XWB development
- A320 is a positive cash generator
Factors Sustaining Air Transport Production Rates
Production
Outlook
Emerging Single Aisle
Competition

© 2010 AeroStrategy Titanium 2010
Combined, These Factor Will Underpin Steady Production Rates Despite The Global Recession
17Source: AeroStrategy analysis
0
200
400
600
800
1000
1200
1400
2009 2010 2011 2012 2013 2014
Other
787 Family
A380767
EMB-170/175CRJ-700/900/1000
EMB-190/195
A330/A340 Family777 Family
A320 Family
737 Family
AeroStrategy Air Transport Delivery Forecast(March 2010)
Production
Outlook
Production rates will
be even higher after
the recently
announced B737 /
A320 production rate
increases materialize
© 2010 AeroStrategy Titanium 2010
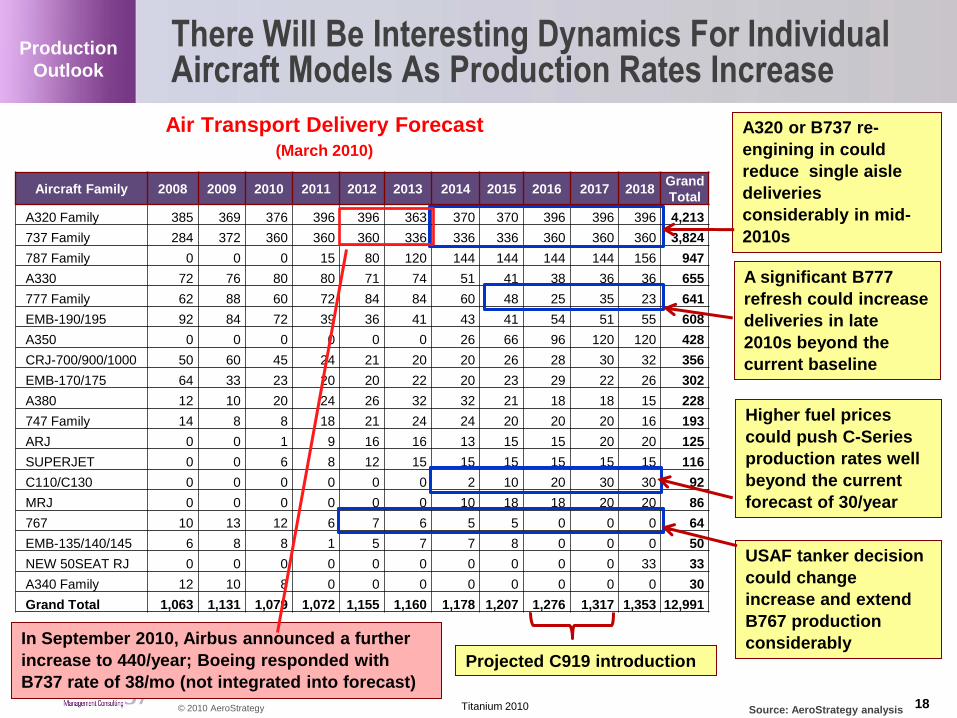
There Will Be Interesting Dynamics For Individual Aircraft Models As Production Rates Increase
18
Aircraft Family 2008 2009 2010 2011 2012 2013 2014 2015 2016 2017 2018Grand
Total
A320 Family 385 369 376 396 396 363 370 370 396 396 396 4,213
737 Family 284 372 360 360 360 336 336 336 360 360 360 3,824
787 Family 0 0 0 15 80 120 144 144 144 144 156 947
A330 72 76 80 80 71 74 51 41 38 36 36 655
777 Family 62 88 60 72 84 84 60 48 25 35 23 641
EMB-190/195 92 84 72 39 36 41 43 41 54 51 55 608
A350 0 0 0 0 0 0 26 66 96 120 120 428
CRJ-700/900/1000 50 60 45 24 21 20 20 26 28 30 32 356
EMB-170/175 64 33 23 20 20 22 20 23 29 22 26 302
A380 12 10 20 24 26 32 32 21 18 18 15 228
747 Family 14 8 8 18 21 24 24 20 20 20 16 193
ARJ 0 0 1 9 16 16 13 15 15 20 20 125
SUPERJET 0 0 6 8 12 15 15 15 15 15 15 116
C110/C130 0 0 0 0 0 0 2 10 20 30 30 92
MRJ 0 0 0 0 0 0 10 18 18 20 20 86
767 10 13 12 6 7 6 5 5 0 0 0 64
EMB-135/140/145 6 8 8 1 5 7 7 8 0 0 0 50
NEW 50SEAT RJ 0 0 0 0 0 0 0 0 0 0 33 33
A340 Family 12 10 8 0 0 0 0 0 0 0 0 30
Grand Total 1,063 1,131 1,079 1,072 1,155 1,160 1,178 1,207 1,276 1,317 1,353 12,991
Air Transport Delivery Forecast(March 2010)
A320 or B737 re-
engining in could
reduce single aisle
deliveries
considerably in mid-
2010s
A significant B777
refresh could increase
deliveries in late
2010s beyond the
current baseline
Higher fuel prices
could push C-Series
production rates well
beyond the current
forecast of 30/year
USAF tanker decision
could change
increase and extend
B767 production
considerably
Production
Outlook
Projected C919 introduction
In September 2010, Airbus announced a further
increase to 440/year; Boeing responded with
B737 rate of 38/mo (not integrated into forecast)
Source: AeroStrategy analysis

© 2010 AeroStrategy Titanium 2010
1
EMEALondon, England
43 Hill Avenue, Amersham
Buckinghamshire HP6 5BX
United Kingdom
Phone: +44 1494 431-600
Fax: +44 1494 434-500
Email: [email protected]
AmericasAnn Arbor, Michigan
101 North Main Street, Suite 400
Ann Arbor, Michigan 48104
United States of America
Phone: +1 734 821-0220
Fax: +1 734 821-0221
Email: [email protected]
Asia PacificSingapore
314 Tanglin Road, #01-05
Phoenix Park Office Campus
Singapore 247977
Phone: +65 9111-8435
Fax: +65 6884-4951
Email: [email protected]
www.aerostrategy.com
19