Embed Size (px)
Citation preview

Annex G.1
Air Quality Specialist Report
Environmental and Social Impact Assessment (ESIA)
for the Proposed Gamsberg Zinc Mine
AIR QUALITY IMPACT ASSESSMENT
Commissioned by:
ERM Consulting
Prepared by:
Demos Dracoulides Amy Xu
CAPE TOWN PO Box 60034, Table View 7439
Tel: +2721 551 1836 Fax: +2721 557 1078
Report No GAM-AQI-R02 March 2013

Air Quality Impact Assessment Report for the Proposed Gamsberg Zinc Mine
DDA March 2013 i
Executive Summary
1. Introduction
Black Mountain Mining (Pty) Ltd intends to establish a 10 million tons per annum (Mtpa)
open pit zinc mine (beneficiation volume) at Gamsberg Inselberg in the Northern Cape
Province. In addition to the open pit zinc mine and associated infrastructure an office
complex and a zinc concentrator will be established to process the mined ore. The mine
will produce ore utilising an open pit mining method, with run of mine approximately 10
Mtpa at full capacity. The expected life of mine is approximately 17 years with the
possibility of it being extended.
DDA Environmental Engineers (DDA) has been appointed by Environmental Resources
Management (Southern Africa) Pty Ltd (ERM) for the determination of the air quality
impact assessment for the proposed zinc mine.
2. Study Approach
The air pollutant emissions from the mining operations, ore crushing and screening, ore
loading and offloading, as well as the transporting of ore were determined according to the
following:
• Fugitive dust emissions from general works, wind erosion of exposed areas, aggregate
handling, ore crushing and screening and storage piles.
• Dust generation from vehicle activities, such as haul trucks and traffic on unpaved
roads.
The data generated during this phase was processed using US-EPA emission factors, and
a detailed emissions inventory was created for the Gamsberg mining operations. The
pollutants quantified were ), suspended particulate matter and suspended particulate matter
with a diameter of less than 10 μm (PM10). The above-mentioned emissions were then
used as input into the air pollution dispersion model.
Three years of hourly meteorological data for the study area were processed, in order to
generate the meteorological parameters for input into the air pollution dispersion model.
Air Quality Impact Assessment Report for the Proposed Gamsberg Zinc Mine
DDA March 2013 ii
The AERMOD model was used to simulate the dispersion of the air pollutants from all the
project’s activities. AERMOD is an US Environmental Protection Agency’s (US EPA)
approved regulatory model. With the use of AERMOD, the resulting ambient air pollution
and dust deposition concentrations from the different activities around the site were
determined.
The generated dispersion simulation data was utilised, in order to estimate the impact on
the area’s air quality. Possible mitigation measures were identified, and their effect on the
resulting ambient air pollution concentrations assessed.
3. Impact Assessment
Construction
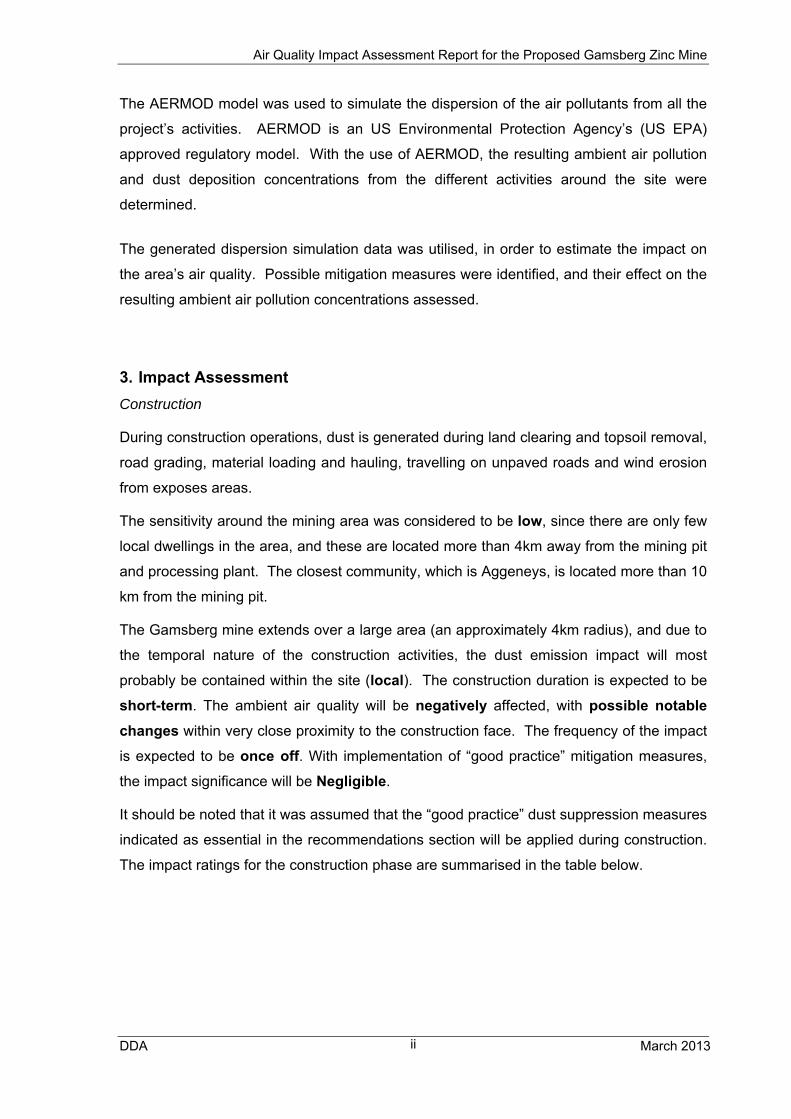
During construction operations, dust is generated during land clearing and topsoil removal,
road grading, material loading and hauling, travelling on unpaved roads and wind erosion
from exposes areas.
The sensitivity around the mining area was considered to be low, since there are only few
local dwellings in the area, and these are located more than 4km away from the mining pit
and processing plant. The closest community, which is Aggeneys, is located more than 10
km from the mining pit.
The Gamsberg mine extends over a large area (an approximately 4km radius), and due to
the temporal nature of the construction activities, the dust emission impact will most
probably be contained within the site (local). The construction duration is expected to be
short-term. The ambient air quality will be negatively affected, with possible notable
changes within very close proximity to the construction face. The frequency of the impact
is expected to be once off. With implementation of “good practice” mitigation measures,
the impact significance will be Negligible.
It should be noted that it was assumed that the “good practice” dust suppression measures
indicated as essential in the recommendations section will be applied during construction.
The impact ratings for the construction phase are summarised in the table below.
Air Quality Impact Assessment Report for the Proposed Gamsberg Zinc Mine
DDA March 2013 iii
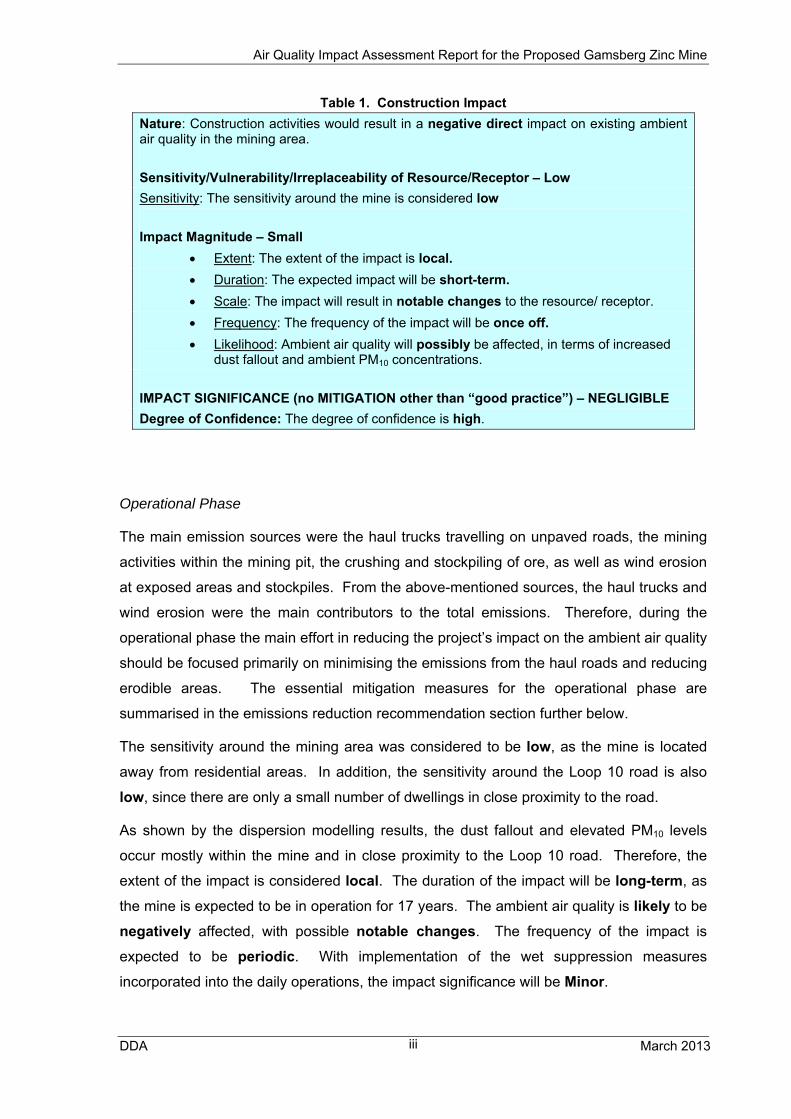
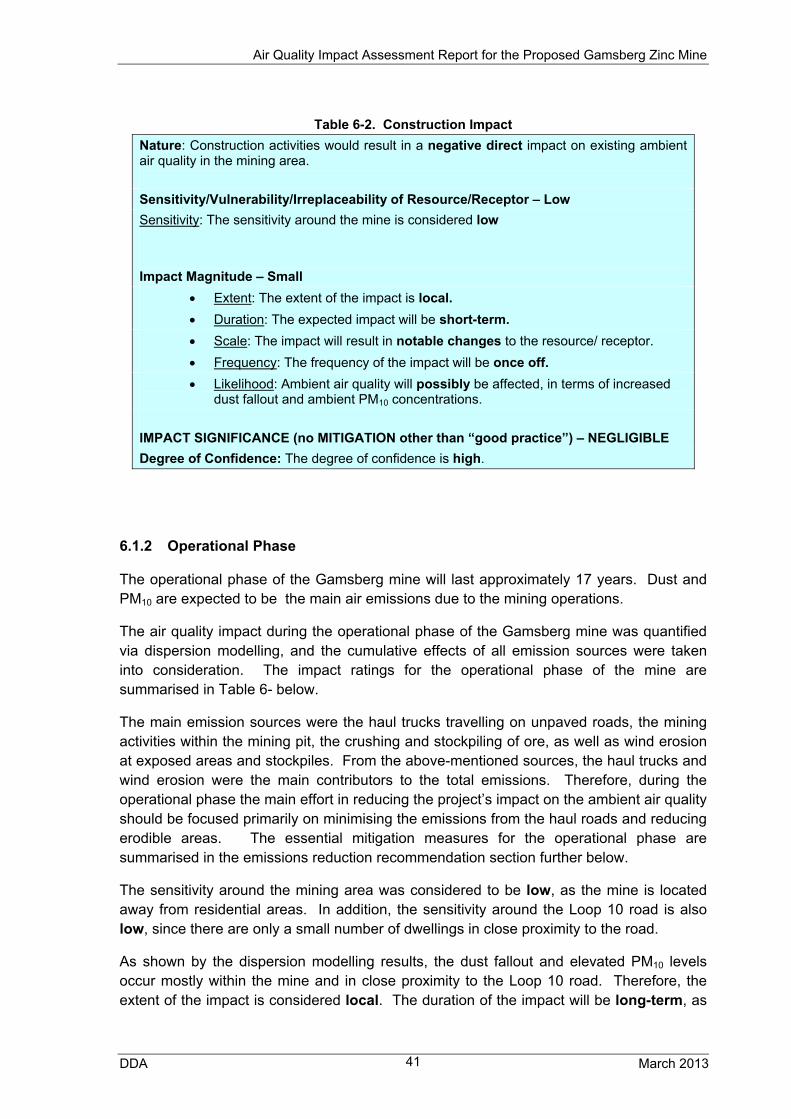
Table 1. Construction Impact
Nature: Construction activities would result in a negative direct impact on existing ambient air quality in the mining area.
Sensitivity/Vulnerability/Irreplaceability of Resource/Receptor – Low
Sensitivity: The sensitivity around the mine is considered low
Impact Magnitude – Small
Extent: The extent of the impact is local.
Duration: The expected impact will be short-term.
Scale: The impact will result in notable changes to the resource/ receptor.
Frequency: The frequency of the impact will be once off.
Likelihood: Ambient air quality will possibly be affected, in terms of increased dust fallout and ambient PM10 concentrations.
IMPACT SIGNIFICANCE (no MITIGATION other than “good practice”) – NEGLIGIBLE
Degree of Confidence: The degree of confidence is high.
Operational Phase
The main emission sources were the haul trucks travelling on unpaved roads, the mining
activities within the mining pit, the crushing and stockpiling of ore, as well as wind erosion
at exposed areas and stockpiles. From the above-mentioned sources, the haul trucks and
wind erosion were the main contributors to the total emissions. Therefore, during the
operational phase the main effort in reducing the project’s impact on the ambient air quality
should be focused primarily on minimising the emissions from the haul roads and reducing
erodible areas. The essential mitigation measures for the operational phase are
summarised in the emissions reduction recommendation section further below.
The sensitivity around the mining area was considered to be low, as the mine is located
away from residential areas. In addition, the sensitivity around the Loop 10 road is also
low, since there are only a small number of dwellings in close proximity to the road.
As shown by the dispersion modelling results, the dust fallout and elevated PM10 levels
occur mostly within the mine and in close proximity to the Loop 10 road. Therefore, the
extent of the impact is considered local. The duration of the impact will be long-term, as
the mine is expected to be in operation for 17 years. The ambient air quality is likely to be
negatively affected, with possible notable changes. The frequency of the impact is
expected to be periodic. With implementation of the wet suppression measures
incorporated into the daily operations, the impact significance will be Minor.

Air Quality Impact Assessment Report for the Proposed Gamsberg Zinc Mine
DDA March 2013 iv
Table 2. Operational Impact
Nature: Operational activities would result in a negative direct impact on existing ambient air quality in the mining and surrounding areas.
Sensitivity/Vulnerability/Irreplaceability of Resource/Receptor – Low
Sensitivity: The sensitivity around the mine is considered low.
Impact Magnitude – Small
Extent: The extent of the impact is local.
Duration: The expected impact will be long-term.
Scale: The impact will result in notable changes to the resource/ receptor.
Frequency: The frequency of the impact will be periodic.
Likelihood: Ambient air quality will likely be affected, in terms of increased dust fallout and ambient PM10 concentrations.
IMPACT SIGNIFICANCE (with standard MITIGATION) – MINOR.
Degree of Confidence: The degree of confidence is high.
4. Recommendations
Since the main dust and PM10 emission source is truck movements, the practice of
watering access roads is a measure that should be adhered to more stringently. A proper
dust suppression plan should be developed that contains precautions, which prevent the
transfer of dust from truck wheels onto paved roads.
The best way to avoid dust problems is to ensure that roads are properly maintained by
surface grading and shaping for cross-sectional crowning to prevent excessive road
surface wearing and consequent dust generation. Chemical dust suppressants should
generally be used close to sensitive receptors when wet suppression does not have the
desired results and when maintenance practices have been implemented to the greatest
extent possible.
Along the Loop 10 Road, a reduction of the speed limit to 40 km/hr close to the sensitive
receptors (R08 to R18) is recommended (refer to Table 5-2), in order to reduce the dust
generation. The dust deposition levels at two locations along the road should be
monitored, and if these exceed the limit then additional measures, such as chemical
stabilisation, should be considered.
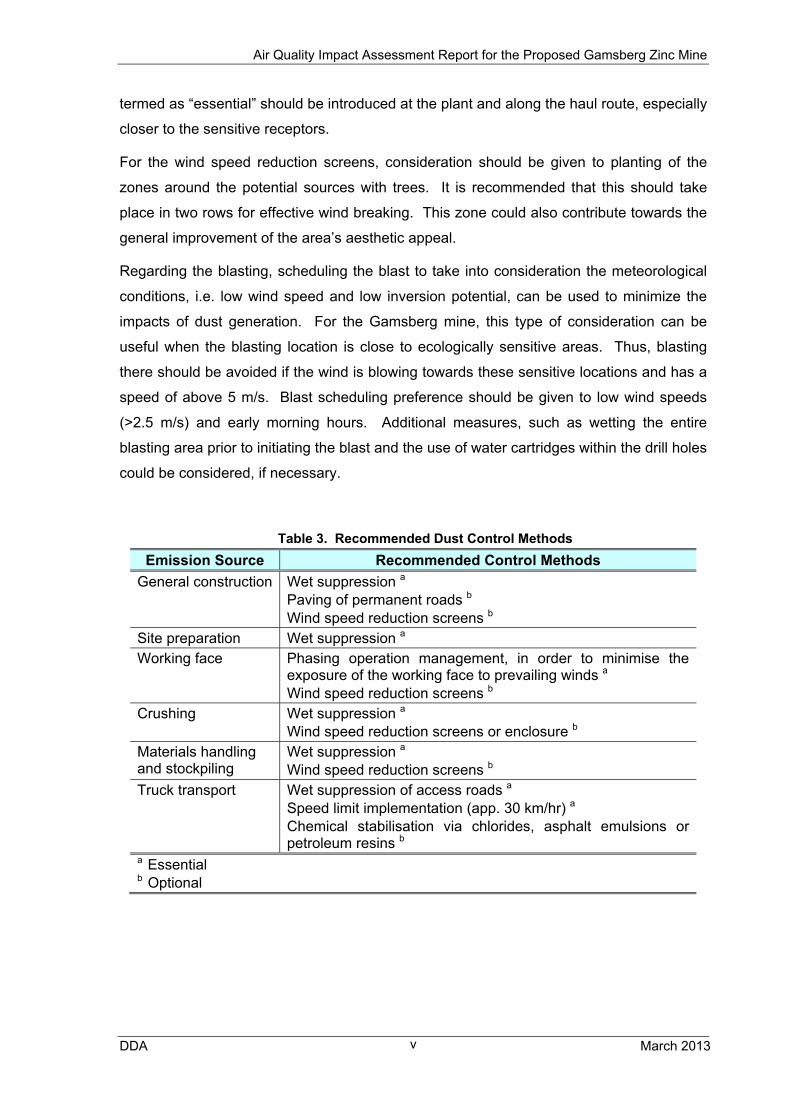
The following Table 6-4 summarises the dust suppression methods that should be used,
according to the various works during construction and operation. The control measures
Air Quality Impact Assessment Report for the Proposed Gamsberg Zinc Mine
DDA March 2013 v
termed as “essential” should be introduced at the plant and along the haul route, especially
closer to the sensitive receptors.
For the wind speed reduction screens, consideration should be given to planting of the
zones around the potential sources with trees. It is recommended that this should take
place in two rows for effective wind breaking. This zone could also contribute towards the
general improvement of the area’s aesthetic appeal.
Regarding the blasting, scheduling the blast to take into consideration the meteorological
conditions, i.e. low wind speed and low inversion potential, can be used to minimize the
impacts of dust generation. For the Gamsberg mine, this type of consideration can be
useful when the blasting location is close to ecologically sensitive areas. Thus, blasting
there should be avoided if the wind is blowing towards these sensitive locations and has a
speed of above 5 m/s. Blast scheduling preference should be given to low wind speeds
(>2.5 m/s) and early morning hours. Additional measures, such as wetting the entire
blasting area prior to initiating the blast and the use of water cartridges within the drill holes
could be considered, if necessary.
Table 3. Recommended Dust Control Methods
Emission Source Recommended Control Methods
General construction Wet suppression a
Paving of permanent roads b Wind speed reduction screens b
Site preparation Wet suppression a Working face Phasing operation management, in order to minimise the
exposure of the working face to prevailing winds a Wind speed reduction screens b
Crushing Wet suppression a
Wind speed reduction screens or enclosure b Materials handling and stockpiling
Wet suppression a
Wind speed reduction screens b Truck transport Wet suppression of access roads a
Speed limit implementation (app. 30 km/hr) a
Chemical stabilisation via chlorides, asphalt emulsions or petroleum resins b
a Essential b Optional
Air Quality Impact Assessment Report for the Proposed Gamsberg Zinc Mine
DDA March 2013 vi
Table of Contents
EXECUTIVE SUMMARY ...................................................................................................... I
1 INTRODUCTION .......................................................................................................... 1
1.1 Main Aims of the Study and Terms of Reference .................................................. 1
1.2 Methodology Overview .......................................................................................... 2
1.3 Assumptions and Limitations ................................................................................. 2
2 STUDY AREA AND EMISSION SOURCES ................................................................ 4
2.1 Study Area ............................................................................................................. 4
2.2 Area’s Air Quality ................................................................................................... 4
2.3 Area’s Meteorology ................................................................................................ 8
2.4 Air Pollution Emission Sources at Gamsberg Mine ............................................. 18
3 LEGISLATIVE CONTEXT AND HUMAN HEALTH ASSESSMENT CRITERIA ........ 21
3.1 Ambient Air Quality Guidelines ............................................................................ 21
3.2 Dust Fallout Guidelines ........................................................................................ 23
4 EMISSIONS INVENTORY .......................................................................................... 24
4.1 Construction Phase ............................................................................................. 24
4.2 Operational Phase ............................................................................................... 25
4.3 Emission Quantities ............................................................................................. 30
5 DISPERSION SIMULATION ...................................................................................... 31
5.1 Introduction .......................................................................................................... 31
5.2 The AERMOD Model ........................................................................................... 31
5.3 Data Input and Set-up of AERMOD ..................................................................... 31
5.4 Operation Dispersion Simulation Results ............................................................ 34
6 IMPACT ASSESSMENT AND RECOMMENDATIONS ............................................. 40
6.1 Impact Assessment ............................................................................................. 40
6.2 Emission Reduction Recommendations and Monitoring ..................................... 42
REFERENCES ................................................................................................................... 46
Air Quality Impact Assessment Report for the Proposed Gamsberg Zinc Mine
DDA March 2013 vii
APPENDIX A. ASSESSMENT METHODOLOGY ........................................................ 48
APPENDIX B. .................................................................................................................... 53
B.1 Suggested Changes to the Project Layout (15/04/2013) ........................................ 53
APPENDIX C. .................................................................................................................... 55
C.1 Declaration of Consultant’s Independence ............................................................. 55
List of Figures page
Figure 2-1. Locality Map ...................................................................................................... 5
Figure 2-2. Location of Dust and Gas Monitoring Points (SRK, 2009) ................................ 6
Figure 2-3. Aggeneys PM10 Measurements for the Period 28 May 2009 to 27 November 2009 (Source: SRK, 2009) ............................................................................................ 8
Figure 2-4. Wind Roses: All-hours, Daytime and Night-time .............................................. 11
Figure 2-5. Wind Speed Frequency Distribution: All-hours, Daytime and Night-time ....... 12
Figure 2-6. Wind Roses: Winter and Summer ................................................................... 13
Figure 2-7. Wind Speed Frequency Distribution: Winter and Summer ............................. 14
Figure 2-8. Atmospheric Stability Roses: All-hours, Daytime and Night-time ................... 15
Figure 2-9. Atmospheric Stability Frequency Distribution: All-hours, Daytime and Night-time ............................................................................................................................. 16
Figure 2-10. Atmospheric Stability Roses: Winter and Summer ........................................ 17
Figure 2-11. Atmospheric Stability Frequency Distribution: Winter and Summer .............. 18
Figure 2-12: Gamsberg Mine Layout ................................................................................. 20
Figure 5-1. Locations of Identified Receptors ................................................................... 34
Figure 5-2. Maximum 24-Hour PM10 Concentrations (Guideline 75 μg/m3) ...................... 35
Figure 5-3. PM10 24-hr Guideline Exceedances Per Year (Guideline 75 μg/m3) ............... 36
Figure 5-4. PM10 Annual Maximum Concentration (Guideline: 40 μg/m3) ......................... 37
Figure 5-5. Averaged Daily Dust Deposition (Guideline: 600 mg/m2/d) ............................ 38
Air Quality Impact Assessment Report for the Proposed Gamsberg Zinc Mine
DDA March 2013 viii
List of Tables page
Table 1. Construction Impact .............................................................................................. iii
Table 2. Operational Impact ............................................................................................... iv
Table 3. Recommended Dust Control Methods .................................................................. v
Table 2-1. Dust deposition results for June 2009 to October 2009 ..................................... 7
Table 2-2. Meteorological Conditions Represented by the Stability Categories ................. 9
Table 3-1. Air Pollutant Guideline Concentrations ............................................................ 22
Table 3-2. Dust Deposition Guidelines (DEAT, 2005) ....................................................... 23
Table 3-3. Bands of Dust Deposition Rates Issued by SANS 1929 of 2005 ..................... 23
Table 4-1. Constants for Equation 4-1 .............................................................................. 27
Table 4-2. Emission Quantities ......................................................................................... 30
Table 5-1. Operational Emission Sources Used in Dispersion Modelling (g/s-m2) ........... 32
Table 5-2: Identified Sensitive Receptors ......................................................................... 33
Table 5-3. Modelling Results at Sensitive Receptors ........................................................ 39
Table 6-1. Impact Characteristics: Gamsberg Mine .......................................................... 40
Table 6-2. Construction Impact ......................................................................................... 41
Table 6-3. Operational Impact ........................................................................................... 42
Table 6-4. Recommended Dust Control Methods ............................................................. 43

Air Quality Impact Assessment Report for the Proposed Gamsberg Zinc Mine
DDA March 2013 1
1 INTRODUCTION
Black Mountain Mining (Pty) Ltd (herein referred to as Black Mountain), which is part of the
global Vedanta mining group, intends to establish a 10 million tons per annum (Mtpa) open
pit zinc mine (beneficiation volume) at Gamsberg Inselberg in the Northern Cape Province.
In addition to the open pit zinc mine, associated infrastructure in the form of a tailings dam,
waste rock dump, water supply, laboratories, sewage works, an office complex and a zinc
concentrator will be established to process the mined ore. Due to the low grade zinc
reserve present in the region, the zinc ore would need to be concentrated before exporting
to global markets. The total processing capacity of the zinc concentrator plant is
approximately 10 million tons per year.
The mine will produce ore utilising an open pit mining method, with run of mine approximately 10 Mtpa at full capacity. The expected life of mine is approximately 17 years with the possibility of it being extended.
DDA Environmental Engineers (DDA) has been appointed by Environmental Resources Management (Southern Africa) Pty Ltd (ERM) for the determination of the air quality impact assessment for the proposed zinc mine.
This air quality impact report identifies and quantifies the air pollution-related issues and impacts that are likely to occur in the environment and assesses the relevant impacts on the surrounding areas.
1.1 Main Aims of the Study and Terms of Reference
The main aims of the air quality study are outlined below:
Describe the environment that may be affected by the proposed activity.
Identify all legislation and guidelines that have been considered in the preparation of the impact report.
Establish an emissions inventory for dust, PM10, in which emissions from all project-related activities are quantified.
Predict the highest daily average air pollutant concentrations utilising atmospheric dispersion modelling.
Compare the resulting concentrations against relevant South African, World Bank and WHO standards and guidelines.
Assess the expected impacts during construction and operation of the project.
Identify emission reduction opportunities and cost-effective emission abatement strategies.
Air Quality Impact Assessment Report for the Proposed Gamsberg Zinc Mine
DDA March 2013 2
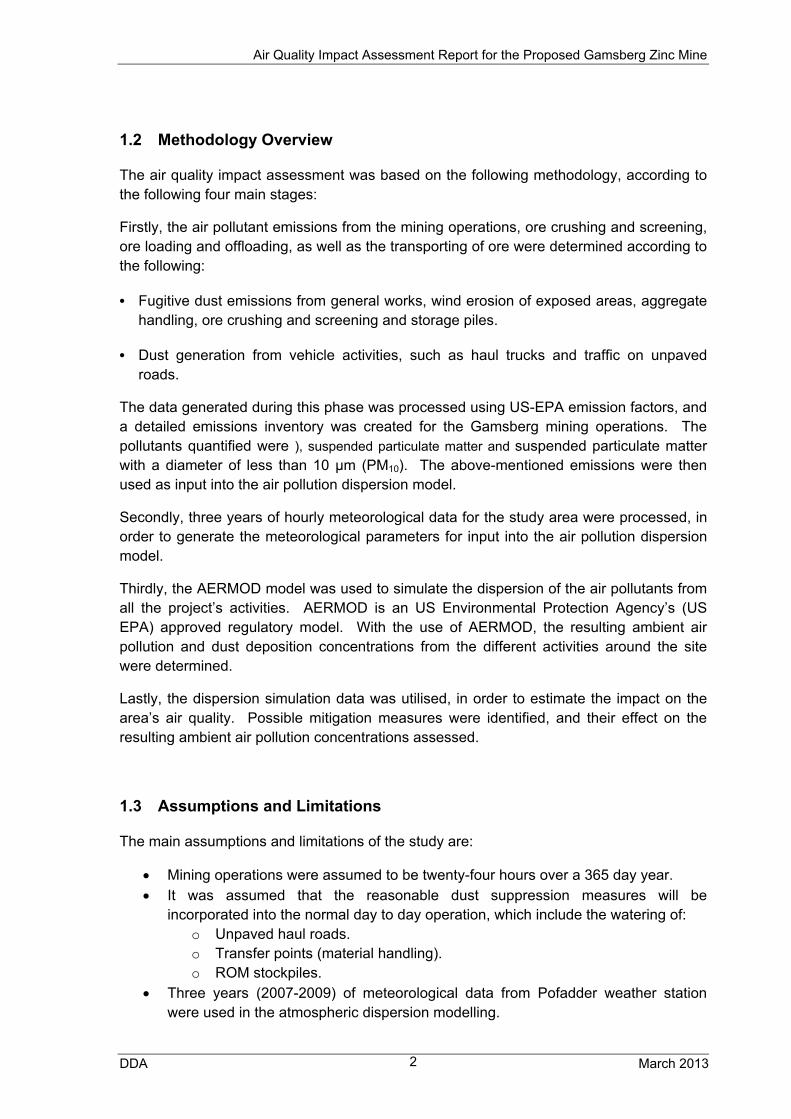
1.2 Methodology Overview
The air quality impact assessment was based on the following methodology, according to the following four main stages:
Firstly, the air pollutant emissions from the mining operations, ore crushing and screening, ore loading and offloading, as well as the transporting of ore were determined according to the following:
• Fugitive dust emissions from general works, wind erosion of exposed areas, aggregate handling, ore crushing and screening and storage piles.
• Dust generation from vehicle activities, such as haul trucks and traffic on unpaved roads.
The data generated during this phase was processed using US-EPA emission factors, and a detailed emissions inventory was created for the Gamsberg mining operations. The pollutants quantified were ), suspended particulate matter and suspended particulate matter with a diameter of less than 10 μm (PM10). The above-mentioned emissions were then used as input into the air pollution dispersion model.
Secondly, three years of hourly meteorological data for the study area were processed, in order to generate the meteorological parameters for input into the air pollution dispersion model.
Thirdly, the AERMOD model was used to simulate the dispersion of the air pollutants from all the project’s activities. AERMOD is an US Environmental Protection Agency’s (US EPA) approved regulatory model. With the use of AERMOD, the resulting ambient air pollution and dust deposition concentrations from the different activities around the site were determined.
Lastly, the dispersion simulation data was utilised, in order to estimate the impact on the area’s air quality. Possible mitigation measures were identified, and their effect on the resulting ambient air pollution concentrations assessed.
1.3 Assumptions and Limitations
The main assumptions and limitations of the study are:
Mining operations were assumed to be twenty-four hours over a 365 day year. It was assumed that the reasonable dust suppression measures will be
incorporated into the normal day to day operation, which include the watering of: o Unpaved haul roads. o Transfer points (material handling). o ROM stockpiles.
Three years (2007-2009) of meteorological data from Pofadder weather station were used in the atmospheric dispersion modelling.

Air Quality Impact Assessment Report for the Proposed Gamsberg Zinc Mine
DDA March 2013 3
The modelling domain was set to 10 km by 10 km, with the mine (the crusher in pit) at the centre.
The main air pollutants assessed were total suspended particulates (TSP) and particulate matter of less than 10 μm in diameter (PM10). Other air pollutants, such as SO2, NOx and CO, released from vehicle exhausts and blasting, were not included in the detailed calculations, as they will be present in relatively small quantities and only have a limited localised impact.
Air Quality Impact Assessment Report for the Proposed Gamsberg Zinc Mine
DDA March 2013 4
2 STUDY AREA AND EMISSION SOURCES
2.1 Study Area
The proposed mine and associated infrastructure is located in the Namakwa District, between the town of Aggeneys and the town of Pofadder. It is approximately 120 km east of Springbok, along the N14 (see Figure 2-1). The proposed site is commonly referred to as Gamsberg, and is characterised by an oval shaped inselberg 220 meters above the surrounding plains. The project area is situated over four properties, which are owned by Black Mountain Mining (Pty) Ltd.
2.2 Area’s Air Quality
The area around the Gamsberg mine is typical of a rural environment, in a semi-desert landscape. An existing zinc, lead, copper and silver mine, operated by Black Mountain, is about 12 km west of the Gamsberg mine. The town of Aggeneys, which was founded to service the existing mine, is about 7 km west of the Gamsberg mine.
Currently, the primary air emission sources in the general area include the following:
• Fugitive dust sources;
• Mining operations in the region;
• Dust and PM10 re-entrainment from vehicular traffic on local tarred and unpaved roads;
• Vehicle tailpipe emissions;
• Household fuel combustion; and
• Agricultural activities.
Based on DDA’s observation, the area’s air quality appears to be generally good and there are no major dust or PM10 sources that have been identified within or around the mining area, other than windblown dust and dust re-entrainment due to traffic on the existing gravel road network.
A baseline air quality study was carried out in 2009 by SRK Consulting (SRK, 2009). Air quality monitoring was performed for the period from June to October 2009. The PM10 concentrations were measured at one location within Aggeneys and the dust fallout, SO2 and NO2 at ten monitoring points within and around the Gamsberg mine concession area (see Figure 2-2).
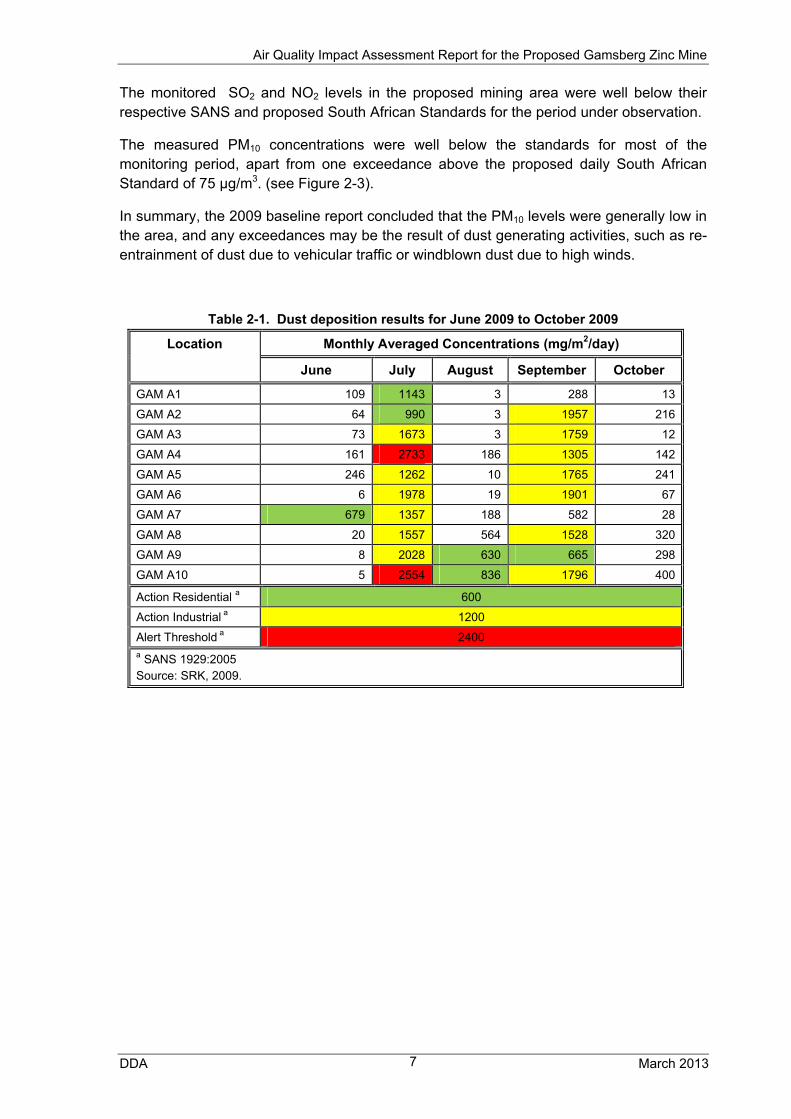
Based on the findings of the report, the dust fallout levels in the area varied significantly during the monitoring months. It was evident that during some months the dust fallout was well below the residential guideline, while during other months, it exceeded the industrial action and alert thresholds (see Table 2-1).

Air Quality Impact Assessment Report for the Proposed Gamsberg Zinc Mine
DDA March 2013 5
Figure 2-1. Locality Map

Air Quality Impact Assessment Report for the Proposed Gamsberg Zinc Mine
DDA March 2013 6
Figure 2-2. Location of Dust and Gas Monitoring Points (SRK, 2009)
Air Quality Impact Assessment Report for the Proposed Gamsberg Zinc Mine
DDA March 2013 7
The monitored SO2 and NO2 levels in the proposed mining area were well below their respective SANS and proposed South African Standards for the period under observation.
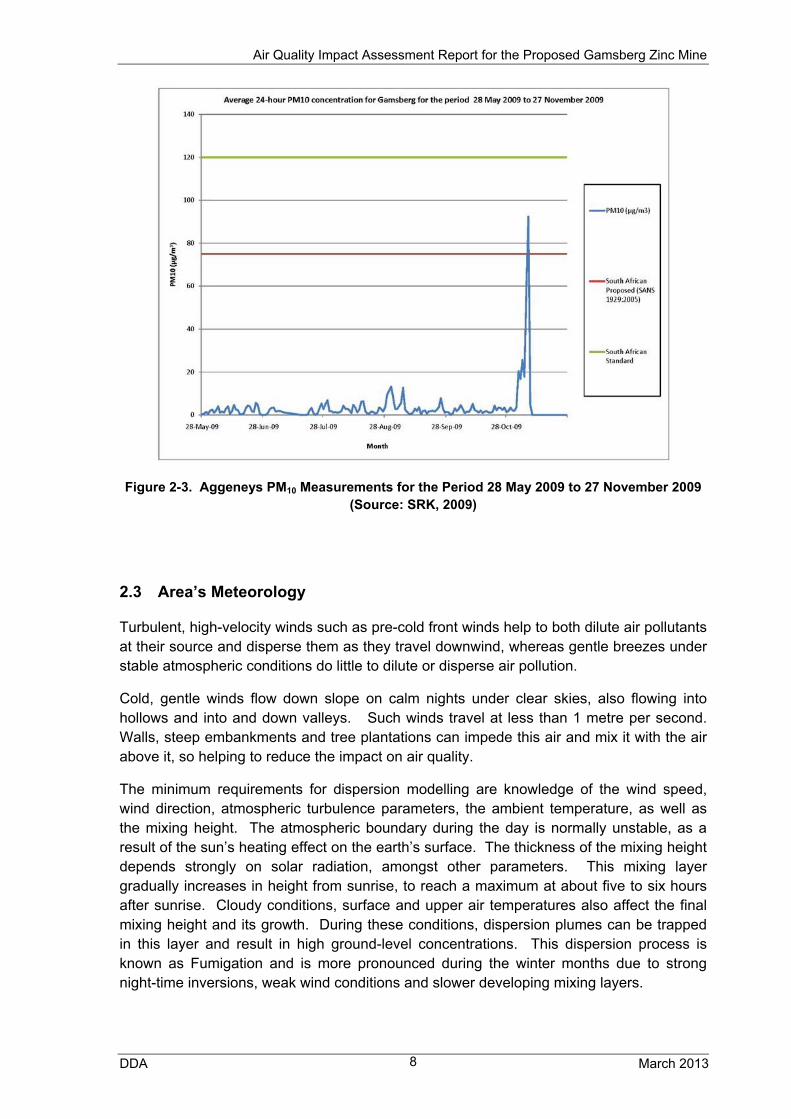
The measured PM10 concentrations were well below the standards for most of the monitoring period, apart from one exceedance above the proposed daily South African Standard of 75 µg/m3. (see Figure 2-3).
In summary, the 2009 baseline report concluded that the PM10 levels were generally low in the area, and any exceedances may be the result of dust generating activities, such as re-entrainment of dust due to vehicular traffic or windblown dust due to high winds.
Table 2-1. Dust deposition results for June 2009 to October 2009
Location Monthly Averaged Concentrations (mg/m2/day)
June July August September October
GAM A1 109 1143 3 288 13
GAM A2 64 990 3 1957 216
GAM A3 73 1673 3 1759 12
GAM A4 161 2733 186 1305 142
GAM A5 246 1262 10 1765 241
GAM A6 6 1978 19 1901 67
GAM A7 679 1357 188 582 28
GAM A8 20 1557 564 1528 320
GAM A9 8 2028 630 665 298
GAM A10 5 2554 836 1796 400
Action Residential a 600
Action Industrial a 1200
Alert Threshold a 2400 a SANS 1929:2005 Source: SRK, 2009.
Air Quality Impact Assessment Report for the Proposed Gamsberg Zinc Mine
DDA March 2013 8
Figure 2-3. Aggeneys PM10 Measurements for the Period 28 May 2009 to 27 November 2009 (Source: SRK, 2009)
2.3 Area’s Meteorology
Turbulent, high-velocity winds such as pre-cold front winds help to both dilute air pollutants at their source and disperse them as they travel downwind, whereas gentle breezes under stable atmospheric conditions do little to dilute or disperse air pollution.
Cold, gentle winds flow down slope on calm nights under clear skies, also flowing into hollows and into and down valleys. Such winds travel at less than 1 metre per second. Walls, steep embankments and tree plantations can impede this air and mix it with the air above it, so helping to reduce the impact on air quality.
The minimum requirements for dispersion modelling are knowledge of the wind speed, wind direction, atmospheric turbulence parameters, the ambient temperature, as well as the mixing height. The atmospheric boundary during the day is normally unstable, as a result of the sun’s heating effect on the earth’s surface. The thickness of the mixing height depends strongly on solar radiation, amongst other parameters. This mixing layer gradually increases in height from sunrise, to reach a maximum at about five to six hours after sunrise. Cloudy conditions, surface and upper air temperatures also affect the final mixing height and its growth. During these conditions, dispersion plumes can be trapped in this layer and result in high ground-level concentrations. This dispersion process is known as Fumigation and is more pronounced during the winter months due to strong night-time inversions, weak wind conditions and slower developing mixing layers.
Air Quality Impact Assessment Report for the Proposed Gamsberg Zinc Mine
DDA March 2013 9
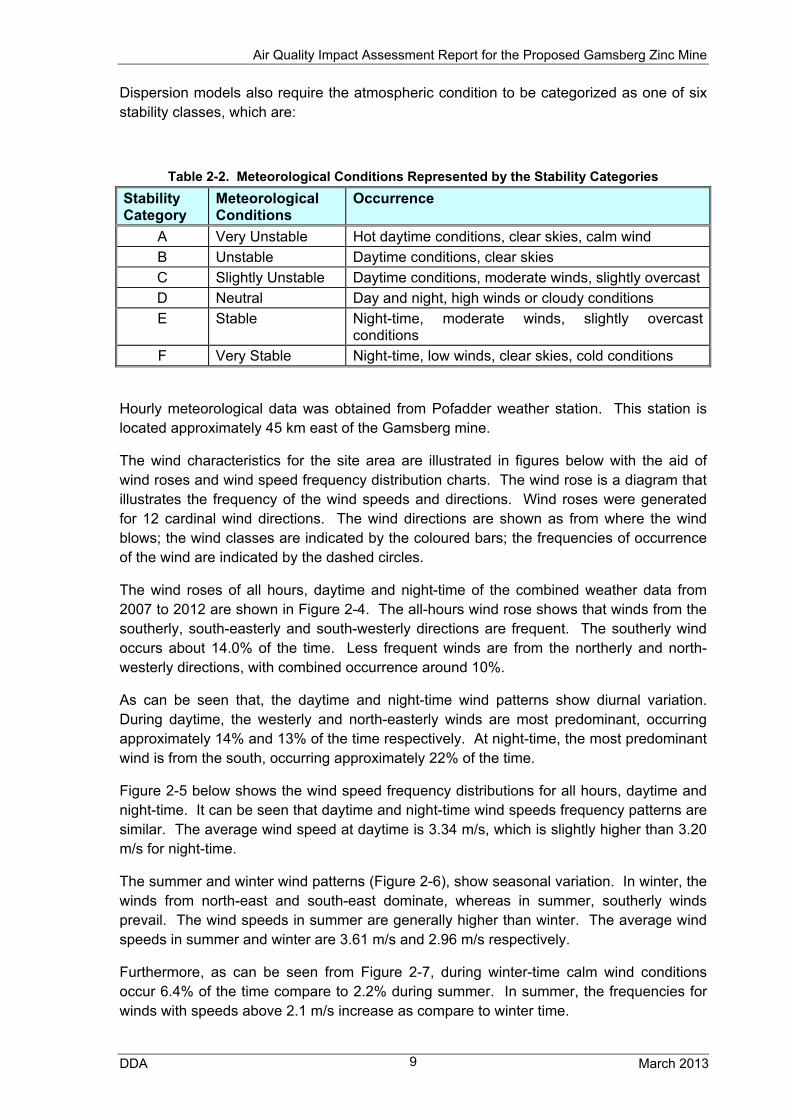
Dispersion models also require the atmospheric condition to be categorized as one of six stability classes, which are:
Table 2-2. Meteorological Conditions Represented by the Stability Categories
Stability Category
Meteorological Conditions
Occurrence
A Very Unstable Hot daytime conditions, clear skies, calm wind
B Unstable Daytime conditions, clear skies
C Slightly Unstable Daytime conditions, moderate winds, slightly overcast
D Neutral Day and night, high winds or cloudy conditions
E Stable Night-time, moderate winds, slightly overcast conditions
F Very Stable Night-time, low winds, clear skies, cold conditions
Hourly meteorological data was obtained from Pofadder weather station. This station is located approximately 45 km east of the Gamsberg mine.
The wind characteristics for the site area are illustrated in figures below with the aid of wind roses and wind speed frequency distribution charts. The wind rose is a diagram that illustrates the frequency of the wind speeds and directions. Wind roses were generated for 12 cardinal wind directions. The wind directions are shown as from where the wind blows; the wind classes are indicated by the coloured bars; the frequencies of occurrence of the wind are indicated by the dashed circles.
The wind roses of all hours, daytime and night-time of the combined weather data from 2007 to 2012 are shown in Figure 2-4. The all-hours wind rose shows that winds from the southerly, south-easterly and south-westerly directions are frequent. The southerly wind occurs about 14.0% of the time. Less frequent winds are from the northerly and north-westerly directions, with combined occurrence around 10%.
As can be seen that, the daytime and night-time wind patterns show diurnal variation. During daytime, the westerly and north-easterly winds are most predominant, occurring approximately 14% and 13% of the time respectively. At night-time, the most predominant wind is from the south, occurring approximately 22% of the time.
Figure 2-5 below shows the wind speed frequency distributions for all hours, daytime and night-time. It can be seen that daytime and night-time wind speeds frequency patterns are similar. The average wind speed at daytime is 3.34 m/s, which is slightly higher than 3.20 m/s for night-time.
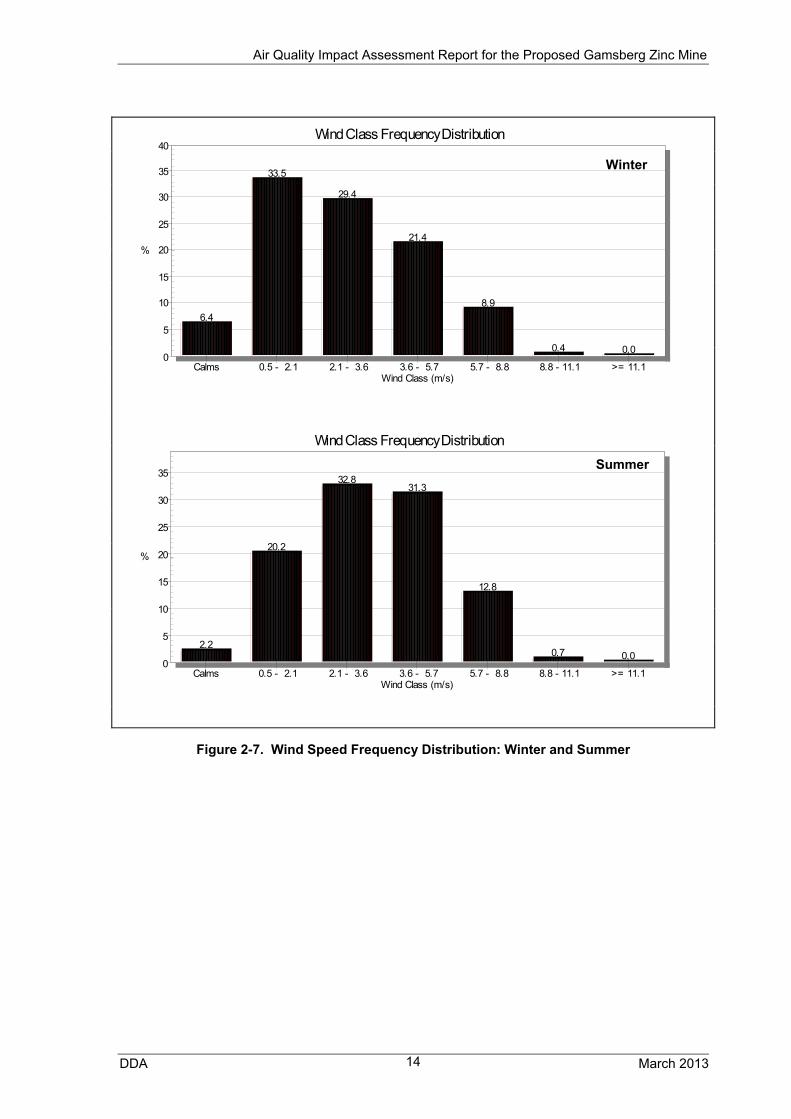
The summer and winter wind patterns (Figure 2-6), show seasonal variation. In winter, the winds from north-east and south-east dominate, whereas in summer, southerly winds prevail. The wind speeds in summer are generally higher than winter. The average wind speeds in summer and winter are 3.61 m/s and 2.96 m/s respectively.
Furthermore, as can be seen from Figure 2-7, during winter-time calm wind conditions occur 6.4% of the time compare to 2.2% during summer. In summer, the frequencies for winds with speeds above 2.1 m/s increase as compare to winter time.

Air Quality Impact Assessment Report for the Proposed Gamsberg Zinc Mine
DDA March 2013 10
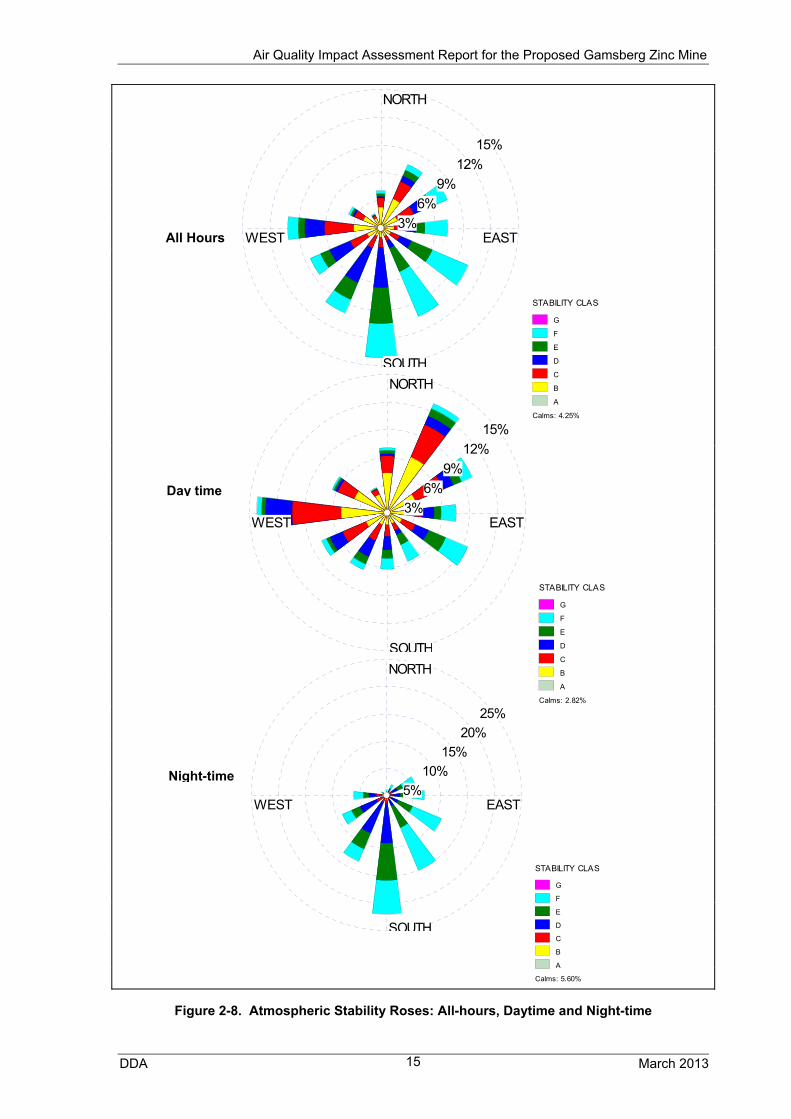
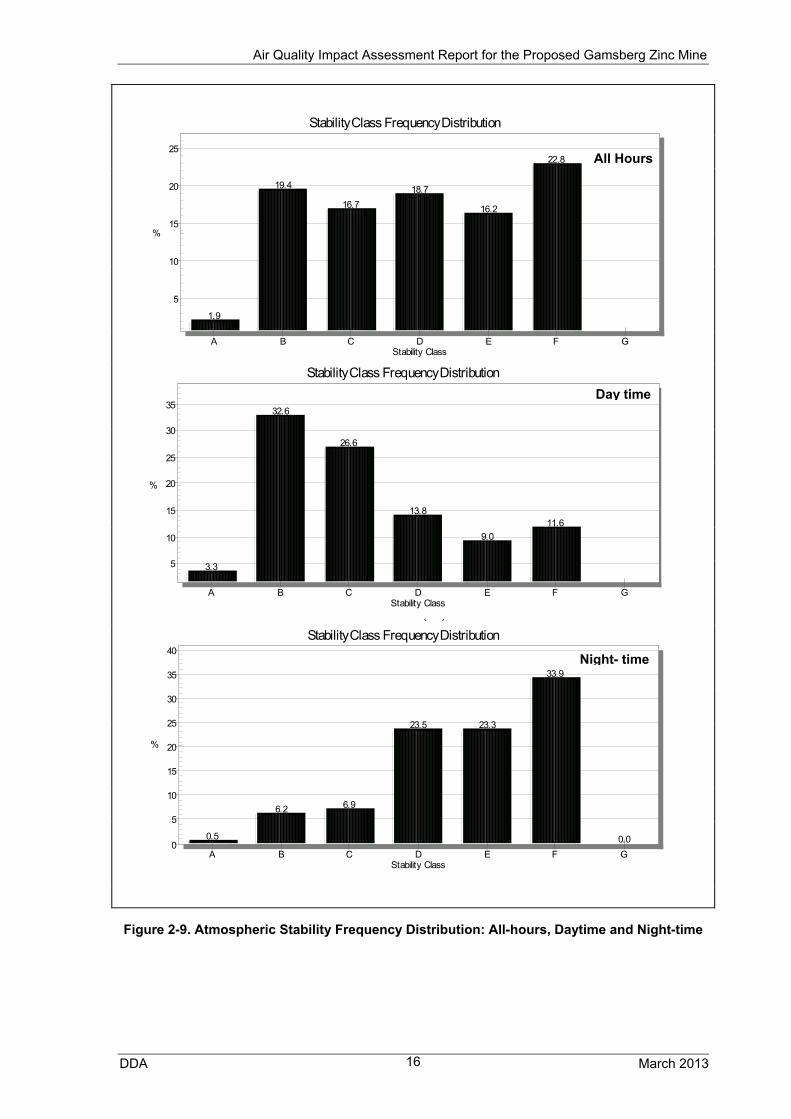
The atmospheric stability category was calculated for the same data period as well, utilising the wind speed and solar radiation method. Figure 2-8 and Figure 2-9 show the stability frequencies for the years 2007 to 2012. The atmospheric condition with the highest frequency was very stable (F), which occurred 22.8% of the time. A unstable atmosphere (B) was the second most frequent atmospheric condition, occurring 19.4% of the time.
From the daytime and night-time analysis, it can be seen that during night-time the atmospheric conditions are primarily stable (E) to very stable (F), which are not conducive to high dispersion potential. The daytime atmospheric conditions are more unstable, thus resulting in a better dilution of air pollutants.
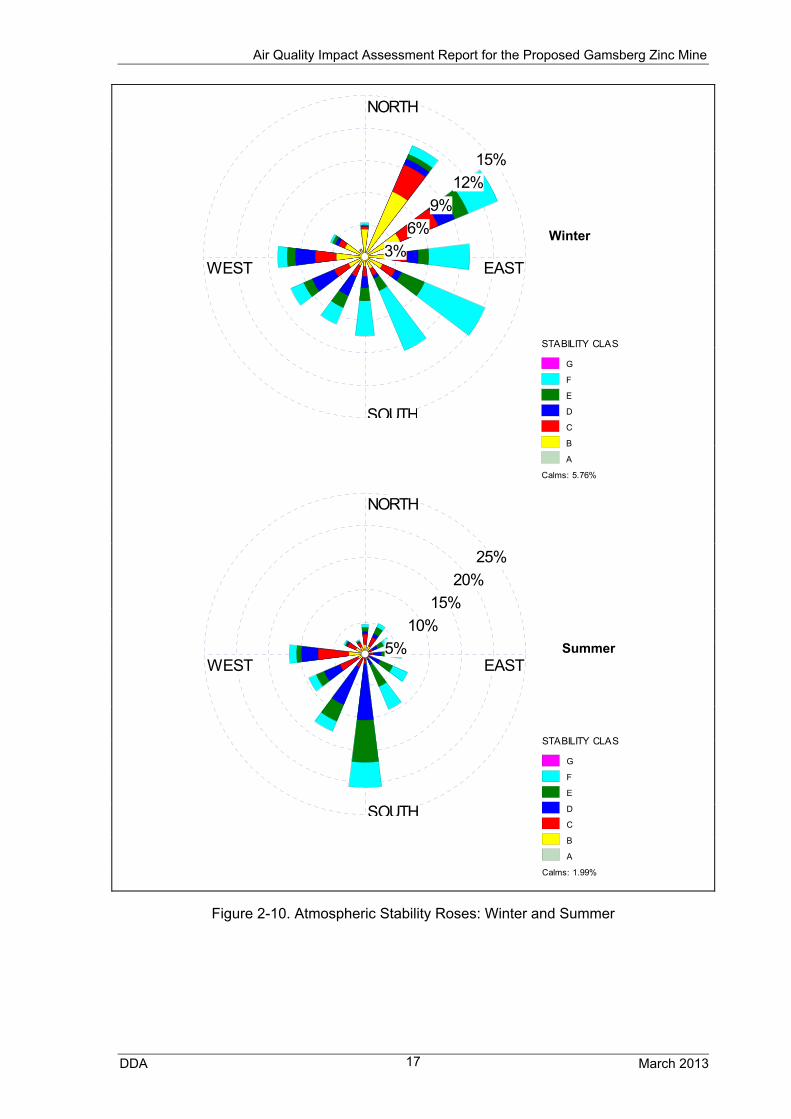
In terms of the winter and summer variations of the atmospheric stability, it is evident that the very stable (F) condition during winter time is predominant, followed by unstable (B) condition. During summer, the dominant atmospheric condition is neutral (D) (see Figure 2-10 and Figure 2-11).

Air Quality Impact Assessment Report for the Proposed Gamsberg Zinc Mine
DDA March 2013 11
Figure 2-4. Wind Roses: All-hours, Daytime and Night-time
All Hours
Day time
Night-time
NORTH
SOUTH
WEST EAST5%
10%
15%
20%
25%
WIND SPEED (m/s)
>= 11.1
8.8 - 11.1
5.7 - 8.8
3.6 - 5.7
2.1 - 3.6
0.5 - 2.1
Calms: 5.60%
NORTH
SOUTH
WEST EAST3%
6%
9%
12%
15%
WIND SPEED (m/s)
>= 11.1
8.8 - 11.1
5.7 - 8.8
3.6 - 5.7
2.1 - 3.6
0.5 - 2.1
Calms: 2.82%
NORTH
SOUTH
WEST EAST3%
6%
9%
12%
15%
WIND SPEED (m/s)
>= 11.1
8.8 - 11.1
5.7 - 8.8
3.6 - 5.7
2.1 - 3.6
0.5 - 2.1
Calms: 4.25%

Air Quality Impact Assessment Report for the Proposed Gamsberg Zinc Mine
DDA March 2013 12
3.0
23.6
33.9
29.8
9.4
0.3 0.00
5
10
15
20
25
30
35
40
%
Wind Class Frequency Distribution
Wind Class (m/s)Calms 0.5 - 2.1 2.1 - 3.6 3.6 - 5.7 5.7 - 8.8 8.8 - 11.1 >= 11.1
5.7
30.6
27.9
23.2
11.6
0.8 0.00
5
10
15
20
25
30
35
%
Wind Class Frequency Distribution
Wind Class (m/s)Calms 0.5 - 2.1 2.1 - 3.6 3.6 - 5.7 5.7 - 8.8 8.8 - 11.1 >= 11.1
St bilit Cl F Di t ib ti
Figure 2-5. Wind Speed Frequency Distribution: All-hours, Daytime and Night-time
4.4
27.1
30.9
26.5
10.5
0.6 0.00
5
10
15
20
25
30
35
%
Wind Class Frequency Distribution
Wind Class (m/s)Calms 0.5 - 2.1 2.1 - 3.6 3.6 - 5.7 5.7 - 8.8 8.8 - 11.1 >= 11.1
All Hours
Night- time
Day time

Air Quality Impact Assessment Report for the Proposed Gamsberg Zinc Mine
DDA March 2013 13
Figure 2-6. Wind Roses: Winter and Summer
NORTH
SOUTH
WEST EAST3%
6%
9%
12%
15%
WIND SPEED (m/s)
>= 11.1
8.8 - 11.1
5.7 - 8.8
3.6 - 5.7
2.1 - 3.6
0.5 - 2.1
Calms: 5.76%
NORTH
SOUTH
WEST EAST5%
10%
15%
20%
25%
WIND SPEED (m/s)
>= 11.1
8.8 - 11.1
5.7 - 8.8
3.6 - 5.7
2.1 - 3.6
0.5 - 2.1
Calms: 1.99%
Winter
Summer
Air Quality Impact Assessment Report for the Proposed Gamsberg Zinc Mine
DDA March 2013 14
6.4
33.5
29.4
21.4
8.9
0.4 0.00
5
10
15
20
25
30
35
40
%
Wind Class Frequency Distribution
Wind Class (m/s)Calms 0.5 - 2.1 2.1 - 3.6 3.6 - 5.7 5.7 - 8.8 8.8 - 11.1 >= 11.1
Figure 2-7. Wind Speed Frequency Distribution: Winter and Summer
2.2
20.2
32.831.3
12.8
0.7 0.00
5
10
15
20
25
30
35
%
Wind Class Frequency Distribution
Wind Class (m/s)Calms 0.5 - 2.1 2.1 - 3.6 3.6 - 5.7 5.7 - 8.8 8.8 - 11.1 >= 11.1
Winter
Summer
Air Quality Impact Assessment Report for the Proposed Gamsberg Zinc Mine
DDA March 2013 15
Figure 2-8. Atmospheric Stability Roses: All-hours, Daytime and Night-time
All Hours
Day time
Night-time
NORTH
SOUTH
WEST EAST3%
6%
9%
12%
15%
STABILITY CLASS
G
F
E
D
C
B
A
Calms: 4.25%
NORTH
SOUTH
WEST EAST3%
6%
9%
12%
15%
STABILITY CLASS
G
F
E
D
C
B
A
Calms: 2.82%
NORTH
SOUTH
WEST EAST5%
10%
15%
20%
25%
STABILITY CLASS
G
F
E
D
C
B
A
Calms: 5.60%
Air Quality Impact Assessment Report for the Proposed Gamsberg Zinc Mine
DDA March 2013 16
Figure 2-9. Atmospheric Stability Frequency Distribution: All-hours, Daytime and Night-time
( )
0.5
6.2 6.9
23.5 23.3
33.9
0.00
5
10
15
20
25
30
35
40
%
Stability Class Frequency Distribution
Stability ClassA B C D E F G
3.3
32.6
26.6
13.8
9.0
11.6
5
10
15
20
25
30
35
%
Stability Class Frequency Distribution
Stability ClassA B C D E F G
1.9
19.4
16.7
18.7
16.2
22.8
5
10
15
20
25
%
Stability Class Frequency Distribution
Stability ClassA B C D E F G
All Hours
Night- time
Day time
Air Quality Impact Assessment Report for the Proposed Gamsberg Zinc Mine
DDA March 2013 17
Figure 2-10. Atmospheric Stability Roses: Winter and Summer
NORTH
SOUTH
WEST EAST3%
6%
9%
12%
15%
STABILITY CLASS
G
F
E
D
C
B
A
Calms: 5.76%
Winter
Summer
NORTH
SOUTH
WEST EAST5%
10%
15%
20%
25%
STABILITY CLASS
G
F
E
D
C
B
A
Calms: 1.99%

Air Quality Impact Assessment Report for the Proposed Gamsberg Zinc Mine
DDA March 2013 18
Figure 2-11. Atmospheric Stability Frequency Distribution: Winter and Summer
2.4 Air Pollution Emission Sources at Gamsberg Mine
The proposed mine will produce ore from mining the deposits by open pit method with concurrent rehabilitation. The general sequence of conventional open pit mining will be as follows:
Strip Overburden: The waste material overlying the ore will be removed by digging, pushing, scraping, drilling and blasting, followed by loading into the haul trucks for transportation to the overburden dump or as backfill for the portion being rehabilitated.
Ore Production: The ore will be drilled, blasted, loaded and hauled to the primary crusher at the mine. The ore will then be crushed and transferred to the processing plant. The ore will be milled and concentrate will be extracted from the milled ore through a unit process of flotation. The concentrate will be dewatered to a maximum 15% moisture content for
( )
0.2
12.9
17.9
26.2
21.6
18.9
0.00
5
10
15
20
25
30
%
Stability Class Frequency Distribution
Stability ClassA B C D E F G
2.8
24.4
16.5
11.6 10.9
27.4
5
10
15
20
25
30
%
Stability Class Frequency Distribution
Stability ClassA B C D E F G
Winter
Summer
Air Quality Impact Assessment Report for the Proposed Gamsberg Zinc Mine
DDA March 2013 19
export. Residues produced during the concentrating process will be disposed into a tailings dam.
Rehabilitation: Mining and environmental legislation will require the disturbed ground to be rehabilitated as close to its original form. The rehabilitation has been integrated into the mining sequence to ensure the total disturbed area is minimized.
The Gamsberg mine infrastructure will comprise the following:
Processing plant and related infrastructure,
Buildings (admin, offices, change house, stores, workshops etc.);
Haul, maintenance and access roads,
Opencast mine development,
Waste rock dump,
Tailings storage facility,
Diesel storage tanks,
Water management infrastructure and water supply pipeline,
Water reservoir,
Electricity lines.
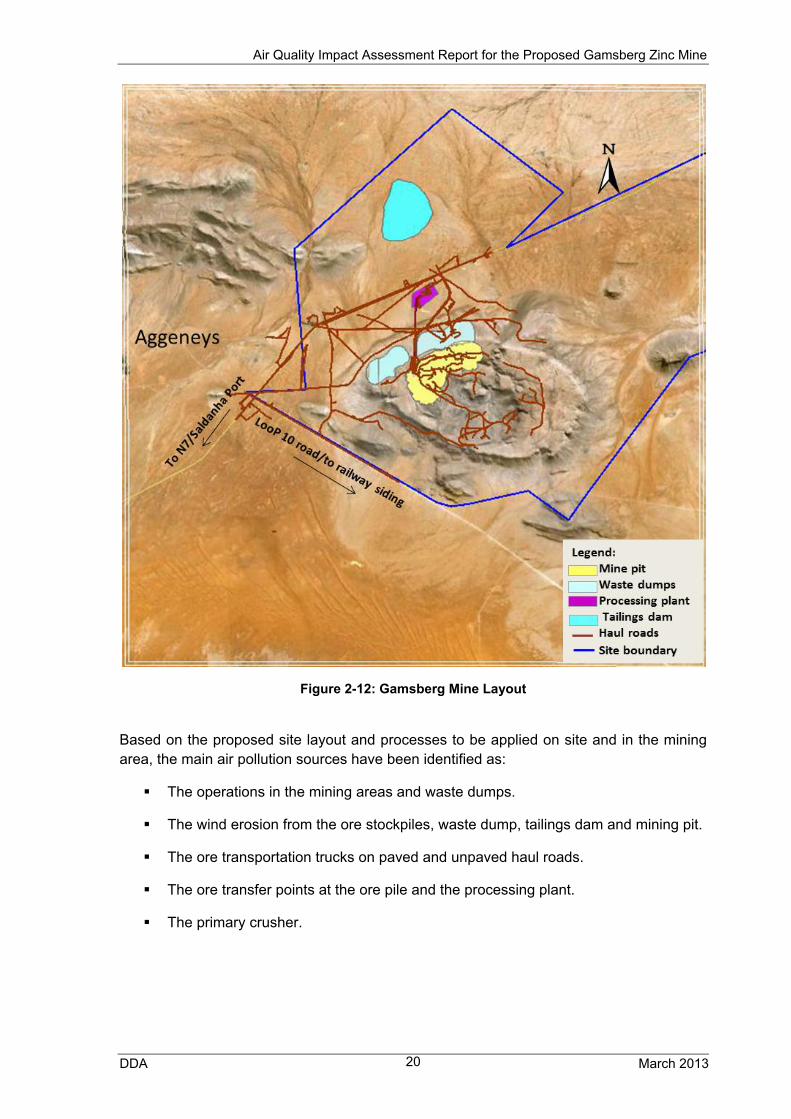
The proposed mine will produce ore from the open pit at a rate of 10 Mtpa and waste rock reaching 90 Mtpa. The plant location, the mining pit and the waste dumps can be seen in Figure 2-12 below.
Air Quality Impact Assessment Report for the Proposed Gamsberg Zinc Mine
DDA March 2013 20
Figure 2-12: Gamsberg Mine Layout
Based on the proposed site layout and processes to be applied on site and in the mining area, the main air pollution sources have been identified as:
The operations in the mining areas and waste dumps.
The wind erosion from the ore stockpiles, waste dump, tailings dam and mining pit.
The ore transportation trucks on paved and unpaved haul roads.
The ore transfer points at the ore pile and the processing plant.
The primary crusher.

Air Quality Impact Assessment Report for the Proposed Gamsberg Zinc Mine
DDA March 2013 21
3 LEGISLATIVE CONTEXT AND HUMAN HEALTH ASSESSMENT CRITERIA
According to the South African Constitution, everyone has the right-
(a) to an environment that is not harmful to their health or well-being; and
(b) to have the environment protected, for the benefit of present and future generations, through reasonable legislative and other measures that-
(i) prevent pollution and ecological degradation;
(ii) promote conservation; and
(iii) secure ecologically sustainable development and use of natural resources while promoting justifiable economic and social development.
The South African legislation and guidelines on environmental management and air quality emission standards, pertaining to inter alia construction and operation activities are:
• Health Act, No 63 of 1977;
• Environmental Conservation Act, No 73 of 1989;
• Constitution of the Republic of South Africa Act, No108 of 1996;
• The National Environmental Management Act, Air Quality Act (NEMAQA) (Act No. 39 of 2004).
• The South African National Standard 1929 of 2005, Ambient Air Quality – Limits for Common Pollutants.
The National Environmental Management: Air Quality Act (Act No. 39 of 2004) outlines in Schedule 2 the South African air quality standards. The Act includes margins of tolerance, compliance time frames and permissible frequencies by which the standards may be exceeded. The South African National Standards (SANS) were established in order to assist the Department of Environmental Affairs and Tourism (DEAT) to develop ambient air quality standards for seven pollutants of concern. These include sulphur dioxide, nitrogen dioxide, carbon monoxide, particulate matter (PM10), ozone, lead and benzene (DEAT, 2006).
3.1 Ambient Air Quality Guidelines
Concentrations of pollutants are measured and/or predicted for a specified averaging period. This period refers to the time over which the concentration is estimated or measured at a specific location. These concentrations are then compared with air quality standards for each of the pollutants. Air quality standards are designed to protect human health and the environment generally. As such, they are concerned with those gases and pollutants perceived to pose a health or environmental risk beyond certain concentrations.

Air Quality Impact Assessment Report for the Proposed Gamsberg Zinc Mine
DDA March 2013 22
The following Table 3-1 shows the South African National Ambient Air Quality Standards and international air quality standards and guidelines adopted by the World Health Organisation, United States Environmental Protection Agency and the European Union.
Table 3-1. Air Pollutant Guideline Concentrations
Pollutant Organisation / Country 1-hr
(μg/m3) 24-hr
(μg/m3) Annual (μg/m3)
Sulphur Dioxide (SO2)
SA Standards (AQA) 350a 125i 50
SANS limits 500b 125 50
WHO 500b 125 50
EU 350k 125h -
US EPA 215c,q
1410d,f - -
Carbon Monoxide (CO)
SA Standards (AQA) 30,000a 10,000e,i -
SANS limits 30,000 10,000e
WHO 30,000 10,000e -
EU - 10,000e -
USEPA 40,000c,f 10,000c,e,f -
Nitrogen Oxides (NO2)
SA Standards (AQA) 200a - 40
EU 200j - 40
US EPA 200c,p - 107c,d
PM10
SA Standards (AQA) - 120n,i 50n
75o,i 40o
SANS limits - 75 40
EU - 50l 40
US EPA - 35c,d,e -
a Not to be exceeded more than 88 times per year. b 10-minute average. c Primary standards, which provide public health protection. d Secondary standards, which provide public welfare protection e Guideline limit for an 8-hour exposure. f Not to be exceeded more than once per year g Not to be exceeded more than once per year on average over 3 years. h Not to be exceeded more than 3 times per year. i Not to be exceeded more than 4 times per year. j Not to be exceeded more than 18 times per year. k Not to be exceeded more than 24 times per year. l Not to be exceeded more than 35 times per year. m Not to be exceeded more than 11 times per year. n Applicable immediately to 31 December 2014. o Applicable from 1 January 2015. p 98th percentile, averaged over 3 years q 99th percentile of 1-hr daily maximum concentrations, averaged over 3 years. r Annual arithmetic average. s Averaged over 3-hour period.
Air Quality Impact Assessment Report for the Proposed Gamsberg Zinc Mine
DDA March 2013 23
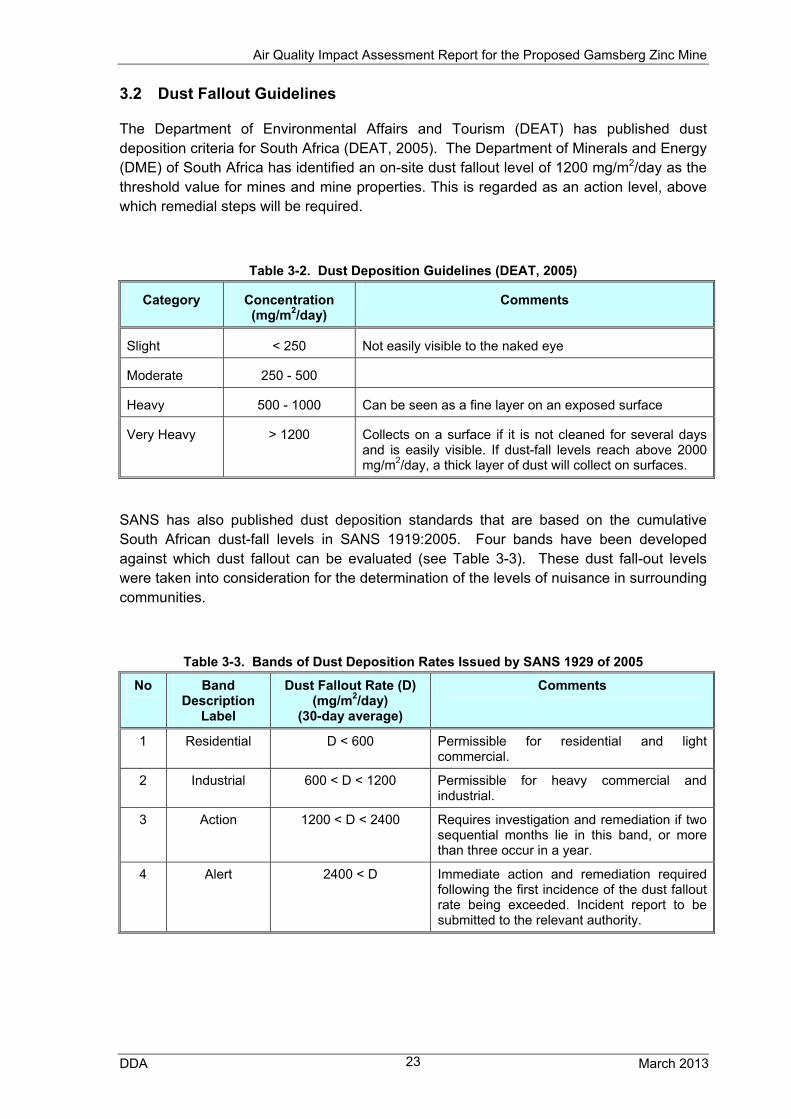
3.2 Dust Fallout Guidelines
The Department of Environmental Affairs and Tourism (DEAT) has published dust deposition criteria for South Africa (DEAT, 2005). The Department of Minerals and Energy (DME) of South Africa has identified an on-site dust fallout level of 1200 mg/m2/day as the threshold value for mines and mine properties. This is regarded as an action level, above which remedial steps will be required.
Table 3-2. Dust Deposition Guidelines (DEAT, 2005)
Category Concentration (mg/m2/day)
Comments
Slight < 250 Not easily visible to the naked eye
Moderate 250 - 500
Heavy 500 - 1000 Can be seen as a fine layer on an exposed surface
Very Heavy > 1200 Collects on a surface if it is not cleaned for several days and is easily visible. If dust-fall levels reach above 2000 mg/m2/day, a thick layer of dust will collect on surfaces.
SANS has also published dust deposition standards that are based on the cumulative South African dust-fall levels in SANS 1919:2005. Four bands have been developed against which dust fallout can be evaluated (see Table 3-3). These dust fall-out levels were taken into consideration for the determination of the levels of nuisance in surrounding communities.
Table 3-3. Bands of Dust Deposition Rates Issued by SANS 1929 of 2005
No
Band Description
Label
Dust Fallout Rate (D) (mg/m2/day)
(30-day average)
Comments
1 Residential D < 600 Permissible for residential and light commercial.
2 Industrial 600 < D < 1200 Permissible for heavy commercial and industrial.
3 Action 1200 < D < 2400 Requires investigation and remediation if two sequential months lie in this band, or more than three occur in a year.
4 Alert 2400 < D Immediate action and remediation required following the first incidence of the dust fallout rate being exceeded. Incident report to be submitted to the relevant authority.

Air Quality Impact Assessment Report for the Proposed Gamsberg Zinc Mine
DDA March 2013 24
4 EMISSIONS INVENTORY
A technically defensible emissions inventory serves as the foundation for a sound air quality assessment study. Formulation of appropriate control strategies requires a reliable base of quality emission estimates.
The air pollutants included in this emissions inventory were total suspended particulates (TSP) and PM10, i.e. particulate matter smaller than 10 µm in aerodynamic diameter.
Air pollutants released from vehicle exhausts and blasting were considered to have only a localised impact, i.e. in and around the mine area. As such, their air quality impact at communities and sensitive receptors was considered to be insignificant, and therefore their emissions were not included in the detailed dispersion modelling.
4.1 Construction Phase
The construction phase of the project is anticipated to last for a period of between approximately 36 months and 42 months. The construction phase will comprise site preparation and construction of mine-related infrastructures. A construction camp, which includes an office complex, workshops, storage, etc. will be established during the construction phase.
Detailed construction activities are not known at this stage. However, the construction phase will normally involve land clearing, topsoil removal, road grading, bulldozing, material loading and hauling, stockpiling, etc. Large equipment expected to be utilised during the construction at the Gamsberg mine are:
Dump trucks
Front end loaders
Shovels
Concrete batch plant
Excavators
Road roller
Depending on the daily specific construction activities, dust emissions during the construction phase may vary significantly from day to day. Since the sequence and level of activities during construction are not known at this stage of the project, the emissions and impact will be assessed qualitatively.
In general, it is known that the emissions from the construction phase are normally much lower than those during the operational phase. The construction phase emission impact is expected to be short-term and of local impact.
Air Quality Impact Assessment Report for the Proposed Gamsberg Zinc Mine
DDA March 2013 25
Good practice mitigation measures are recommended to be implemented to minimise emission quantities during construction. The general dust suppression measures include:
Water spraying:
o During materials handling and transfer operations.
o On unpaved roads.
o During earthmoving operations.
Speed control for vehicles travelling on unpaved roads.
Early re-vegetation around open/exposed areas.
4.2 Operational Phase
In practice, dust suppression measures are always applied in the mining industry. The mining engineers have indicated that the following measures will be applied as part of the normal day to day operation:
The watering of:
Unpaved haul roads Transfer points at conveyor belts ROM stockpiles
Emissions during the operational phase of the project were estimated in the section below, based on the above normal operating conditions. Unmitigated emissions were not included in the present study.
The air pollution emissions during operation were the emissions from the ore and waste handling operations, the dust re-suspension due to vehicle movements on haul roads, the excavations and site preparation, as well as other ore processing operations.
4.2.1 Schedule of Plant Operation
The Gamsberg mine will produce ore from the open pit at a rate of 10 Mtpa and waste rock of approximately 90 Mtpa, with a life of mine of approximately 17 years.
For the model set-up, the ground contours of the entire area were utilised as input. The mining sections, the ore loading and offloading, stockpiling, waste dumps and processing infrastructure were set up in the model at the appropriate locations. The mining infrastructure layouts, as well as the mining and waste dump locations were supplied by the client. The haul road alignments from the mining sections and waste dumps were also provided.
The main dust and air pollution sources of the Gamsberg mine are:

Air Quality Impact Assessment Report for the Proposed Gamsberg Zinc Mine
DDA March 2013 26
• The mining activities at the open pits.
• Equipment operating within the open pit areas.
• The loading of the haul trucks with ore and waste.
• The haul trucks to the crusher.
• The offloading of the trucks at the crusher.
• The primary crusher.
• The haul trucks to the waste dumps.
• The dumping of waste from the mining operations.
• The ore and concentrate stock piles.
4.2.2 Dust and Suspended Particulate Matter Emissions
The main dust emitted during the operational phase is from the vehicle movements on unpaved roads, the aggregate handling and storage piles, the operations of the excavators, graders, truck loading and offloading, as well as wind erosion. All these sources were included in the present emission quantity estimations. The emissions were categorised as PM10 and total suspended particulates (TSP). The PM10 was treated as air pollutant, and the TSP quantities were used for the dust deposition estimations.
Generally, results from different studies indicate that for a mean wind speed of 4.0 m/s, representative of the project site area, particles larger than about 100 µm are likely to settle within 7 to 12 meters from the edge of the road or other points of emission. Particles that are between 30 and 100 µm in diameter are likely to undergo impeded settling. These particles, depending upon the extent of atmospheric turbulence, are likely to settle within a few hundred metres from the road or source. Smaller particles have much slower gravitational settling velocities and are much more likely to have their settling rate retarded by atmospheric turbulence.
For the estimation of the dust generated by the site activities, the following assumptions have been adopted:
The main areas, from which dust is going to be generated, cover the mining face, the ore and waste loading areas, the crusher, the raw material piles, waste piles, the tailings dam and the haul road to the crusher and the waste dump.
The average trip distance for the trucks was assumed to be 3.7 km to the waste dumps and 2.5 km to the primary crusher.
The number of trucks on the haul roads during operation was assumed to be 32.
The waste material moved per day was estimated to be 241,740 tons.
The ore to be processed at the crusher per day was estimated to be 27,400 tons.

Air Quality Impact Assessment Report for the Proposed Gamsberg Zinc Mine
DDA March 2013 27
A 24-hour operational schedule was assumed.
4.2.3 Unpaved Road Emissions
When a vehicle travels an unpaved road, the force of the wheels on the road surface causes particles to be lifted and dropped from the rolling wheels. The road surface is exposed to strong air currents in turbulent shear with the surface, as well as the air wake behind the vehicle. The quantity of dust emissions from a given segment of unpaved road varies linearly with the volume of traffic. The size-specific particulate emissions from an unpaved road, per vehicle km travelled, can be calculated with the use of the equation (4-1) below (EPA, 2006):
p
pWskE ba )365(
)3()12(9.281
(4-1)
Where:
E = Emission factor (g/VKT)
k ,a, b = Empirical constants (see table below) 281.9 = conversion factor from lb/VMT to g/VKT s = percentage of surface material silt content (%) W = mean vehicle weight (Mg) p = number of days with at least 0.254 mm of precipitation per year
The constants k, a, b in the equation above for different particle sizes are shown in table below.
Table 4-1. Constants for Equation 4-1
Constant Industrial Roads (Equation (4-1))
PM-2.5 PM-10 PM-30*
k (lb/VMT) 0.15 1.5 4.9
a 0.9 0.9 0.7
b 0.45 0.45 0.45
* Assumed equivalent to total suspended particulate matter (TSP)
The mean weight of the vehicles using the site and the road network was assumed to be 320 tons. The number of days in a year with at least 0.254 mm of precipitation was 28. The silt content for the various operations was assumed to be 6.9%.
It has been assumed that water spraying will be applied for all the haul roads, the dust suppression efficiency is assumed to be 75% (NPi,2012).
Air Quality Impact Assessment Report for the Proposed Gamsberg Zinc Mine
DDA March 2013 28
4.2.4 Site Preparation and Earth Moving Emissions
During the operating hours of each day the number of heavy vehicles and tip trucks are assumed to be active simultaneously. The TSP emissions due to bulldozing, grading and excavating operations were estimated utilising the following Equation (4-2)(EPA, 1998).
3.1
2.1
)(
)(6.2
M
skETSP
(4-2)
Where: ETSP = TSP emission factor per hour of operation (kg/hr) k = PM10 emission conversion coefficient (0.75)
PM2.5: 0.105 TSP: 1
s = percentage of silt content in material (%) (8.4%) M = material moisture content (8 %)
The loading and offloading of trucks at the working face was also taken into account. For the loading of trucks, the PM10, PM2.5 and TSP emissions were calculated utilising the 0.35, 0.11 and 0.74 factors respectively on the 0.018 kg emission per Mg of material loaded (EPA, 1998). The same factors apply to unloading of trucks on a total kg emission per Mg of material unloaded of 0.001 (EPA, 1998).
During these operations, wind erosion from the affected working area is a source of additional TSP emissions. Assuming that this affected area is approximately 147 ha, these emissions were based on the estimated 0.85 Mg of TSP per hectare per year. The PM10, PM2.5 and TSP fractions of these emissions were also based on the 0.35, 0.11 and 0.74 factors respectively (EPA, 2004).
4.2.5 Aggregate Handling and Storage Piles
The particulate emissions from the ore and waste piles took into account handling of the material and wind erosion of pile surfaces. The emissions depend on the mean wind speed in the area and the material moisture content of the pile, according to the following Equation (4-3) (EPA, 2006b):
4.1
3.1
)2(
)2.2()0016.0(
M
ukE
(4-3)
Where: E = Emission factor per hour of operation (kg/Mg) k = Particle size multiplier (dimensionless)
PM10 fraction: 0.35 PM2.5 fraction: 0.11
Air Quality Impact Assessment Report for the Proposed Gamsberg Zinc Mine
DDA March 2013 29
TSP fraction: 0.74 u = mean wind speed at site (3.2 m/s) M = material moisture content (5 %)
The dust emission due to the pile surface wind erosion was calculated with the following equation (Cowherd et al, 1988).
)15
()235
365(365)
5.1(9.1
fpskETSP
(4-4)
Where: ETSP = TSP emission factor per hour of operation (kg/ha/y) k = Emission coefficient:
PM10 fraction: 0.4 PM2.5 fraction: 0.1 TSP fraction:0.5
s = percentage of silt content in material (6.9%-11%) p = number of days with at least 0.254 mm of precipitation per year (28) f = percentage of time that wind speed is greater than 5.4 m/s (13.1%)
It has been assumed that dust emissions are mitigated at all transfer points via water spraying. A 50 % control efficiency has been assumed (NPi,2012).
4.2.6 Crushing
Crushing operations represent significant dust-generating sources if uncontrolled. Dust fallout in the vicinity of crushers also gives rise to the potential for the re-entrainment of dust emitted by vehicles or by the wind at a later stage. The large percentage of fines in this dust fall material enhances the potential for it to become airborne. The metallic minerals processing section 11.24 of AP42 was used for emission factors on crushing operations. The equations applicable to high moisture ore, i.e. >4% moisture, were used. The emission factor includes emissions from all associated operations at the primary crusher:
Primary crushing (EPA, 1982):
ETSP = 0.01 kg of dust per ton of material crushed
EPM10 = 0.004 kg of dust per ton of material crushed
The material crushed per year was assumed to be 10 million tons of ore.

Air Quality Impact Assessment Report for the Proposed Gamsberg Zinc Mine
DDA March 2013 30
4.3 Emission Quantities
Based on the emission factors and the assumptions in the previous sections, the emission quantities per day during the operation phase are shown in Table 4-2.
Table 4-2. Emission Quantities
Source Category Emissions (kg/d)
PM2.5 PM10 TSP
Mining activities 69.1 330.4 460.1
Crushing 41.1 109.6 274.0
Aggregate handling and storage piles 11.8 37.6 79.5
Haul roads 306.3 3063.4 5,883.3
N14 tar road (modelled length=13.5 km) 54.6 225.5 1,174.9
Loop 10 gravel road (modelled length=15.9 km)
92.4 923.7 3,017.4
Wind erosion 1,141.2 4,564.9 4,970.7
TOTAL 1,716.5 9,255.1 15,860.0
During the operational phase the main contributors to the particulate emissions were the vehicle movements on unpaved roads and wind erosion from exposed areas, such as the mine, the waste dump and the tailings dam.
The above-mentioned emission quantities were apportioned to their respective emission sources and utilised in the dispersion modelling for the operational phase, as presented in the following section.
Air Quality Impact Assessment Report for the Proposed Gamsberg Zinc Mine
DDA March 2013 31
5 DISPERSION SIMULATION
5.1 Introduction
The source configuration and emission quantities from all the sources during the operation phase of the Gamsberg mine, which were included in the emissions inventory, were used as input into the dispersion modelling. The AERMOD model was used for the estimation the contributions of the various sources of pollution to the ambient pollutant concentrations. Hourly meteorological parameters from the Pofadder weather station were utilised for the generation of the meteorological input into the model.
5.2 The AERMOD Model
AERMOD was designed to treat both surface and elevated sources in simple and complex terrains. It is based on a new platform for regulatory steady-state plume modelling. This platform includes air dispersion fundamentally based on planetary boundary layer turbulence structure and scaling.
Special features of AERMOD include its ability to treat the vertical non-homogeneity of the planetary boundary layer, special treatment of surface releases, irregularly-shaped area sources, a three-plume model for the convective boundary layer and limitation of vertical mixing in the stable boundary layer.
Additional details on the AERMOD dispersion algorithms, model characteristics, as well on the AERMET, the meteorological pre-processor, can be found in the description of model formulation and the model’s user guide respectively (US-EPA, 2004a and US-EPA, 2004b).
5.3 Data Input and Set-up of AERMOD
5.3.1 Meteorological Data
Hourly meteorological data was obtained from the Pofadder weather station for the years 2007, 2008 and 2009. In order to determine the worst-case scenarios for the most probable weather combinations and their related dispersion characteristics for the modelling simulation, all the data was combined and analysed in one data pool.
5.3.2 Air Pollution Emission Data
At the top level, the Gamsberg global parameters for AERMOD were specified, such as location, elevation and area characteristics. All the emission sources to be included in the study were spatially allocated.

Air Quality Impact Assessment Report for the Proposed Gamsberg Zinc Mine
DDA March 2013 32
The haul route emission source was divided into smaller segments, in order to capture its exact shape and emission distribution. In this way, a more accurate emission allocation was achieved for the entire haul route.
For the operational phase the stockpiles were allocated individual area sources. The crusher was also treated as a small area source. The dust generation due to dust re-suspension from vehicle movements was treated as a line source in the manner described above. A 24-hour work schedule was assumed for the temporal apportionment of the emissions.
Table 5-1. Operational Emission Sources Used in Dispersion Modelling (g/s-m2)
Source PM10 TSP
ROM pile 1.02E-05 1.71E-05
Waste dump 5.46E-06 7.11E-06
Concentrate stock pile 2.87E-07 6.07E-07
Mine 5.56E-06 5.02E-06
Crusher 3.75E-04 9.28E-04
Tailings dam 8.19E-06 1.02E-05
N14 road: from the processing plant to Loop 10 road
1.55E-05 8.06E-05
N14 road: from Loop 10 road to Springbok 7.74E-06 4.03E-05
Loop 10 road (gravel) 4.48E-05 1.46E-04
Haul roads: ore and waste 2.18E-04 1.05E-04
Haul roads: ore to crusher 2.22E-05 4.26E-05
Haul roads to waste dump 1.96E-04 3.76E-04
The model was set up to capture the worst-case scenario that could be generated in the area of the project site. A receptor network was developed around the mining sections and along the haul road to the waste dumps and crusher, in order to determine the concentration isopleths for the extent of the route and the receptor locations.
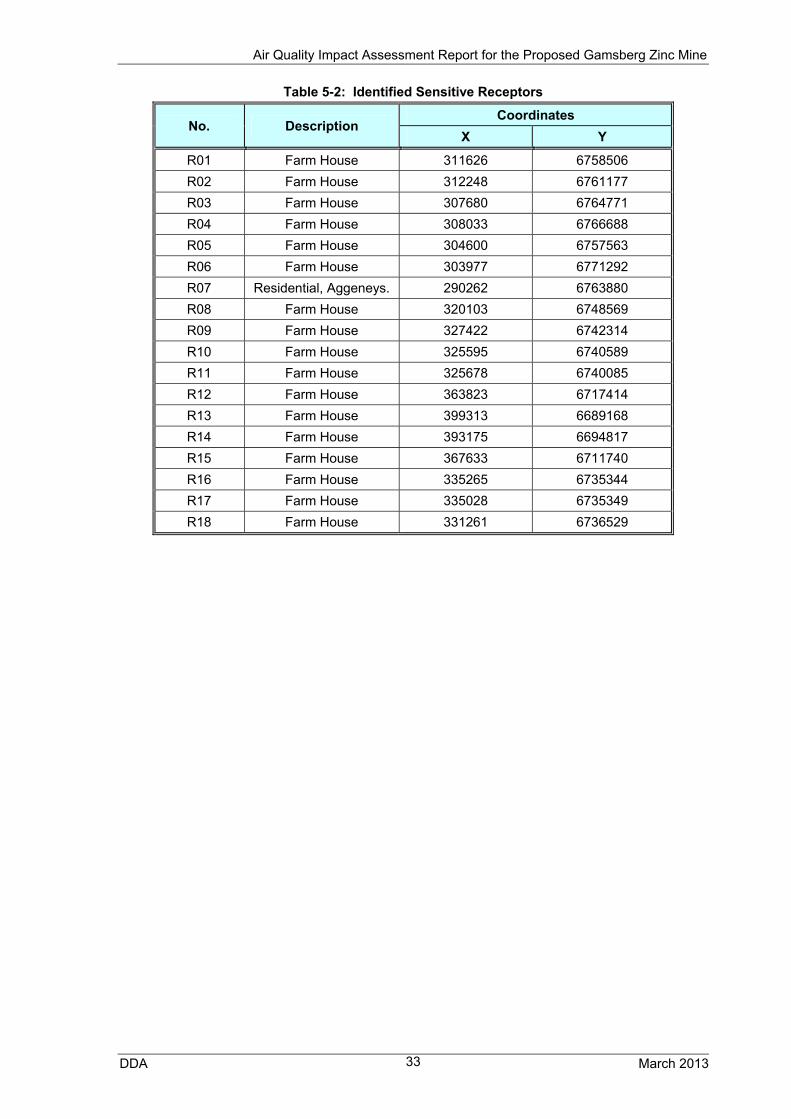
The ambient concentrations were also determined at discrete receptors positioned at the various farmhouses within and around the project boundary. These have been identified and are listed in the following Table 5-2. The receptors around the Gamsberg mine can be seen in Figure 5-1 further below. It should be noted that the receptors along the Loop 10 road (R08 to R18) are not shown in the above-mentioned figure.
Air Quality Impact Assessment Report for the Proposed Gamsberg Zinc Mine
DDA March 2013 33
Table 5-2: Identified Sensitive Receptors
No. Description Coordinates
X Y
R01 Farm House 311626 6758506
R02 Farm House 312248 6761177
R03 Farm House 307680 6764771
R04 Farm House 308033 6766688
R05 Farm House 304600 6757563
R06 Farm House 303977 6771292
R07 Residential, Aggeneys. 290262 6763880
R08 Farm House 320103 6748569
R09 Farm House 327422 6742314
R10 Farm House 325595 6740589
R11 Farm House 325678 6740085
R12 Farm House 363823 6717414
R13 Farm House 399313 6689168
R14 Farm House 393175 6694817
R15 Farm House 367633 6711740
R16 Farm House 335265 6735344
R17 Farm House 335028 6735349
R18 Farm House 331261 6736529
Air Quality Impact Assessment Report for the Proposed Gamsberg Zinc Mine
DDA March 2013 34
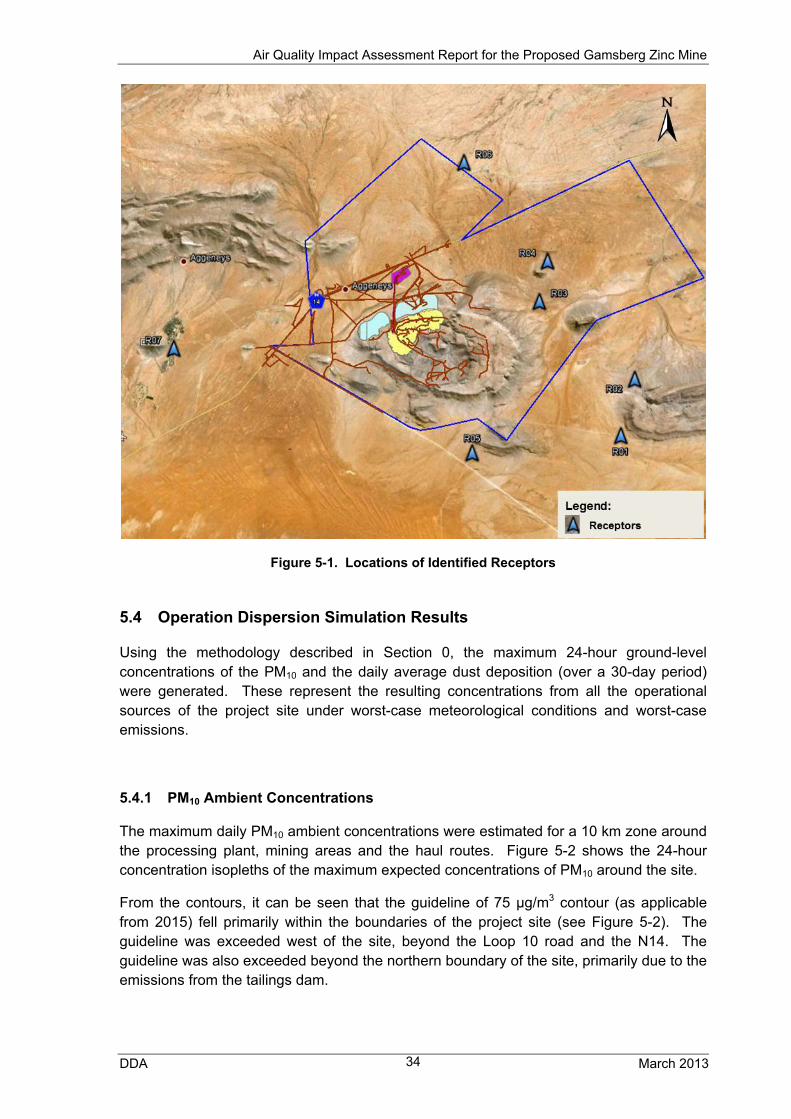
Figure 5-1. Locations of Identified Receptors
5.4 Operation Dispersion Simulation Results
Using the methodology described in Section 0, the maximum 24-hour ground-level concentrations of the PM10 and the daily average dust deposition (over a 30-day period) were generated. These represent the resulting concentrations from all the operational sources of the project site under worst-case meteorological conditions and worst-case emissions.
5.4.1 PM10 Ambient Concentrations
The maximum daily PM10 ambient concentrations were estimated for a 10 km zone around the processing plant, mining areas and the haul routes. Figure 5-2 shows the 24-hour concentration isopleths of the maximum expected concentrations of PM10 around the site.
From the contours, it can be seen that the guideline of 75 μg/m3 contour (as applicable from 2015) fell primarily within the boundaries of the project site (see Figure 5-2). The guideline was exceeded west of the site, beyond the Loop 10 road and the N14. The guideline was also exceeded beyond the northern boundary of the site, primarily due to the emissions from the tailings dam.

Air Quality Impact Assessment Report for the Proposed Gamsberg Zinc Mine
DDA March 2013 35
The 75 μg/m3 contour extended about 2.5 km south-west of the Loop 10 road, and approximately 1 km north-west of the N14.
Figure 5-3 shows the average number of the PM10 24-hr guideline exceedances per year over the three years of metrological data modelled. The SA guideline of 75 µg/m3 was exceeded more than 4 times a year at the mine, in close proximity to the N14 and the Loop 10 road.
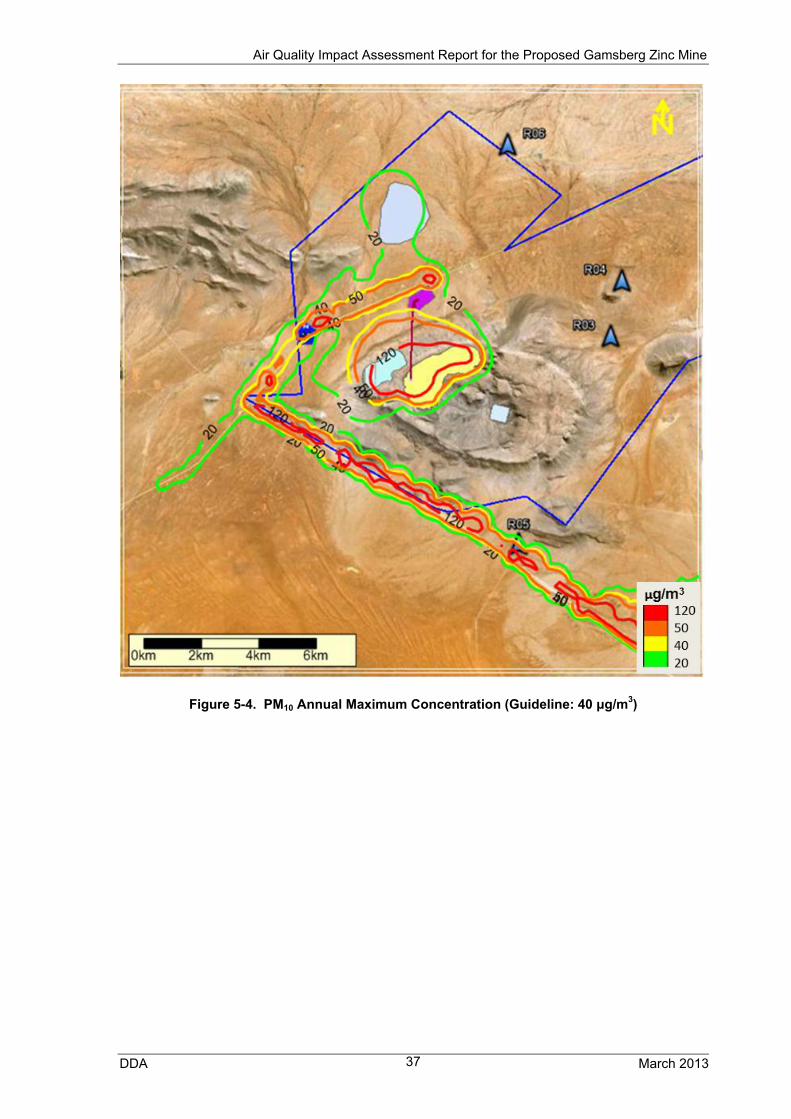
The predicted PM10 annual maximum concentrations are shown in Figure 5-4. The annual guideline of 40 μg/m3 (as applicable from 2015) was exceeded at the mining area and the access roads. The exceedances occur approximately between 200 m and 500 m around the N14, and approximately between 500 m and 1 km around the Loop 10 road.
Figure 5-2. Maximum 24-Hour PM10 Concentrations (Guideline 75 μg/m3)

Air Quality Impact Assessment Report for the Proposed Gamsberg Zinc Mine
DDA March 2013 36
Figure 5-3. PM10 24-hr Guideline Exceedances Per Year (Guideline 75 μg/m3)
Air Quality Impact Assessment Report for the Proposed Gamsberg Zinc Mine
DDA March 2013 37
Figure 5-4. PM10 Annual Maximum Concentration (Guideline: 40 μg/m3)
Air Quality Impact Assessment Report for the Proposed Gamsberg Zinc Mine
DDA March 2013 38
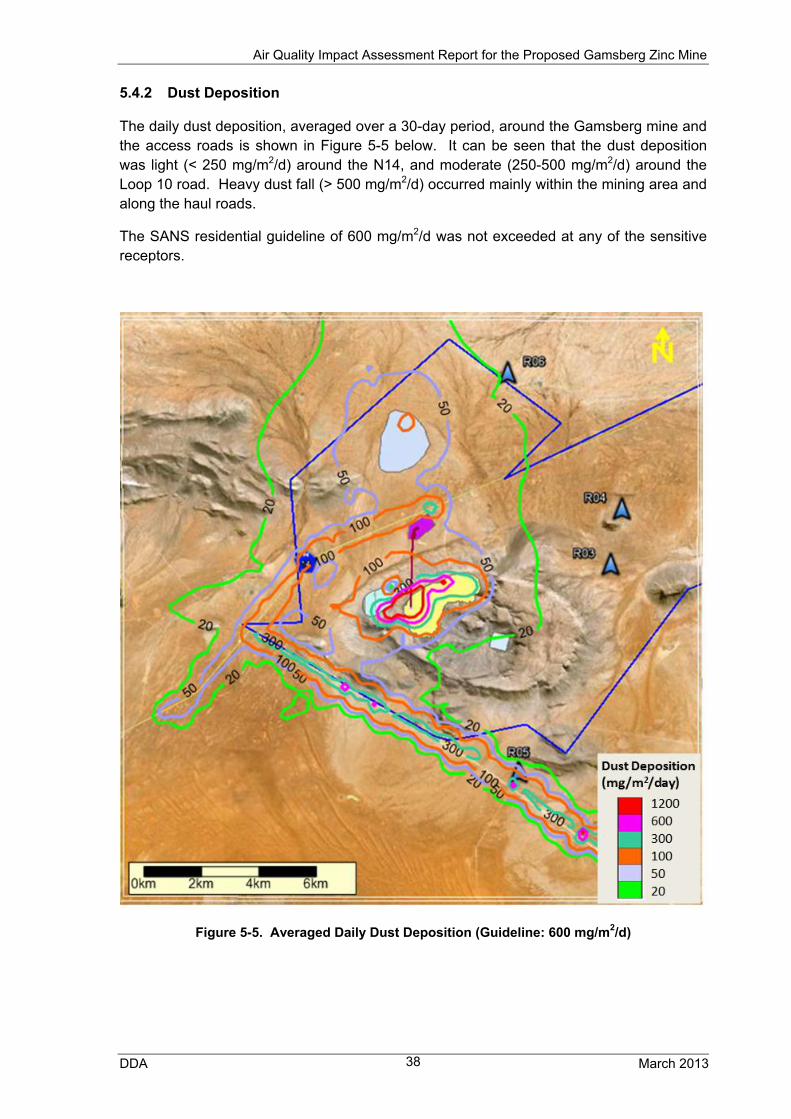
5.4.2 Dust Deposition
The daily dust deposition, averaged over a 30-day period, around the Gamsberg mine and the access roads is shown in Figure 5-5 below. It can be seen that the dust deposition was light (< 250 mg/m2/d) around the N14, and moderate (250-500 mg/m2/d) around the Loop 10 road. Heavy dust fall (> 500 mg/m2/d) occurred mainly within the mining area and along the haul roads.
The SANS residential guideline of 600 mg/m2/d was not exceeded at any of the sensitive receptors.
Figure 5-5. Averaged Daily Dust Deposition (Guideline: 600 mg/m2/d)

Air Quality Impact Assessment Report for the Proposed Gamsberg Zinc Mine
DDA March 2013 39
5.4.3 Modelled Concentrations at Sensitive Receptors
Table 5-3 below shows the modelled concentrations at the sensitive receptors around the Gamsberg mine. It can be seen that the maximum 24-hr PM10 concentration at receptors R04 and R05 exceeded the SA guideline. However, only at R05 the exceedances per year were above the permissible number of 4.
The average daily dust deposition at all receptors was within the guideline of 600 (mg/m2/day).
Table 5-3. Modelling Results at Sensitive Receptors
Receptor Description
PM10 Max 24-hr
Concentration
PM10 24-hr Guideline
Exceedances
PM10 Annual Concentration
Dust Deposition
(g/m3) No. (g/m3) (mg/m2/day)
R01 Farm House 18.1 0 1.0 4.8
R02 Farm House 19.8 0 1.6 5.8
R03 Farm House 28.3 0 2.4 9.8
R04 Farm House 100.0 1 3.1 10.5
R05 Farm House 88.5 5 66.9 159.2
R06 Farm House 52.7 0 4.1 18.7
R07 Aggeneys 19.2 0 2.7 6.3
R08 Farm House < 20 0 < 7 < 20.6
R09 Farm House < 20 0 < 7 < 20.6
R10 Farm House < 20 0 < 7 < 20.6
R11 Farm House < 20 0 < 7 < 20.6
R12 Farm House < 20 0 < 7 < 20.6
R13 Farm House < 20 0 < 7 < 20.6
R14 Farm House 28.8 0 24.6 94.5
R15 Farm House < 20 0 < 7 < 20.6
R16 Farm House 24.4 0 12.4 37.3
R17 Farm House 22.4 0 10.7 28.2
R18 Farm House < 20 0 < 7 < 20.6
Guideline 75 4 40 600
Air Quality Impact Assessment Report for the Proposed Gamsberg Zinc Mine
DDA March 2013 40
6 IMPACT ASSESSMENT AND RECOMMENDATIONS
6.1 Impact Assessment
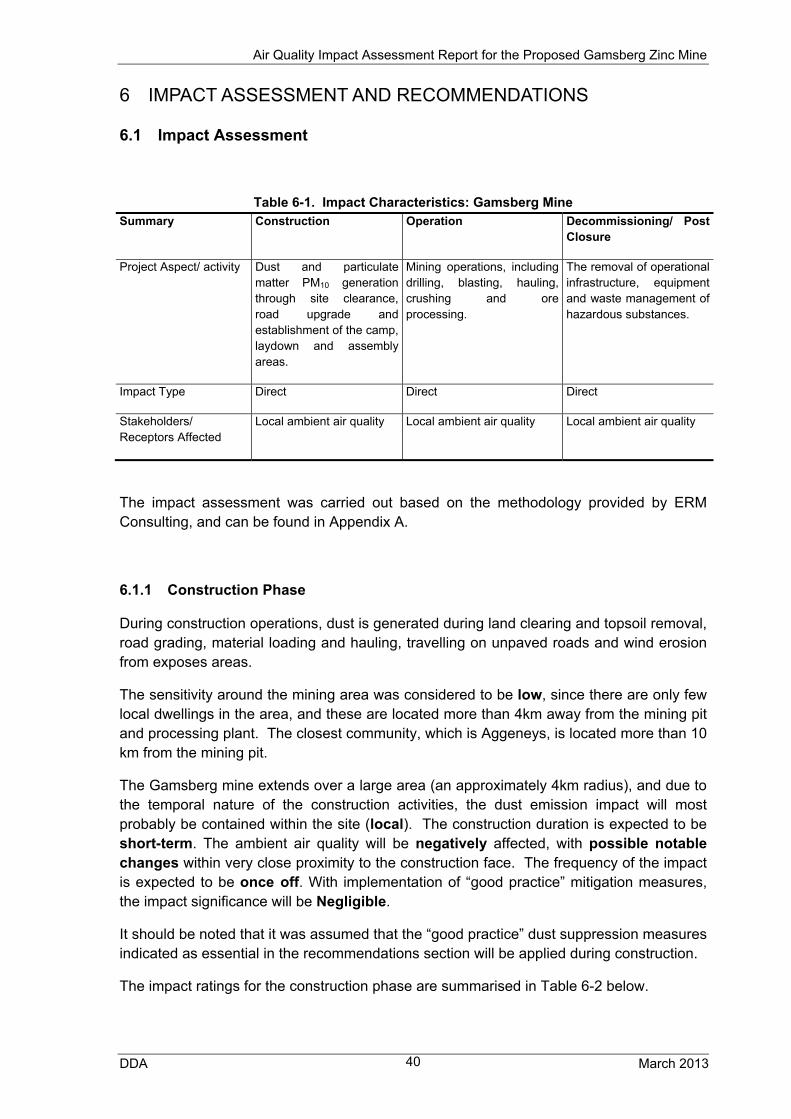
Table 6-1. Impact Characteristics: Gamsberg Mine Summary Construction Operation Decommissioning/ Post
Closure
Project Aspect/ activity Dust and particulate matter PM10 generation through site clearance, road upgrade and establishment of the camp, laydown and assembly areas.
Mining operations, including drilling, blasting, hauling, crushing and ore processing.
The removal of operational infrastructure, equipment and waste management of hazardous substances.
Impact Type Direct Direct Direct
Stakeholders/ Receptors Affected
Local ambient air quality Local ambient air quality Local ambient air quality
The impact assessment was carried out based on the methodology provided by ERM Consulting, and can be found in Appendix A.
6.1.1 Construction Phase
During construction operations, dust is generated during land clearing and topsoil removal, road grading, material loading and hauling, travelling on unpaved roads and wind erosion from exposes areas.
The sensitivity around the mining area was considered to be low, since there are only few local dwellings in the area, and these are located more than 4km away from the mining pit and processing plant. The closest community, which is Aggeneys, is located more than 10 km from the mining pit.
The Gamsberg mine extends over a large area (an approximately 4km radius), and due to the temporal nature of the construction activities, the dust emission impact will most probably be contained within the site (local). The construction duration is expected to be short-term. The ambient air quality will be negatively affected, with possible notable changes within very close proximity to the construction face. The frequency of the impact is expected to be once off. With implementation of “good practice” mitigation measures, the impact significance will be Negligible.
It should be noted that it was assumed that the “good practice” dust suppression measures indicated as essential in the recommendations section will be applied during construction.
The impact ratings for the construction phase are summarised in Table 6-2 below.
Air Quality Impact Assessment Report for the Proposed Gamsberg Zinc Mine
DDA March 2013 41
Table 6-2. Construction Impact
Nature: Construction activities would result in a negative direct impact on existing ambient air quality in the mining area.
Sensitivity/Vulnerability/Irreplaceability of Resource/Receptor – Low
Sensitivity: The sensitivity around the mine is considered low
Impact Magnitude – Small
Extent: The extent of the impact is local.
Duration: The expected impact will be short-term.
Scale: The impact will result in notable changes to the resource/ receptor.
Frequency: The frequency of the impact will be once off.
Likelihood: Ambient air quality will possibly be affected, in terms of increased dust fallout and ambient PM10 concentrations.
IMPACT SIGNIFICANCE (no MITIGATION other than “good practice”) – NEGLIGIBLE
Degree of Confidence: The degree of confidence is high.
6.1.2 Operational Phase
The operational phase of the Gamsberg mine will last approximately 17 years. Dust and PM10 are expected to be the main air emissions due to the mining operations.
The air quality impact during the operational phase of the Gamsberg mine was quantified via dispersion modelling, and the cumulative effects of all emission sources were taken into consideration. The impact ratings for the operational phase of the mine are summarised in Table 6- below.
The main emission sources were the haul trucks travelling on unpaved roads, the mining activities within the mining pit, the crushing and stockpiling of ore, as well as wind erosion at exposed areas and stockpiles. From the above-mentioned sources, the haul trucks and wind erosion were the main contributors to the total emissions. Therefore, during the operational phase the main effort in reducing the project’s impact on the ambient air quality should be focused primarily on minimising the emissions from the haul roads and reducing erodible areas. The essential mitigation measures for the operational phase are summarised in the emissions reduction recommendation section further below.
The sensitivity around the mining area was considered to be low, as the mine is located away from residential areas. In addition, the sensitivity around the Loop 10 road is also low, since there are only a small number of dwellings in close proximity to the road.
As shown by the dispersion modelling results, the dust fallout and elevated PM10 levels occur mostly within the mine and in close proximity to the Loop 10 road. Therefore, the extent of the impact is considered local. The duration of the impact will be long-term, as
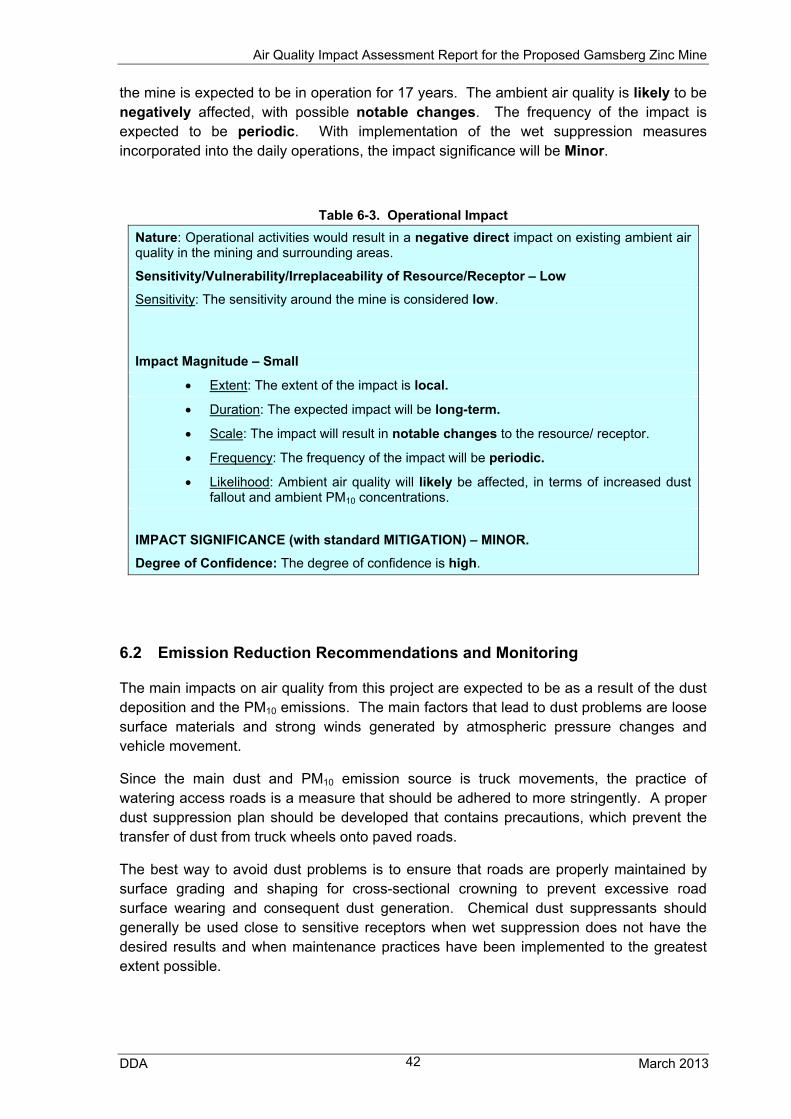
Air Quality Impact Assessment Report for the Proposed Gamsberg Zinc Mine
DDA March 2013 42
the mine is expected to be in operation for 17 years. The ambient air quality is likely to be negatively affected, with possible notable changes. The frequency of the impact is expected to be periodic. With implementation of the wet suppression measures incorporated into the daily operations, the impact significance will be Minor.
Table 6-3. Operational Impact
Nature: Operational activities would result in a negative direct impact on existing ambient air quality in the mining and surrounding areas.
Sensitivity/Vulnerability/Irreplaceability of Resource/Receptor – Low
Sensitivity: The sensitivity around the mine is considered low.
Impact Magnitude – Small
Extent: The extent of the impact is local.
Duration: The expected impact will be long-term.
Scale: The impact will result in notable changes to the resource/ receptor.
Frequency: The frequency of the impact will be periodic.
Likelihood: Ambient air quality will likely be affected, in terms of increased dust fallout and ambient PM10 concentrations.
IMPACT SIGNIFICANCE (with standard MITIGATION) – MINOR.
Degree of Confidence: The degree of confidence is high.
6.2 Emission Reduction Recommendations and Monitoring
The main impacts on air quality from this project are expected to be as a result of the dust deposition and the PM10 emissions. The main factors that lead to dust problems are loose surface materials and strong winds generated by atmospheric pressure changes and vehicle movement.
Since the main dust and PM10 emission source is truck movements, the practice of watering access roads is a measure that should be adhered to more stringently. A proper dust suppression plan should be developed that contains precautions, which prevent the transfer of dust from truck wheels onto paved roads.
The best way to avoid dust problems is to ensure that roads are properly maintained by surface grading and shaping for cross-sectional crowning to prevent excessive road surface wearing and consequent dust generation. Chemical dust suppressants should generally be used close to sensitive receptors when wet suppression does not have the desired results and when maintenance practices have been implemented to the greatest extent possible.

Air Quality Impact Assessment Report for the Proposed Gamsberg Zinc Mine
DDA March 2013 43
The following Table 6-4 summarises the dust suppression methods that should be used, according to the various works during construction and operation. The control measures termed as “essential” should be introduced at the plant and along the haul route, especially closer to the sensitive receptors.
For the wind speed reduction screens, consideration should be given to planting of the zones around the potential sources with trees. It is recommended that this should take place in two rows for effective wind breaking. This zone could also contribute towards the general improvement of the area’s aesthetic appeal.
Table 6-4. Recommended Dust Control Methods
Emission Source Recommended Control Methods
General construction Wet suppression a
Paving of permanent roads b
Wind speed reduction screens b
Site preparation Wet suppression a
Working face Phasing operation management, in order to minimise the exposure of the working face to prevailing winds a
Wind speed reduction screens b
Crushing Wet suppression a
Wind speed reduction screens or enclosure b
Materials handling and stockpiling
Wet suppression a
Wind speed reduction screens b
Truck transport Wet suppression of access roads a
Speed limit implementation (app. 30 km/hr) a
Chemical stabilisation via chlorides, asphalt emulsions or petroleum resins b
a Essential
b Optional
Dust deposition and PM10 monitoring should be continued at the same positions as the baseline locations before the commencement of the project, in order to collect additional background data.
During the operational phase of the project, bi-annual monitoring should take place for dust deposition at six selected locations around the site and two locations along the Loop 10 route. The PM10 concentrations should be monitored at one selected boundary location, as well as at the closest residential dwelling.

Air Quality Impact Assessment Report for the Proposed Gamsberg Zinc Mine
DDA March 2013 44
The performance targets for the monitoring should be set to a maximum total daily dust fallout (calculated from the monthly dust fallout) to be less than 600 mg/m2/day for residential areas, and the maximum annual average dust fallout within the site to be less than 1,200 mg/m2/day.
Along the Loop 10 Road, a reduction of the speed limit to 40 km/hr close to the sensitive receptors (R08 to R18) is recommended (refer to Table 5-2), in order to reduce the dust generation. The dust deposition levels at two locations along the road should be monitored, and if these exceed the limit then additional measures, such as chemical stabilisation, should be considered.
Recommended Mitigation Measures for Blasting
Due to concerns that the dust deposition associated with the blasting may impact sensitive
vegetation and ecological functioning in the areas close to the mining pit, specific
mitigation measures associated with blasting operations are discussed in more detail
below.
Blasting can generate a large amount of dust and heavier particles. However, most of the
dust settles out of the blasting clouds, and substantial quantities of dust and fumes do not
travel far from blasting sites. Adverse levels of deposition are generally infrequent and of
short duration.
Provided that all persons within the extended area are evacuated when blasting occurs
within 1,000 m of the blasting area, no significant health risks are expected due to
exposure to dust and fumes from the blast.
While blasting seemingly generates large amounts of dust, the operation occurs
infrequently enough that it is not considered to be a significant contributor to particulate
matter less than 10 micrometers (μm) (PM10) (EPA 1991; Richards and Brozell 2001).
As a result of blasting being considered a relatively small dust source, there is very little
documentation for dust control of blasting operations. There are two methods of dust
suppression that can be used for the control of dust during blasting:
wetting the entire blasting area prior to initiating the blast;
use of water cartridges within the drill holes.
Wetting the Blasting Area
A common method of dust control for blasting operations is to wet the entire blasting area
prior to initiating the blast. This procedure minimizes dust becoming entrained in the air

Air Quality Impact Assessment Report for the Proposed Gamsberg Zinc Mine
DDA March 2013 45
from the blasting activity, by allowing it to adhere to the wet surfaces (Cummins and Given
1973). This method can be effective for surface mining, depending upon the time interval
between watering and the blast initiation. Exposure of the surface to the atmospheric
conditions for large time intervals may cause the moisture to quickly evaporate and render
the watering ineffective.
Water Cartridges
Water cartridges which are inserted into the blasthole with the explosive have been used
successfully for dust reduction in underground coal mining blasting operations. The water
cartridges consist of a properly sized plastic bag, which is prefilled with water or can be
filled in the blasthole. These cartridges can be placed in front of, alongside, or behind the
explosive without causing any adverse effects to fragmentation. In coal mining operations,
the use of these cartridges is claimed to have reduced dust by between 40% and 60%.
Meteorological Conditions Consideration
Scheduling the blast to take into consideration the meteorological conditions, i.e. low wind
speed and low inversion potential, can be used to minimize the impacts of dust generation
from blasting. Generally, the dispersion of dust and gases occurs quickly after the blast,
depending upon the wind speed and direction, and work is not allowed in the affected area
until dispersion is completed.
For the Gamsberg mine, this type of consideration can be useful when the blasting
location is close to ecologically sensitive areas. Therefore, blasting there should be
avoided if the wind is blowing towards these sensitive locations and has a speed of above
5 m/s.
Blast scheduling preference should be given to low wind speeds (>2.5 m/s) and early
morning hours.

Air Quality Impact Assessment Report for the Proposed Gamsberg Zinc Mine
DDA March 2013 46
REFERENCES
Cowherd C., Muleski G.E. and Kinsey J.S., 1988. Control of Open Fugitive Dust Sources, EPA-450/3-88-008, US Environmental Protection Agency, Research Triangle Park, North Carolina.
Cummins AB, Given IA, eds., 1973. SME Mining engineering handbook, Vol. 1. New York: Society of Mining Engineers of the American Institute of Mining, Metallurgical, and Petroleum Engineers, Inc.
DEAT, 2005. Northern Cape Atmosphere and Climate Particulate Matter Concentrations. http://www.environment.gov.za/.
DEAT, 2006. Government Gazette, National Environmental Management Air Quality Act, 2004, No. 28899.
EU, 2008. Directive 2008/50/EC of the European Parliament and of the Council of 21 May 2008 on Ambient Air Quality and Cleaner Air for Europe. Available online: http://eur-lex.europa.eu/LexUriServ/LexUriServ.do?uri=CELEX:32008L0050:EN:NOT
NPi, 2012. Emissions Estimation Technique Manual for Mining, Version 3.1. National Pollutant Inventory (NPI), Environment Australia, January 2012.
Ntziachristos, L., Samaras, Z., 1999. COPERT III-Computer Programme to calculate Emissions from Road Transport. Methodology and emission factors (Version 2.1). European Environment Agency. Technical Report No. 49, Copenhagen.
Richards J, Brozell T, (2001)]. Compilation of National Stone, Sand and Gravel Association Sponsored Emission Factor and Air Quality Studies 1991–2001. Arlington, Virginia: National Stone, Sand and Gravel Association.
SANS 1929, 2005. South African National Standard, Ambient air Quality – Limits for Common Pollutants.
SRK, 2009. Gamsberg Zinc Project. Draft Baseline Climate and Air Quality Report. Report Prepared for Gamsberg Pre-Feasibility Project. Report No 396036/Air/1. December 2009.
U.S. EPA, 1991. Review of Surface Coal Mining Emissions Factors. U.S. Environmental Protection Agency, Office of Air Quality Planning and Standards, Research Triangle Park, North Carolina, July.
U.S. EPA, 1992. Screening Procedures for Estimating the Air Quality Impact of Stationary Sources, Revised, October 1992, EPA-454/R-92-019. U.S. Environmental Protection Agency, Research Triangle Park, NC.
U.S. EPA, 2004a. User’s Guide for the AMS/EPA Regulatory Model-AERMOD, EPA-454/B-03-001. U.S. Environmental Protection Agency, Research Triangle Park, NC.
Air Quality Impact Assessment Report for the Proposed Gamsberg Zinc Mine
DDA March 2013 47
U.S. EPA, 2004b. User’s Guide for the Aermod Meteorological Preprocessor (AERMET), EPA-454/B-03-002. U.S. Environmental Protection Agency, Research Triangle Park, NC.
U.S. EPA, 1998. AP42, Compilation of Air Pollutant Emission Factors, Volume 1: Stationary Point and Area Sources. Chapter 11: Mineral Products Industry. Section 11.9: Western Surface Coal Mining.
U.S. EPA, 1982. AP42, Compilation of Air Pollutant Emission Factors, Volume 1: Stationary Point and Area Sources. Chapter 11: Mineral Products Industry. Section 11.24: Metallic Minerals Processing.
http://www.epa.gov/ttn/chief/ap42/ch11/final/c11s24.pdf. Accessed 13 March 2013.
U.S. EPA, 2006a. AP42, Compilation of Air Pollutant Emission Factors, Volume 1: Stationary Point and Area Sources. Chapter 13: Miscellaneous Sources. Section 13.2.2: Unpaved Roads.
U.S. EPA, 2006b. AP42, Compilation of Air Pollutant Emission Factors, Volume 1: Stationary Point and Area Sources. Chapter 13: Miscellaneous Sources. Section 13.2.4: Aggregate Handling and Storage Piles.
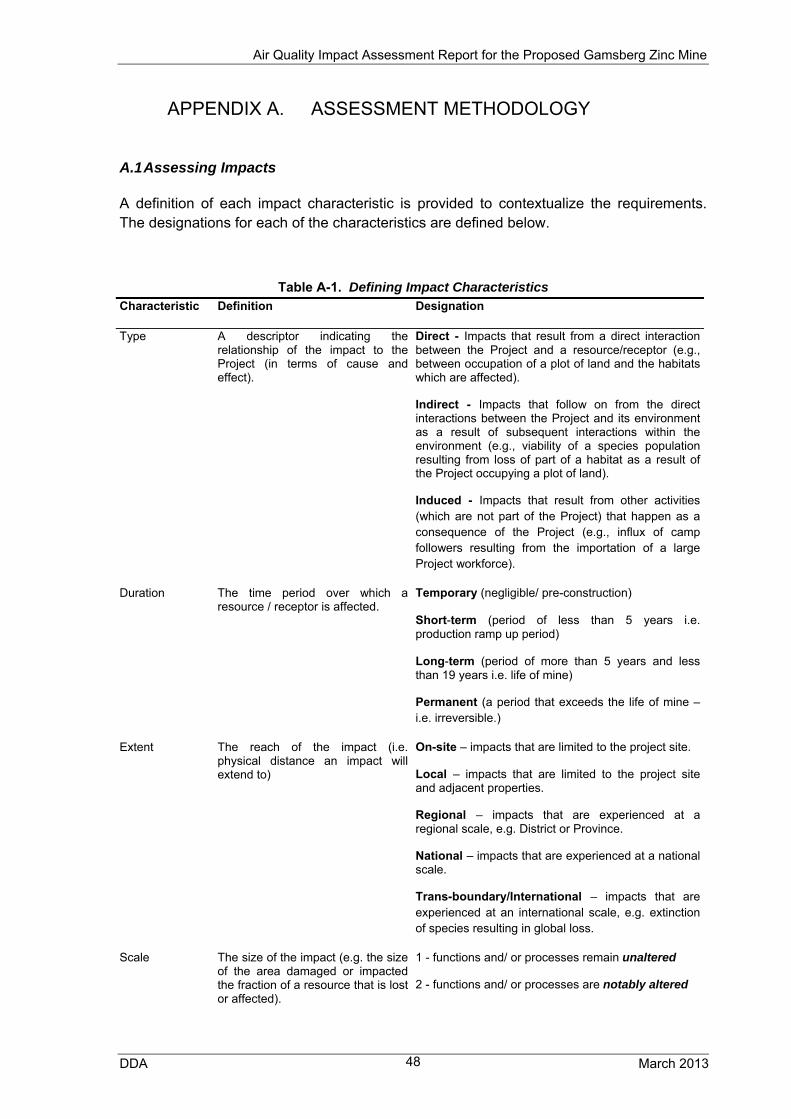
Air Quality Impact Assessment Report for the Proposed Gamsberg Zinc Mine
DDA March 2013 48
APPENDIX A. ASSESSMENT METHODOLOGY
A.1 Assessing Impacts
A definition of each impact characteristic is provided to contextualize the requirements. The designations for each of the characteristics are defined below.
Table A-1. Defining Impact Characteristics Characteristic Definition Designation
Type A descriptor indicating the relationship of the impact to the Project (in terms of cause and effect).
Direct - Impacts that result from a direct interaction between the Project and a resource/receptor (e.g., between occupation of a plot of land and the habitats which are affected).
Indirect - Impacts that follow on from the direct interactions between the Project and its environment as a result of subsequent interactions within the environment (e.g., viability of a species population resulting from loss of part of a habitat as a result of the Project occupying a plot of land).
Induced - Impacts that result from other activities (which are not part of the Project) that happen as a consequence of the Project (e.g., influx of camp followers resulting from the importation of a large Project workforce).
Duration The time period over which a resource / receptor is affected.
Temporary (negligible/ pre-construction)
Short‐term (period of less than 5 years i.e. production ramp up period)
Long‐term (period of more than 5 years and less than 19 years i.e. life of mine)
Permanent (a period that exceeds the life of mine – i.e. irreversible.)
Extent The reach of the impact (i.e. physical distance an impact will extend to)
On-site – impacts that are limited to the project site.
Local – impacts that are limited to the project site and adjacent properties.
Regional – impacts that are experienced at a regional scale, e.g. District or Province.
National – impacts that are experienced at a national scale.
Trans-boundary/International – impacts that are experienced at an international scale, e.g. extinction of species resulting in global loss.
Scale The size of the impact (e.g. the size of the area damaged or impacted the fraction of a resource that is lost or affected).
1 - functions and/ or processes remain unaltered
2 - functions and/ or processes are notably altered
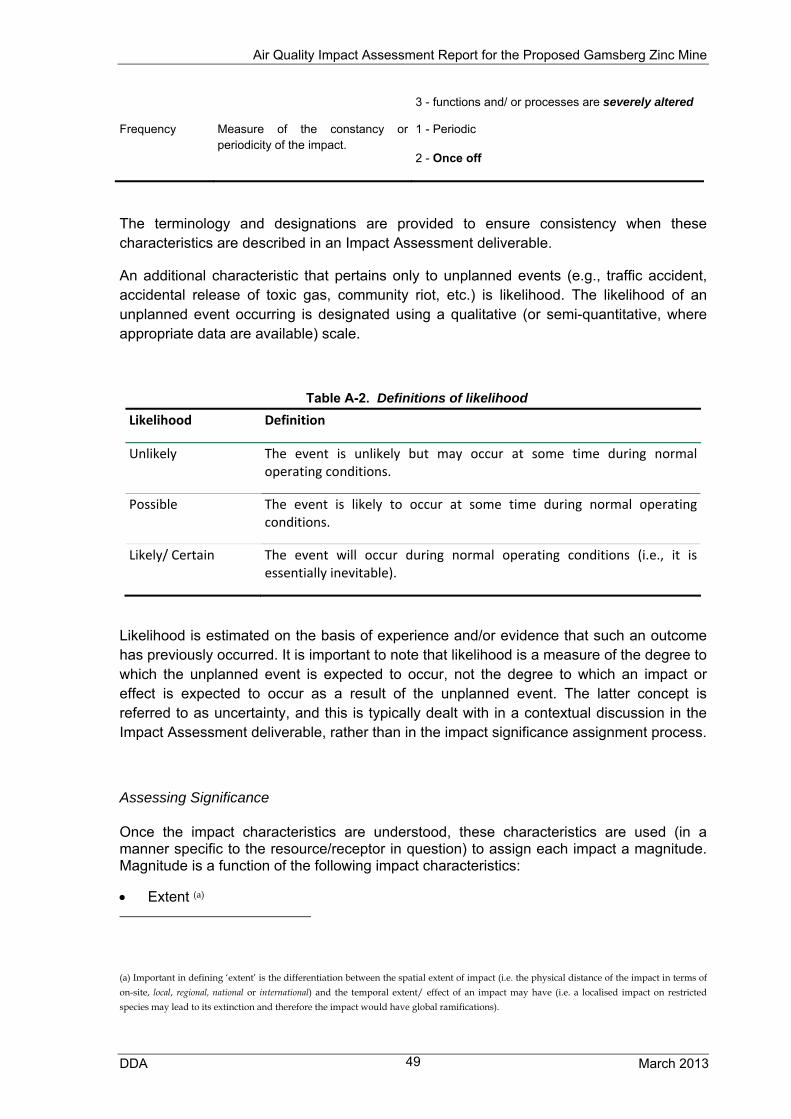
Air Quality Impact Assessment Report for the Proposed Gamsberg Zinc Mine
DDA March 2013 49
The terminology and designations are provided to ensure consistency when these characteristics are described in an Impact Assessment deliverable.
An additional characteristic that pertains only to unplanned events (e.g., traffic accident, accidental release of toxic gas, community riot, etc.) is likelihood. The likelihood of an unplanned event occurring is designated using a qualitative (or semi-quantitative, where appropriate data are available) scale.
Table A-2. Definitions of likelihood
Likelihood Definition
Unlikely The event is unlikely but may occur at some time during normal operating conditions.
Possible The event is likely to occur at some time during normal operating conditions.
Likely/ Certain The event will occur during normal operating conditions (i.e., it is essentially inevitable).
Likelihood is estimated on the basis of experience and/or evidence that such an outcome has previously occurred. It is important to note that likelihood is a measure of the degree to which the unplanned event is expected to occur, not the degree to which an impact or effect is expected to occur as a result of the unplanned event. The latter concept is referred to as uncertainty, and this is typically dealt with in a contextual discussion in the Impact Assessment deliverable, rather than in the impact significance assignment process.
Assessing Significance
Once the impact characteristics are understood, these characteristics are used (in a manner specific to the resource/receptor in question) to assign each impact a magnitude. Magnitude is a function of the following impact characteristics:
Extent (a)
(a) Important in defining ‘extent’ is the differentiation between the spatial extent of impact (i.e. the physical distance of the impact in terms of
on-site, local, regional, national or international) and the temporal extent/ effect of an impact may have (i.e. a localised impact on restricted
species may lead to its extinction and therefore the impact would have global ramifications).
3 - functions and/ or processes are severely altered
Frequency Measure of the constancy or periodicity of the impact.
1 - Periodic
2 - Once off

Air Quality Impact Assessment Report for the Proposed Gamsberg Zinc Mine
DDA March 2013 50
Duration (b) Scale Frequency Likelihood
Magnitude essentially describes the degree of change that the impact is likely to impart upon the resource/receptor. The magnitude designations are as follows:
Positive Negligible Small Medium Large
The methodology incorporates likelihood into the magnitude designation (i.e., in parallel with consideration of the other impact characteristics), so that the “likelihood-factored” magnitude can then be considered with the resource/receptor sensitivity/vulnerability/irreplaceability in order to assign impact significance.
The magnitude of impacts takes into account all the various dimensions of a particular impact in order to make a determination as to where the impact falls on the spectrum from negligible to large. Some impacts will result in changes to the environment that may be immeasurable, undetectable or within the range of normal natural variation. Such changes can be regarded as essentially having no impact, and should be characterized as having a negligible magnitude.
In addition to characterizing the magnitude of impact, the other principal step necessary to assign significance for a given impact is to define the sensitivity/vulnerability/ irreplaceability of the resource/receptor. There are a range of factors to be taken into account when defining the sensitivity/vulnerability/ irreplaceability of the resource/receptor, which may be physical, biological, cultural or human. Where the resource is physical (for example, a water body) its quality, sensitivity to change and importance (on a local, national and international scale) are considered. Where the resource/receptor is biological or cultural (for example, the marine environment or a coral reef), its importance (for example, its local, regional, national or international importance) and its sensitivity to the specific type of impact are considered. Where the receptor is human, the vulnerability of the individual, community or wider societal group is considered.
As in the case of magnitude, the sensitivity/vulnerability/ irreplaceability designations themselves are universally consistent, but the definitions for these designations will vary
(b) Duration must consider irreversible impacts (i.e. permanent).
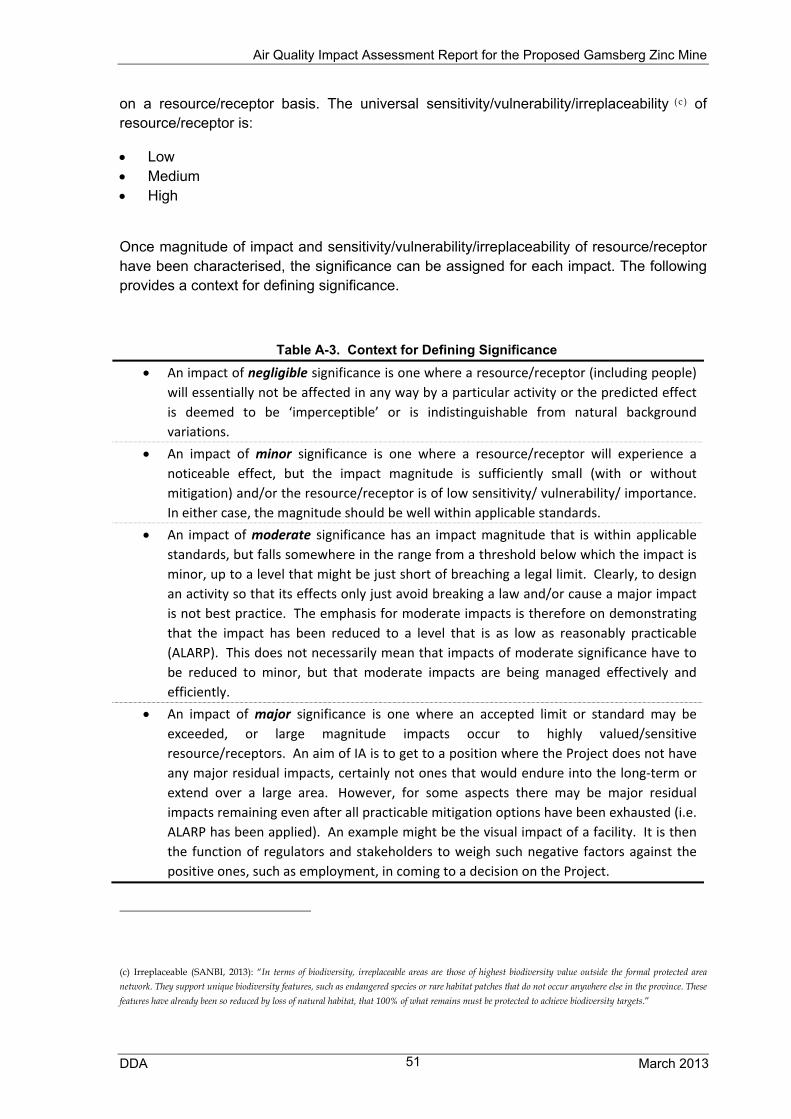
Air Quality Impact Assessment Report for the Proposed Gamsberg Zinc Mine
DDA March 2013 51
on a resource/receptor basis. The universal sensitivity/vulnerability/irreplaceability ( c ) of resource/receptor is:
Low Medium High
Once magnitude of impact and sensitivity/vulnerability/irreplaceability of resource/receptor have been characterised, the significance can be assigned for each impact. The following provides a context for defining significance.
Table A-3. Context for Defining Significance
An impact of negligible significance is one where a resource/receptor (including people)
will essentially not be affected in any way by a particular activity or the predicted effect
is deemed to be ‘imperceptible’ or is indistinguishable from natural background
variations.
An impact of minor significance is one where a resource/receptor will experience a
noticeable effect, but the impact magnitude is sufficiently small (with or without
mitigation) and/or the resource/receptor is of low sensitivity/ vulnerability/ importance.
In either case, the magnitude should be well within applicable standards.
An impact of moderate significance has an impact magnitude that is within applicable
standards, but falls somewhere in the range from a threshold below which the impact is
minor, up to a level that might be just short of breaching a legal limit. Clearly, to design
an activity so that its effects only just avoid breaking a law and/or cause a major impact
is not best practice. The emphasis for moderate impacts is therefore on demonstrating
that the impact has been reduced to a level that is as low as reasonably practicable
(ALARP). This does not necessarily mean that impacts of moderate significance have to
be reduced to minor, but that moderate impacts are being managed effectively and
efficiently.
An impact of major significance is one where an accepted limit or standard may be
exceeded, or large magnitude impacts occur to highly valued/sensitive
resource/receptors. An aim of IA is to get to a position where the Project does not have
any major residual impacts, certainly not ones that would endure into the long‐term or
extend over a large area. However, for some aspects there may be major residual
impacts remaining even after all practicable mitigation options have been exhausted (i.e.
ALARP has been applied). An example might be the visual impact of a facility. It is then
the function of regulators and stakeholders to weigh such negative factors against the
positive ones, such as employment, in coming to a decision on the Project.
(c) Irreplaceable (SANBI, 2013): “In terms of biodiversity, irreplaceable areas are those of highest biodiversity value outside the formal protected area
network. They support unique biodiversity features, such as endangered species or rare habitat patches that do not occur anywhere else in the province. These
features have already been so reduced by loss of natural habitat, that 100% of what remains must be protected to achieve biodiversity targets.”

Air Quality Impact Assessment Report for the Proposed Gamsberg Zinc Mine
DDA March 2013 52
Based on the context for defining significance, the impact significance rating will be determined, using the matrix below.
Table A-4. Impact Significance Rating Matrix
Sensitivity/Vulnerability/Irreplaceability of Resource/Receptor
Low Medium High
Magnitude of Im
pact
Negligible Negligible Negligible Negligible
Small Negligible Minor Moderate
Medium Minor Moderate Major
Large Moderate Major Major
Once the significance of the impact has been determined, it is important to qualify the degree of confidence in the assessment. Confidence in the prediction is associated with any uncertainties, for example, where information is insufficient to assess the impact. Degree of confidence can be expressed as low, medium or high.
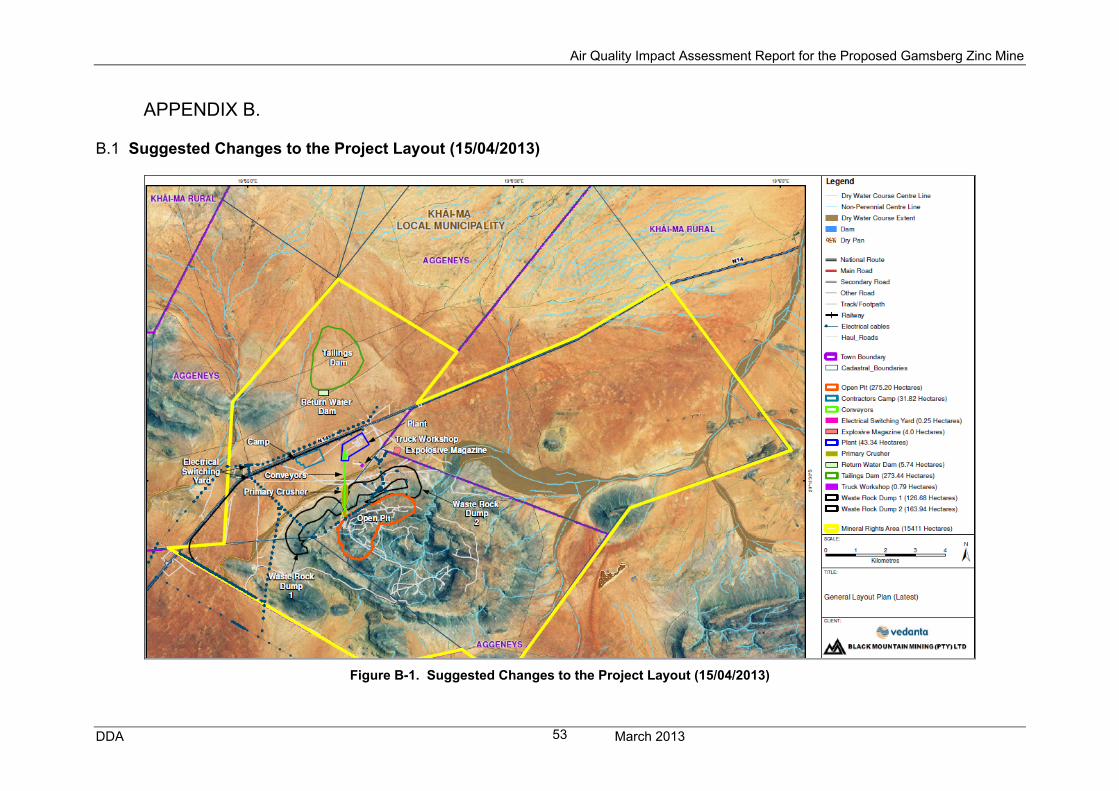
Air Quality Impact Assessment Report for the Proposed Gamsberg Zinc Mine
DDA March 2013 53
APPENDIX B.
B.1 Suggested Changes to the Project Layout (15/04/2013)
Figure B-1. Suggested Changes to the Project Layout (15/04/2013)
Air Quality Impact Assessment Report for the Proposed Gamsberg Zinc Mine
DDA 54 March 2013
Based on recent discussions with the Applicant and design engineers, the following changes
to the project layout have been suggested. The changes are as follows (refer to Figure D-1):
1. Relocation of the explosives magazine area from the top of the inselberg to an area
located between the N14 and inselberg. Due to the impacts to three watercourses on
the inselberg, this relocation was requested by the Specialist Team.
2. Increase in size of the waste rock dump from to 270 hectares to 490 hectares. In order
to reduce the slope angle of the waste rock dump (i.e. from 450 – 350 degree
slope) ,the footprint of the waste rock dump has increased. This design refinement was
in response to DMR requirements for a waste rock dump.
The air quality and dust impact rating due to the above-mentioned changes in the mine
layout is not expected to change, and most of its aspects will remain approximately the same.
The PM10 and dust emissions from the dump site due to wind erosion are expected to
increase by 80% due its size increase. However, these emissions will constitute less than 9%
of the total dust emissions. Therefore, the dust deposition levels around the dump site will
increase in close proximity, i.e. within 300 from the dump site. However, this increase is not
considered significant, and further than 700 m from the site would be considered very small.
The air quality and dust deposition levels along the concession boundaries and the sensitive
receptors around the site are not expected to be affected.
Air Quality Impact Assessment Report for the Proposed Gamsberg Zinc Mine
DDA March 2013
55
APPENDIX C.
C.1 Declaration of Consultant’s Independence
The author of this report, Demos Dracoulides, does hereby declare that he is an
independent consultant appointed by ERM and has no business, financial, personal or
other interest in the activity, application or appeal in respect of which he was appointed
other than fair remuneration for work performed in connection with the activity, application
or appeal. There are no circumstances that compromise the objectivity of the specialist
performing such work. All opinions expressed in this report are his own.
Demos Dracoulides:
April 2013