Embed Size (px)
Citation preview

Air Quality Monitoring Annual Report 2016 Birmingham Airport ___________________________________________________
Report for Birmingham Airport Ltd ED62657035
ED 62657035 | Draft Number 1 | Date 20/04/2017 Ricardo in Confidence
Air Quality Monitoring Annual Report 2016 | i
Ricardo Energy & Environment
Ricardo in Confidence Ref: Ricardo/ED62657035/Draft Number 1
Customer: Contact:
Birmingham Airport Ltd Tim Bevington Ricardo Energy & Environment Gemini Building, Harwell, Didcot, OX11 0QR, United Kingdom
t: +44 (0) 1235 75 3125
Ricardo-AEA Ltd is certificated to ISO9001 and ISO14001
Customer reference:
ED62657035
Confidentiality, copyright & reproduction:
This report is the Copyright of Birmingham Airport Ltd. It has been prepared by Ricardo Energy & Environment, a trading name of Ricardo-AEA Ltd, under contract to Birmingham Airport Ltd dated 06/12/2015. The contents of this report may not be reproduced in whole or in part, nor passed to any organisation or person without the specific prior written permission of Birmingham Airport Ltd. Ricardo Energy & Environment accepts no liability whatsoever to any third party for any loss or damage arising from any interpretation or use of the information contained in this report, or reliance on any views expressed therein.
Author:
Sion Carpenter
Approved By:
Alison Loader
Date:
20 April 2017
Ricardo Energy & Environment reference:
Ref: ED62657035- Draft Number 1
Air Quality Monitoring Annual Report 2016 | ii
Ricardo Energy & Environment
Ricardo in Confidence Ref: Ricardo/ED62657035/Draft Number 1
Executive Summary
This report provides details of air quality monitoring conducted at Birmingham Airport during 2016. The work, carried out by Ricardo Energy & Environment on behalf of Birmingham Airport Ltd, is a continuation of monitoring undertaken at Birmingham Airport since 1995. The aims of the programme are to monitor air pollution around the airport, to assess compliance with relevant national air quality objectives, and to investigate changes in air pollutant concentrations over time.
Automatic continuous monitoring was carried out at one location, referred to as Birmingham Airport 2. The site monitored oxides of nitrogen (nitric oxide and nitrogen dioxide), ozone, carbon monoxide, sulphur dioxide and PM10. The PM10 data were measured using a Tapered Element Oscillating Microbalance (TEOM), therefore there was the need to adjust data using the King’s College London Volatile Correction Model to correct for potential losses of volatile and semi-volatile components.
The data capture target of 90% (from the European Commission Air Quality Directive1) was achieved for all pollutants in 2016.
The UK AQS hourly mean objective for NO2 is 200 µg m-3, with no more than 18 exceedances allowed
each year. The monitoring site has registered no exceedances of this value during the year, and therefore met this objective for 2016.
The annual mean AQS objective for NO2 is 40 µg m-3. This objective was also met in 2016; an annual mean of 23 µg m-3 was measured. This value is slightly higher than the one measured in 2015 (21 µg m-3), showing a small increase in concentration for this pollutant.
PM10 may exceed the 24-hour mean limit of 50 µg m-3 no more than 35 times per year to meet the AQS objective. During 2016, there were no exceedances of the limit value registered at the site. This AQS objective was therefore met in 2016. The annual mean AQS for PM10 is 40 µg m-3. This objective was met at Birmingham Airport 2 with an annual mean of 15 µg m-3.
The UK AQS objective for ozone is 100 µg m-3, as a maximum daily 8-hour mean, not to be exceeded more than 10 days a year. The ozone levels measured at Birmingham Airport monitoring station show that this objective was exceeded on 14 days during 2016. The AQS objective for ozone was therefore not met in 2016. However, ozone is a transboundary pollutant which is difficult to control by local measures: it is therefore not currently included in the Local Air Quality Management regime.
The AQS objectives for CO and SO2 were met at Birmingham Airport 2 monitoring station in 2016.
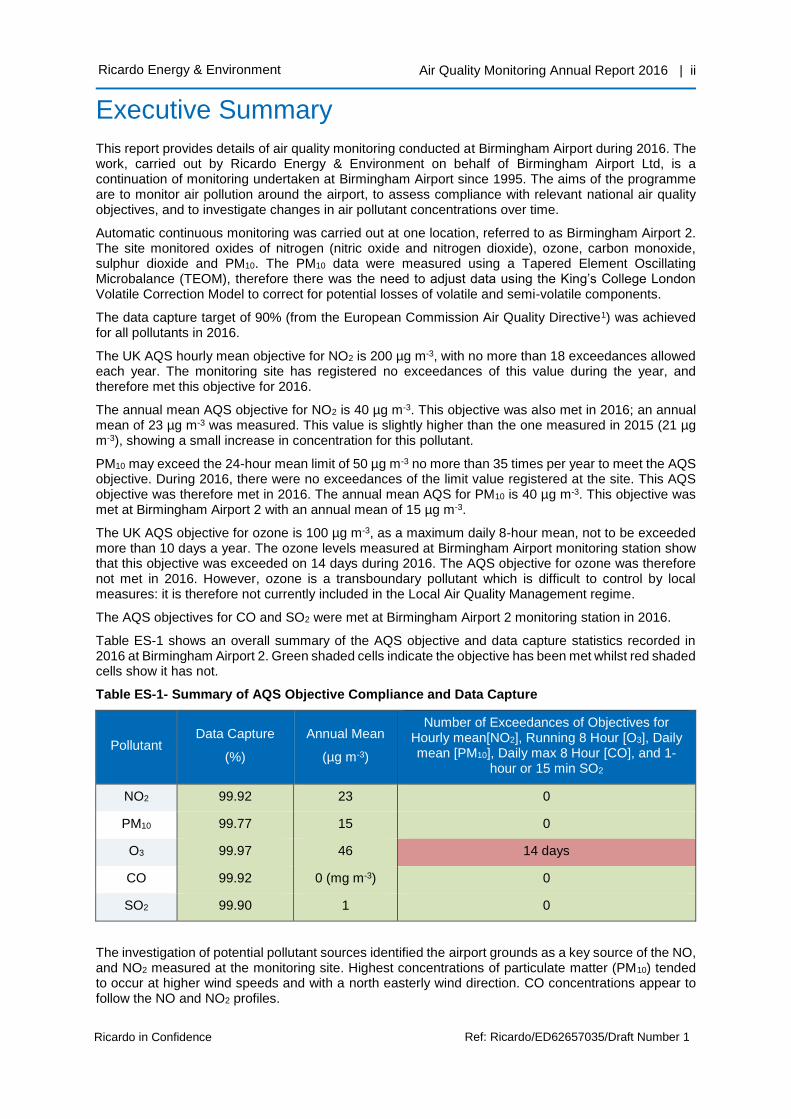
Table ES-1 shows an overall summary of the AQS objective and data capture statistics recorded in 2016 at Birmingham Airport 2. Green shaded cells indicate the objective has been met whilst red shaded cells show it has not.
Table ES-1- Summary of AQS Objective Compliance and Data Capture
Pollutant Data Capture
(%)
Annual Mean
(µg m-3)
Number of Exceedances of Objectives for Hourly mean[NO2], Running 8 Hour [O3], Daily mean [PM10], Daily max 8 Hour [CO], and 1-
hour or 15 min SO2
NO2 99.92 23 0
PM10 99.77 15 0
O3 99.97 46 14 days
CO 99.92 0 (mg m-3) 0
SO2 99.90 1 0
The investigation of potential pollutant sources identified the airport grounds as a key source of the NO, and NO2 measured at the monitoring site. Highest concentrations of particulate matter (PM10) tended to occur at higher wind speeds and with a north easterly wind direction. CO concentrations appear to follow the NO and NO2 profiles.

Air Quality Monitoring Annual Report 2016 | iii
Ricardo Energy & Environment
Ricardo in Confidence Ref: Ricardo/ED62657035/Draft Number 1
Table of contents
1 Introduction ................................................................................................................ 1 1.1 Aims and Objectives .......................................................................................................... 1 1.2 UK Air Quality Strategy ..................................................................................................... 1 1.3 Emissions from Airports .................................................................................................... 1 1.4 The Air Quality Strategy and Birmingham Airport ............................................................. 2
2 Air Quality Monitoring ............................................................................................... 3 2.1 Pollutants Monitored .......................................................................................................... 3
2.1.1 Nitrogen Oxides (NOx) .............................................................................................. 3 2.1.2 Particulate Matter (PM10) .......................................................................................... 3 2.1.3 Ozone (O3) ............................................................................................................... 3 2.1.4 Carbon Monoxide (CO) ............................................................................................ 3 2.1.5 Sulphur Dioxide (SO2) .............................................................................................. 4
2.2 Automatic Monitoring ......................................................................................................... 4 2.3 Volatile Correction Model .................................................................................................. 4 2.4 Monitoring Station ............................................................................................................. 5
3 Results and Discussion ............................................................................................. 6 3.1 Automatic Monitoring Data ................................................................................................ 6 3.2 Comparison with Air Quality Objectives ............................................................................ 9 3.3 Temporal Variation in Pollutant Concentrations ................................................................ 9
3.3.1 Seasonal Variations ............................................................................................... 12 3.3.2 Diurnal Variations ................................................................................................... 12 3.3.3 Weekly Variations ................................................................................................... 12
3.4 Source Investigation ........................................................................................................ 13 3.5 Periods of Elevated Pollutant Concentration ................................................................... 17 3.6 Comparison with Other Local Monitoring Sites ............................................................... 19
4 Conclusions ............................................................................................................. 20
5 References ............................................................................................................... 21
Appendices
Appendix 1 Air Quality objectives and Index bands
Appendix 2 Monitoring apparatus and techniques
Appendix 3 Location of the AQ monitoring site
Appendix 4 Statistical Summary 2006 - 2016

Air Quality Monitoring Annual Report 2016 | 1
Ricardo Energy & Environment
Ricardo in Confidence Ref: Ricardo/ED62657035/Draft Number 1
1 Introduction
Birmingham Airport Ltd (referred to here as “Birmingham Airport”) has undertaken continuous ambient air quality monitoring at a monitoring station on the airport premises since April 1995. This forms part of the Airport’s commitment to monitor air quality through the requirements of the Section 106 Planning Agreement between Solihull Metropolitan Borough Council (SMBC) and Birmingham Airport. The monitoring is intended to provide information on current air quality in the area and the levels of pollution to which the neighbouring community is exposed. The data from the air monitoring station are managed and collated by Ricardo Energy & Environment. This report has been prepared by Ricardo Energy & Environment, on behalf of Birmingham Airport, to provide analysis and commentary on the 2016 dataset.
Data in the annual report have been processed according to the rigorous quality assurance and quality control procedures used by Ricardo Energy & Environment. These ensure the data are reliable, accurate and traceable to UK national measurement standards.
1.1 Aims and Objectives
The aim of this monitoring programme is to monitor concentrations of several important air pollutants at the airport. The results of the monitoring are used to assess whether applicable national air quality objectives have been met, and how pollutant concentrations in the area have changed over time. Additionally, meteorological data were used to investigate the importance of various sources of pollution.
It is important to note that the pollutants measured in this study could have been originated from a wide variety of sources, both local and long range. Not all of these sources will be directly connected with the airport.
Monitoring data collected at Birmingham Airport are compared in this report with:
• Relevant UK air quality limit values and objectives.
• Relevant periods of regional/national elevated pollutant concentrations.
• Corresponding results from a selection of national air pollution monitoring sites.
1.2 UK Air Quality Strategy
Within the European Union, controls on ambient air quality are covered by Directive 2008/50/EC on Ambient Air Quality and Cleaner Air for Europe1, known as the Air Quality Directive, and its update EU2015/14802. This consolidated three previously existing Directives, which set limit values for a range of air pollutants with known health impacts. The original Directives were transposed into UK law through The Environment Act 1995 which placed a requirement on the Secretary of State for the Environment to produce a national Air Quality Strategy (AQS) containing standards, objectives and measures for improving ambient air quality.
The Environment Act 1995 also introduced the system of local air quality management (LAQM). This requires local authorities to review and assess air quality in their areas against the national air quality objectives. Where any objective is unlikely to be met by the relevant deadline, the local authority must designate an air quality management area (AQMA). Local authorities then have a duty to carry out further assessments within any AQMAs and draw up an action plan specifying the measures to be carried out, and the timescales, to achieve the air quality objectives. The legal framework given in the Environment Act has been adopted in the UK through the UK AQS. The most recent version of the AQS was published by Defra in 20073, and the currently applicable air quality objectives are summarised in Appendix 1 of this report.
1.3 Emissions from Airports
Airports are potentially significant sources of many air pollutants. Aircraft jet engines emit pollutants including oxides of nitrogen (NOx), carbon monoxide (CO), oxides of sulphur (SOx), particulate matter, hydrocarbons from partially combusted fuel, and other trace compounds. There are also pollutant

Air Quality Monitoring Annual Report 2016 | 2
Ricardo Energy & Environment
Ricardo in Confidence Ref: Ricardo/ED62657035/Draft Number 1
emissions from the airside vehicles, and from the large number of road vehicles travelling to and from the airport each day.
1.4 The Air Quality Strategy and Birmingham Airport
The UK Air Quality Strategy Objectives apply anywhere that public exposure may occur, for example at residential properties, at a bus stop etc. As the airport monitoring site is located by the runway, where members of the public do not have access, strictly these limits do not apply. However, this report compares the data from the site with the Air Quality Strategy (AQS) Objectives. If the site is showing compliance with the objectives for the primary pollutants that are likely to be emitted directly from the airport - namely NO2, PM10, CO and SO2 - then it is reasonable to assume that, in the absence of any other significant sources, the objectives are likely to be met at the nearby residential properties.
For the purposes of LAQM, the airport falls under the jurisdiction of Solihull MBC. The Council has reviewed air quality across their area and found that pollutant levels do not exceed the AQS Objectives. Therefore, at the time of writing (March 2017), no air quality management areas have been declared in Solihull.

Air Quality Monitoring Annual Report 2016 | 3
Ricardo Energy & Environment
Ricardo in Confidence Ref: Ricardo/ED62657035/Draft Number 1
2 Air Quality Monitoring
2.1 Pollutants Monitored
2.1.1 Nitrogen Oxides (NOx)
Combustion processes emit a mixture of oxides of nitrogen – NO and NO2 - collectively termed NOx.
i) NO is described as a primary pollutant (meaning it is directly emitted from source). NO is not known to have any harmful effects on human health at ambient concentrations. However, it undergoes oxidation in the atmosphere to form the secondary pollutant NO2.
ii) NO2 has a primary (directly emitted) component and a secondary component, formed by oxidation of NO. NO2 is a respiratory irritant and is toxic at high concentrations. It is also involved in the formation of photochemical smog and acid rain and may cause damage to crops and vegetation.
Of the NOx emissions (including NO2) considered to be airport-related, over 50 % arise from aircraft during take-off and landing, with around two-thirds of all emissions occurring at some distance from airport ground-level. The Air Quality Expert Group (AQEG) 4has stated that: “Around a third of all NOx emissions from the aircraft (including ground-level emissions from auxiliary power units, engine testing etc., as well as take-off and landing) occur below 100 m in height. The remaining two-thirds occur between 100 m and 1000 m and contribute little to ground-level concentrations. Receptor modelling studies show the impact of airport activities on ground-level NO2 concentrations. Studies have shown that although emissions associated with road traffic are smaller than those associated with aircraft, their impact on population exposure at locations around the airport are larger”. Previous rounds of review and assessment within the LAQM process have not highlighted any cases where airports appear to have caused exceedances of air quality objectives for particulate matter measured as PM10. Therefore, in the context of LAQM, the key pollutant of concern from airports is NO2. Local authorities whose areas contain airports with over 10 million passengers per annum must take these into account in their annual review and assessment of air quality.
2.1.2 Particulate Matter (PM10)
Airborne particulate matter varies widely in its physical and chemical composition, source and particle size. The term “PM10” is used to describe particles with an effective size less than 10 µm. These are of greatest concern with regard to human health, as they are small enough to penetrate deep into the lungs. They can cause inflammation and a worsening of the condition of people with heart and lung diseases. In addition, they may carry surface absorbed carcinogenic compounds into the lungs. Larger particles, meanwhile, are not readily inhaled, and are removed relatively efficiently from the air by sedimentation.
The main sources of airborne particulate matter in the UK are combustion (industrial, commercial and residential fuel use). The next most significant source is road vehicle emissions. Based on 2013 NAEI data, less than 0.1% of UK total PM10 emissions are believed to originate from civil aircraft taking off and landing5
Previous rounds of review and assessment within the LAQM process have not highlighted any cases where airports appear to have caused exceedances of air quality objectives for particulate matter measured as PM10.
2.1.3 Ozone (O3)
Ozone is not emitted directly into the atmosphere in significant quantities, but is a secondary pollutant produced by reaction between nitrogen dioxide (NO2) and hydrocarbons, in the presence of sunlight. Whereas nitrogen dioxide (NO2) contributes to ozone formation, nitrogen oxide (NO) destroys ozone and therefore acts as a local sink. For this reason, ozone levels are not as high in urban areas (where NO is emitted from vehicles) as in rural areas. Ozone levels are usually highest in rural areas, particularly in hot, still, sunny weather conditions giving rise to "summer smog".
2.1.4 Carbon Monoxide (CO)
Carbon monoxide is a gas that results as a product of the incomplete combustion of fuels. In the presence of an adequate O2 supply, CO gets oxidized, and turns into CO2. The highest levels of CO

Air Quality Monitoring Annual Report 2016 | 4
Ricardo Energy & Environment
Ricardo in Confidence Ref: Ricardo/ED62657035/Draft Number 1
occur generally in areas with intense traffic released by the exhaust pipe of motor engines. Other CO emission sources may include some industrial processes, biomass burning for heating or natural sources like forest fires. CO causes can cause harmful health effects, as it reduces the oxygen delivery to the body’s organs and tissues.
2.1.5 Sulphur Dioxide (SO2)
Sulphur dioxide is a colourless gas mainly originated by activities related to burning of fossil fuels (diesel burning of heavy vehicles), and burning of coal and oil in power plants. In nature, SO2 can also be released to the atmosphere from a volcanic eruption. The sulphur reacts with oxygen to form SO2, which in contact with the moisture in the air can create sulphuric acid, a component of acid rain.
2.2 Automatic Monitoring
The following techniques were used for the automatic monitoring of NOx (i.e. NO and NO2), PM10, O3, CO and SO2:
•PM10 - Tapered Element Oscillating Microbalance (TEOM);
•NO, NO2 – Chemiluminescence;
•O3 – UV absorption analyser;
•CO – Non dispersive infrared absorption (NDIR).
•SO2 – Ultraviolet Fluorescence (UVF).
Further information on these techniques is provided in Appendix 2 of this report. These analysers provide a continuous output, proportional to the pollutant concentration. This output is recorded and stored every 10 seconds, and averaged to 15-minute mean values by internal data loggers. The analysers are connected to a modem and interrogated through a GPRS internet device to download the data to Ricardo Energy & Environment. Data are downloaded hourly. The data are converted to concentration units at Ricardo Energy & Environment then averaged to hourly mean concentrations.
Fortnightly calibrations are performed by Local Site Operators (LSOs) based at Birmingham Airport, to monitor the performance of the analysers. Data from these fortnightly checks, and from six-monthly independent QA/QC audits carried out by Ricardo Energy & Environment, are used to scale and ratify the data. This data scaling and ratification is carried out by Ricardo Energy & Environment. The analysers are also serviced on a six-monthly basis to ensure their continued operation.
All ambient concentration measurements in the report are quoted in micrograms per cubic metre (µg m-
3) or in the case of carbon monoxide milligrams per cubic metre (mg m-3) at reference conditions of 20 °C, 1013 mbar.
2.3 Volatile Correction Model
The TEOM particulate monitor uses a 50 °C heated sample inlet to prevent condensation on the filter. Although necessary, this elevated temperature can result in the loss of volatile and semi-volatile components of PM10 such as ammonium nitrate6 It is not possible to address this problem by applying a simple correction factor. However, King’s College London (KCL) has developed a Volatile Correction Model7 (VCM), which allows TEOM PM10 data to be corrected for the volatile components lost as a result of the TEOM’s heated inlet. It uses data from nearby TEOM-FDMS (Filter Dynamics Measurement System) particulate analysers in the national air quality monitoring network, which measure the volatile and non-volatile components of PM10. The volatile component (which typically does not vary much over a large region), can be added to the TEOM measurement. KCL states that the resulting corrected measurements have been demonstrated as equivalent to the gravimetric reference equivalent. Correction using the VCM is now the preferred approach when comparing TEOM data with air quality limit values and objectives. In this report, it is clearly indicated when the VCM has been used to correct PM10 data. More information about the VCM correction of PM10 data is presented in Appendix 2 of this report.
Air Quality Monitoring Annual Report 2016 | 5
Ricardo Energy & Environment
Ricardo in Confidence Ref: Ricardo/ED62657035/Draft Number 1
2.4 Monitoring Station
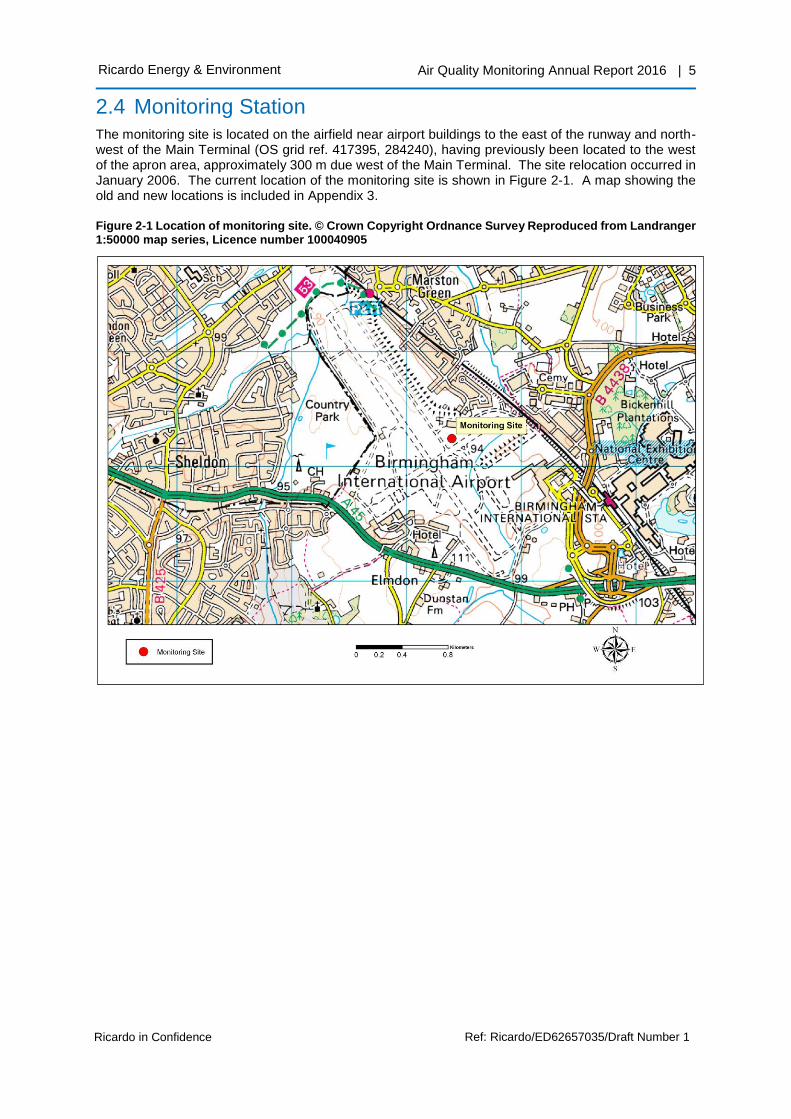
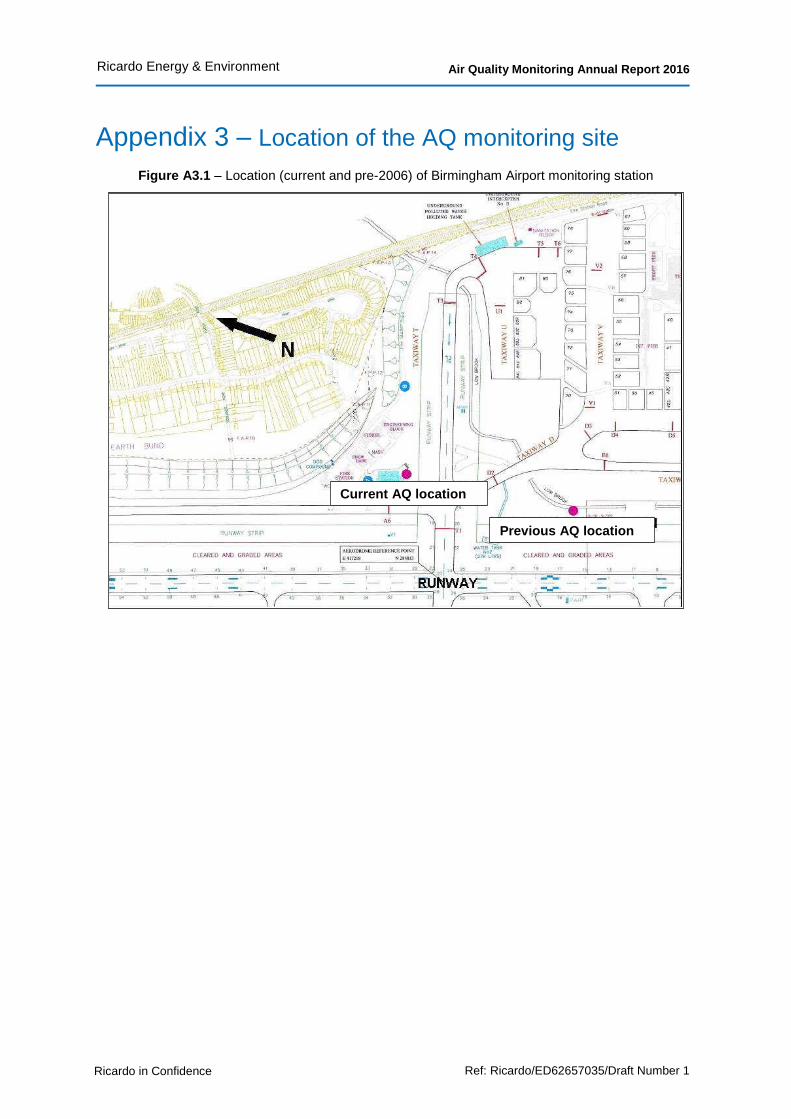
The monitoring site is located on the airfield near airport buildings to the east of the runway and north-west of the Main Terminal (OS grid ref. 417395, 284240), having previously been located to the west of the apron area, approximately 300 m due west of the Main Terminal. The site relocation occurred in January 2006. The current location of the monitoring site is shown in Figure 2-1. A map showing the old and new locations is included in Appendix 3.
Figure 2-1 Location of monitoring site. © Crown Copyright Ordnance Survey Reproduced from Landranger 1:50000 map series, Licence number 100040905

Air Quality Monitoring Annual Report 2016 | 6
Ricardo Energy & Environment
Ricardo in Confidence Ref: Ricardo/ED62657035/Draft Number 1
3 Results and Discussion
This section provides a summary of Birmingham Airport 2 data for 2016, and a comparison with the AQS Objectives. It also provides analyses of pollutants seasonal, weekly and daily trends, identifies potential emission sources based upon pollution measurements and meteorological data from the site, and explains periods of elevated pollutant concentration. The results from the Birmingham Airport site are also compared with those from other monitoring sites in the area.
3.1 Automatic Monitoring Data
The summary statistics for 2016 are presented in Table 3-1. All gaseous pollutant mass units are at 20°C and 1013mb. Particulate matter concentrations are reported at ambient temperature and pressure. NOX mass units are NOX as NO2 μg m-3. A statistical summary of results from 2006-2016 is provided in Appendix 4.
Table 3-1 Air pollution statistics for Birmingham Airport 2, from 1st January to 31st December 2016
Birmingham Airport 2
O3
(ug m-3)
NO (µg m-3)
NO2 (µg m-3)
NOx (µg m-3)
PM10 *
(µg m-3)
CO
(mg m-3)
SO2 (µg m-3)
Maximum 15 minute mean
(SO2) - - - - - - 16
Maximum 8 hour (CO, O3)
146 - - - - 1 -
Max. 1-hour mean
166 410 117 742 97 1.5 13
Maximum daily mean
97 164 71 313 43 0.67 7
Annual mean 46 9 23 37 15 0.22 1
Data capture 99.97 99.92 99.92 99.92 99.77 99.92 99.90
* VCM corrected using FDMS data from AURN sites
The Defra Technical Guidance document for LAQM (LAQM.TG(16))8, requires the use of the Volatile Correction Model (VCM)7 to correct TEOM data to gravimetric equivalent, as explained in section 2.3. The hourly average concentrations of PM10 in this section are therefore corrected using the VCM to enable direct comparison with the Air Quality Strategy (AQS) objectives. The FDMS data used for this purpose are from the Automatic Urban and Rural Network (AURN) sites.
Data capture for all monitored pollutants was above the EU target of 90%3for ratified datasets with no significant data gaps. This data capture target does not include losses due to regular calibration or maintenance of the instrument. Any data capture rate above 75% is deemed representative of the full annual period.
The time series of data for the full year, as measured by the automatic monitoring site, are shown in Figure 3-1 and 3-2.

Air Quality Monitoring Annual Report 2016 | 7
Ricardo Energy & Environment
Ricardo in Confidence Ref: Ricardo/ED62657035/Draft Number 1
Figure 3-1 Time series of hourly averaged concentrations of NOx, PM10 (VCM Corrected) and O3 for Birmingham Airport 2 site, 2016

Air Quality Monitoring Annual Report 2016 | 8
Ricardo Energy & Environment
Ricardo in Confidence Ref: Ricardo/ED62657035/Draft Number 1
Figure 3-2 Time series of hourly averaged concentrations of CO and SO2 for Birmingham Airport 2 site, 2016

Air Quality Monitoring Annual Report 2016 | 9
Ricardo Energy & Environment
Ricardo in Confidence Ref: Ricardo/ED62657035/Draft Number 1
Figure 3-1 and 3-2 show that peak concentrations of NO and NO2 appeared to coincide with peak concentrations of CO and to some extent SO2. O3 levels are in general slightly lower during the periods when concentrations of the other pollutants are high, as the NO emitted from local emission sources tends to react fast with ozone, to form NO2. There were four periods in 2016 where higher than usual levels of pollutants were seen: February, March, and late October and December. The origin of these elevated concentrations are investigated later in the report.
3.2 Comparison with Air Quality Objectives
None of the AQS objectives for CO, SO2, NOx and PM10 were exceeded at Birmingham Airport 2 monitoring location in 2016. Details of UK air quality standards and objectives are provided in Appendix 1.
The AQS objective for hourly mean NO2 concentration is 200 µg m-3 which may be exceeded up to 18 times per calendar year. During 2016 there were no hourly mean NO2 measurements exceeding 200 µg m-3. The lower threshold of the Defra “Moderate” air quality band is 201 µg m-3 as an hourly mean. Therefore NO2 levels at stayed within the Defra “Low” band for the whole year. The AQS objective was achieved for 2016.
The annual mean AQS objective for NO2 is 40 µg m-3. This objective was also met at Birmingham Airport 2, where the calculated annual mean was 23 µg m-3.
The AQS objective for PM10 is 50 µg m-3 for the daily mean, not to be exceeded more than 35 times a year. Results show that no exceedances of this objective were registered, with a maximum daily mean of 43 µg m-3 after VCM correction. The site met the AQS objective for 24-hour mean PM10.
The annual mean AQS objective for PM10 is 40 µg m-3. The site measured an annual mean of 15 µg m-
3 after VCM correction; this objective was therefore met.
The AQS objective for maximum daily 8-hour running mean O3 is 100 µg m-3 (not to be exceeded more than 10 days a year). There were 100 occasions when any 8-hour running mean exceeded 100 100 µg m-3, on 14 separate days. Birmingham Airport 2 therefore exceeded the AQS objective for ozone on 14 days during 2016, compared with the permitted maximum of 10 days. Therefore the site did not meet the AQS objective for this pollutant. The maximum hourly mean concentration of ozone was 166 µg m-
3: this was measured registered on 19th July 2016.
Ozone is a secondary pollutant; it is formed by chemical reactions in the air, involving precursor pollutants, rather than emitted directly from source. It is therefore trans-boundary in nature. As a result, Local Authorities have little control over ozone concentrations in their areas. The Government has recognised the problems associated with achieving the air quality objective for ozone, and this is not included in the LAQM regime.
CO and SO2 measured at Birmingham Airport 2 met all the AQS objectives for 2016, both with zero exceedances during the year.
3.3 Temporal Variation in Pollutant Concentrations
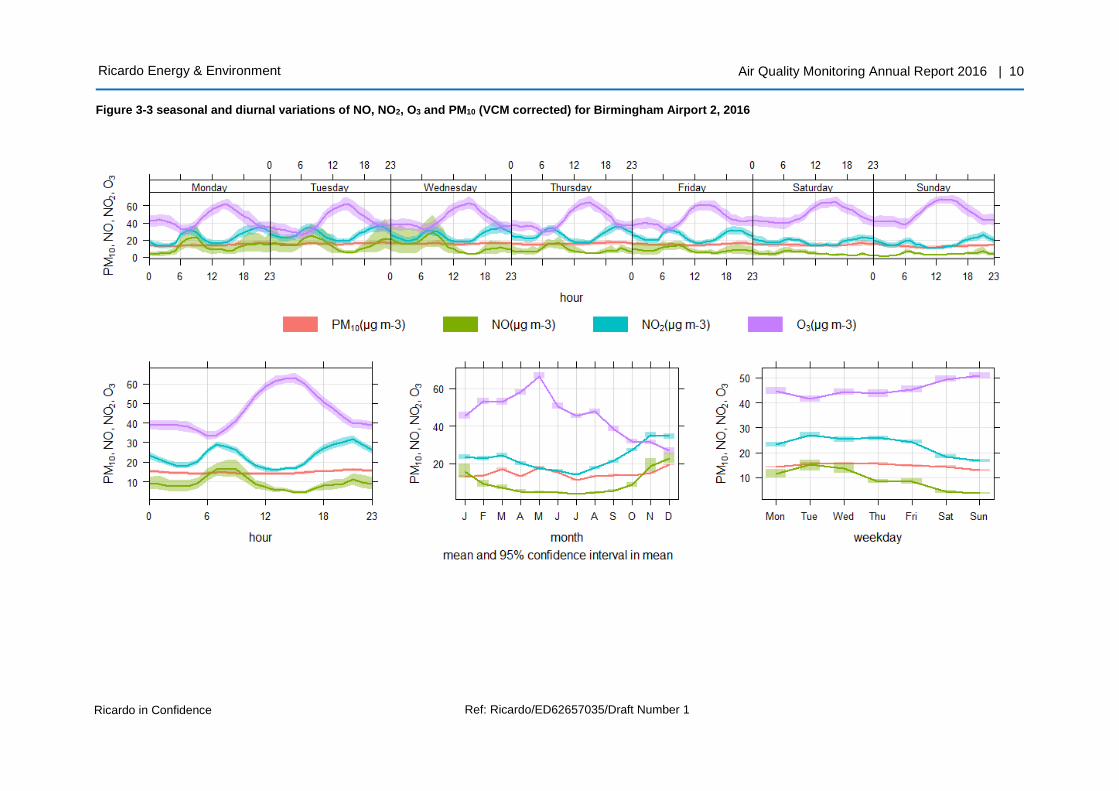
Figure 3-3 and Figure 3-4 show the variation of monthly and daily averaged NOx PM10, O3, CO and SO2 concentrations during 2016 at Birmingham Airport 2. The pollutants concentrations of CO and SO2 were normalized (the measured values were adjusted to a notionally common scale) for better visualization purposes.
Air Quality Monitoring Annual Report 2016 | 10
Ricardo Energy & Environment
Ricardo in Confidence Ref: Ricardo/ED62657035/Draft Number 1
Figure 3-3 seasonal and diurnal variations of NO, NO2, O3 and PM10 (VCM corrected) for Birmingham Airport 2, 2016

Air Quality Monitoring Annual Report 2016 | 11
Ricardo Energy & Environment
Ricardo in Confidence Ref: Ricardo/ED62657035/Draft Number 1
Figure 3-4 Seasonal and diurnal variations of CO and SO2 for Birmingham Airport 2, 2016. This has been normalised to provide a clearer view of the variations in CO and SO2.

Air Quality Monitoring Annual Report 2016 | 12
Ricardo Energy & Environment
Ricardo in Confidence Ref: Ricardo/ED62657035/Draft Number 1
3.3.1 Seasonal Variations
NOx and CO at Birmingham Airport 2 showed typical seasonal patterns for urban areas though 2016, as can be observed in the ‘month’ plots of Figure 3-3 and 3-4. The highest concentrations of these pollutants occurred during the winter months. This pattern was also observed in previous years and is typical of urban monitoring sites. The highest levels of primary pollutants tend to occur in the winter months, when emissions may be higher, and periods of cold, still weather reduce pollutant dispersion.
PM10 and SO2 seasonal patterns are much less pronounced and are masked by pollution events occurring in March and May. The NOx pattern is also affected by the March event. This peak is not representative of a typical seasonal variation, and is the result of a specific pollution episode, that is to be explained further on this report (section 3.5).
O3 concentrations registered at Birmingham Airport 2 continue to follow a typical seasonal variation for this pollutant, with higher concentrations being registered in April, May, and June. At low/mid latitudes, high O3 concentrations are generally observed during late spring and/or summer months, where anti cyclonic conditions (characterized by warm and dry weather systems) help increase photochemical reactions in the atmosphere, responsible for the increasing of ground level ozone production. In addition, the convective fluxes created during hot summer days can also be responsible for an increase of O3 (stratospheric intrusion). The hot air generated at ground level due to high temperatures is lighter and tends to ascend, being replaced by colder stratospheric air masses coming from above, dragging stratospheric O3 down into the troposphere (the lowest part of the atmosphere).
SO2 seasonal variation should follow a typical winter trend, as the major source of this pollutant is the combustion of coal and oil; this increases during winter, mainly because of domestic and industrial heating requirements. The SO2 measurements are all very low during 2016. However, some elevated periods of concentrations were observed for this pollutant in December. Those concentrations are probably related to periods of cold weather, and reduced pollutant dispersion.
3.3.2 Diurnal Variations
The diurnal variation analyses viewed in the ‘hour’ plots in Figures 3.3 and 3.4 showed typical urban area daily patterns for NO, NO2 and CO. Pronounced peaks can be seen for these pollutants during the mornings, corresponding to rush hour traffic at around 07:00-09:00. Concentrations tend to decrease during the middle of the day, with a much broader evening road traffic rush-hour peak in building up from early afternoon. NO also showed a much smaller peak than NO2 in the afternoons. This is likely to be because concentrations of oxidising agents in the atmosphere (particularly ozone) tend to increase in the afternoon, leading to enhanced oxidation of NO to NO2. A good example of this atmospheric reaction can be seen at the site. The NO concentration shows a large decrease in the early afternoon, while the concentration of O3 increases on the same proportion.
The concentration of O3 at Birmingham Airport 2 follows a typical diurnal pattern. O3 concentrations always increase during daylight hours due to the photochemical reactions of NO2 and photo oxidation of VOC’s, CO, hydrocarbons, (O3 precursors). In the afternoon/ night O3 gets consumed by a fast reaction with NO (titration of O3 by NO). The absence of sunlight prevents the photolysis of the O3 precursors.
The diurnal patterns for PM10 are determined by two main factors. The first is emissions of primary particulate matter, from sources such as vehicles. The second factor is the reaction that occurs between sulphur dioxide, NOx and other chemical species, forming secondary sulphate and nitrate particles. The PM10 at this site did not show any rush-hour peaks during 2016.
The SO2 diurnal pattern appears to follow the ozone profile, building up on the early morning, with a major peak in the late afternoon, which can indicate that the pattern of this pollutant is not majorly dependent on the same type of anthropogenic activities that influence the other pollutants (mainly traffic), and more dependent of atmospheric dispersion processes.
3.3.3 Weekly Variations
The analyses of each pollutants weekly variation showed that the same type of diurnal patterns occur for all the days of the week. NO, NO2 and CO early morning and late afternoon rush hour peaks are in general much more pronounced on the early days of the week (Monday, Tuesday), that at the end of the week (Friday), and much less pronounced during the weekends. PM10 concentrations don’t appear to vary much during the week.

Air Quality Monitoring Annual Report 2016 | 13
Ricardo Energy & Environment
Ricardo in Confidence Ref: Ricardo/ED62657035/Draft Number 1
Saturday registers the lowest concentrations of CO, PM10, SO2, and NOx (NO/NO2), and the highest readings of O3.
The SO2 weekly pattern appears to show that the highest concentrations occur on a Monday, starting to decrease up until Friday, and starting to build up again during the weekend.
3.4 Source Investigation
In order to investigate the possible sources of air pollution being monitored around Birmingham Airport, real meteorological data measured at the Airport was used to add a directional component to the air pollutant concentrations.
Figure 3-5 shows the wind speed and direction data, measured at Birmingham Airport 2. The lengths of the “spokes” against the concentric circles indicate the percentage of time during the year that the wind was measured from each direction. The prevailing wind can be seen to be coming from the south west. Each “spoke” is divided into coloured sections representing wind speed intervals of 2 m s -1 as shown by the scale bar in the plot. The mean wind speed was 3.55 m s-1. The maximum measured wind speed was 12.90 m s-1. Some of the highest wind speeds occurred between the months of January and March.
Figure 3-5 Wind rose showing the wind speeds and directions at Birmingham Airport 2 in 2016.
Figures 3-6 to 3-11 show bivariate plots of hourly mean concentrations of NO, NO2, PM10, CO, SO2 and O3 at Birmingham Airport 2 against wind speed and wind direction. These plots should be interpreted as follows:
The wind speed is indicated by the distance from the centre of the plot; the grey circles indicate wind speeds in 2 m s-1 intervals.
The pollutant concentration is indicated by the colour (as indicated by the scale).
These plots therefore show how pollutant concentrations varied with wind direction and wind speed.
The plots do not show distance of pollutant emission sources from the monitoring site. However, in the case of primary pollutants such as NO, the concentrations at very low wind speeds are dominated by emission sources close by, while at higher wind speeds, effects are seen from sources further away.

Air Quality Monitoring Annual Report 2016 | 14
Ricardo Energy & Environment
Ricardo in Confidence Ref: Ricardo/ED62657035/Draft Number 1
Figure 3-6 Pollution rose for NO at Birmingham Airport, 2016
Figure 3-7 Pollution rose for NO2 at Birmingham Airport, 2016

Air Quality Monitoring Annual Report 2016 | 15
Ricardo Energy & Environment
Ricardo in Confidence Ref: Ricardo/ED62657035/Draft Number 1
Figure 3-8 Pollution rose for PM10 (VCM corrected) at Birmingham Airport, 2016
Figure 3-9 Pollution rose for CO at Birmingham Airport, 2016

Air Quality Monitoring Annual Report 2016 | 16
Ricardo Energy & Environment
Ricardo in Confidence Ref: Ricardo/ED62657035/Draft Number 1
Figure 3-10 Pollution rose for O3 at Birmingham Airport, 2016
Figure 3-11 Pollution rose for SO2 at Birmingham Airport, 2016
NO (which, like CO and SO2, is a “primary” pollutant i.e. one emitted directly from source rather than formed from chemical reactions in the air) shows a clear pattern of highest concentrations in the centre of the plot, i.e. associated with low wind speeds. Such calm conditions will have allowed NO emitted from nearby sources - probably aircraft and airside vehicles to build up, reaching relatively high concentrations.
For NO2, which has both a primary and secondary component, there is some trace evidence of sources to the north west and south east, the direction of the Birmingham residential areas and the A45 –Coventry Road. However, the highest concentrations registered in 2016 appear to be originated at low wind speeds, which clearly indicates that most of the NO2 measured has its origin from local emission sources, and mainly by the fast reaction of NO with O3 in the presence of UV light.
The pollution rose for VCM-corrected PM10 shows a major contribution from the east of the site, the direction of the M42. The highest concentrations appear to occur at higher wind speeds from this direction – this could perhaps have included some wind-blown dust coming from the car park.

Air Quality Monitoring Annual Report 2016 | 17
Ricardo Energy & Environment
Ricardo in Confidence Ref: Ricardo/ED62657035/Draft Number 1
As with previous years the plot of CO shows that the highest concentrations are in the centre of the plot (i.e. when wind speeds are low) with lower concentrations as wind speeds increase to the north west and south east. This is in line with what is observed for NO suggesting that the pollutants come from the same emission source.
The bivariate plot for O3 shows a contrasting pattern to that of the other pollutants in that the lowest ozone concentrations are associated with calm conditions. Being a secondary pollutant ozone is formed from chemical reactions in the ambient air. The plot demonstrates that higher concentrations of ozone are measured at the site when wind speeds are sufficient to bring in ozone-rich air from other areas of the region. At very low wind speeds, when NO concentrations are highest, any ozone present reacts with the NO emitted by the sources in the immediate vicinity. This illustrates that the exceedances of the AQS objectives for ozone are not a direct result of Birmingham Airport’s activities but reflect regional ozone concentrations.
The pollution rose for SO2 shows a very different pattern. SO2 emissions appear to originate from multiple sources. The highest concentrations appear to come from the east for wind speeds over 10 ms-1. Several other “moderate” sources appear to be visible coming from the south west, the direction of the runways. However, there is no clear directional pattern and SO2 concentrations remain low.
3.5 Periods of Elevated Pollutant Concentration
This section reviews the most significant periods of high air pollution concentrations for the whole year. It is important to stress that, despite there being some periods when pollutant concentrations exceeded the applicable air quality objectives at Birmingham Airport 2, these were all attributable to specific external sources. The historic Air Quality Index data presented at the Department of Environment, Food & Rural Affairs (Defra) UK-AIR website9 shows that the air quality index band ranged from 4 (Moderate) to 10 (Very High) for most of the UK regions during three events, late January, early March and late October. These pollution episodes coincide with periods of elevated PM and NOx concentrations measured in Birmingham Airport 2, and explanations for these pollution events follow below:
- The pollution event of the 20th of January was mainly confined to the south east and midlands areas. Wind speed data shows calm conditions which would have allowed the build-up of local emissions.

Air Quality Monitoring Annual Report 2016 | 18
Ricardo Energy & Environment
Ricardo in Confidence Ref: Ricardo/ED62657035/Draft Number 1
- The period between Thursday 10th and Sunday 13thof March saw elevated, 'High' and 'Very High' PM levels over almost all of eastern England and stretching into the west midlands and south west. This pattern is often associated with the importing of pollution from the near continent.
- On the weekend of Saturday 29th – Sunday 30th October 'Moderate' PM10 and PM2.5 were recorded. Many other monitoring sites around the UK also recorded high concentrations of particulate pollution at the end of October and beginning of November. This coincided with several occasions often celebrated with fireworks: the Hindu festival of Diwali (which this year began on Sunday 30th October), Halloween on 31st October and Guy Fawkes Night on Saturday 5th November. The weather was dry and still at this time, and it is likely that firework displays and bonfires may have contributed to PM concentrations.

Air Quality Monitoring Annual Report 2016 | 19
Ricardo Energy & Environment
Ricardo in Confidence Ref: Ricardo/ED62657035/Draft Number 1
3.6 Comparison with Other Local Monitoring Sites
Table 3-2 compares the annual mean concentrations at Birmingham Airport with other air quality monitoring sites in Birmingham. The sites selected are all part of the UK’s national Automatic Urban and Rural Network (AURN) and are as follows:
Birmingham Tyburn: An urban background site, located within the car park of council owned offices.
Birmingham Tyburn Roadside (closed Sept 16) / Birmingham A4540 Roadside (opened 9th Sept 2016): An urban traffic site located on the south side of the A38 in Tyburn outside council owned offices, and approximately 700 metres to the north of the M6 motorway. The site was relocated part way through the year to a location on the east side of the A4540 in Bordesley.
Birmingham Acocks Green: Another urban background site, located within the grounds of an annex to a large school near Shirley Road.
Table 3-2 Annual means for Birmingham Airport 2 and three local AURN monitoring sites, 2016. Units µg m-3 for all pollutants except CO which is in mg m-3.
Pollutant Birmingham
Airport 2 Birmingham
Tyburn
Birmingham Tyburn
Roadside#
Birmingham A4540
Roadside#
Birmingham Acocks Green
PM10 15* 16 18 16 -
NO2 23 29 43 43 21
O3 46 40 37 21 42
SO2 1 1 - - -
CO 0 - - - -
* VCM corrected using FDMS data from AURN sites # Low data capture. Monitoring site not open for full year. Average provided for information only.
The annual mean concentration of PM10 measured at the Birmingham Airport site in 2016 was comparable with those measured at the other Birmingham sites. As in previous years, the annual mean concentration of SO2 at Birmingham Airport was low, and this year was the same as that measured at Birmingham Tyburn. The annual mean concentrations of NO2 and O3 measured at Birmingham Airport 2 were comparable with those measured in Acocks Green, an urban background site located far away from busy roads.
Concentrations of O3 are typically higher in rural areas, far away from sources of other pollutants such as NO (which removes O3 from the air by chemical reaction). The annual mean ozone concentration at Birmingham Airport is comparable to those measured at Birmingham Acocks Green and Birmingham Tyburn: ozone concentrations at the two roadside sites are lower.
These statistics together indicate that the pollution levels registered at Birmingham Airport 2 were consistent with those measured elsewhere in the city in 2016.

Air Quality Monitoring Annual Report 2016 | 20
Ricardo Energy & Environment
Ricardo in Confidence Ref: Ricardo/ED62657035/Draft Number 1
4 Conclusions
The following conclusions have been drawn from the results of air quality monitoring at Birmingham Airport during 2016.
Oxides of nitrogen, particulate matter (as PM10), carbon monoxide (CO), sulphur dioxide (SO2) and ozone (O3) were monitored throughout 2016 at one monitoring site in Birmingham Airport (Birmingham Airport 2. The conclusions of the 2016 monitoring programme are summarised below.
1. Data capture of greater than 99% was achieved for all pollutants.
2. The maximum hourly mean NO2 concentration measured at the site was 117 µg m-3. This is less than the hourly mean AQS objective of 200 µg m-3 (which may be exceeded up to 18 times per year). The site therefore met the AQS objective for hourly mean NO2 in 2016.
3. The annual mean NO2 concentration measured at the site was 23 µg m-3. The site therefore met the AQS objective of 40 µg m-3 for annual mean NO2 in 2016.
4. Ozone exceeded the AQS objective of 100 ug m-3 as a maximum daily 8 hour mean, on 14 days in 2016. This is more than the permitted 10 days per calendar year. The AQS objective for O3 was therefore not met in 2016.
5. The site met the AQS objective for 24-hour mean of 50 µg m-3 (not to be exceeded more than 35 times a year) and annual mean of 40 µgm-3 for PM10. The particulate matter was measured using a TEOM instrument and VCM correction applied.
6. Seasonal variations in pollutant concentrations at Birmingham Airport 2 show that NO, NO2 and CO exhibited higher concentrations during the winter months. PM10, which has primary and secondary components, showed no obvious seasonal pattern. Ozone levels were highest during the spring and summer, as is typical. SO2 showed a pronounced peak in May (when compared with the values registered at the other months), but the concentrations are still low.
7. The diurnal patterns of concentrations of all pollutants were similar to those observed at other urban monitoring sites. Peak concentrations of NO, NO2, particulate matter and CO coincided with the morning and evening rush hour periods, and levels of ozone peaked in the afternoons. SO2 daily patterns seems to follow ozone, with a unique peak value in the late afternoon, which can indicate that this pollutant is influenced by other anthropogenic emissions, different from the ones influencing NOx and CO.
8. Some periods of elevated PM10 concentration occurred at regional and national level during 2016. These periods are consistent with some of the higher concentrations measured at Birmingham Airport 2, and therefore reflect regional variations in PM10 concentration, rather than any emission sources specific to the airport.
9. Meteorological data was used at Birmingham Airport 2, allowing the effect of wind direction and speed to be investigated. Bivariate plots of NO, NO2 concentration and wind data showed that concentrations of these pollutants at the monitoring site were typically highest in calm conditions, indicating that the main sources of these pollutants were nearby. The pattern was slightly different for PM10, with a strong signal also appearing from the east at higher wind speeds. CO concentrations appear to follow a similar profile to NO2, showing that its origin is both local and long range. SO2 emissions seem to originate from multiple sources, with some coming from the west, at moderate wind speeds, and several other contributions from the south west, the direction of the runways.Mean concentrations of pollutants at the three Birmingham AURN sites in 2016 were comparable with those measured at Birmingham Airport 2, especially the urban background monitoring station at Acocks Green.

Air Quality Monitoring Annual Report 2016 | 21
Ricardo Energy & Environment
Ricardo in Confidence Ref: Ricardo/ED62657035/Draft Number 1
5 References
1. Directive 2008/50/EC of the European Parliament and of the Council of 21st May 2008 on ambient air quality and cleaner air for Europe [online]. Official Journal of the European CommunitiesL152/1.Available at: http://ec.europa.eu/environment/air/quality/legislation/existing_leg.htm [Accessed 22nd April 2016].
2. Commission Directive (EU) 2015/1480 of 28 August 2015 amending several annexes to Directives 2004/107/EC and 2008/50/EC of the European Parliament and of the Council laying down the rules concerning reference methods, data validation and location of sampling points for the assessment of ambient air quality (Text with EEA relevance). Available from http://data.europa.eu/eli/dir/2015/1480/oj [Accessed 27th March 2017].
3. Department for Environment, Food and Rural Affairs (2007). The Air Quality Strategy for England, Scotland, Wales and Northern Ireland (Volume 1) [online]. London, UK: Department for Environment, Food and Rural Affairs in partnership with the Scottish Executive, Welsh Assembly Government and Department of the Environment Northern Ireland. Available at: https://www.gov.uk/government/uploads/system/uploads/attachment_data/file/69336/pb12654-air-quality-strategy-vol1-070712.pdf [Accessed 22nd April 2016]. Also original Air Quality Strategy published 2000 and addendum 2003.
4. Air Quality Expert Group (2004) Nitrogen dioxide in the United Kingdom [online]. London, UK: Department for Environment, Food and Rural Affairs. Available at: http://uk-air.defra.gov.uk/library/aqeg/publications [Accessed 22nd April 2016].
5. National Atmospheric Emissions Inventory (2013). NAEI UK National Atmospheric Emissions Inventory [online]. Available at http://naei.defra.gov.uk/ [Accessed 22nd April 2016].
6. Department for Environment, Food and Rural Affairs (2009). QA/QC procedures for the UK Automatic and Urban Rural Air Quality Monitoring Network (AURN) [online]. London, UK: Department for Environment, Food and Rural Affairs and the Devolved Administrations. Available:http://ukair.defra.gov.uk/reports/cat13/0910081142_AURN_QA_QC_Manual_Sep_09_FINAL.pdf [Accessed 22nd April 2016].
7. King’s College London Volatile Correction Model available at http://www.volatile-correction-model.info/Default.aspx . July 2008. (Accessed 22nd April 2016).
8. Department for Environment, Food and Rural Affairs (2016). Part IV of the Environment Act 1995. Local air quality management - Technical Guidance LAQM.TG (16) [online]. London, UK: Department for Environment, Food and Rural Affairs in partnership with the Scottish Executive, Welsh Assembly Government and Department of the Environment Northern Ireland. Available from: https://laqm.defra.gov.uk/documents/LAQM-TG16-April-16-v1.pdf [Accessed 15th March 2017].
9. Air Quality Index. UK-air Website [online]. Available at: http://uk-air.defra.gov.uk/latest/index?date=01%2F04%2F2014#summary [Accessed 27th March 2017].

Air Quality Monitoring Annual Report 2016
Ricardo in Confidence Ref: Ricardo/ED62657035/Draft Number 1
Ricardo Energy & Environment
Appendices
Appendix 1: Air Quality objectives and Index bands
Appendix 2: Monitoring apparatus and techniques
Appendix 3: Location of the AQ monitoring site
Appendix 4: Statistical Summary (2006 – 2016)

Air Quality Monitoring Annual Report 2016
Ricardo in Confidence Ref: Ricardo/ED62657035/Draft Number 1
Ricardo Energy & Environment
Appendix 1 - Air Quality objectives and Index bands
Table A1.1: UK air quality objectives for protection of human health, July 2007.
Pollutant Air Quality objective Date to be achieved
by Concentration Measured as
Benzene
All authorities
16.25 µg m-3 Running annual mean 31/12/2003
England and Wales only
5.00 µg m-3 Annual mean 31/12/2010
Scotland and Northern Ireland
3.25 µg m-3 Running annual mean 31/12/2010
1,3-Butadiene 2.25 µg m-3 Running annual mean 31/12/2003
Carbon monoxide
England, Wales and Northern Ireland
10.0 mg m-3 Maximum daily running 8-hour mean
31/12/2003
Scotland 10.0 mg m-3 Running 8-hour mean 31/12/2003
Lead 0.5 µg m-3 Annual mean 31/12/2004
0.25 µg m-3 Annual mean 31/12/2008
Nitrogen dioxide 200 µg m-3 not to be exceeded more than
18 times a year
1-hour mean 31/12/2005
40 µg m-3 Annual mean 31/12/2005
Particles (PM10) (gravimetric)
All authorities
50 µg m-3, not to be exceeded more than
35 times a year
24-hour mean 31/12/2004
40 µg m-3 Annual mean 31/12/2004
Scotland 50 µg m-3, not to be exceeded more than 7
times a year
24-hour mean 31/12/2010
18 µg m-3 Annual mean 31/12/2010
Particles (PM2.5) (gravimetric)*
All authorities
25 µg m-3 (target) Annual mean 2020
15% cut in urban background exposure
Annual mean 2010-2020
Scotland only 12 µg m-3 (limit) Annual mean 2020

Air Quality Monitoring Annual Report 2016
Ricardo in Confidence Ref: Ricardo/ED62657035/Draft Number 1
Ricardo Energy & Environment
Sulphur dioxide 350 µg m-3, not to be exceeded more than
24 times a year
1-hour mean 31/12/2004
125 µg m-3, not to be exceeded more than 3
times a year
24-hour mean 31/12/2004
266 µg m-3, not to be exceeded more than
35 times a year
15-minute mean 31/12/2005
PAH* 0.25 ng m-3 Annual mean 31/12/2010
Ozone* 100 µg m-3 not to be exceeded over 10
days a year
8-hour mean 31/12/2005
* Not included in regulations.
Table A1.2: UK air quality objectives for protection of vegetation and ecosystems, July 2007
Pollutant Air Quality objective Date to be achieved by Concentration Measured as
Nitrogen oxides measured as NO2
30 µg m-3 Annual mean 31st December 2000
Sulphur dioxide 20 µg m-3 Annual mean 31st December 2000
20 µg m-3 Winter average (October to March)
31st December 2000
Ozone 18 µg m-3 AOT40+, calculated from 1-hour values
May to July. Mean of 5 years, starting 2010
1st January 2010
+ AOT40 is the sum of the differences between hourly concentrations greater than 80 µg m-3 (= 40 ppb) and 80 µg m-3 over a given period using only 1-hour averages measured between 08:00 and 20:00.

Air Quality Monitoring Annual Report 2016
Ricardo in Confidence Ref: Ricardo/ED62657035/Draft Number 1
Ricardo Energy & Environment
Defra Air Pollution bands and index values
Table A1.3: Air pollution bandings and descriptions.
Banding Index Accompanying health messages for at-risk individuals* Accompanying health messages for the general population
Low
1
Enjoy your usual outdoor activities. Enjoy your usual outdoor
activities. 2
3
Moderate
4 Adults and children with lung problems, and adults with heart problems, who experience symptoms, should consider reducing strenuous physical activity,
particularly outdoors.
Enjoy your usual outdoor
activities. 5
6
High
7 Adults and children with lung problems, and adults with heart problems, should reduce strenuous physical
exertion, particularly outdoors, and particularly if they experience symptoms. People with asthma may find they need to use their reliever inhaler more often. Older people should also reduce physical exertion.
Anyone experiencing discomfort such as sore eyes, cough or sore throat should consider reducing
activity, particularly outdoors.
8
9
Very high 10
Adults and children with lung problems, adults with heart problems, and older people, should avoid
strenuous physical activity. People with asthma may find they need to use their reliever inhaler more often.
Reduce physical exertion,
particularly outdoors, especially if you experience symptoms such as cough or sore throat.

Air Quality Monitoring Annual Report 2016
Ricardo in Confidence Ref: Ricardo/ED62657035/Draft Number 1
Ricardo Energy & Environment
Appendix 2 - Monitoring apparatus and techniques
Monitoring Equipment
The following continuous monitoring methods were used at the Birmingham Airport 2 air quality monitoring station:
NO, NO2: chemiluminescence with ozone.
PM10: Tapered Element Oscillating Microbalance (TEOM).
O3: UV absorption analyser.
CO: Non dispersive infrared absorption (NDIR)
SO2: Ultraviolet Fluorescence (UVF)
These methods were selected in order to provide real-time data. The chemiluminescence and the UV absorption analysers are the European reference method for ambient NO2 and O3 monitoring.
The chemiluminescence with ozone analyser is based on the principle that nitric oxide (NO) and ozone react to produce excited NO2 molecules, which emit infrared photons (represented in the equation below
by the photon’s energy, hν,) when going back to lower energy states:
NO + O3 → [NO2]* + O2 -→ NO2 + O2 + hν
A stream of purified air (dried with a NafionTM Dryer) passing through a silent discharge ozonator generates the ozone concentration needed for the chemiluminescent reaction. The specific luminescence signal intensity is therefore proportional to the NO concentration. A photomultiplier tube amplifies this signal. NO2 is detected as NO after reduction in a molybdenum (Mo) converter heated at about 325 °C. The ambient air sample is drawn into the analyser, flows through a capillary, and then to a valve, which routes the sample either straight to the reaction chamber (NO detection), or through the converter and then to the reaction chamber (NOX detection). The calculated NO and NOX concentrations are stored and used to calculate NO2 concentrations (NO2 = NOx - NO), assuming that only NO2 is reduced in the Mo converter.
The UV absorption analyser determines ozone concentrations by measuring the absorption of O3 molecules at a wavelength of 254 nm (UV light) in the absorption cell, followed by the use of the Beer-Lambert law. The concentration of ozone is related to the magnitude of the absorption. The reference gas, generated by scrubbing ambient air, passes into one of the two absorption cells to establish a zero light intensity reading, I0. Then the sample passes through the other absorption cell to establish a sample light intensity reading, I. This cycle is reproduced with inverted cells. The average ratio R=I/I0 between 4 consecutive readings is directly related to the ozone concentration in the air sample through the Beer-Lambert law.
The Non-Dispersive Infra-Red (NDIR) detectors are the industry standard method of measuring the concentration of carbon monoxide (CO). Each constituent gas in a sample will absorb some infra-red at a particular frequency. By shining an infra-red beam through a sample cell (containing CO), and measuring the amount of infra-red absorbed by the sample at the necessary wavelength, a NDIR detector is able to measure the volumetric concentration of CO in the sample.
The Ultraviolet Fluorescence analyser determines SO2 by, at first, scrubbing the air flow to eliminate aromatic hydrocarbons. The air sample is then directed to a chamber where it is irradiated at 214 nm (UV), a wavelength where SO2 molecules absorb. The fluorescence signal emitted by the excited SO2 molecules going back to the ground state is filtered between 300 and 400 nm (specific of SO2) and amplified by a photomultiplier tube. A microprocessor receives the electrical zero and fluorescence reaction intensity signals and calculates SO2 based on a linear calibration curve.
The analysers for NOx, O3, CO and SO2 are equipped with an automatic calibration system, which is triggered daily under the control of the data logger. Fully certificated calibration gas cylinders are also used at each site for manual calibration.

Air Quality Monitoring Annual Report 2016
Ricardo in Confidence Ref: Ricardo/ED62657035/Draft Number 1
Ricardo Energy & Environment
Each analyser provides a continuous output, proportional to the pollutant concentration. This output is recorded and stored every 10 seconds, and averaged to 15 minute average values by the on-site data logger. This logger is connected to a modem and interrogated twice daily, by telephone, to download the data to Ricardo Energy & Environment. The data are then converted to concentration units and averaged to hourly mean concentrations.
The TEOM measures the mass collected on an exchangeable filter cartridge by monitoring the frequency changes of a tapered element. The sample flow passes through the filter, where particulate matter is collected, and then continues through the hollow tapered element on its way to an electronic flow control system and vacuum pump. As more mass collects on the exchangeable filter, the tube's natural frequency of oscillation decreases. A direct relationship exists between the tube's change in frequency and mass on the filter. The TEOM mass transducer does not require recalibration because it is designed and constructed from non-fatiguing materials. However, calibration is yearly verified using a filter of known mass. The PM10 TEOM analyser cannot be calibrated in the same way as the gas analysers and these data are scaled using the results of 6-monthly checks. In these checks, the flow rate through the analyser is measured and the mass determination checked with pre-weighed filters.
The PM10 monitoring data recorded by TEOM monitors were corrected with the King’s College Volatile Correction Model (VCM) 6. This online tool allows TEOM measurements to be corrected for the loss of volatile components of particulate matter that occur due to the high sampling temperatures employed by this instrument. The resulting corrected measurements have been demonstrated as equivalent to the gravimetric reference equivalent.
The VCM works by using the volatile particulate matter measurements provided by nearby FDMS (Filter Dynamic Measurement System) instruments (within 130 km) to assess the loss of PM10 from the TEOM; this value is then added back onto the TEOM measurements.
Air Quality Monitoring Annual Report 2016
Ricardo in Confidence Ref: Ricardo/ED62657035/Draft Number 1
Ricardo Energy & Environment
Appendix 3 – Location of the AQ monitoring site
Figure A3.1 – Location (current and pre-2006) of Birmingham Airport monitoring station
Current AQ location
Previous AQ location

Air Quality Monitoring Annual Report 2016
Ricardo in Confidence Ref: Ricardo/ED62657035/Draft Number 1
Ricardo Energy & Environment
Appendix 4 – Statistical summary 2006 - 2016
Figure A4.1 – Statistical summary of pollution data for Birmingham Airport monitoring site (2006-2016)
Statistic PM10
(µgm-3)†
NOx
(as NO2) (µgm-3)
NO
(µgm-3)
NO2 (µgm-3)
O3
(µgm-3)
SO2
(µgm-3)
CO
(mgm-3)
Benzene
(µgm-3)
2016
Max. hourly mean 917 742 410 117 166 13 2 nm
Annual mean 15 37 9 23 46 1 0 nm
Max. daily mean 43 313 164 71 97 7 1 nm
Max. running 8-hr mean - - - - 146 - 1 nm
Max. 15-min mean - - - - - 16 - nm
Data capture (%) 99.77 99.92 99.92 99.92 99.97 99.90 99.92 nm
2015
Max. hourly mean 146 485 - 109 190 16 1 nm
Annual mean 15 31 6 21 50 2 0 nm
Max. daily mean 54 167 69 61 140 8 0 nm
Max. running 8-hr mean - - - - 178 - 1 nm
Max. 15-min mean - - - - - 19 - nm
Data capture (%) 89.7 98.5 98.5 98.5 94.8 88.7 98.9 nm
2014
Max. hourly mean 349 1031 579 143 132 32 1.6 nm
Annual mean 18 39 9 25 45 2 0.2 nm
Max. daily mean 71.1 439 237 76 84 12 1 nm
Max. running 8-hr mean - - - - 116 - 1 nm
Max. 15-min mean - - - - - 37 - nm
Data capture (%) 91.3 96.9 96.9 96.9 93.3 88.3 96.7 nm
2013
Max. hourly mean 106 551 286 115 158 29 0.8 -
Annual mean 19 35 8 24 47 1 0.2 0.49**
Max. daily mean 62 224 101 69 96 8 0.4 -
Max. running 8-hr mean - 339 175 91 138 16 0.7 -
Max. 15-min mean - 657 351 128 160 37 1.4 -
Data capture (%) 95.8% 98.8% 98.8% 98.8% 99.1% 98.9% 98.9% 100%

Air Quality Monitoring Annual Report 2016
Ricardo in Confidence Ref: Ricardo/ED62657035/Draft Number 1
Ricardo Energy & Environment
2012
Max. hourly mean 157 605 321 115 158 56 1.6 -
Annual mean 18 40 10 24 41 2 0.2 0.41**
Max. daily mean 51 - - - - 11 - -
Max. running 8-hr mean - - - - 144 - 1.2 -
Max. 15-min mean - - - - - 61 - -
Data capture (%) 97 98 98 98 99 98 99 100
2011
Max. hourly mean 135 460 241 117 158 35 0.9 -
Annual mean 21 36 8 24 49 2 0.2 0.51**
Max. daily mean 71 - - - - 8 - -
Max. running 8-hr mean - - - - 136 - 0.8 -
Max. 15-min mean - - - - - 40 - -
Data capture (%) 91 96 96 96 96 96 96 92
2010
Max. hourly mean 200 682 371 159 168 32 1.5 -
Annual mean 19 46 12 28 41 2 0.2 0.8**
Max. daily mean 48 - - - - 7 - -
Max. running 8-hr mean - - - - 144 - 0.8 -
Max. 15-min mean - - - - - 32 - -
Data capture (%) 93 99 99 99 99 97 97 100
2009
Max. hourly mean 85 640 356 180 126 35 2.0 -
Annual mean 18 34 9 21 42 2 0.2 1.0*
Max. daily mean 55 - - - - 10 - -
Max. running 8-hr mean - - - - 108 - 1.6 -
Max. 15-min mean - - - - - 37 - -
Data capture (%) 92 94 94 94 94 94 94 100
2008
Max. hourly mean 305 1289 720 220 158 29 3.1
Annual mean 16 41 11 25 47 2 0.2 0.9**
Max. daily mean 61 - - - - 9 - -
Max. running 8-hr mean - - - - 152 - 2.4 -
Max. 15-min mean - - - - - 29 - -
Data capture (%) 91.3 95.6 95.6 95.6 91.5 95.6 95.6 100.0
2007
Max. hourly mean 244 932 521 145 148 43* 2.6
Annual mean 21 49 14 28 40 5* 0.2 1.0**
Max. daily mean 116 - - - - 13* -
Max. running 8-hr mean - - - - 135 - 1.6
Max. 15-min mean - - - - - 90* -
Data capture (%) 89.7 86.5 86.5 86.5 99.2 40.2 97.5 100.0

Air Quality Monitoring Annual Report 2016
Ricardo in Confidence Ref: Ricardo/ED62657035/Draft Number 1
Ricardo Energy & Environment
2006
Max. hourly mean 466 686 349 189 202 32 2.1
Annual mean 22 47 13 27 47 5 0.2 1.1**
Max. daily mean 92 - - - - 16 -
Max. running 8-hr mean - - - - 195 - 1.7
Max. 15-min mean - - - - - 43 -
Data capture (%) 90.4 79.8 79.8 79.8 93.8 91.6 93.3 100.0
† - VCM corrected 2009 onwards; * Results indicative only due to the low data capture.; ** Results based on monthly exposure periods. nm - Benzene monitoring discontinued at end of 2013.

The Gemini Building Fermi Avenue Harwell Didcot Oxfordshire OX11 0QR United Kingdom
t: +44 (0)1235 753000 e: [email protected]
ee.ricardo.com