Embed Size (px)
Citation preview

The Scottish P
SPICe Briefing
Air Quality in Scotland
10 May 2016 16/35
Flora O’Brien
Air pollution currently represents the greatest environmental threat to human health. Elevated pollution levels, usually located in urban areas with high volumes of road traffic, have been associated with a number of health issues, including heart disease and lung cancer. Air pollution can also have damaging effects on the environment and crop productivity. The sources of air pollution are distributed across many sectors, including transport, agriculture and energy industries. This briefing discusses the origins and impacts of air pollution in Scotland, with reference to the relevant legislation and the various strategies designed to improve air quality.
(Scottish Government, 2015)

2
CONTENTS
EXECUTIVE SUMMARY .............................................................................................................................................. 3
BACKGROUND............................................................................................................................................................ 4
List of abbreviations ............................................................................................................................................. 4 THE MAIN AIR POLLUTANTS AND THEIR PRINCIPAL SOURCES ..................................................................... 5 THE COST OF AIR POLLUTION ............................................................................................................................. 8
Health Impacts ..................................................................................................................................................... 8 Environmental and Agricultural Impacts ............................................................................................................ 10
AIR QUALITY LEGISLATION .................................................................................................................................... 12
Trans-Atlantic agreements ................................................................................................................................. 12 Box 1. European Commission Directives........................................................................................................... 13 Box 2. EC Directive Definitions ......................................................................................................................... 14 UK ...................................................................................................................................................................... 14 Scotland ............................................................................................................................................................. 15 WHO guidelines ................................................................................................................................................. 16 Box 3. Legal Action: ClientEarth UK vs. Government ....................................................................................... 17
AIR POLLUTION TRENDS IN SCOTLAND .............................................................................................................. 18
Particulate Matter ............................................................................................................................................... 19 Nitrogen dioxide ................................................................................................................................................. 20 Sulphur dioxide .................................................................................................................................................. 20 Ammonia ............................................................................................................................................................ 21
AIR QUALITY POLICIES ........................................................................................................................................... 22
SCOTLAND ............................................................................................................................................................ 22 TRANSPORT ......................................................................................................................................................... 23
The Impact of Dieselisation ................................................................................................................................ 24 Box 4. The Volkswagen Affair ........................................................................................................................... 25 Emissions testing ............................................................................................................................................... 26 Diesel particulate filters and Selective Catalytic Reduction ............................................................................... 26 Non-exhaust emissions ...................................................................................................................................... 27 Congestion charges and Low Emission Zones (LEZs) ...................................................................................... 27 Electric vehicles ................................................................................................................................................. 28
ACTIVE TRAVEL .................................................................................................................................................... 28 Cycling................................................................................................................................................................ 28
AGRICULTURE ...................................................................................................................................................... 29 Box 5. Air pollution strategies abroad ................................................................................................................ 31 Beijing, China ..................................................................................................................................................... 31 Milan, Italy .......................................................................................................................................................... 31
ENERGY PRODUCTION ....................................................................................................................................... 32 URBAN PLANNING................................................................................................................................................ 33
AIR POLLUTION AND CLIMATE CHANGE ............................................................................................................. 34
CRITICISMS OF AIR QUALITY GOVERNANCE IN THE UK & SCOTLAND .......................................................... 34
UK ...................................................................................................................................................................... 34 Scotland ............................................................................................................................................................. 35
SOURCES .................................................................................................................................................................. 36
RELATED BRIEFINGS .............................................................................................................................................. 52

3
EXECUTIVE SUMMARY
Air pollution now represents the greatest global environmental risk to human health. Poor air quality is linked to a growing number of health problems, including lung cancer and cardiovascular disease, culminating in millions of premature deaths every year. In the UK alone, air pollution is now estimated to cause 40,000 deaths each year. The groups most vulnerable to air pollution are children, the elderly and those with pre-existing medical conditions. The economic costs of air pollution are accumulated in health care, loss of workdays through sick leave, rehabilitation of the environment and damaged buildings, and reductions in crop yield.
Over recent years the profile of air quality has risen in the media, with events such as the VW emissions controversy and the EU infraction case against UK Government for breaching air pollution limits placing it at the forefront of the news. Since many air pollutants are also greenhouse gases, there is an opportunity for policymakers to address both air pollution and climate change simultaneously. This could benefit the health of humans and the environment alike, but it requires a coordinated and concerted effort across multiple sectors, particularly transport, agriculture and the energy industry.
The pollutants currently of greatest concern are nitrogen oxides and particulate matter, as these are believed to be most damaging to human health. The transport sector is the biggest source of these emissions, and is targeted by many air quality campaign groups. However, some experts believe that policymakers should turn their attention to agricultural emissions of ammonia, which have largely been neglected.
Scotland has recognised the problem of air pollution, becoming the first country in Europe to adopt the WHO recommended limit for PM2.5 in April 2016. However, many parts of Scotland still have air pollution levels above the limits contained in Scotland’s air quality regulations, which are not legally binding.
This briefing explores air quality in Scotland, focussing on human and environmental health impacts, trends in emissions and the various legislation, policies and strategies employed to reduce them.

4
BACKGROUND
The term “smog” was first used to describe the Glasgow pollution episode of 1909 which caused over 1,000 deaths (CCPS, 2006). The issue worsened in the UK over the following decades, culminating in the London smog of December 1952 which killed an estimated 12,000 people, and was so dense that cows reportedly choked to death in fields and public transport virtually came to a standstill (Met Office, 2015, Bell et al, 2004). This triggered the passing of the first Clean Air Act in 1956 which banned emissions of black smoke and paved the way for legislation on air pollution (UK Government, 1956). In many respects, UK air quality has vastly improved since then. The phasing out of sulphur-rich coal and the transition to unleaded petrol and low-sulphur diesel, have resulted in dramatic reductions in sulphur dioxide and lead emissions (Royal College of Physicians (RCP), 2016). This, and more recent examples such as the indoor smoking ban (Scottish Government, 2005, UK Government, 2006) demonstrate that policies and legislation can prove highly effective in improving air quality. However, much of the UK is still exceeding air quality limits, largely due to increases in road transport, which now represents the largest single source of air pollution. Indeed, road transport accounts for 33% of nitrogen oxides (NOx) emissions and at least 21% of coarse particulate matter (PM10), and represents the main source of pollution in 92% of all Air Quality Management Areas (AQMAs) in the UK (Faulkner and Russell, 2010). Nevertheless, there are other sectors which have a role to play in reducing air pollution, as Dr Carlos Dora (Coordinator for Public Health, Environmental and Social Determinants of Health for the World Health Organisation (WHO), 2014) highlighted:
“Excessive air pollution is often a by-product of unsustainable policies in sectors such as transport, energy, waste management and industry. In most cases, healthier strategies will also be more economical in the long term due to health-care cost savings as well as climate gains.”
List of abbreviations
AQMAs = Air Quality Management Areas CAFS = “Cleaner Air for Scotland: The Road to a Healthier Future” CO = Carbon monoxide CO2 = Carbon dioxide COMEAP = Committee on the Medical Effects of Air Pollution EC = European Commission FoES = Friends of the Earth Scotland LAQM = Local Air Quality Management NH3 = Ammonia NHx = collective term for ammonium (NH4
+) and ammonia (NH3) NMVOCs = Non-Methane Volatile Organic Compounds NOx = collective term for nitrogen oxides NO2 = Nitrogen dioxide PHE = Public Health England PM = Particulate matter RCP = Royal College of Physicians RoTAP = Review of Transboundary Air Pollution SEPA = Scottish Environment Protection Agency SO2 = Sulphur dioxide SOx = collective term for sulphur oxides WHO = World Health Organisation

5
THE MAIN AIR POLLUTANTS AND THEIR PRINCIPAL SOURCES
Air pollution is defined as the “contamination of the indoor or outdoor environment by any chemical, physical or biological agent that modifies the natural characteristics of the atmosphere” (WHO, 2016). This includes a variety of gases and particulates that can be detrimental to human health, ecosystems and agricultural crops (Natural Hazards Partnership, 2015). The main sources of air pollutants and the subsequent effects are listed below and summarised in Figure 1 (page 7): Nitrogen oxides (NOx) which includes:
Nitric oxide (NO) and nitrogen dioxide (NO2): mainly from transport (diesel combustion), power stations and domestic combustion (e.g. gas boilers).
Nitrous oxide (N2O): mainly from agriculture (fertilisers and manure), and around 20% from industrial processes and road transport (IPCC, 2007). Leads to the formation of ground-level ozone (O3).
Particulate matter (PM):
PM comprises a concoction of solid and liquid particles mainly consisting of ammonium, nitrate, sulphate, metals, and organic materials.
Also includes black carbon (soot): emitted from diesel engines, residential heating, energy production from oil and coal, and is the most strongly light-absorbing component of PM, with an estimated global warming effect up to 1,500 times higher than CO2 (US EPA, 2012, Scottish Government, 2015b).
Either classed as primary (emitted directly at source) or secondary (formed in the atmosphere from chemical reactions between pollutant gases such as NH3, SO2 and NOx).
Classified according to size of particle:
Coarse particles (PM10): Particles with a diameter up to 10 micrometres (µm). Sources: Road dust, brake and tyre wear, sea salt, quarries, construction, soil. Small enough to get into the lungs.
Fine particles (PM2.5): Between 1 and 2.5 µm diameter Sources: Diesel exhaust, bonfires, domestic combustion, brake and tyre wear. Small enough to penetrate deep into the lung.
Ultra-fine particles (PM<0.1): Sources: Diesel engine exhausts (almost pure carbon). Potentially small enough to enter the blood stream.
Sulphur dioxide (SO2):
Sources: Fuel combustion (coal, oil or gas) by power stations. About 1% from road transport.
Causes winter-time smog, acid rain and respiratory problems (wheezing, asthma attacks).
Ammonia (NH3):
Main source: agriculture (manure, ruminant livestock, fertilisers and slurry management). Smaller amounts from transport and waste disposal.
Ozone (O3)
Secondary pollutant produced indirectly by the reaction between NO2 and hydrocarbons (e.g. VOCs) in sunlight (Avnery et al, 2011).
Known as tropospheric ozone (as opposed to stratospheric ozone which protects the Earth from the sun’s radiation).

6
310 times the global warming potential of CO2.
Causes inflammation of the respiratory tract, irritation of the eyes, nose and throat, and coughing.
Volatile organic compounds (VOC’s)
Covers a range of chemicals, including Benzene and 1,3-Butadiene.
Sources: household products (aerosols, paints, disinfectants etc.), domestic and industrial combustion and petrol car exhausts.
Carbon monoxide (CO)
Sources: incomplete combustion of fossil fuels (mainly from road transport, but also industrial and domestic combustion).
Toxic organic micropollutants (TOMPs)
Sources: incomplete combustion of fuels, pesticides and solvents, pharmaceuticals, and industrial chemicals.
Lead (Pb)
Sources: combustion of coal, iron, steel and nonferrous metals.
UK emissions have declined by 98% since 1990 due to the phasing out of leaded petrol (NAEI).
Although this briefing will mainly focus on outdoor (ambient) air pollution, it should be noted that indoor air pollution is also a matter of concern. Indoor air pollution has been linked to 99,000 deaths in Europe in 2012, originating from poorly maintained gas heating and cooking appliances, furniture fabrics, and many other sources (RCP, 2016). It is also important to note the transboundary nature of air pollution, meaning that the areas affected by air pollution may be far removed from the locations where the pollutants originated. Once emitted from a source, air pollutants may be transported in the atmosphere across country borders and seas. This was exemplified by the events that led to the creation of the Gothenburg Protocol (1979), which involved the acidification of Scandinavian lakes due to deposition of SO2 pollution originating from continental Europe. In the UK it is estimated that 60% of PM2.5 pollution originates from elsewhere, mainly France (12%), Germany (9%) and the North Sea (9%), although this varies considerably between different pollutants (WHO, 2006). This highlights the importance of international agreements in achieving cleaner air.

7
Figure 1. Air pollution sources and pathways (SPICe, 2016).
Power generation
&
Industrial processes
Domestic sourcesAgriculture Road transport
Lead
(Pb)
Secondary Pollutants
Ammonia
(NH3)
Particulate matter (PM)
PM10: Road dust, brake and tyre wear
PM2.5: Diesel exhaust, brake and tyre wear.
Bonfires, domestic biogas burning
PM<0.1: Diesel engine exhausts
Nitrogen Oxides
Diesel Combustion, Power stations, domestic
consumption and Agriculture (N20).
Toxic organic micropollutants (TOMPs)
Incomplete combustion of fuels
Volatile organic compounds (VOC’s)
Household products (aerosols, paints,
disinfectants etc.) and domestic combustion
Incomplete combustion of fuels from car exhausts
VOC’s
Nitrogen oxides (NOx)
Nitrogen dioxide (NO2)
Nitrous oxide (N2O)
Nitric oxide (NO)
Sulphur dioxide
(SO2)
Carbon
monoxide
(CO)
Primary Pollutants
Climate Change
(O3, black carbon (PM), CH4)
N2O + VOCs O3
NOx + NH3 NH4Eutrophication &
nitrogen deposition
(NO, HNO3, NO2)
SO2 + NOx
Acid Rain

8
THE COST OF AIR POLLUTION
Air pollution incurs economic costs across a range of sectors, predominantly through health care costs, workdays lost, and the deterioration of the environment and buildings. The overall economic cost to society associated with air pollution in the UK has been estimated at £20 billion per year (RCP, 2016). Low-income groups are disproportionally affected since they are more likely to live in urban areas with high pollution levels, less access to green spaces and tend to lack healthy food in their diet (RCP, 2016).
Health Impacts
Now regarded as the world’s largest single environmental health risk, air pollution was estimated to cause 3.7 million premature deaths worldwide in 2012 (Brauer et al, 2015, Lelieveld et al, 2015, WHO, 2014). Outdoor air pollution has been linked to many life-threatening diseases (Figure 2), and is responsible for 25% of strokes, 23% of ischaemic heart disease and 14% of lung cancer cases worldwide (Prüss-Ustün et al, 2016). Although the worst air pollution occurs largely in China and India, it is a global problem. The latest research suggests that outdoor air pollution (mainly from NO2 and PM2.5) is estimated to cause around 40,000 deaths each year in the UK (RCP, 2016). It is important to note that these “attributable” or “premature” deaths represent an estimate of the total mortality effect of air pollution across the population, rather than the absolute number of deaths caused solely by air pollution (Committee on the Medical Effects of Air Pollution (COMEAP), 2010). In other words, it is a representation of the contribution of air pollution to the variety of causes of death associated with it (e.g. cardiovascular and respiratory diseases). Estimates of mortality burden of air pollution have risen over recent years (Table 1).
Table 1. The rising trend in the estimated number of deaths attributed to air pollution in the UK and Scotland alone.
Report Pollutant Number of attributable deaths
Scotland UK
COMEAP (2010) PM2.5 1,560 28,861
Public Health England (PHE) (2014) PM2.5 2,094 (3.9%) 28,969
Royal College of Physicians (2016) NO2 and PM2.5 n/a 40,000
It is difficult to determine the health effects of individual pollutants as humans are generally exposed to a mixture of different pollutants simultaneously. However, the principal health risks associated with air pollution are widely reported as:
ischaemic heart disease
stroke
chronic obstructive pulmonary disease (COPD)
lung cancer
asthma
acute respiratory infections in children
diabetes
dementia
obesity RCP (2016).
PM has been listed by the World Health Organisation (WHO) as a carcinogenic (WHO, 2013). PM2.5 is often cited as the air pollutant of greatest concern, as these particles have detrimental effects on the heart and blood vessels and can lead to blood clots, thereby increasing the risk of heart attacks. This is reflected in the higher number of heart attack cases occurring on high
9
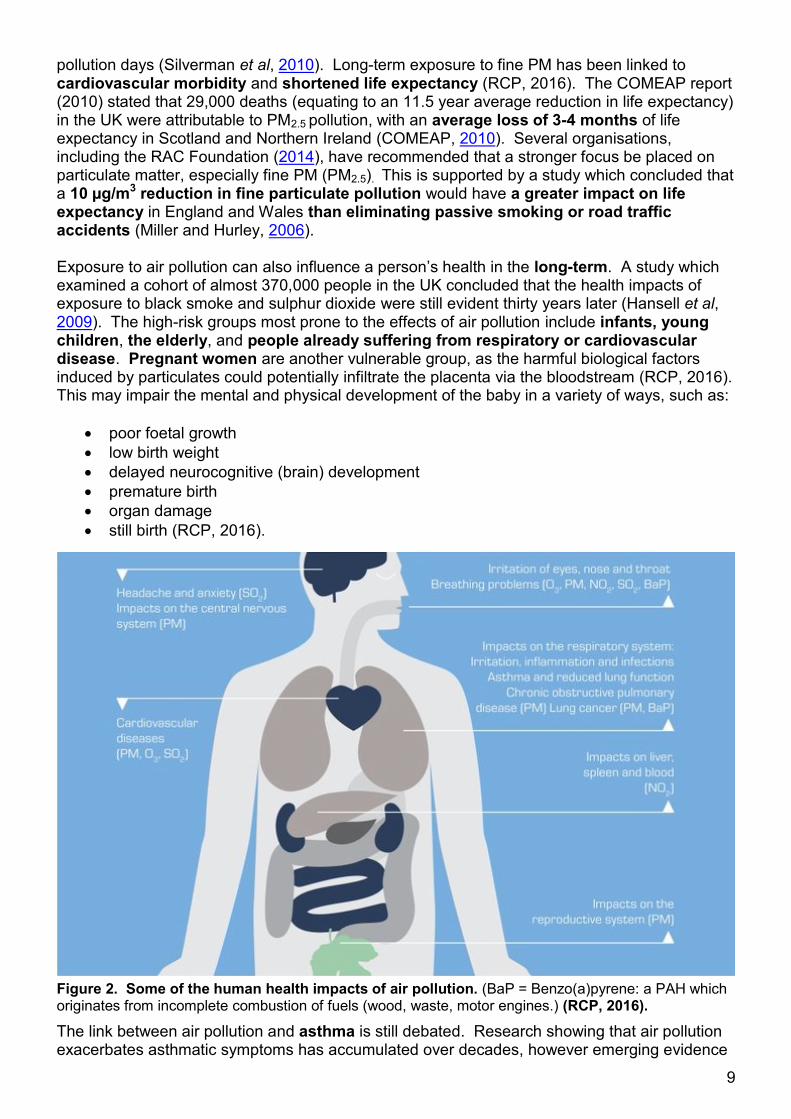
pollution days (Silverman et al, 2010). Long-term exposure to fine PM has been linked to cardiovascular morbidity and shortened life expectancy (RCP, 2016). The COMEAP report (2010) stated that 29,000 deaths (equating to an 11.5 year average reduction in life expectancy) in the UK were attributable to PM2.5 pollution, with an average loss of 3-4 months of life expectancy in Scotland and Northern Ireland (COMEAP, 2010). Several organisations, including the RAC Foundation (2014), have recommended that a stronger focus be placed on particulate matter, especially fine PM (PM2.5). This is supported by a study which concluded that a 10 µg/m3 reduction in fine particulate pollution would have a greater impact on life expectancy in England and Wales than eliminating passive smoking or road traffic accidents (Miller and Hurley, 2006). Exposure to air pollution can also influence a person’s health in the long-term. A study which examined a cohort of almost 370,000 people in the UK concluded that the health impacts of exposure to black smoke and sulphur dioxide were still evident thirty years later (Hansell et al, 2009). The high-risk groups most prone to the effects of air pollution include infants, young children, the elderly, and people already suffering from respiratory or cardiovascular disease. Pregnant women are another vulnerable group, as the harmful biological factors induced by particulates could potentially infiltrate the placenta via the bloodstream (RCP, 2016). This may impair the mental and physical development of the baby in a variety of ways, such as:
poor foetal growth
low birth weight
delayed neurocognitive (brain) development
premature birth
organ damage
still birth (RCP, 2016).
Figure 2. Some of the human health impacts of air pollution. (BaP = Benzo(a)pyrene: a PAH which originates from incomplete combustion of fuels (wood, waste, motor engines.) (RCP, 2016).
The link between air pollution and asthma is still debated. Research showing that air pollution exacerbates asthmatic symptoms has accumulated over decades, however emerging evidence
10
suggests that it can also cause new-onset asthma (Guarnieri and Balmes, 2014). Exposure to PM2.5 and NO2 has been found to increase the incidence of asthma in children, with O3 and SO2 also being linked to the condition (WHO, 2013, Bowatte et al, 2014, Guarnieri and Balmes, 2014). Asthma caused 72 deaths in Scotland in 2014 and is estimated to cost the Scottish health service over £130 million (National Records of Scotland, 2015, Mukherjee et al, 2014). Scotland has been reported to have the highest proportion of asthma sufferers in the world, with over 18% of the population exhibiting symptoms (Masoli et al, 2004). Scotland also has the highest age-standardised premature death rates (i.e. taking into account that most causes of death vary significantly with age and sex) for cardiovascular disease, coronary heart disease and stroke in the UK (British Heart Foundation, 2014). It may be hypothesised, therefore, that reducing air pollution could help to lower the incidence of these diseases, saving both lives and healthcare costs. The areas in Scotland with the highest proportion of total deaths being associated with particulate (PM) pollution are:
1) Edinburgh (4.9%) 2) Glasgow City (4.7%) 3) Falkirk (4.3%) 4) North Lanarkshire (4.3%) 5) = Aberdeen City and West Lothian (both 4.2%) (Public Health England (PHE), 2014).
Studies have shown that the smoking ban, which came into force in Scotland in 2006, resulted in reduced rates of heart attacks, and also reduced the incidence of strokes and asthma (Pell et al, 2008, Mackay et al, 2010, Mackay et al, 2013). It may be predicted, therefore, that reducing emissions of air pollutants wold reap similar benefits in saving lives.
Environmental and Agricultural Impacts
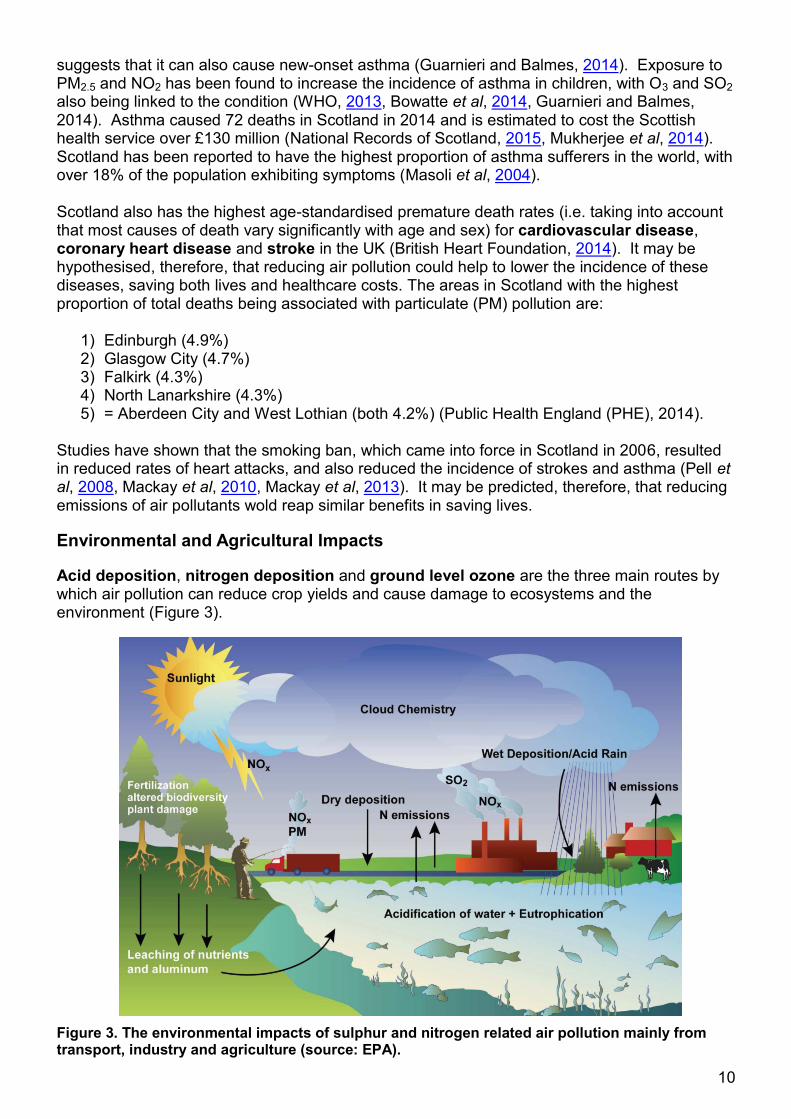
Acid deposition, nitrogen deposition and ground level ozone are the three main routes by which air pollution can reduce crop yields and cause damage to ecosystems and the environment (Figure 3).
Figure 3. The environmental impacts of sulphur and nitrogen related air pollution mainly from transport, industry and agriculture (source: EPA).
11
Of all the air pollutants, ground level ozone (O3) has the greatest detrimental impact on crop yields, with global crop losses as great as 15% for wheat, 14% for soybean, and 5.5% for maize (Wilkinson et al, 2011). This could rise to 26% for wheat, 19% for soybean, and 8.7% for maize according to O3 levels predicted to occur by the year 2030 (Avnery et al, 2011). The current rate of crop losses attributed to ozone pollution has been estimated to cost approximately £12 billion worldwide and £183 million for the UK (Avnery et al, 2011, Natural Hazards Partnership, 2015). O3 damages plants by inhibiting photosynthesis, nutrient and water uptake, and other physical functions culminating in stunted growth, lower crop quality and ultimately lower yield (Fiscus et al, 2005; Morgan et al, 2006; Booker et al, 2009). The stunting effect of ozone on plant growth was highlighted in a study by Gregg et al, 2003. They compared the growth of cottonwood trees in urban and rural environments, finding that trees in the city grew twice as big as those in the countryside. The previous hypotheses that this was due to a fertilising effect of nitrogen or sulphur-containing pollutants on the soil, or the warmer temperatures of urban areas were disproved, and instead the authors concluded it was a result of the higher levels of ozone in the rural sites. Ground-level ozone levels are generally lower in urban areas since O3 reacts with nitric oxide (NO) from vehicle emissions to form NO2. O3 can also reduce the resilience of plants to other stresses, such as drought, which are predicted to occur more frequently in future years due to climate change. Furthermore, grazing livestock may be indirectly affected by ozone pollution due to declines in fodder quality and quantity (Hayes et al, 2016). Thus the implications of ozone pollution could be substantial for Scottish agriculture given that about 4.9 million hectares (63% total land area) of Scotland is used for grazing, crops, grass, fallow or set-aside land (Scottish Government, 2015). This demonstrates how air pollution can be seen as a threat to global food security. Ground-level ozone (O3) is classed as a secondary air pollutant as it is formed when other pollutants (ozone precursors) such as NOx and VOCs react with sunlight (Figure 1, Defra, 2007). Peak ozone episodes occur more frequently in summer months, causing fog formation, respiratory problems, and damage to the environment and food production (COMEAP, 2015). The UK limit for ozone of 100µg/m3 (not to be exceeded more than ten times a year), is more stringent than that set by the European Commission (120µg/m3) (Defra, 2007, EC, 2008). Acid rain (or more accurately, precipitation) is formed through atmospheric reactions mainly involving SO2 and NOx (Figure 3, Singh and Agrawal, 2006). It causes the acidification of soil and water, which may result in the decay of forests, decline in crop yields, and increased mortality of fish and aquatic life (Menz and Seip, 2004). The transboundary nature of acid rain means that it may affect areas far removed from the source, a point which prompted the creation of the Convention on Long-Range Transboundary Air Pollution in 1979 (see below) and the establishment of the UK Upland Waters Monitoring Network in 1988 which measures acidic precipitation deposition. Acid rain deposition rates have fallen considerably since then due largely to the fall in the burning of sulphur-heavy coal, to the extent that the main contributor to acid rain formation is now NOx rather than SO2 (Defra, 2010). Nitrogen deposition in the UK is largely a result of ammonia pollution, with other sources being nitrogen oxides (NOx) and nitric acid (HNO3). N-deposition causes the enrichment of nutrients in soil or water environments, termed eutrophication, which in turn leads to biodiversity loss (Figure 3). Sensitive species such as mosses, lichens and heath plants are outcompeted by opportunistic species better adapted to these nutrient-rich conditions (Imperial Consultants Ltd., 2013, Fangmeier et al, 1994). N deposition also causes algal blooms which can release toxic gases and deplete the water of oxygen, which in turn may cause fish to die of oxygen deprivation (anoxia) and have cascading impacts along the food-chain (Figure 3, UNEP). This could hamper the Scottish Government’s “2020 Challenge for Scotland’s Biodiversity” which aims to “protect and restore biodiversity on land and in our seas, and to support healthier ecosystems” (Scottish Government, 2013).

12
AIR QUALITY LEGISLATION
The legislation surrounding air pollution in Scotland can be broadly separated into two streams: the European Commission’s Directives and the Scottish Regulations. These are discussed below, in addition to other relevant laws and agreements at international and UK levels.
Trans-Atlantic agreements
The aforementioned Convention on Long-Range Transboundary Air Pollution (CLRTAP) (1979), frequently referred to as the Gothenburg Protocol, is an agreement drawn up by the United Nations Economic Commission for Europe (UNECE) between 51 UNECE member States from Europe, the United States and Canada. The Convention addresses the environmental consequences of air pollution, namely photochemical pollution (smog), acidification and eutrophication of soils, vegetation and water bodies. It has since been extended by eight protocols that identify specific measures to be undertaken by Parties to cut their emissions of air pollutants.

13
Box 1. European Commission Directives
The European Commission first introduced regulations on air pollution two decades ago, and has since made several amendments and additions as outlined below. The limit values detailed in these directives are legally binding objectives that must be met by all Member States by the specified deadline. Failure to comply with these rules could lead to legal action and financial penalties (see section on Legal Action). The key EC Directives relating to air quality are:
1996: Air Quality Framework Directive (Council Directive 96/62/EC) sets limit values for NO2, SO2, fine PM (soot), lead, ozone, benzene, CO, polyaromatic hydrocarbons (PAHs), cadmium, arsenic, nickel and mercury. Followed by four “Daughter Directives” between 1999 and 2004.
2001: The National Emissions Ceiling Directive (Directive 2001/81/EC) sets limits for the main causal factors of acidification, eutrophication and ground-level ozone: SO2, NO2, NH3 and VOCs.
2005: The Thematic Strategy on Air Pollution outlines long-term objectives for air quality standards and suggests measures for meeting them. The key objectives were to reduce SO2 by 82%, NOx by 60%, VOCs by 51%, ammonia by 27% and PM2.5 by 59% by 2020 (with 2000 as the baseline year).
2008: The Ambient Air Quality and Cleaner Air for Europe (CAFE) Directive (Council Directive 2008/50/EC): introduces PM2.5 standards (Annex XIV) and time extensions to meet the limits. The directive sets out the legal limit values for the different pollutants (Annex XI), thresholds for human and environmental health (Annex II) and for obligatory public information releases and the standardised methodology for assessing air quality.
2010: Industrial Emissions Directive (Directive 2010/75/EC) relates to emissions from applicable industrial sources, incorporating seven existing pieces of legislation.
2013: Clean Air Policy Package and Clean Air Programme for Europe sets targets up to the year 2030, listing supportive measure to reduce emissions.
It is important to note, however, that the limit values set in these Directives are not necessarily “safe" and could still have a negative impact on human health (Wilkinson, 2015). WHO has published its own set of guidelines for air pollution, some of which are considerably lower than the EU limits. As stated previously, the Scottish Government adopted WHO’s guideline limit for PM2.5 in 2016, and intends to do the same for PM10 in due course.
Table 2.

14
UK
The UK’s contribution towards the creation of international and European air quality legislation is led by the UK Government, with input from the devolved administrations of Scotland, Ireland and Wales. In addition to European and international laws, the UK has developed its own set of legislation on air quality:
Clean Air Acts (1956, 1968, 1993): Triggered by the London smog of 1952, which resulted in 12,000 deaths (RCP, 2016). Introduced rules regarding domestic and industrial combustion, such as the prohibition of dark smoke (mainly from burning high-sulphur coal) from chimneys.
The Environment Act 1995: Part IV on Air Quality requires the UK government and devolved administrations to produce a national air quality strategy, and the devolved national administrations are responsible for meeting EU Directive air quality limit values. The most recent version of this document, The Air Quality Strategy for England, Scotland, Wales and Northern Ireland (UK Government, 2007), defines the roles of central and local government, Scottish Environment Protection Agency (SEPA), industry, business, transport, individuals and other groups in meeting air quality (EU) limits for the ten main pollutants (PM10, PM2.5, NOx, O3, SO2, PAHs, benzene, 1,3,butadiene, CO, Pb, and NH3). Local authorities are required to monitor air quality, and for areas where the air quality limits are not met (or unlikely to be met by the set date) the relevant authority must declare it an Air Quality Management Area (AQMA) and draw up an action plan aimed at reducing levels of the pollutant. Local authorities are obliged to make copies of air quality reviews and assessments available to the public, and to consult locally on the action plan.
The Road Traffic Reduction (National Targets) Act 1998: requires the Secretary of State to produce progress reports for meeting targets to reduce road traffic in the UK, including:
(a) the emission of gases which contribute to climate change (b) effects on air quality (c) effects on health (d) traffic congestion
Box 2. EC Directive Definitions
Limit value: based on scientific research, with the aim of avoiding, preventing or reducing harmful effects on human health and/or the environment as a whole, to be attained within a given period and not to be exceeded once attained. Target value: a level, fixed with the aim of avoiding more long-term harmful effects on human health and/or the environment as a whole, to be attained where possible over a given period. Alert threshold: a level beyond which there is a risk to human health from brief exposure and at which immediate steps should be taken1.
1 EU (1996) Council Directive 96/62/EC.

15
(e) effects on land and biodiversity (f) danger to other road users (g) social impacts
Limits for NH3 were first introduced in the UK under the UNECE Gothenburg Protocol, with the 2020 emissions target for the UK being 283 kilotonnes NH3 per year (a 5% reduction on 2005 levels), whereas the National Emissions Ceilings Directive legally binds the UK to a target of 297 kilotonnes NH3 per year which came into effect in 2010 (EC, 2001). However, in comparison to other air pollutants, the UK Government has not prioritised NH3 as demonstrated in DEFRA’s Air Quality Strategy (2007) which did not cover ammonia reasoning that “we do not consider it appropriate at this time to set objectives for ammonia without consideration of wider environmental issues and regulatory frameworks”.
Scotland
Air quality is a devolved matter in the UK, meaning that the Scottish Government is responsible for developing domestic policies and legislation to improve air quality and reduce risks to human health in Scotland. This is done in partnership with the other Devolved Administrations and the Department for Environment, Food and Rural Affairs (Defra) to ensure objectives set out in the Air Quality Strategy for England, Scotland, Wales and Northern Ireland are achieved (Scottish Government, 2009). The Air Quality Standards (Scotland) Regulations 2010 transpose the Ambient Air Quality Directive requirements (2008/50/EC) into Scottish legislation. These limits are identical across the UK and achievement is a mandatory requirement for Member States. Domestic objectives have also been set under the Environment Act 1995 and these are set out in the Air Quality (Scotland) Regulations 2000, the Air Quality (Scotland) Amendment Regulations 2002 and the Air Quality (Scotland) Amendment Regulations 2016. In contrast to the EU requirements, Scotland has set stricter levels for PM10 and PM2.5. In April 2016, the Scottish Government became the first country in Europe to adopt the WHO recommended guideline value for PM2.5
of 10 µg/m3 annual mean ( As stated previously, the Scottish Government adopted WHO’s guideline limit for PM2.5 in 2016, and intends to do the same for PM10 in due course.
Table 2, Scottish Parliament, 2016). Local authorities are responsible for achieving these objectives, and the implementation of this legislation will require all local authorities in Scotland to add PM2.5 to the list of other air pollutants currently being monitored. As with the other pollutants, in the eventuality that the limit is breached, the local authority must declare the area an AQMA. However, unlike the EU limits, these standards are not legally binding, meaning that the local authorities are not liable to legal action if the limits are breached. The reasoning behind this is that pollutant sources are often beyond the direct control of local authorities. Local authorities are required to demonstrate they are doing all that is reasonably possible in making progress towards meeting the objectives, and areas which are declared as AQMAs are expected to produce an action plan within 12 months (Scottish Government, 2009). The Scottish Government acknowledged the effectiveness of AQMA’s may be limited (Scottish Government, 2013):
“New Air Quality Management Areas (AQMAs) are still being declared for these pollutants and air quality action plans appear generally to be having little impact, despite many local authorities having had plans in place for several years now.”
There are currently 32 AQMA’s in Scotland distributed among 14 councils. The majority (23) of these AQMAs had breached NO2 standards, and 20 breached PM10. Only 1 AQMA, covering

16
Grangemouth petrochemical complex, was declared to have exceeded SO2 limits (Defra, Scottish Air Quality, 2016).
WHO guidelines
Although they concur for most air pollutants, there are some distinct differences between the WHO guidelines and the European limits for air quality. The WHO recommended annual mean for PM10, for instance, is half that of the EU, whilst the SO2 limit set by WHO is much (1750%) lower than the EU’s limit (Table 2). As stated previously, the Scottish Government adopted WHO’s guideline limit for PM2.5 in 2016, and intends to do the same for PM10 in due course.
Table 2. Summary of air pollutant limits and guidelines set by Scotland, the EU and WHO (Scottish Government, 2010, UK Government, 2007, EC, 2008, WHO guidelines, 2005).
Pollutant Scotland Regulations
EU limit values
WHO AQ guideline
Averaging period
Permitted number of exceedances
Carbon Monoxide (CO)
10.0 mg m-3 No set limit. Running 8-hour -
Nitrogen Dioxide (NO2)
200 µg m-3 200 µg m-3 200 µg m-3 1-hour 18
40 µg m-3 40 µg m-3 40 µg m-3 Annual -
Coarse Particulate Matter (PM10)
50 µg m-3 † 50 µg m-3 50 µg m-3 24 Hours 7 (Scotland) 35 (EU)
18 µg m-3 † 40 µg m-3 20 µg m-3 Annual -
Fine Particulate Matter (PM2.5)*
No set limit. No set limit. 25 µg m-3 24 Hours -
10 µg m-3 25 µg m-3 (20 by 2020)
10 µg m-3 Annual -
20 µg m-3 3-years -
Sulphur Dioxide (SO2)
350 µg m-3 350 µg m-3 1-hour 24
125 µg m-3 125 µg m-3 20 µg m-3 24-hour 3
266 µg m-3 500 µg m-3 15-minute (Scotland)/ 10-minute (WHO)
35
Ozone (O3)*
100 µg m-3 100 µg m-3 8 hourly running or hourly *
10
Ammonia (NH3)
Limits and critical levels are listed under the Gothenburg Protocol (2012).
UK emissions ceilings for 2010: 297 kilotonnes
Lichens and bryophytes (where they form a key part of the ecosystem integrity): 1 µg/m3 annual mean
Other vegetation: 3 µg/m3 annual mean (with an uncertainty range of 2-4 µg/m3)
* not currently assessed by Scottish local authorities. † Stage 2 Air Quality strategy objectives to be met by end of 2010.

17
Box 3. Legal Action: ClientEarth UK vs. Government
After the UK failed to meet the EU’s 2010 air quality targets for NO2, the environmental law firm ClientEarth launched a legal case against the UK Government, as outlined below.
July 2005: a Department for Transport report predicts that declining NO2 and PM10 emissions will temporarily plateau before rising again after 2015 unless further action is taken, warning that several areas of the UK already exceed EU limits for these pollutants1.
2011: ClientEarth issues judicial review proceedings against the UK Government’s Secretary of State for Environment, Food and Rural Affairs for failing to comply with Articles 13, 22 and 23 of the Ambient Air Quality Directive, i.e. breaching EC NO2 limits in 16 out of the 43 UK zones (including Glasgow) which were to be met by 1 January 2010. Furthermore, the Government had not applied for a five year time extension, nor produced a satisfactory plan for meeting air quality standards for the zones in question.
2013: The Supreme Court declares that the UK had breached EC law and referred the case to the European Court of Justice (CJEU) to clarify the interpretation of the Directive. Meanwhile, the UK continues to exceed EC limits with 31 of 43 UK zones (including 4 of the 6 zones in Scotland) exceeding the maximum annual limit for NO2, and one zone exceeding the hourly limit2.
2014: The European Commission begins its own legal action against the UK by issuing a preliminary warning notice, but withholds further action awaiting the outcome of the ClientEarth proceedings3. The CJEU rules in favour of ClientEarth, and refers the case back to the Supreme Court. The EC could recommence its own litigation in the future.
16 April 2015: After a one-day hearing, the Supreme Court unanimously rules against the UK government, ordering them to draw up a revised national action plan to comply with legal NO2 limits by the end of the year4,5,6.
December 2015: Defra releases its new air quality strategy publication with proposals for measures to reduce NO2 as ordered by the Supreme Court. However, the report was deemed inadequate by ClientEarth in addition to several other stakeholders including Environmental Protection UK , Clean Air in London, and Friends of the Earth..
1st March 2016: ClientEarth gives the UK Government a 10 day warning to revise and improve the plans, or they will return the case to the High Court. Their main complaint is that the current plans envisage that London will only meet the targets by 2025 and the rest of the UK by 2020, whilst EU law states that the pollution exceedance time should be kept “as short as possible”. The environmental group have since lodged papers asking the High Court to demand further action from the UK Government7.
28 April 2016: Request for a new judicial review granted; ClientEarth argues that the Government is in breach of its legal duty to produce new air quality plans to cut pollution to legal levels in the shortest possible time, calling them “woefully inadequate”. Papers were also served on Scottish and Welsh ministers, the Mayor of London and the Department for Transport as interested parties in the case11.
If the case is not resolved, it will be referred back to the EC and the UK Government could be fined up to £300 million per year for each pollutant in breach. The Scottish Government is also under scrutiny from ClientEarth and could be taken to court in future.
1 Department of Transport (2005) 2 Defra (2015) 3 European Commission (2014) 4 The Guardian (2015) 5 BBC News (2015) 6 Defra (2015) 7 BBC News (2016) 8 ClientEarth (2016) 9 Air Quality News (2016) 10 ClientEarth, 2015 11 Client Earth 2016

18
AIR POLLUTION TRENDS IN SCOTLAND
Overall, air pollutant emissions in Scotland have substantially declined since 1990 (Figure 4). The extent of the progress and efforts made in reducing emissions of the main pollutants (NO2, PM, SO2, and NH3) are discussed in this section.
Figure 4. Trend in air pollutant emissions in Scotland from 1990 to 2013 relative to 1990 levels (Scottish Government, 2015, Air Quality Consultants, Ltd., 2012). N.B. PM2.5 trend represents UK data (Scotland specific data was unavailable).
As depicted above, Scotland has seen strong declines in emissions of most pollutants between 1990 and 2013: SO2 by 87%, NOx by 67%, PM10 by 53%, PM2.5 by 56% (UK), but just 28% for ammonia (Scottish Government, 2015).The main sources of air pollution are transport, energy production, agriculture, industry and domestic combustion (e.g. gas boilers) (Table 3). Table 3. The principal sources of air pollution by sector in Scotland, 2013 (Scottish Government, 2015).
Sector NH3 NOx PM2.5 PM10 SO2 Lead CO
Energy industries - 34.6% 7.7 5.7% 79.4% 20.8% 6.5%
Other Combustion 1.3% 11.6% 24.4% 35.2% 7.5% 27.6% 38.3%
Agriculture 86.6% - 4.4% 21.1% - - -
Transport 1.8% 38.5% 34.8% 16.4% 2.7% 7.0% 30.2%
Industrial operations 0.2% 13.0% 21.9% 13.7% 9.1% 41.5% 22.6%
Waste 4.5% - 5.5% - - 2.9% -

19
Although the order of ranking for sites varies with the different pollutants, the locations in Scotland with generally higher pollution levels are Aberdeen, Dundee, Edinburgh, Glasgow and Perth. Table 4 shows the sites with the 10 highest mean concentrations for NO2 in 2015, although it should be remembered that these come from a mixture of monitoring sites, some of which represent worst case scenarios (i.e. roadside concentrations), whilst others are more representative of public exposure. The trend is loosely reversed for ground-level ozone, which tends to be higher in rural areas Table 4. Top ten ranking sites for air pollution in Scotland based on annual mean NO2 concentration (with PM10 concentrations where available) for 2015.
Rank LOCATION NO2 (Annual limit: 40 µg m-3)
PM10 (Annual limit: 18 µg m-3)
1 Edinburgh St John's Road 65 n/a
2 Glasgow Kerbside 60 n/a
3 Dundee Seagate 51 14.17
4 Perth Atholl Street 48 20.11
5 Dundee Lochee Road 48 18.54
6 Aberdeen Union Street Roadside 46 17.21
=7 Aberdeen Wellington Road 41 22.10
=7 Edinburgh Queensferry Road 41 16.59
9 Glasgow Dumbarton Road 40 18.89
10 South Lanarkshire Rutherglen 38 18.20
The trends of the major air pollutants in Scotland are discussed in more detail below.
Particulate Matter
Coarse particulates (PM10) originate predominantly from combustion, agriculture and transport (Table 3). Scotland’s PM10 emissions have been declining since 1990, with the exception of the peak in 2001 thought to have been caused by the burning of animal carcasses in response to an outbreak of foot-and-mouth disease (Aether and Ricardo-AEA, 2015, Figure 4). Between 2010 and 2015, the average annual PM10 emissions in Scotland declined by 18% (17.87μg/m3 in 2010 to 14.64μg/m3 in 2015). The overall decline in PM levels may be mainly attributed to the implementation of stricter emissions standards for road vehicles, but also to declines in SO2 emissions which are a source of secondary PM (Fuzzi et al, 2015). Similarly the number of monitoring sites in Scotland exceeding the PM10 annual limit (18 μg/m3)has declined, with 13.2% (10 out of 76) monitoring sites breaching the limit in 2015, compared to 25.3% (19 of the 75) the previous year. In 2015, four sites exceeded the permitted number of exceedances of the hourly limit (50 μg/m3), which was more than in 2014 (1 site) but an improvement on 2010 (13 sites). Fine particulate pollution (PM2.5) is produced in approximately equal parts from emissions from industry, domestic sources and road transport. UK data suggests that PM2.5 has followed a similar trend to PM10 (Figure 4), although fine particles concentration data in Scotland is currently limited with data being available for just 10 monitoring stations measuring this pollutant in 2015, in comparison to 60 for PM10. It is possible that the trend in fine PM has been underestimated, particularly in areas of high traffic. However, the new Scottish legislation (10 µg/m3 annual mean) which came into force in April 2016 requires all local authorities to install the necessary equipment to monitor PM2.5 in their zone. PM2.5 is often cited as the air pollutant of greatest concern in terms of health impacts as the particles are small enough to enter the blood stream which has been linked to increased incidence of heart attacks. Thus the inclusion

20
of PM2.5 in the pollution monitoring and forecast programmes could be very valuable in issuing health warnings during periods of high concentrations. Secondary PM can be formed by various pollutants, referred to as secondary PM precursors, through photo-chemical reactions (i.e. reacting with sunlight) in the atmosphere, (EEA, 2010). These PM precursors (NOx, SO2 and NH3) are discussed below.
Nitrogen dioxide
In Scotland, the major sources of NOx emissions are transport and energy production (Table 3, National Atmospheric Emissions Inventory). According to the National Atmospheric Emissions Inventory (NAEI) statistics, NOx emissions in the UK have fallen by 65% between 1990 and 2013, which it attributes to reduced emissions from power stations and road transport (NAEI). In Scotland, coal-fired power stations at Longannet and Cockenzie (both now closed) were installed with de-NOx abatement systems (Boosted Over-Fire Air) which aided this trend as they reduce the NOx emissions released during coal combustion by up to 25% (Aether and Ricardo-AEA, 2015). However, the reduction in emissions from road transport may have been overestimated since the NAEI based their estimates on non-satisfactory emissions testing results which are now known to be misrepresentative (Box 4). This inconsistency was identified in the Review of Transboundary Air Pollution (RoTAP) (Centre for Ecology and Hydrology (CEH), 2012), when they showed that N deposition rates (wet deposition of nitrate (NO3
-)) declined by half as much as NOx emissions (24% and 50% respectively) over two decades according to NAEI data. This seemed to be unlikely given that N-deposition rates should mirror NOx emissions rates. In short, this indicates a mismatch between NOx emissions data and deposition data, potentially caused by a miscalculation (overestimate) of the declines in NOx emissions from transport. Although most monitoring sites in Scotland showed declines in NO2 concentrations from 2010 to 2015, there were several which repeatedly exceeded the annual limit during this period, including sites in Aberdeen, Dundee, Edinburgh, Glasgow and Perth (Table 4). The highest annual mean for 2015 was recorded for St John’s Road, Edinburgh at 65µg m-3, which was the highest level in 4 years. This site has also repeatedly exceeded the hourly limit for NO2 (18 hours above 200µg m-3 per year), taking less than 5 weeks to break the hourly limit for 2016. Most parts of Scotland, however, do seem to be exhibiting declines in NO2 concentrations. In 2015, 11.3% (8 of 71) of active monitoring sites breached the annual limit for NO2 in Scotland- an improvement on 2010 (33%) and 2014 (14.7%). The overall average NO2 concentration for Scottish monitoring sites in 2015 was 28µg m-3, representing the lowest recorded average since 2000, and the number of breaches of the hourly limit has generally declined between 2010 and 2015.
Sulphur dioxide
Sulphur dioxide (SO2) is one of the principal causes of acid rain, and is also harmful to human health, causing reduced lung function and inflammation of the respiratory tract, and aggravating asthma. The main sources of SO2 are energy industries, accounting for 79% of 2013 emissions (Table 3). Since the 1970’s, SO2 emissions from industrial combustion sources in the UK have reduced by 94% and are well below the EU limit. This decline is largely due to the replacement of high-sulphur solid (coal) fuels with cleaner sources (e.g. lower-sulphur coal, natural gas and nuclear power) and the use of abatement technology in industrial facilities such as flue-gas desulphurisation. SO2 emissions in Scotland have followed a similar declining trend, except for small peaks in 2006 and 2010 caused by increased coal consumption in power stations (Aether and Ricardo-AEA, 2015,). Energy production from coal has now been phased out in Scotland following the closure of the Cockenzie power station in March 2013 and Longannet power station in March 2016, which should result in reductions in Scotland’s SO2 emissions (Macalister, 2016). Although SO2 emissions in Scotland have met the limits set by

21
UK and EU law for many years, there have been several instances where levels in Grangemouth exceeded the WHO recommended limit of 20µg m-3 24-hour mean.
Ammonia
Ammonia (NH3) is a highly reactive and soluble alkaline gas produced by the breakdown of urea (APIS, 2016). Concentrations of NH3 vary widely, with hotspots being in areas with intensive livestock production, particularly cattle (RoTAP, 2012). Livestock sources (manure and slurries) account for approximately 85% of NH3 emissions in Scotland, with the remaining 15% coming mainly from fertilisers (Sutton et al, 2004,Table 3). These NH3 emissions represent a loss of nitrogen from the agricultural system, thereby reducing the nitrogen efficiency of the farms and also representing a major cause of N deposition. From an economic standpoint, it is in the farmer’s interest to minimise nitrogen (N) losses as it is a key nutrient for crop growth and an expensive resource in terms of fertilisers. NH3 can undergo chemical reactions in the atmosphere to produce ammonium (NH4
+) aerosol which can then be transported over thousands of miles, before being deposited mainly as acid precipitation (Figure 3, Dragosits et al, 2006, Asman et al, 1998, Fowler et al, 1998). It can also react with other pollutants from traffic and industry (NOx and SO2) to form secondary PM2.5 (ammonium sulphate and ammonium nitrate) to the extent that several studies have claimed that reducing NH3 emissions is the most effective way to reduce PM2.5 under present-day conditions (NAEI, Imperial Consultants Ltd, 2013, Kulmala et al, 2011, Megaritis et al, 2013, Vieno et al, 2016). Indeed, a study conducted in Auchencorth Moss, Scotland, found that ammonium (NH4) was the single largest contribution to PM2.5 in all seasons (Twigg et al, 2015). It is important to note, however, that the benefits of reducing NH3 emissions would be greatest in rural areas and may be less apparent in reducing PM levels in urban areas where measures to reduce road traffic emissions would be far more effective (Fuzzi et al, 2015). Nonetheless, given the abundance of evidence showing the harmful effects of PM on human health, NH3 pollution constitutes a danger to the health of humans and the environment alike. Also, there are reports that PM pollution is by and large the same in rural and urban areas (). It should be noted, however, that the reactivity of primary and secondary PM2.5 may differ, meaning that their detriment to the environment and human health may be different.
Since the 1980s, NH3 emissions in the UK have fallen by approximately 15% (RoTap, 2012,Table 3). In comparison to other sources of air pollution, NH3 emissions from agriculture have made the smallest reductions (Oenema et al, 2011). As they are highly dependent on local agricultural activities, annual NH3 emissions vary widely from <0.2 kg ha-1 in areas of the Scottish Highlands, to >100 kg ha-1 in lowland areas with intensive poultry farming (Sutton et al, 2004). Many of the semi-natural ecosystems characteristic of Scotland’s natural heritage, including heathland, bogs, and woodlands, are threatened by NH3 deposition. Much of lowland Scotland and the Southern Uplands receive NHx deposition levels which exceed the environmental effect threshold (Table 2, Sutton et al, 2004). Future efforts to reduce NH3 emissions may be impeded by the rising demand for dairy, meat and poultry products, with global meat production predicted to rise by 17% between 2014 and 2024 (OECD/FAO, 2015). Thus there is mounting pressure on livestock agricultural industry to increase their production efficiency in parallel with reducing their impact on the environment. Alternatively, there would need to be a general reduction in meat consumption.

22
AIR QUALITY POLICIES
SCOTLAND
The Scottish Government is required to devise its own air quality strategies and policies under Part IV of The Environment Act 1995. The Scottish Government produced the “Cleaner Air for Scotland: The Road to a Healthier Future” (CAFS) report in 2015 (2015b). It sets out various targets for Scotland, including:
Achieve compliance with EU limits by 2020
10% of everyday journeys made by bike by 2020
Phase out 50% of all petrol and diesel fuelled vehicles from urban environments by 2030
Renewables to generate the equivalent of 100% electricity demand, 11% of heat demand and 30% of overall energy demand, all by 2020.
Although air quality management in Scotland mostly falls to local authorities, SEPA also has a part to play through its roles as a regulator of industrial emissions and an advisor for air quality reviews, assessments and action plans. With the approval of Scottish Ministers, SEPA can demand that any Scottish local authorities it deems are failing to make sufficient progress towards meeting the air quality targets take action to resolve this. These actions may require local authorities to:
Carry out or repeat an air quality review and assessment
Make an order designating an AQMA
Revoke/modify any order
Prepare, modify or implement any part of an action plan (Scottish Government, 2009).
Local authorities can apply for government funding to support the monitoring of air pollutants and the implementation of air quality management plans through three funding schemes (Transport Scotland, 2016). Local Air Quality Management (LAQM) funding is designated for monitoring, modelling and associated work. Between 1999 and 2016, about 36% of the LAQM funding was distributed between four councils: North Lanarkshire, Glasgow, Falkirk and Perth & Kinross. Edinburgh and Aberdeen were allocated comparatively less money (12.31% of total LAQM funding) than other local authorities despite having some (4 out of the top 10) of the worst pollution hotspots in the country in 2015 (Table 4). The funding is not ring-fenced, however, enabling local authorities to decide how to spend the allocated money. The Air Quality in Scotland website, which is managed by the environmental consultancy group Ricardo Energy & Environment on behalf of the Scottish Government, offers information and advice relating to air pollution, aimed both at adults and children. The website publishes daily air quality forecasts which can also be accessed through the free “Know and Respond” service. Through signing up to this service, members of the public can receive daily alerts (via mobile phone text message or e-mail) when the air pollution levels in their area are forecast to be moderate or high the following day. The forecast uses the Daily Air Quality Index (DAQI) based on the banding system developed by COMEAP which classifies pollutant levels on a scale on 1 to 10 (COMEAP, 2011). This is particularly useful to people who suffer from heart or lung conditions, such as asthma, bronchitis, and cardiovascular disease, as they can plan their activities accordingly to minimise their exposure to potentially harmful levels of pollution which may aggravate their condition. The “Know & Respond” service has been criticised for its role in advising individuals to restrict their activity to avoid pollution, with some arguing that action should instead be taken to force the polluters to reduce their emissions (RCP, 2016). Furthermore, the bandings of pollution levels given in the forecasts on the Air Quality Scotland are based on hourly limits rather than

23
the annual mean limits (which are lower, see Table 2) which some argue is misleading. For instance, an hourly NO2 concentration of 153 µg m-3 was classed as “low” on the forecast since the hourly limit is 200 µg m-3, but if it remained at this level all year round the annual average would be far above the legal limit of 40 µg m-3. The Scottish Government’s reasoning for this is that its purpose is to warn people of short-term pollution episodes which may exacerbate health problems. However, there is an argument for basing the bandings on annual limits since research indicates long-term exposure to lower levels of air pollution are also damaging to health. The air pollution forecasts issued by Defra (UK Government) are also based on short-term rather than annual limits. A variety of the policies and management strategies employed across different sectors to tackle air pollution in Scotland and elsewhere are discussed below.
TRANSPORT
The largest contributor to air pollution in the UK is road transport, with other sources from the transport sector including aviation and shipping. The growing aviation sector represents a localised source, as aeroplanes release many pollutants, including NO2, during take-off and landing which can affect areas surrounding airports (EU, 2016). International shipping constitutes a significant source of air pollution (mainly SOx, NOx, PM and VOCs) yet has not been as tightly regulated as other emissions source (Fuzzi et al, 2015). Nevertheless, there have been reductions in PM10 emissions from shipping in recent years which may be attributed to the implementation of Sulphur Emission Control Areas (ECAs) which were established to limit SOx and PM emissions by requiring ships to use low sulphur fuels (International Maritime Organisation (IMO), 2014). These ECAs are located in shipping areas surrounding Europe and the US, including parts of the North Sea. Reductions in shipping emissions were also driven by the economic crisis which stimulated a rise in “slow steaming ships” to save fuel costs (Fuzzi et al, 2015). However, shipping remains a significant source of air pollution and has been estimated to represent the largest single emitter of air pollution in Europe by 2020 (Vidal, 2016). Road traffic emissions do not only affect pedestrians and cyclists outside. In fact, it is the people travelling in the vehicles who are exposed to the highest concentrations of the pollutants, with one study indicating that NO2 levels were, on average, 21% greater inside the vehicle (with the windows closed) than on the road outside (Air Quality News, 2016). The Scottish Government’s CAFS report (2015b) suggests an array of actions to be undertaken by individuals and businesses to reduce emissions, in addition to several proposals for new monitoring schemes (e.g. the Daily Air Quality Index, National Modelling Framework, National Planning Framework3, environmental impact assessments etc.) and reviews to address the issue. The Transport Scotland website summarises the government’s transport-related policies on air quality, which include:
Promoting electric vehicles and electric charging infrastructure, with the Energy Saving’s Trust Low Carbon Transport Loan (interest-free loan towards the purchase of electric vehicles - up to £100,000 for businesses and £50,000 for individuals).
Promoting and funding active travel schemes
Supporting low-emission public transport vehicles, such as hydrogen fuel cell buses, via the Green Bus fund
Relieving road congestion to enable traffic to flow much more smoothly
These schemes have led to Aberdeen having the largest fleet of hydrogen fuel cell buses in Europe, and Dundee having the UK’s largest electric taxi fleet. Other strategies to reduce traffic-related pollution include the use of Intelligent Traffic Systems (ITS). ITS technologies collect traffic data and control traffic lights to create energy efficient junctions which improve traffic flow and reduce congestion, which can result in significant reductions in NO2 and PM10

24
emissions (Kreutzer, 2014). A project in Newcastle found that using ITS resulted in 15% reductions in fuel consumption, 66% reductions in vehicles travelling at 5mph or less and reduced congestion (Scottish Government, 2015b).
The Impact of Dieselisation
The shift from petrol to diesel in the 1990’s, which occurred throughout Europe, was driven in the UK by the incentivisation of diesel cars through reduced rates of Vehicle Excise Duty and company car tax. This was part of the UK Government’s mission to reduce CO2 emissions, but an unanticipated side-effect was the higher NO2 and PM emissions produced by diesel exhausts in comparison to petrol. Furthermore, some researchers have postulated that any benefits of the lower CO2 emissions from diesel exhausts are off-set, in part, by a combination of:
(i) The rising demand for diesel resulting in increased diesel production which in turn produces higher CO2 emissions from refineries,
(ii) The global warming effects of PM (black carbon) from diesel engines (Air Quality Expert Group, 2007).
Several measures have been implemented over the last two decades to reduce NOx emissions from road vehicles, such as three-way catalysts for petrol engines and the introduction of Euro emissions standards. Yet efforts to reduce NOx emissions from diesel vehicles appear to have been somewhat limited. In an open letter to the European public and policy makers, a group of air quality researchers and practitioners criticised the widespread promotion of dieselisation since the 1990’s, claiming that there have been no improvements in NOx
emissions from diesel cars and that “with the help of weaker standards, diesel cars have been granted pollution privileges by EU law for over 20 years” (Holman and Helmers, 2015). There are calls from lobby groups and think tanks to de-incentivise diesel vehicles by taxing diesel more heavily, with the revenues being used to fund a scrappage scheme for old diesel cars to be switched for lower emission vehicles (Harvey, 2014, Carrington, 2016, Howard, Beevers and Dajnak, 2016).

25
Box 4. The Volkswagen Affair
In September 2015, Volkswagen came under fire from the Environmental Protection Agency (EPA) in the US for using a “defeat device” to cheat the emissions test1. Software in the diesel engines were able to detect when the car was in test conditions, adjusting their performance in order to meet the emissions limits. The EPA found that in normal road driving conditions, the engines emitted up to 40 times more NOx than is permitted in the US. The case was widely publicised, and VW eventually admitted to the deceit, announcing that around 11 million cars worldwide were fitted with the device, including 1.2 million cars in the UK1. VW has been hard hit as a result, with the Chief Executive Martin Winkerton resigning and a fall of 14% in VW sales in January 2016 compared to the previous year. The US sued VW on behalf of the EPA, announcing that “car manufacturers that fail to properly certify their cars and that defeat emissions control systems breach the public trust, endanger public health and disadvantage competitors”. VW, who could be fined up to $18 billion for their violation of the Clean Air Act, announced in February 2016 that they would pay out $1,000 in compensation to each of the 600,000 owners of the fraudulent cars in the US2. Meanwhile, affected car owners in the UK will not receive monetary compensation, but instead will be offered a “loyalty bonus” and have alterations made to their cars (AdBlue or a software adjustment depending on the size of the engine), since the emissions requirements are less stringent than those of the US3. Further consequences The revelation of the VW emissions case emphasised the need to reassess emissions testing in the motor manufacturing industry. The technology used by VW to cheat emissions tests appears to be more widespread than previously thought, with manufacturers including Mercedes-Benz and Audi also coming under scrutiny4. A report by the consumer watchdog Which? found that when a more realistic emissions testing method was employed, 95% of diesel cars exceeded EU NOx limits, as did 10% of petrol cars tested5. The exceedances were found to be highly significant, with many cars having NOx emissions up to 500% above the EU limits) 6. The VW case prompted the European Commission to review the current testing procedures. In January 2016, the EC announced changes to the emissions testing which would make the process more independent and make car manufacturers liable to fines of €30, 000 per vehicle which fails to comply with the regulations7. The following month, the European Parliament voted in favour of adopting real driving emissions (RDE) testing to replace laboratory-based testing. However, the test will only be fully enforced across Europe from 2019, which some argue is too late. Furthermore, to allow car manufacturers some leeway in adapting to the new regime, MEPs narrowly voted in favour of relaxing NOx emissions standards allowing them to be twice as high as the current limit set by Euro 6 standards from 2019 until 2021, and 50% thereafter8. The UK Government was criticised by commentators for bowing to pressures from car manufacturers to permit the higher emissions. 1 BBC News, 10 December 2015 Volkswagen: The scandal explained.
2 Reuters, 7 February 2016 Volkswagen to offer generous compensation for U.S. customers: fund head.
3 Autoexpress, 8 February 2016 VW emissions scandal: everything you need to know
4 WSWS, 20165
5 Which?, 2016
6 AirQuality News, 2016
7 Air Quality News, 2016
8 Nelsen, 2016

26
Emissions testing
The laws regarding vehicle emissions in the UK fall under The Road Vehicles (Construction and Use) Regulations 1986, which incorporates European legislation1. In Scotland, all local authorities have the powers to carry out roadside emissions testing under the Road Traffic (Vehicle Emissions) (Fixed Penalty) (Scotland) Regulations 2003. The fixed penalty fines are £60 for failing an emissions test (committing an emissions offence) and £20 for stationary idling. The emissions penalty may be waived if the owner of the vehicle rectifies the problem within 14 days of failing the test. The efficacy of this scheme came into question following a report that only 13 of the 32 councils in Scotland had conducted roadside emissions testing (BBC News, 2016). The Scottish Government has emphasised that it is up to individual authorities to decide whether conducting roadside emissions testing would be a cost effective and appropriate measure for addressing the specific air quality issues faced in their areas.
Diesel particulate filters and Selective Catalytic Reduction
Diesel particulate filters (DPFs) were first introduced into European passenger cars in 2000. DPFs use catalytic oxidation reactions to remove up to 95% of particulates from diesel exhaust emissions (IARC Working Group on the Evaluation of Carcinogenic Risk to Humans, 2014). DPFs generally will operate efficiently after 15 minutes of driving at a constant speed as they require heat to operate properly. Gradually a layer of soot builds up on the filter which initially improves the efficiency of PM removal, but it must be periodically removed in order to maintain the efficiency of the DPF, which costs around £90, whereas to replace or repair a DPF can cost as much as £3,000 (Boyce, 2014). It became common for people to have the DPF removed to avoid these maintenance costs and to increase the fuel efficiency of the vehicle which may be impaired by DPFs over time. Consequently, a rule was introduced in February 2014 whereby any car which has had a DPF removed will fail its MoT and incur fines of up to £1,000 for a car and £2,500 for a light goods vehicle (UK Government, 2013). AdBlue® is a urea-based liquid additive which removes up to 90% of NOx from diesel exhausts by converting them into harmless nitrogen gas (N2) and water vapour (H2O) through the process of Selective Catalytic Reduction (SCR). Due to the size of the tank required to accommodate AdBlue, it is only available for use in larger vehicles (tractors, heavy goods vehicles and buses) and since 2006 most newly-built buses and large vehicles have been fitted with AdBlue-compatible SCR systems (GreenChem, 2013). The installation of SCR is more beneficial to long-haul vehicles as research shows that NOx emissions from SCR-fitted vehicles is substantially lowered for motorway-type driving, whereas for stop-start urban driving SCR actually causes a large increase in NOx emissions (Ligterink et al, 2009 and Velders et al, 2011).
Another fuel additive is Envirox™ (Energenics Europe Ltd., U.K.) which reduces total PM emissions from diesel exhausts using cerium oxide (also known as ceria) nanoparticles which act as a catalyst. It also improves fuel efficiency and reduces hydrocarbon and CO2 emissions, and has been used widely in the transport sector since 2005. However, a study by Zhang et al (2013) suggests that the environmental and human health benefits of Envirox™ may be offset by their observations of simultaneous increases in ultrafine PM by more than 30% and NOx by almost 10%.
1 Community Directive 72/306 and 77/537, ECE Regulation 24.01, 24.02; 24.03; Community Directive 78/665 or
83/351 or ECE Regulation 15.03 or 15.04.

27
Non-exhaust emissions
Non-exhaust sources, mainly brake, tyre and road wear, are thought to contribute almost equally to road traffic PM10 emissions as exhaust emissions. Brake wear emissions are greatest in urban areas where stop-start driving is common, and the PM it produces contains chemicals (e.g. copper) which are potentially toxic to humans. However, whilst controls on vehicle exhaust emissions have tightened, the contribution of brake and tyre wear to traffic-related PM10 emissions have increased and there are currently no policies in place to address this (Grigoratos and Martini, 2014, van der Gon et al, 2012). At present, research looking at the effect of brake or tyre wear particles on human health is lacking, suggesting that non-exhaust emissions represent a gap in both air quality research and policy (Grigoratos and Martini, 2014). PM pollution can also arise from the suspension of road dust particles. Dust suppressants can be used to reduce these PM emissions by effectively sticking the particles to the road surface, as demonstrated in many European countries. This method for reducing air pollution was trialled in London in 2013, however it produced mixed results suggesting that dust suppressants have limited effectiveness, only reducing PM levels substantially in areas surrounding industrial and construction sites (Barratt et al, 2012).
Congestion charges and Low Emission Zones (LEZs)
Local authorities in Scotland have the power to introduce road user charging (i.e. congestion charges) schemes on local roads (excluding trunk roads) under Part 3 of the Transport (Scotland) Act 2001 and Road User Charging Schemes (Keeping of Accounts and Relevant Expenses) (Scotland) Regulations 2004. The charges can be varied according to any of the following factors:
(a) day of the week (b) time of day (c) road (d) distance travelled (e) purpose of the journey (f) number of occupants (g) class of motor vehicle.
In 2005, a referendum was held in Edinburgh on whether to introduce a congestion charge to the inner and outer cordons of the city which would cost £2 a day, with penalty fines of £60 for those who do not comply. The proposal was overwhelmingly rejected, with 74.4% of residents voting against the congestion charge from a turnout of 61.8% of registered voters (BBC News, 2005). The turnout for the vote was higher among car owners, who were thought to be more likely to oppose the plans in comparison to people who did not own a car (Gaunt et al, 2007). To date, this has been the only attempt at introducing congestion charges in Scotland. Low Emissions Zones (LEZs) are areas (usually pollution hotspots) where cars are only allowed entry if they meet certain emission standards. In comparison to congestion charging, LEZ’s can be a less attractive option given that they are not as cost-effective, potentially being costly to introduce as they require national coordination; a network of cameras which capture licence plate numbers for the identification of vehicles that are above the emission limits; and the issuing of fines. Although several authorities in Scotland have considered LEZs, none have gone beyond the feasibility assessment stage (Scottish Government, 2015). LEZs and congestion charges have been successfully introduced elsewhere in the UK and Europe. Beevers and Carslaw (2005) found that congestion charges in London resulted in significant reductions in NOx and PM10 emissions. The London LEZ applies to heavy goods vehicles and larger minibuses only, with those not meeting the required emission standards

28
being charged up to £200, or else face a penalty fine as great as £1,000. In Copenhagen, Berlin and Amsterdam, cars which are non-EURO emission standard vehicles or diesel cars without diesel particulate filters are restricted from entering the city (European Environmental Bureau, 2005). Increasing parking prices in cities can also help to significantly reduce emissions, as shown in Beijing where increased parking prices resulted in a 26.9% reduction in its congestion index and a 3.3% increase in bus journeys made (Wang et al, 2014). The revenues raised from congestion charges and parking levies can then positively feedback into the system by being reinvested into public transport and active travel.
Electric vehicles
The Scottish Government has proposed to decarbonise its transport sector by 2050, so that “Scottish towns, cities and communities will be free from the damaging emissions of petrol and diesel fuelled vehicles” (Transport Scotland, 2013). To achieve this goal, there must be a widespread adoption of electric vehicles (EVs) and the accompanying infrastructure to support them. EVs are both environmentally friendly and economical as they are exempt from road tax and are approximately 12p per mile cheaper to run than the average petrol car (Energy Savings Trust, 2015). Additionally, in 2015 the Scottish Government announced the “Switched on Fleets” initiative, £2.5million project which offers interest-free loans up to £50,000 towards the purchase of new electric or plug-in hybrid vehicles for public sector fleets (Energy Savings Trust, 2015, Scottish Government, 2015f). The UK Government offers grants up to £4,500 for electric cars and £8,000 for electric vans (UK Government, 2016b). The programme saw the introduction of 145 new electric vehicles in the fleets of 22 public sector organisations over the first year. In “Switched on Scotland: A Roadmap to Widespread Adoption of Plug-in Vehicles” the Scottish Government sets out proposals to establish a network of rapid charging points at 50 mile intervals along Scotland’s principal roads, and by February 2015 over 1,500 public EV charging points were installed (Transport Scotland, 2013, Zap-Map, 2016). Although most charge points take up to 8 hours to fully charge an EV, the “rapid charge” points can achieve 80% charge in 30 minutes (Energy Saving Trust). The “ChargePlace Scotland” initiative, which launched in 2010, enables drivers to charge their EV’s for free (with a £20 membership fee), and also offers full funding for the installation of domestic, commercial and community charging points (Hitchcock et al, 2015). There was a significant rise in the use of charging points in Scotland between 2013 and 2014, however only 55% of charging points were used in August 2014. By the end of 2014, the number of electric (pure electric, plug-in hybrid and range extender) vehicles registered in Scotland was 1,469, comprising 1,321 cars, 29 quadricycles, 117 LCVs (light commercial vehicles) and 2 HCVs (heavy commercial vehicles) (SMMT, 2016). Dundee has the greatest uptake of EVs in the whole of the UK, with over 30 charging stations, approximately 60 cars in the City Council’s fleet, and over 40 electric taxis (Scottish Government, 2015b). It can be argued that electric vehicles have “hidden” emissions in that they are powered by electricity which may be generated from fossil fuels. However, this would not be the case if the electricity is generated by renewables, and if not, then at least the emissions in cities where pollution is greatest would still be reduced.
ACTIVE TRAVEL
Cycling
Cycling not only offers a solution to the problem of air pollution, but also serves to benefit human health and wellbeing, which in turn would lessen the burden on health services. In 2010, the Scottish Government launched its first “Cycling Action Plan for Scotland”, which

29
pledged that 10% of everyday journeys would be made by bike by 2020 (Scottish Government, 2010b). Although the number of people using bikes for their daily commute in Scotland has risen over the past few years, there is still considerable progress to be made, with only 1% of everyday journeys being made by bike in 2013. Research shows that the health benefits of cycling significantly outweigh the risks of accidents and air pollution by a factor of at least ten (Rabl and de Nazelle, 2012, de Hartog et al, 2010). Nevertheless, fears of injury and concerns regarding road safety are common barriers to people choosing to cycle regularly in the UK. This may be addressed by implementing cycling as a compulsory topic in the national school curriculum and work training schemes, as demonstrated by the Netherlands, Germany and Denmark. In addition to making improvements and expansions in the national cycling network, the provision of cycling safety schemes could significantly boost the number of people choosing to cycle rather than use pollution emitting modes of transport. Currently, Cycling Scotland has a “Bikeability Scotland” scheme in place which is a three-tiered cycling training programme aimed at P3 to P7 school children, covering a range of skills starting with the basics of cycling up to navigating complex junctions and journey planning. Although the training is not yet compulsory across all schools, 68.5% of pupils receive some form of cycle training at primary school (Scottish Parliament, 2012). A detailed SPICe briefing on cycling and walking policy, statistics and funding in Scotland is available on the Scottish Parliament website (Rehfisch, 2014). The Netherlands has long been an exemplar nation for cycling safety. Despite having many more cyclists on the roads (27% of journeys are made by bike in the Netherlands, compared to just 2% in the UK), the Netherlands has a much lower fatality rate among cyclists than the UK (Donaldson, 2010; Wardlaw, 2014). This is attributed to the better quality of the Netherlands’ cycling infrastructure, which involves safe cycle parking, education of both cyclists and motorists, legal protection of safe road users and promotion of cycling by local councils (Wardlaw, 2014). The London Mayor, Boris Johnson, has advocated cycling in the capital, leading to the opening of the first segregated “bike superhighways” in 2016- 18 mile cycle routes with protected junctions which run from east to west London (Walker, 2016).
AGRICULTURE
Despite being a leading source of ammonia, methane and nitrous oxide emissions, the policies and controls surrounding emissions from the agricultural sector are considered to be weak (UNECE, 2014, EC Joint Research Centre (ECJRC), 2015). The regulations relating to fertiliser use, which are listed in the EC Water Framework Directive (EC, 2000) and Nitrates Directive (EC, 1991), are considered to be effective in preventing large N losses from fertilisers applied to fields, however there is little in the way of restrictions on livestock NH3 emissions. The Gothenburg Protocol (2012) and the EC’s Clean Air Policy Package (UNECE, 2014) both recommend a number of agricultural methods to reduce agricultural NH3 emissions, relating to:
Manure storage
Animal housing
Livestock feeding strategies
Low-emission manure spreading techniques and storage systems
Nitrogen management
Despite these mandated mitigation measures, reductions in NH3 emissions in Europe have been minor. The exceptions are Denmark and the Netherlands, which have both demonstrated that NH3 emissions can be successfully cut using effective mitigation policies.

30
These policies, which included the introduction of covers on solid manure and slurry stores and lower emission manure spreading (injecting instead of spraying/spreading), have led to reductions in NH3 emissions as great as 50% without hampering agricultural productivity (Fowler et al, 2013). The economic costs of the environmental damage from NH3 emissions have been shown to far outweigh the costs of implementing reduction measures (Fowler et al, 2013). The environmental damage caused by N pollution from agriculture has been estimated to cost the EU up to £115 billion per year, whilst abatement costs for the EU have been valued at £0.46 billion annually (Fowler et al, 2013). Analysis of the ratio of cost and benefits of emission reductions indicates that the potential to cost-effectively reduce NH3 emissions is triple that of reducing NOx (mainly from transport and industry) (ECJRC, 2015).

31
Box 5. Air pollution strategies abroad
Beijing, China
Beijing, China is infamous for being one of the most polluted cities in the world. As host to the 2008 Olympic Games, the Chinese government agreed to impose temporary measures to substantially reduce air pollution in the capital. These measures included the introduction of stricter vehicle emission standards (Euro IV); the relocation/closure of factories; increased fuel (gas) prices; introduction of compressed natural gas-fuelled and retrofitted buses; and the suspension of construction projects1, 2. The odd-even car traffic-reduction scheme was also introduced, whereby vehicles with licence plates ending in odd and even numbers are allowed on the road on alternating days 3. This odd-even strategy has also been used in Delhi, Rome, Paris, and Mexico City4. These measures resulted in short-term improvements in Beijing’s air quality, reducing daily concentrations of SO2 by as much as 60%; CO by 48%; NOx by 47%; PM10 by 55% and PM2.5 by 27% during the Olympic Games1,5. Such was the extent of the improvements in air quality, that it was reflected in improved health of the local population. Health benefits of the reduced pollution levels in Beijing included:
Increased birth weight: a peak in birth-weights of babies with those in their third trimester in 2008 weighing on average 23 grams more than those at the same stage of pregnancy in 2007 or 2009.6
Improved heart health: during the period of improved air quality, there were significant decreases in the number of cardiovascular and respiratory deaths 1,3
Fewer outpatient asthma visits: there was a 41.6% decrease in the average daily asthma visits which was attributed to the reduction in PM pollution.7
The Games had raised awareness of China’s air pollution problem, demonstrating that the implementation of certain measures can successfully improve air quality to the extent that significant improvements in public health are achieved.
Milan, Italy
An example of successful traffic management strategies abroad includes the “Area C” zone in Milan. It combines LEZ and congestion charge schemes to only allow vehicles which are of Euro 3 (diesel) or Euro 1 (petrol) standard entry into the zone upon payment of a charge. As a result, incoming traffic declined by 30%, whilst emissions of traffic-related pollutants fell by the following amounts:
PM10 by 18%
NOx by 10%
NH3 by 31%
CO2 by 22%
Black Carbon (BC) by 43%8
1 Zhang et al (2013) 2 UNEP (2009) 3 Guojun et al (2015) 4 European Environmental Bureau, 2005 5 Wang, S. et al (2010) 6 Rich et al (2015) 7 Li et al (2010) 8 Urban Access Regulations (2015)

32
ENERGY PRODUCTION
The energy industry is another leading source of emissions (Table 3). Energy is largely a reserved matter, although Scotland does have powers to promote renewable energy generation and energy efficiency, and gains new powers for onshore oil and gas licensing under the Scotland Act 2016 (UK Government, 2016). In terms of air pollution, the energy industry is regulated by the Industrial Emissions Directive (IED) 2010/75/EC which sets the annual emission standards for SO2, NOX, and PM from large combustion plants (LCPs) implemented in the UK’s National Emission Reduction Plan (NERP) (UK Government, 2016). Under Article 32 of the IED, existing LCPs can establish a Transitional National Plan (TNP) which will exempt them from emission limits between 1st January 2016 and 30 June 2020, instead imposing an annual emissions “ceiling”. The TNP allows participants to trade these emissions allowances with other participating plants. The main sources of power generation are coal, oil, gas, nuclear and renewable. In their Electricity Generation Policy Statement (EGPS) (Scottish Government, 2013b), the Scottish Government proposes to have a largely decarbonised electricity system by 2030. This largely requires the expansion of renewable energy, alongside developments in thermal capacity and the employment of Carbon Capture and Storage (CCS) technology. The Government intends to gradually phase out nuclear power, with the two remaining stations, Hunterston B and Torness, due to close in 2023 and 2030 (at the earliest) respectively (Scottish Government, 2013b, BBC News, 2016). The Scottish Government (2011, 2013b) has set the following targets for 2020:
at least 30% overall energy demand from renewables
100% of gross annual electricity consumption from renewables
30% of total Scottish energy demand from renewables
11% heat demand and 10% of transport fuels from renewables
500 MW community and locally-owned renewable energy
Scotland has the largest offshore renewable energy resources in the EU, accounting for 25% of the EU’s offshore wind and tidal power, and 10% of wave power (Scottish Government, 2013b). In 2014, 49.7% of Scotland’s gross electricity consumption was generated by renewables, overtaking nuclear power as the leading source of electricity for the first time. This came mainly from wind (62%) and hydro (29%) power, and was on course to meet the 2015 interim target of 50% (Scottish Government, 2016). In 2014, the UK Government approved funding for the world’s first gas CCS project at the Peterhead power station in Aberdeenshire through collaboration between SSE and Shell (UK Government, 2014). The CCS technology would capture up to 1 million tonnes of CO2 each year, which will be transported 100km offshore to be stored 2km under the North Sea in the Goldeneye gas field (UK Government, 2014).However, this £1 billion grant was later dropped and the project abandoned (BBC News, 2015). This may impede the Scottish Government’s target to demonstrate CCS at a commercial scale in Scotland by 2020 (Scottish Government, 2013b). Coal-use has declined for several decades in Scotland, which has resulted in large declines in SO2 emissions over the past two decades (Scottish Government, 2013c). Scotland’s last coal-fired power station at Longannet in Fife, which is the second largest in the UK and accounted for almost 20% of Scotland’s total power generation, closed on 24th March 2016. There were a number of reasons for the closure, including financial sustainability, carbon pricing and air pollution regulations (BBC News, 2015b, Macalister, 2016).

33
The depletion of fossil fuels has led to increased energy prices and has also driven the use of alternative fuels which may affect air pollution. Wood burning as a method of home heating is becoming increasingly popular in Europe. Wood smoke contributes to both outside and indoor air pollution, comprising PM10, SO2, CO, NOx and other gases which are associated with chronic bronchitis, reduced lung function, impaired resistance to infections, and aggravation of asthma (Zelikoff et al, 2002, Bølling et al, 2009). In the UK, the Smoke Control Areas (Exempt Fireplaces) (Scotland) Order 2007 provides an exemption to section 20 of the Clean Air Act 1993, and permits the use of wood-burning stoves and fireplaces in smoke control areas provided the fuel and the appliance are included in the approved list published by Defra. The UK Government has indicated support for the hydraulic fracturing (fracking) industry as a source of shale gas and unconventional oil (Hellier, 2015). Fracking could have implications for air pollution, as demonstrated in a report by researchers at the University of Newcastle which indicated that fracking could lead to short-term increases in NOx as great as 30% owing to the impact of road traffic generated by fracking operations (Goodman et al, 2016). In 2015, the Scottish Government announced a moratorium on fracking in Scotland, awaiting further research and public consultation (Scottish Government, 2015e). This announcement, which came days after the UK Government rejected a moratorium, acknowledged the dangers of increased traffic emissions associated with on-shore fracking.
URBAN PLANNING
The layout of buildings and roads can have substantial impacts on air pollution. Many of the UK’s pollution hotspots are located on streets lined with tall buildings (“street canyons”) which impede air circulation, preventing the dissipation of emissions from vehicle exhausts. Schools are often located near busy roads with high levels of air pollution, which could have harmful effects of the health of young children, given they are one of the most vulnerable groups. The Scottish Planning Policy (Scottish Government, 2014) requires that planning authorities consider the need for buffer zones “which will protect all sensitive receptors from unacceptable risks” at distances which meet the approval of the Scottish Government. A “sensitive receptor” is defined as an environmental factor (e.g. air) which is likely to be significantly affected by a development.
The Scottish Government has funded schemes to impose 20mph zones around primary schools and some local authorities have imposed parking restrictions on roads in the vicinity of schools at the start and end of the school day (Scottish Government, 2016). These measures should help to reduce the exposure of children to air pollution.
The creation of “green spaces” in urban areas is a relatively easy and cheap way to reduce air pollution. Vegetation can help to reduce air pollution levels by improving air flow, absorbing gasses and providing a greater surface area for deposition of PM. In various scenarios, both urban and rural, an increase in tree cover has been shown to:
reduce NH3 deposition by up to 30%2
reduce SO2 and O3 concentrations by 20%3
remove up to 26% of primary PM104
The Scottish Government promoted the implementation of green spaces in its Green Infrastructure: Design and Placemaking report in 2011. Tree planting is not without its drawbacks, however, as various species produce volatile organic compounds (VOCs) which can
2 Dragosits et al, 2007
3 Beckett et al., 1998
4 McDonald et al, 2007

34
actually reduce air quality, may produce pollen which could aggravate symptoms in hay-fever sufferers and can also result in the accumulation of toxic pollutants in the soil (Dragosits et al, 2007). Nonetheless, the overall benefits of air quality improvements may well outweigh these costs.
AIR POLLUTION AND CLIMATE CHANGE
The merging of air quality and climate change policies where possible can help to both minimise confusion and maximise effectiveness. This involves a cross-departmental effort as it affects a broad array of sectors, chiefly health, the environment, transport and agriculture. Dr Carlos Dora (Coordinator for Public Health, Environmental and Social Determinants of Health for the World Health Organisation (WHO), 2014) argues that the measures to reduce air pollution are generally “more economical in the long term due to health-care cost savings as well as climate gains”. It is also important to consider that emissions of air pollutants may be affected by climate change, although the impacts of this remain unclear (RoTAP, 2012).
CRITICISMS OF AIR QUALITY GOVERNANCE IN THE UK & SCOTLAND
UK
Before publishing the plans as demanded by the Supreme Court (Box 3), the UK government launched a public consultation on their proposed plans and received a total of 729 responses (Defra, 2016, IAQM, 2015, London Council, 2015, Holder, 2015, Birkett, 2015). The main criticisms of the plans were that they:
Lacked ambition: particularly with regard to road transport, with several calling for the inclusion of scrappage schemes, and changes to vehicle excise and fuel duty. The Clean Air Zones and Low Emissions Zones (LEZs) were accused of being too small and too lenient with many LEZ’s applying restrictions to buses only.
Lacked evidence and technical information: the computer modelling methodology that was used in the report to predict future road transport emissions is widely believed to significantly underestimate actual road emissions.
Lacked urgency: the plans estimate that NO2 limits would be met by 2025 in London and 2020 in most other zones, which some argued is over-optimistic under the proposed plans, and does not comply with the EU stipulation that legal pollution levels should be achieved in the shortest possible time.
Placed too much responsibility on local authorities: which lack the power and funding for tackling air pollution.
More recently, the House of Commons Environment, Food and Rural Affairs Committee (2016) called for urgent Government action to halt air pollution related deaths, which it called a “public health emergency” – recommendations include:
Greater devolution of controls over the implementation of Clean Air Zones; Communities must be able to tailor controls to meet their own circumstances, e.g. to charge vehicles to access Zones at certain times of day or to target specific bus routes.
Cut transport emissions by introducing a vehicle scrappage scheme for diesel engines that are over 10 years old.

35
Tackle agricultural emissions by helping farmers to adopt modern practices that cut emissions of greenhouse gases and local air pollutants including ammonia.
Scotland
Several commentators and stakeholder organisations, including Friends of the Earth Scotland (FoES) and the Institute of air Quality Management (IAQM), commended the Scottish Government’s CAFS report for the ambitious targets it sets (listed above) and its vision that “Scotland’s air quality will be the best in Europe” (IAQM, 2015). It was also praised for its recognition of the importance of town planning and climate change in shaping air pollution policies. However, FoES claimed that the CAFS report lacks robust and sufficient plans for transport and that the proposed efforts to encourage a “modal shift” (i.e. getting vehicles off the roads and more people walking/cycling instead) encapsulated in the Cycling Action Plan for Scotland (CAPS) and the National Walking Strategy Delivery Plan were too weak. As with the UK Government’s proposals, the Scottish Government’s prediction that compliance with EU limits would not be achieved until 2020 was deemed to be too late by some (Holder, 2015). Some argue that CAFS does not comply with Annex XV of the EC Ambient Air Directive with respect to the list of information which must be included in the plans, such as an “estimate of the improvement of air quality planned and of the expected time required to attain these objectives”. These points were amongst those raised during a Scottish Parliament debate on air pollution in November 2015.

36
SOURCES
Air Quality Consultants Ltd. (2012) PM2.5 in Scotland: A Report for SEPA. Available at: https://www.sepa.org.uk/media/163161/pm2_5-in-scotland-final.pdf [Accessed 30 March 2016]. Air Quality Expert Group (2012) Fine Particulate Matter (PM2.5) in the United Kingdom. Available at: http://uk-air.defra.gov.uk/assets/documents/reports/cat11/1212141150_AQEG_Fine_Particulate_Matter_in_the_UK.pdf [Accessed 30 March 2016]. Air Quality Expert Group (2007). Air Quality and Climate Change: A UK Perspective. Available at: http://uk-air.defra.gov.uk/assets/documents/reports/aqeg/fullreport.pdf [Accessed 30 March 2016]. Air Quality News (2016). Higher air pollution health risk inside car, study finds. 16 February 2016. Available at: http://www.airqualitynews.com/2016/02/16/higher-air-pollution-health-risk-inside-car-study-finds/ [Accessed 30 March 2016]. Air Quality News (2016). Real-world driving emissions tests pass crucial EU vote. 3 February 2016. Available at: http://www.airqualitynews.com/2016/02/03/real-world-driving-emissions-tests-pass-crucial-eu-vote/ [Accessed 30 March 2016]. Air Quality News (2016). EU seeks more power over car approval after VW scandal. 27 January 2016. Available at: http://www.airqualitynews.com/2016/01/27/eu-seeks-more-power-over-car-approval-after-vw-scandal/ [Accessed 30 March 2016]. Air Quality News.com (2015) Air pollution ‘costs UK economy £54 billion a year’. 28 April 2015. Available at: http://www.airqualitynews.com/2015/04/28/air-pollution-costs-uk-economy-54-billion-a-year/ [Accessed 30 March 2016]. ApSimon, H. and Oxley, T. (2013). Analysis of the air quality impacts of potential CCC scenarios – Final report for Defra contract AQ095. Imperial Consultants Ltd Available at: https://www.theccc.org.uk/wp-content/uploads/2013/12/Air-quality-impacts-of-potential-CCC-scenarios.pdf [Accessed 30 March 2016]. Asman, W.A.H., Sutton, M.A., and Schjoerring, J.K. (1998) Ammonia: emission, atmospheric transport and deposition. New Phytologist 139, p. 27-48. Available at: http://onlinelibrary.wiley.com/doi/10.1046/j.1469-8137.1998.00180.x/full [Accessed 30 March 2016]. Avnery, S. et al (2011) Global crop yield reductions due to surface ozone exposure: 2. Year 2030 potential crop production losses and economic damage under two scenarios of O3 pollution. Atmospheric Environment 45, p. 2297-2309. Available at: http://www.sciencedirect.com/science/article/pii/S1352231011000070 [Accessed 30 March 2016]. Barrat, B. et al (2012) Evaluation of the impact of dust suppressant application on ambient Pm10 concentrations in London. – Prepared for Transport for London by Kings College London, Environmental Research group. Available at: http://content.tfl.gov.uk/evaluation-dust-suppressants-pmconcentrations.pdf [Accessed 30 March 2016]. BBC News (2016) Torness nuclear plant has operating life extended by EDF. 16 February 2016. Available at: http://www.bbc.co.uk/news/uk-scotland-35581272 [Accessed: 8 April 2016].
37
BBC News (2015a). UK government carbon capture £1bn grant dropped. 25 November 2015. Available at: http://www.bbc.co.uk/news/uk-scotland-scotland-business-34357804 [Accessed 30 March 2016]. BBC News (2015b). Longannet power station to close in March. 18 August 2015. Available at: http://www.bbc.co.uk/news/uk-scotland-edinburgh-east-fife-33970594 [Accessed 30 March 2016]. BBC News (2005). Edinburgh rejects congestion plan. 22 February 2005. Available at: http://news.bbc.co.uk/1/hi/scotland/4287145.stm [Accessed 30 March 2016]. BBC News (2003) UK centre of global asthma crisis. 18 February 2003. Available at: http://news.bbc.co.uk/1/hi/health/3492731.stm [Accessed 30 March 2016]. Beckett, K.P., Freer-Smith, P.H., and Taylor, G. (1998). Urban woodlands: their role in reducing the effects of particulate pollution. Environmental Pollution 99, p.347–360. Available at: http://www.sciencedirect.com/science/article/pii/S0269749198000165 [Accessed 30 March 2016] Beevers, S.D. and Carslaw, D.C. (2005) The impact of congestion charging on vehicle emissions in London. Atmospheric Environment 39, p.1-5. Available at: http://www.sciencedirect.com/science/article/pii/S1352231004009513 [Accessed; 5 April 2016] Bell, M.L., Davis, D.L. and Fletcher, T. (2004) A Retrospective Assessment of Mortality from the London Smog Episode of 1952: The Role of Influenza and Pollution. Environmental Health Perspectives. 112, p.6-8. Available at: http://www.ncbi.nlm.nih.gov/pmc/articles/PMC1241789/pdf/ehp0112-000006.pdf [Accessed 30 March 2016]. Birkett, S. (2015) Defra NO2 consultation: ‘Plan for plans by others’ is inadequate. Clean Air in London, 12 September 2015. Available at: http://cleanair.london/sources/defra-buries-consultation-on-diesel-ban-in-cities-minutes-before-corbyn-announcement/ [Accessed 30 March 2016]. Bittman, S. et al (2014) Options for Ammonia Mitigation: Guidance from the UNECE Task Force on Reactive Nitrogen. Centre for Ecology and Hydrology, Edinburgh, UK. Available at: http://www.clrtap-tfrn.org/sites/clrtap-tfrn.org/files/documents/AGD_final_file.pdf [Accessed 30 March 2016]. Bølling, AK et al (2009) Health effects of residential wood smoke particles: the importance of combustion conditions and physiochemical particle properties. Particle and Fibre Toxicology 6, p.29 DOI: 10.1186/1743-8977-6-29. Available at: http://particleandfibretoxicology.biomedcentral.com/articles/10.1186/1743-8977-6-29 [Accessed 30 March 2016]. Booker, F.L. et al (2009). The ozone component of global change: potential effects on agricultural and horticultural plant yield, product quality and interactions with invasive species. Journal of Integrative Plant Biology 51, p.337-351. Available at: http://onlinelibrary.wiley.com/doi/10.1111/j.1744-7909.2008.00805.x/abstract [Accessed 30 March 2016]. Bowatte, G et al (2014) The influence of childhood traffic-related air pollution exposure on asthma, allergy and sensitization: a systematic review and a meta-analysis of birth cohort

38
studies. European Journal of Allergy and clinical Immuology. 70, p.245-256. Available at: http://onlinelibrary.wiley.com/doi/10.1111/all.12561/pdf [Accessed 30 March 2016]. Boyce, L. (2014) Drivers who try to dodge the diesel car trap by having particulate filter removed will now automatically fail MOTs. This is Money, 20 February 2014. Available at: http://www.thisismoney.co.uk/money/cars/article-2562046/Diesel-cars-particulate-filter-removed-fail-MOT.html [Accessed 30 March 2016]. Brauer, M. et al (2015) Ambient Air Pollution Exposure Estimation for the Global Burden of Disease 2013. Environmental Science & Technology 50, p.79-88. Available at: http://pubs.acs.org/doi/pdf/10.1021/acs.est.5b03709 [Accessed 30 March 2016]. British Heart Foundation (no year available) Air pollution Policy Statement. Available at: https://www.bhf.org.uk/publications/policy-documents/air-pollution-policy-statement [Accessed 30 March 2016]. British Heart Foundation (2014) Cardiovascular Disease Statistics 2014. Available at: https://www.bhf.org.uk/publications/statistics/cardiovascular-disease-statistics-2014 [Accessed 30 March 2016]. Carrington, D. (2016) Calls for pollution tax on sales of new diesel cars in Britain. The Guardian, 11th March 2016. Available at: http://www.theguardian.com/environment/2016/mar/11/call-for-pollution-tax-on-sales-of-new-diesel-cars-in-britain [Accessed 30 March 2016]. Carslaw, D.C. et al (2011). Trends in NOx and NO2 emissions and ambient measurements in the UK. Version: July 2011. Available at: http://uk-air.defra.gov.uk/assets/documents/reports/cat05/1108251149_110718_AQ0724_Final_report.pdf [Accessed 30 March 2016]. Centre for Chemical for Chemical Process Safety (CCPS) (2006) Historical Perspective on Air Pollution control. In: Safe Design and Operation of Process Vents and Emission Control Systems. P.297-307. Hoboken, NJ, USA: John Wiley & Sons, Inc. Available at: http://onlinelibrary.wiley.com/doi/10.1002/0470038071.app9/pdf [Accessed 30 March 2016]. Clean Air Act 1956. Available at: http://www.legislation.gov.uk/ukpga/Eliz2/4-5/52/enacted [Accessed: 31 March 2016] ClientEarth, (2016). Final legal warning gives government 10 days to act on air pollution. 1 March 2016. Available at: http://www.clientearth.org/news/latest-news/final-legal-warning-gives-government-10-days-to-act-on-air-pollution-3166 [Accessed 30 March 2016]. Committee on the Medical Effects of Air pollutants (COMEAP) (2015) Quantification of Mortality and Hospital Admissions Associated With Ground-level Ozone. Available at: https://www.gov.uk/government/uploads/system/uploads/attachment_data/file/492949/COMEAP_Ozone_Report_2015__rev1_.pdf [Accessed: 1 April 2016]. COMEAP (2011) Review of the UK Air Quality Index. Available at: https://www.gov.uk/government/uploads/system/uploads/attachment_data/file/304633/COMEAP_review_of_the_uk_air_quality_index.pdf [Accessed: 8 April 2016]. Committee on the Medical Effects of Air pollutants (COMEAP) (2010) The Mortality Effects of Long-Term Exposure to Particulate Air pollution in the United Kingdom. Available at: https://www.gov.uk/government/uploads/system/uploads/attachment_data/file/304641/COMEAP_mortality_effects_of_long_term_exposure.pdf [Accessed: 1 April 2016]

39
de Hartog, J. J. et al (2010) Do the Health Benefits of Cycling Outweigh the Risks? Environmental Health Perspectives, 118 (8), p.1109-1116. Available at: http://www.ncbi.nlm.nih.gov/pmc/articles/PMC2920084/ [Accessed: 5 April 2016]. Department of Health (2012). An Outcomes Strategy for COPD and Asthma: NHS Companion Document. Available at: https://www.gov.uk/government/uploads/system/uploads/attachment_data/file/216531/dh_134001.pdf [Accessed 30 March 2016]. Department for Environment, Food and Rural Affairs (no year available) Ammonia in the UK – Key Points. Available at: http://www.gov.scot/Resource/Doc/1052/0002247.pdf [Accessed 30 March 2016]. Department for Environment, Food and Rural Affairs (2016). Summary of responses to the government’s consultation on draft air quality plans. Available at: https://www.gov.uk/government/uploads/system/uploads/attachment_data/file/496881/air-quality-plans-consult-sum-resp.pdf [Accessed 30 March 2016]. Department for Environment, Food and Rural Affairs (2015). Statistical Release: Emissions of air pollutants in the UK 1970-2014. Available at: https://www.gov.uk/government/uploads/system/uploads/attachment_data/file/486085/Emissions_of_air_pollutants_statistical_release_2015_-_Final__2_.pdf [Accessed 30 March 2016]. Department for Environment, Food and Rural Affairs (2015). Consultation on draft plans to improve air quality- Tackling nitrogen dioxide in our towns and cities. Available at: https://consult.defra.gov.uk/airquality/draft-aq-plans/supporting_documents/Consultation%20document%20%20draft%20plans%20to%20improve%20air%20quality.%20September%202015%20final%20version%20folder.pdf [Accessed 30 March 2016]. Department for Environment, Food and Rural Affairs (2007) The Air Quality Strategy for England, Scotland, Wales and Northern Ireland- Volume 1. Available at: https://www.gov.uk/government/uploads/system/uploads/attachment_data/file/69336/pb12654-air-quality-strategy-vol1-070712.pdf [Accessed 30 March 2016]. Department for Transport (2004). The Future of Transport - Protecting the environment. Available at: http://webarchive.nationalarchives.gov.uk/20040722033424/http:/www.dft.gov.uk/strategy/futureoftransport/chapter10/challenge.htm [Accessed 30 March 2016]. Donaldson, L. (2010) On the state of public health: annual report of the chief medical officer 2009. Department of Health, Crown Copyright (2010), p. 2010 Available at: http://webarchive.nationalarchives.gov.uk/20130107105354/http:/www.dh.gov.uk/en/Publicationsandstatistics/Publications/AnnualReports/DH_113912 [Accessed: 5 April 2016]. Dragosits, U. et al (2006). The potential for spatial planning at the landscape level to mitigate the effects of atmospheric ammonia deposition. Environmental Science & Policy, 9, p.626-638. Available at: http://www.sciencedirect.com/science/article/pii/S1462901106001031 [Accessed 30 March 2016]. EC Joint Research Centre workshop (2015). Sustainable Agriculture and Air Pollution: reducing Emissions leads to many benefits. Event at the Milan World Expo, July 10, 2015. Workshop report. Available at:

40
https://ec.europa.eu/jrc/sites/default/files/Report_for_dissemination_Sustainable%20Air%20pollution%20and%20Air%20Pollution_v3.pdf [Accessed 30 March 2016]. Edwards, R. (2016) Public health at risk as Scotland faces 'air pollution crisis'. Herald, 17 January 2016. Available at: http://www.heraldscotland.com/news/14210100.Public_health_at_risk_as_Scotland_faces__air_pollution_crisis_/ [Accessed 30 March 2016]. Energy Savings Trust (2015) Scottish motorists to get £2.5 million electric car boost. Available at: http://www.energysavingtrust.org.uk/news/scottish-motorists-get-%C2%A325-million-electric-car-boost [Accessed: 5 April 2016]. Environment Act 1995 c. 25 Part IV Air Quality. Available at: http://www.legislation.gov.uk/ukpga/1995/25/part/IV [Accessed: 31 March 2016]. European Commission (2014) Environment: Commission takes action against UK for persistent air pollution problems. Press Release: Brussels, 20 February 2014. Available at: http://europa.eu/rapid/press-release_IP-14-154_en.htm [Accessed: 8 April 2016]. European Environment Agency (EEA) (2010). Emissions of primary PM2.5 and PM10 particulate matter. Available at: http://www.eea.europa.eu/data-and-maps/indicators/emissions-of-primary-particles-and-5 [Accessed 30 March 2016]. The European Environmental Bureau (2005) Particle reduction plans in Europe – implementation of the first daughter directive on ambient air quality in Europe. Brussels, Belgium: European Environmental Bureau (EEB). Available at: http://ec.europa.eu/environment/air/quality/legislation/pdf/eeb_report.pdf [Accessed: 5 April 2016]. Environmental Protection Agency (US) (2012) 2012 Report to Congress on Black Carbon-Highlights. Available at: https://www3.epa.gov/blackcarbon/2012report/Highlights.pdf [Accessed: 8 April 2016]. Fangmeier et al (1994). Effects of atmospheric ammonia on vegetation – A Review. Environmental Pollution 86, p.43-82. Available at: http://ac.els-cdn.com/0269749194900086/1-s2.0-0269749194900086-main.pdf?_tid=f5e7911c-d65c-11e5-ad34-00000aab0f26&acdnat=1455813225_d445f0640b659826da17a2371a208707 [Accessed 30 March 2016]. Faulkner, M. and Russel, P. (2010). Review of Local Air Quality Management - A report to Defra and the devolved administrations. Available at: http://www.gov.scot/Resource/Doc/211199/0096175.pdf [Accessed 30 March 2016]. Fiscus, E.L., Brooker, F.L. and Burkey, K.O. (2005). Crop responses to ozone: uptake, modes of action, carbon assimilation and partitioning. Plant, Cell & Environment, 28, p.997-1011. Available at: http://onlinelibrary.wiley.com/doi/10.1111/j.1365-3040.2005.01349.x/full [Accessed 30 March 2016]. Friends of the Earth (2015) Press release: Government clean air plan is inadequate. 17 December 2015. Available at: https://www.foe.co.uk/resource/press_releases/government-clean-air-plan-inadequate_17122015 [Accessed: 31 March 2016] Food and Agriculture Organisation (2006). Prospects for food, nutrition, agriculture and major commodity groups: World agriculture: towards 2030/2050- Interim report. Available at:

41
http://www.fao.org/fileadmin/user_upload/esag/docs/Interim_report_AT2050web.pdf [Accessed 30 March 2016]. Fowler, D. et al (2013). Air Quality review – Research Findings in support of the EU. Available at: http://www.accent-network.org/EuAirQualityReview/docs/PDF BASSA.pdf [Accessed 30 March 2016]. Fowler, D. et al (1998). Regional mass budgets of oxidized and reduced nitrogen and their relative contribution to the N inputs of sensitive ecosystems Environmental Pollution (Nitrogen Conference Special Issue) 102, p.337-342. Available at: http://www.sciencedirect.com/science/article/pii/S0269749198800523 [Accessed 30 March 2016]. Fuzzi, S. et al (2015). Particulate matter, air quality and climate: lessons learned and future needs. Atmos. Chem. Phys., 15, p.8217-8299. Available at: http://www.atmos-chem-phys.net/15/8217/2015/acp-15-8217-2015.html [Accessed 30 March 2016]. Gauderman et al, (2004). The Effect of Air Pollution on Lung Development from 10 to 18 Years of Age. The New England Journal of Medicine, 351, p.1057-1067. Available at: http://www.nejm.org/doi/full/10.1056/NEJMoa040610 [Accessed 30 March 2016]. Gaunt et al (2007). Public acceptability of Road User Charging: The Case of Edinburgh and the 2005 Referendum. Transport Reviews 27, p.85-102. Available at: http://www.geos.ed.ac.uk/homes/sallen/gaunt_et_al_2007.pdf [Accessed 30 March 2016]. Goodman, P.S. et al (2016). Investigating the traffic-related environmental impacts of hydraulic-fracturing (fracking) operations. Environmental International, 89-90, p.248-260. Available at: http://www.sciencedirect.com/science/article/pii/S0160412016300277 [Accessed 30 March 2016]. Grant-Muller, S. and Laird, J. (2006). Costs of congestion: Literature based review of methodologies and analytical approaches. Scottish Executive Social Research 2006. Available at: http://www.gov.scot/Resource/Doc/153566/0041321.pdf [Accessed 30 March 2016]. Gregg, J. W., Jones, CG and Dawson, TW (2003) Urbanization effects on tree growth in the vicinity of New York City. Nature, 424, p. 183-187. Available at: http://www.nature.com/nature/journal/v424/n6945/full/nature01728.html [Accessed: 8 April 2016]. GreenChem (2013) AdBlue? All you need to know about AdBlue: the facts, myths and usage. GreenChem Solutions Ltd. Available at: http://www.halfords.com/wcsstore/libraries/document/AdBluebooklet.pdf [Accessed: 5 April 2016] Grigoratos, T. and Martini, G. (2014). Non-exhaust traffic related emissions. Brake and tyre wear PM – Literature Review. Science and Policy Report by the Joint Research Centre, Institute of Energy and Transport. Available at: http://publications.jrc.ec.europa.eu/repository/bitstream/JRC89231/jrc89231-online%20final%20version%202.pdf [Accessed 30 March 2016]. The Guardian (2016) China to build ventilation ‘corridors’ in Beijing to help tackle air pollution. 21 February 2016. Available at: http://www.theguardian.com/world/2016/feb/21/china-to-build-ventilation-corridors-in-beijing-to-help-tackle-air-pollution [Accessed 30 March 2016].

42
Guarnieri, M. & Balmes, J.R. (2014). Outdoor air pollution and asthma. The Lancet 282, p.1581-1592. Available at: http://www.sciencedirect.com/science/article/pii/S0140673614606176 [Accessed 30 March 2016]. Guojun, H.E. et al (2015) The Effect of Air Pollution on Mortality in China: Evidence from the 2008 Beijing Olympic Games. HKUST IEMS Working Paper No. 2015-3. Available at: http://iems.ust.hk/wp-content/uploads/2015/02/IEMSWP2015-03.pdf [Accessed 30 March 2016]. Hansell, A. et al (2015) Historic air pollution exposure and long-term mortality risks in England and Wales: prospective longitudinal cohort study. Thorax, doi:10.1136/thoraxjnl-2015-207111. Available at: http://thorax.bmj.com/content/early/2016/02/01/thoraxjnl-2015-207111.full [Accessed: 8 April 2016]. Harvey, F. (2014). The great diesel scandal: how cheap fuel is choking our cities. The Guardian, 6 August 2014. Available at: http://www.theguardian.com/environment/2014/aug/06/diesel-scandal-cheap-fuel-choking-cities [Accessed 30 March 2016]. Hayes, F. et al (2016) Consistent ozone-induced decreases in pasture forage quality across several grassland types and consequences for UK lamb production. Science of The Total Environment, 543, p.336-346. Available at: http://www.sciencedirect.com/science/article/pii/S004896971530944X [Accessed 30 March 2016]. Health Act 2006 c. 28. Available at: http://www.legislation.gov.uk/ukpga/2006/28/pdfs/ukpga_20060028_en.pdf [Accessed: 8 April 2016]. Hellier, D. (2015) UK government hands out new fracking licences. The Guardian, 17 December 2015. Available at: http://www.theguardian.com/environment/2015/dec/17/fracking-uk-government-hands-out-new-licences [Accessed: 5 April 2016]. Hitchcock, G. et al (2014) Air Quality and Road Transport – Impacts and Solutions. RAC Foundation Available at: http://www.racfoundation.org/assets/rac_foundation/content/downloadables/racf_ricardo_aea_air_quality_report_hitchcock_et_al_june_2014.pdf [Accessed 30 March 2016]. Holder, M. (2016) Defra air quality plan ‘in breach’ of court ruling. Air Quality News, 17 Novermber 2016. Available at: http://www.airqualitynews.com/2015/11/17/defra-air-quality-plan-in-breach-of-court-ruling/ [Accessed: 8 April 2016]. Holder, M. (2015) Scotland sets out stricter limits in Clean Air Strategy. Air Quality News, 6 November 2015. Available at: http://www.airqualitynews.com/2015/11/06/scotland-sets-out-stricter-limits-in-clean-air-strategy/ [Accessed: 8 April 2016] House of Commons Environment, Food and Rural Affairs Committee (2016) Air Quality. Available at: http://www.publications.parliament.uk/pa/cm201516/cmselect/cmenvfru/479/47902.htm [Accessed 3 May 2016]. Howard, R. (2015) Up in the Air: How to sole London’s Air Quality Crisis: Part 1. Available at: http://www.policyexchange.org.uk/images/publications/up%20in%20the%20air.pdf [Accessed on 31 March 2016].
43
Holman, C. and Helmers, E. (2015). The Truth about Diesel Cars: Open letter to the European public and policy makers. Letter dated 11 December 2015. Available at: http://iaqm.co.uk/text/letters/Truth about Diesel Cars_11Dec15.pdf [Accessed 30 March 2016]. House of Commons Environment, Food and Rural Affairs Committee (2015). Oral evidence: Air quality, HC 479. 9 December 2015. Available at: http://data.parliament.uk/writtenevidence/committeeevidence.svc/evidencedocument/environment-food-and-rural-affairs-committee/air-quality/oral/25958.pdf [Accessed 30 March 2016]. Howard, Beevers and Dajnak (2016) Up In The Air: how to Solve London’s Air Quality Crisis: Part 2. Available at: http://www.policyexchange.org.uk/images/publications/up%20in%20the%20air%20-%20part%202.pdf [Accessed: 31 March 2016] IAQM (2015) Air Quality – Written evidence submitted by the Institute of Air Quality Management. Available at: http://www.iaqm.co.uk/text/consultations/efra_inquiry.pdf [Accessed: 8 April 2016] IARC Working Group on the Evaluation of Carcinogenic Risk to Humans (2014). Diesel and Gasoline Engine Exhausts and Some Nitroarenes. 1. Exposure Data. In: IARC Monographs on the Evaluation of Carcinogenic Risks to Humans, No. 105. 1. Lyon (FR): International Agency for Research on Cancer. Available at: http://www.ncbi.nlm.nih.gov/books/NBK294260/ [Accessed 30 March 2016]. IHME (Institute for Health Metrics and Evaluation) (2016) Poor air quality kills 5.5 million worldwide annually. Available at: http://www.healthdata.org/news-release/poor-air-quality-kills-55-million-worldwide-annually [Accessed 30 March 2016]. Intergovernmental Panel on Climate Change (IPCC) (2007). Climate Change 2007: Synthesis Report. Contribution of Working Groups I, II and III on the Fourth Assessment Report of the Intergovernmental Panel on Climate Change. [Core writing team, Pachauri, RK and Reisinger, A (eds.)] Geneva, Switzerland, 104 pp. Available at: https://www.ipcc.ch/pdf/assessment-report/ar4/syr/ar4_syr_full_report.pdf [Accessed 30 March 2016]. Kernan, R.W. et al (2010). Recovery of lakes and streams in the UK from the effects of acid rain – UK Acid Waters Monitoring Network 20 Year Interpretative Report. Available at: http://awmn.defra.gov.uk/resources/interpreports/20yearInterpRpt.pdf [Accessed 30 March 2016]. Kreutzer, U (2014) Cutting Smog with Data. Siemens. Available at: http://www.siemens.com/innovation/en/home/pictures-of-the-future/industry-and-automation/remote-services-intelligent-traffic-management.html [Accessed: 5 April 2016] Kulmala et al (2011) General overview: European Integrated project on Aerosol Cloud Climate and Air Quality interactions (EUCAARI) – integrating aerosol research from nano to global Scale., Atmospheric Chemistry and Physics, 11, p.13061–13143. Available at: http://www.atmos-chem-phys.net/11/13061/2011/acp-11-13061-2011.html [Accessed 30 March 2016]. Lelieveld et al (2015) The contribution of outdoor air pollution sources to premature mortality on a global scale. Nature Letter 525, p.367-371. Available at: http://www.nature.com/nature/journal/v525/n7569/abs/nature15371.html [Accessed 30 March 2016].

44
Ligterink, N. et al (2009). On-road NOx emissions of Euro-V trucks. TNO. Report MON-RPT-033-DTS-2009-03840. Available at: http://www.leefmilieu.nl/sites/www3.leefmilieu.nl/files/imported/pdf_s/2009-12-02_TNO%20Rapport_On-road%20NOx%20emissions%20of%20Euro-V%20trucks.pdf [Accessed 30 March 2016]. Macalister, T. (2016) Longannet power station closes ending coal power use in Scotland. The Guardian, 24 March 2016. Available at: http://www.theguardian.com/environment/2016/mar/24/longannet-power-station-closes-coal-power-scotland [Accessed: 4 April 2016]. Mackay D.F. et al. (2013) Impact of Scotland’s Comprehensive, Smoke-Free Legislation on Stroke. PLoS ONE 8(5): e62597. Available at: http://www.ncbi.nlm.nih.gov/pmc/articles/PMC3648581/ [Accessed 30 March 2016]. Mackay, D et al (2010) Smoke-free Legislation and Hospitalizations for Childhood Asthma. The New England Journal of Medicine, 363, p.1139-1145. Available at: http://www.nejm.org/doi/full/10.1056/NEJMoa1002861 [Accessed 30 March 2016]. Masoli, M. et al (2004) The global burden of asthma: executive summary of the GINA Dissemination Committee Report. Allergy, 59, p. 4669-478. Available at: http://onlinelibrary.wiley.com/doi/10.1111/j.1398-9995.2004.00526.x/full [Accessed 30 March 2016]. McDonald, A.G. et al (2007) Quantifying the effect of urban tree planting on concentrations and depositions of PM10 in two UK conurbations. Atmospheric Environment, 41, p.8455-8467. Available at: http://www.sciencedirect.com/science/article/pii/S1352231007006140 [Accessed 30 March 2016]. Megaritis et al, (2013). Response of fine particulate matter concentrations to changes of emissions and temperature in Europe. Atmospheric Chemistry and Physics, 13, p.3423–3443. Available at: http://www.atmos-chem-phys.net/13/3423/2013/ [Accessed 30 March 2016]. Menz, F.C. and Seip, H.M. (2004) Acid rain in Europe and the United States: an update. Environmental Science and Policy 7, p.253-265. Available at: http://www.sciencedirect.com/science/article/pii/S1462901104000590 [Accessed 30 March 2016]. Met Office (2015) The Great Smog of 1952. Available at: http://www.metoffice.gov.uk/learning/learn-about-the-weather/weather-phenomena/case-studies/great-smog [Accessed 30 March 2016]. Miller, B. G. & Hurley, J. F. (2006). Comparing Estimated Risks for Air Pollution with Risks for Other Health Effects. Research report TM/06/01, March 2006. Edinburgh: Institute of Occupational Medicine (IOM). Available at: http://www.iom-world.org/pubs/IOM_TM0601.pdf [Accessed 30 March 2016]. Morgan, PB et al (2006) Season-long elevation of ozone concentration to projected 2050 levels under fully open-air conditions substantially decreases the growth and production of soybean. New Phytologist 170, p.333-343. Available at: http://onlinelibrary.wiley.com/doi/10.1111/j.1469-8137.2006.01679.x/full [Accessed 30 March 2016]. Mukherjee, M. et al (2014) Estimating the incidence, prevalence and true cost of asthma in the UK: secondary analysis in England, Northern Ireland, Scotland and Wales – a study protocol.

45
BMJ Open 4:e006647. Available at: http://bmjopen.bmj.com/content/4/11/e006647.full.pdfhtml [Accessed 30 March 2016]. National Atmospheric Emissions Inventory (year unavailable) Pollutant Information: Nitrogen oxides (NOx expressed as NO2). Available at: http://naei.defra.gov.uk/overview/pollutants?pollutant_id=6 [Accessed 31 March 2016]. National Records of Scotland (2015) Vital Events Reference Tables 2014, Section 6: Deaths – Causes. Available at: http://www.nrscotland.gov.uk/files/statistics/vital-events-ref-tables/2014/section-6/14-vital-events-ref-tabs-6-1.pdf [Accessed 30 March 2016]. Natural Hazards Partnership (2015) Air Pollution NHP Science Note: 2015. Available at: http://www.metoffice.gov.uk/nhp/media.jsp?mediaid=17374&filetype=pdf [Accessed: 8 April 2016]. Nelsen, A. (2016) EU parliament fails to close loopholes in controversial car emissions test. The Guardian, 3 February 2016. Available at: http://www.theguardian.com/environment/2016/feb/03/eu-parliament-gives-green-light-for-loopholes-in-car-emissions-tests [Accessed 30 March 2016]. OECD/Food and Agriculture Organization of the United Nations (2015), OECD-FAO Agricultural Outlook 2015, OECD Publishing, Paris. Available at: http://dx.doi.org/10.1787/agr_outlook-2015-en [Accessed: 1 April 2016]. Oenema, O. et al (2011) Chapter 4: Nitrogen in current European policies. In: Mark A. Sutton et al. eds. The European Nitrogen Assessment, p. 62-81. Cambridge: Cambridge University Press. Available at: http://www.nine-esf.org/sites/nine-esf.org/files/ena_doc/ENA_pdfs/ENA_c4.pdf [Accessed 30 March 2016]. Olmo, N. et al (2011) A review of low-level air pollution and adverse effects on human health: implications for epidemiological studies and public policy. Available at: http://www.ncbi.nlm.nih.gov/pmc/articles/PMC3093800/ [Accessed: 1 April 2016]. Pell, J. et al (2008) Smoke-free Legislation and Hospitalizations for Acute Coronary Syndrome. The New England Journal of Medicine 359, p.82-491 Available at: http://www.nejm.org/doi/full/10.1056/NEJMsa0706740 [Accessed 30 March 2016]. Phillips, T. (2015) Beijing issues first pollution red alert as smog engulfs capital. The Guardian, 21 December 2015. Available at: http://www.theguardian.com/environment/2015/dec/07/beijing-pollution-red-alert-smog-engulfs-capital [Accessed 30 March 2016]. Prüss-Ustün, A. et al (2016) Preventing disease through healthy environments: A global assessment of the burden of disease from environmental risks. Available at: http://apps.who.int/iris/bitstream/10665/204585/1/9789241565196_eng.pdf?ua=1 [Accessed: 8 April 2016]. Public Health England (2014) Estimating Local Mortality Burdens associated with Particulate Air Pollution. Available at: https://www.gov.uk/government/uploads/system/uploads/attachment_data/file/332854/PHE_CRCE_010.pdf [Accessed: 8 April 2016]. Rabl, A. and de Nazelle, A. (2012) Benefits from car to active transport. Transport Policy,19, p.121-131. Available at: http://www.sciencedirect.com/science/article/pii/S0967070X11001119 [Accessed 30 March 2016].

46
Rehfisch, A. (2014) SPICe Briefing: Walking and Cycling. Available at: http://www.scottish.parliament.uk/ResearchBriefingsAndFactsheets/S4/SB_14-30.pdf [Accessed: 5 April 2016].
Rich, D.Q. et al (2015) Differences in Birth Weight Associated with the 2008 Beijing Olympic Air Pollution Reduction: Results from a Natural Experiment. Environmental Health Perspectives, doi: 10.1289/ehp1408795. Available at: http://ehp.niehs.nih.gov/wp-content/uploads/advpub/2015/4/ehp.1408795.acco.pdf [Accessed 30 March 2016]. Road Traffic Reduction (National Targets) Act 1998 c. 24. Available at: http://www.legislation.gov.uk/ukpga/1998/24/contents [Accessed: 31 March 2016] RoTAP (2012) Review of Transboundary Air Pollution (RoTAP): Acidification, Eutrophication, Ground Level Ozone and Heavy Metals in the UK. Contract Report to the Department for Environment, Food and Rural Affairs. Centre for Ecology and Hydrology. Available at: http://www.rotap.ceh.ac.uk/ [Accessed 30 March 2016]. Royal College of Physicians (2016). Every breath we take: the lifelong impact of air pollution. Report of a working party. London: RCP. Available at: https://www.rcplondon.ac.uk/projects/outputs/every-breath-we-take-lifelong-impact-air-pollution [Accessed 30 March 2016]. The Royal Society (2008) Ground-level ozone in the 21st century: future trends, impacts and policy implications- Science Policy Report 15/08. Available at: https://royalsociety.org/~/media/Royal_Society_Content/policy/publications/2008/7925.pdf [Accessed 30 March 2016]. Scottish Government (2016a) Energy in Scotland 2016. Available at: http://www.gov.scot/Resource/0049/00494812.pdf [Accessed 30 March 2016]. Scottish Government (2016b) Part IV of the Environment Act 1995 Local Air Quality Management- Policy Guidance PG(S) (16). Available at: http://www.gov.scot/Resource/0049/00497853.pdf [Accessed: 5 April 2016]. Scottish Government (2015a) Agricultural Land Use In Scotland. Available at: http://www.gov.scot/Topics/Statistics/Browse/Agriculture-Fisheries/agritopics/LandUseAll [Accessed 30 March 2016]. Scottish Government (2015b) Cleaner Air For Scotland (CAFS): The Road to A Healthier Future. Available at: http://www.gov.scot/Resource/0048/00488493.pdf [Accessed 30 March 2016]. Scottish Government (2015c) Key Scottish Environment Statistics 2015 – September 2015. Available at: http://www.gov.scot/Resource/0048/00485076.pdf [Accessed 30 March 2016]. Scottish Government (2015d) Low Emissions strategy for Scotland – Consultation. Available at: http://www.gov.scot/Resource/0046/00467625.pdf [Accessed 30 March 2016]. Scottish Government (2015e). Moratorium called on fracking. News release: 28 January 2015. Available at: http://news.scotland.gov.uk/News/Moratorium-called-on-fracking-1555.aspx [Accessed 30 March 2016].

47
Scottish Government (2015f) £2.5 million investment to reduce vehicle emissions. News release 27 February 2015. Available at: http://news.scotland.gov.uk/News/-2-5-million-investment-to-reduce-vehicle-omissions-167c.aspx [Accessed: 5 April 2016]. Scottish Government (2014) Scottish Planning Policy. Available at: http://www.gov.scot/Resource/0045/00453827.pdf [Accessed; 5 April 2016]. Scottish Government (2013a). Consultation On Review Of Local Air Quality Management In Scotland – Analysis Of Responses. Available at: http://www.gov.scot/Resource/0044/00440953.pdf [Accessed 30 March 2016]. Scottish Government (2013b) Electricity Generation Policy statement – 2013. Available at: http://www.gov.scot/Publications/2013/06/5757/3 [Accessed: 5 April 2016]. Scottish Government (2013c) Key Environment Statistics 2013. Available at: http://www.gov.scot/Publications/2013/08/1634 [Accessed: 5 April 2016]. Scottish Government (2011a) 2020 Routemap for Renewable Energy in Scotland. Available at: http://www.gov.scot/Resource/Doc/917/0118802.pdf [Accessed: 2016]. Scottish Government (2011b) Green Infrastructure: Design and Placemaking. Available at: http://www.gov.scot/Publications/2011/11/04140525/0 [Accessed: 5 April 2016]. Scottish Government (2010a). Part IV of the Environment Act 1995 Local Air Quality Management- Policy Guidance PG(S)(09). Available at: http://www.gov.scot/Topics/Environment/waste-and-pollution/Pollution-1/16215/PG09 [Accessed 30 March 2016]. Scottish Government (2010b) Cycling Action Plan for Scotland (CAPS). Available at: http://www.gov.scot/resource/doc/316212/0100657.pdf [Accessed: 5 April 2015]. Scottish Government (2005a) Congestion on Scottish Trunk Roads 2003. Available at: http://www.scotland.gov.uk/library5/transport/congestion-00.asp [Accessed 30 March 2016]. Scottish Government (2005b) Smoking, Health and Social Care (Scotland) Act 2005. Available at: http://www.legislation.gov.uk/asp/2005/13/contents [Accessed 30 March 2016]. Scottish Parliament Rural Affairs, Climate Change and Environment Committee (2016) Official Report 6th Meeting 2016, Session 4, 24 February 2016. Edinburgh: Scottish Parliament. Available at: http://www.scottish.parliament.uk/parliamentarybusiness/report.aspx?r=10394&i=95675 [Accessed 30 March 2016]. Scottish Parliament (2015) Devolution (Further Powers) Committee guide to Scottish Devolution [As at 12 November 2015]. Edinburgh: Scottish Parliament. Available at: http://www.scottish.parliament.uk/WebSPEIRResources/2015.11.10_Citizens_Guide_Draft_FINAL.pdf [Accessed 30 March 2016]. Scottish Parliament. (2012) Parliamentary Question S4W-06033. Edinburgh: Scottish Parliament. Available at: http://www.scottish.parliament.uk/parliamentarybusiness/28877.aspx?SearchType=Advance&ReferenceNumbers=S4W-06033&ResultsPerPage=10 [Accessed: 5 April 2016]

48
Silverman, R.A. et al (2010) Association of Ambient Fine Particles With Out-of-Hospital Cardiac Arrests in New York City. American Journal of Epidemiology, 172(8), p.917-923. Available at: http://aje.oxfordjournals.org/cgi/pmidlookup?view=long&pmid=20729350 [Accessed 30 March 2016]. Singh, A. and Agrawal, M. (2006) Acid rain and its ecological consequences. Journal of Environmental Biology, 29, p.15-24. Available at: http://jeb.co.in/journal_issues/200801_jan08/paper_02.pdf [Accessed 30 March 2016]. Smoking, Health and Social Care (Scotland) Act 2005 asp 13. Available at: http://www.legislation.gov.uk/asp/2005/13/contents [Accessed: 8 April 2016]. Taylor, M. (2016) SMMT Personal communication. [Unpublished]. Supreme Court (2015) PRESS SUMMARY R (on the application of ClientEarth) (Appellant) v Secretary of State for the Environment, Food and Rural Affairs (Respondent) [2015] UKSC 28 On appeal from [2012] EWCA Civ 897. Available at: https://www.supremecourt.uk/cases/docs/uksc-2012-0179-press-summary.pdf [Accessed 30 March 2016]. Sutton, M.A. (2015) Written evidence from Professor Mark Sutton, NERC Centre for Ecology & Hydrology, Edinburgh Research Station (AQU 19). UK Parliament. Available at: http://data.parliament.uk/writtenevidence/committeeevidence.svc/evidencedocument/environment-food-and-rural-affairs-committee/air-quality/written/24884.html [Accessed 30 March 2016]. Sutton, M.A. et al (2004a) Ammonia emission and deposition in Scotland and its potential environmental impacts. The Scientific World Journal, 4, p.795-810. Available at: http://www.hindawi.com/journals/tswj/2004/586392/abs/ [Accessed 30 March 2016]. Sutton, M.A. et al (2004b). The role of trees in landscape planning to reduce the impacts of atmospheric ammonia deposition. In: Smithers, R. ed. Landscape ecology of trees and forests. Proceedings of the twelfth annual IALE (UK) conference, Cirencester, UK, 21-24 June 2004, p.143–150. Available at: https://www.pik-potsdam.de/avec/peyresq2005/talks/0926/sutton/literature/trees_for_nh3.pdf [Accessed 30 March 2016]. Taylor, A. (2016) Personal communication. [Unpublished] Theobald, M.R. et al (2004). AMBER: Ammonia Mitigation by Enhanced Recapture. Impact of Vegetation and/or other On-farm Features on Net Ammonia Emissions from Livestock Farms. Final Report on Project WA0719 to Defra (Land Management Improvement Division). CEH Edinburgh, 22 pp. Tran, M. (2015) UK pushing for limits on air pollution to be relaxed, documents reveal. The Guardian, 13 December 2015. Available at: http://www.theguardian.com/environment/2015/dec/13/uk-pushing-for-limits-air-pollution-relaxed-documents-reveal [Accessed 30 March 2016]. Transport Scotland (2014) Key Transport Statistics February 2014. Glasgow: Transport Scotland. Available at: http://www.transport.gov.scot/statistics/j285664-01.htm [Accessed 30 March 2016]. Transport Scotland (2013) Switched on Scotland: A Roadmap to Widespread Adoption of Plug-in Vehicles. Glasgow: Transport Scotland. Available at:
49
http://www.transport.gov.scot/sites/default/files/documents/rrd_reports/uploaded_reports/j272736/j272736.pdf [Accessed: 5 April 2016]. Twigg, M. M. et al. (2015) Water soluble aerosols and gases at a UK background site – Part 1: Controls of PM2.5 and PM10 aerosol composition. Atmospheric Chemistry and Physics, 15, p.8131-8145. Available at: http://www.atmos-chem-phys.net/15/8131/2015/ [Accessed 30 March 2016]. UK Government (2016a) Transitional National Plan (TNP) and National Emission Reduction Plan (NERP). Available at: https://www.gov.uk/government/collections/national-emissions-reduction-plan-nerp [Accessed 30 March 2016]. UK Government (2016b) Plug-in car and van grants. Available at: https://www.gov.uk/plug-in-car-van-grants/what-youll-get [Accessed: 7 April 2016]. UK Government (2016c) Scotland Act 2016. Available at: http://www.legislation.gov.uk/ukpga/2016/11/contents/enacted [Accessed: 8 April 2016]. UK Government (2015) Annex D: Major events in the Energy Industry. Available at: https://www.gov.uk/government/uploads/system/uploads/attachment_data/file/449006/DUKES_2015_Annex_D.pdf [Accessed 30 March 2016]. UK Government (2013). Diesel particulate filters: guidance note. Available at: https://www.gov.uk/government/uploads/system/uploads/attachment_data/file/263018/diesel-particulate-filters-guidance.pdf [Accessed 30 March 2016]. UN (2014). 7 million premature deaths annually linked to air pollution. News release: 25 March 2014. Available at: http://www.un.org/climatechange/blog/2014/03/7-million-premature-deaths-annually-linked-to-air-pollution/ [Accessed 30 March 2016]. UNECE (2014) Guidance document on preventing and abating ammonia emissions from agricultural sources. Available at: http://www.unece.org/fileadmin/DAM/env/documents/2012/EB/ECE_EB.AIR_120_ENG.pdf [Accessed 30 March 2016]. UNECE (1979) 1979 Convention on Long-Range Transboundary Air Pollution (CLRTAP). Available at: http://www.unece.org/fileadmin/DAM/env/lrtap/full text/1979.CLRTAP.e.pdf [Accessed 30 March 2016]. UNEP. (no year available) Why Is Eutrophication Such a Serious Pollution Problem? In: Lakes and Reservoirs vol. 3 – Water Quality: the Impact of Eutrophication. Available at: http://www.unep.or.jp/ietc/publications/short_series/lakereservoirs-3/1.asp [Accessed 30 March 2016]. UNEP (2009) Independent Environmental Assessment: Beijing 2008 Olympic Games. Available: http://www.unep.org/pdf/BEIJING_REPORT_COMPLETE.pdf [Accessed 30 March 2016]. Urban Access Regulations (2015) Impact of Low Emissions Zones. Available at: http://urbanaccessregulations.eu/low-emission-zones-main/impact-of-low-emission-zones [Accessed: 5 April 2016].

50
US Environmental Protection Agency (US EPA) (2012). Report to Congress on Black Carbon- Highlights. Available at: https://www3.epa.gov/blackcarbon/2012report/Highlights.pdf [Accessed 30 March 2016]. van der Gon , H.A.C.D. et al (2013) The Policy Relevance of Wear Emissions from Road Transport, Now and in the Future- An International Workshop Report and Consensus Statement. Journal of the Air & Waste Management Association, 63(2). Available at: http://www.tandfonline.com/doi/full/10.1080/10962247.2012.741055 [Accessed 30 March 2016]. Vardoulakis, S. and Heaviside, C. (2012). Health effects of Climate Change in the UK 2012: Current evidence, recommendations and research gaps. Health Protection Agency. Available at: https://www.gov.uk/government/uploads/system/uploads/attachment_data/file/371103/Health_Effects_of_Climate_Change_in_the_UK_2012_V13_with_cover_accessible.pdf [Accessed 30 March 2016]. Vidal, J. (2016) Huge cruise ships will worsen London air pollution, campaigners warn. The Guardian, 31 March 2016. Available at: http://www.theguardian.com/environment/2016/mar/31/huge-cruise-ships-will-worsen-london-air-pollution-campaigners-warn [Accessed: 21 March 2016]. Vieno, M. et al (2016) The sensitivities of emissions reductions for the mitigation of UK PM2.5. Atmospheric Chemistry Physics, 16, p.265-276. Available at: http://www.atmos-chem-phys.net/16/265/2016/ [Accessed 30 March 2016]. Velders, G. J. M., Geilenkirchen, G. P., and de Lange, R. (2011). Higher than expected NOx emission from trucks may affect attainability of NO2 limit values in the Netherlands. Atmospheric Environment, 45 (18), p.3025-3033. Available at: http://www.sciencedirect.com/science/article/pii/S1352231011002603 [Accessed 30 March 2016]. Walker, P. (2016) Boris Johnson: ‘I wish I’d built more segregated cycling routes for London’. The Guardian, 8 March 2016. Available at: http://www.theguardian.com/environment/bike-blog/2016/mar/08/boris-johnson-mayor-segregated-cycling-routes-for-london [Accessed: 30 March 2016]. Wang, L., Xu, J. and Qin, P. (2014) Will a driving restriction policy reduce car trips? – The case study of Beijing, China. Transportation Research Part A: Policy and Practice 67, p. 279-290. Available at: http://www.sciencedirect.com/science/article/pii/S0965856414001797 [Accessed: 5 April 2016]. Wang, S. et al (2010) Quantifying the Air Pollutants Emission Reduction during the 2008 Olympic Games in Beijing. Environmental Science and Technology 44 (7), p. 2490-2496. Available at: http://pubs.acs.org/doi/ipdf/10.1021/es9028167 [Accessed: 5 April 2016]. Wardlaw, M.J. (2014) History, risk, infrastructure: perspectives on bicycling in the Netherlands and the UK. Journal of Transport & Health, 1 (4), p.243-250. Available at: http://www.sciencedirect.com/science/article/pii/S2214140514000838 [Accessed: 5 April 2016]. Wilkinson, P. (2015) Written evidence from Professor Paul Wilkinson, Professor of Environmental Epidemiology, London School of Hygiene & Tropical Medicine (AQU 29). Available at: http://data.parliament.uk/writtenevidence/committeeevidence.svc/evidencedocument/environment-food-and-rural-affairs-committee/air-quality/written/26152.html [Accessed: 30 March 2016].
51
Wilkinson, S. et al (2011) how is ozone pollution reducing our food supply? Journal of Experimental Botany, 63 (2), p. 527-536. Available at: http://jxb.oxfordjournals.org/content/63/2/527.full [Accessed: 8 April 2016] World Health Organisation (2016). Air pollution. Available at: http://www.who.int/topics/air_pollution/en/ [Accessed: 8 April 2016]. World Health Organisation (2014). Burden of disease from Ambient Air Pollution for 2012. Available at: http://www.who.int/phe/health_topics/outdoorair/databases/AAP_BoD_results_March2014.pdf?ua=1 [Accessed: 30 March 2016]. World Health Organisation (2013) Outdoor air pollution a leading environmental cause of cancer deaths. Available at: http://www.euro.who.int/en/health-topics/environment-and-health/urban-health/news/news/2013/10/outdoor-air-pollution-a-leading-environmental-cause-of-cancer-deaths [Accessed: 8 April 2016]. World Health Organisation (2006) Health risks of particulate matter from long-range transboundary air pollution. Joint WHO/Convention Task Force on the Health Aspects of Air Pollution. Available at: http://www.euro.who.int/__data/assets/pdf_file/0006/78657/E88189.pdf [Accessed: 30 March 2016]. World Health Organisation (2003) Health Aspects of Air Pollution with Particulate Matter, Ozone and Nitrogen Dioxide - Report on a WHO Working Group. Available at: http://apps.who.int/iris/bitstream/10665/107478/1/E79097.pdf [Accessed: 30 March 2016]. Zap-Map (2016) Search Zap-Map by Location. Available at: https://www.zap-map.com/location-search/?pc=scotland&gc=Scotland&ns=1&skw=&ll=56.4907%2C-4.2026&pg=&rd=&_ajax_nonce=9b80e8e95f [Accessed: 5 April 2016]. Zelikoff, J.T. et al (2002) The Toxicology Of Inhaled Woodsmoke. Journal of Toxicology and Environmental Health, Part B, 5:3, 269-282, Available at: http://www.tandfonline.com/doi/abs/10.1080/10937400290070062 [Accessed: 30 March 2016]. Zhang, J. et al (2013). Cardiorespiratory biomarker responses in healthy young adults to drastic air quality changes surrounding the 2008 Beijing Olympics. Res Rep Health Eff Inst: 174 5-174. Available at: http://www.ncbi.nlm.nih.gov/pubmed/23646463 [Accessed: 30 March 2016]. Zhang, J. et al (2011) Impacts of a Nanosized Ceria Additive on a Diesel Engine Emissions of Particulate and Gaseous Pollutants. Environ. Sci. Technol. 47 (22), p.13077-13085.
52
RELATED BRIEFINGS
SB 14-30 Walking and Cycling Alan Rehfisch (948KB pdf)
Scottish Parliament Information Centre (SPICe) Briefings are compiled for the benefit of the Members of the Parliament and their personal staff. Authors are available to discuss the contents of these papers with MSPs and their staff who should contact Alasdair Reid on extension 85375 or email [email protected]. Members of the public or external organisations may comment on this briefing by emailing us at [email protected]. However, researchers are unable to enter into personal discussion in relation to SPICe Briefing Papers. If you have any general questions about the work of the Parliament you can email the Parliament’s Public Information Service at [email protected].
Every effort is made to ensure that the information contained in SPICe briefings is correct at the time of publication. Readers should be aware however that briefings are not necessarily updated or otherwise amended to reflect subsequent changes.
Published by the Scottish Parliament Information Centre (SPICe), The Scottish Parliament, Edinburgh, EH 99 1SP
www.scottish.parliament.uk


![National Parks (Scotland) Bill - Scottish Parliament Parks (Scotland) Bill/b12s1.pdf · National Parks (Scotland) Bill [AS INTRODUCED] An Act of the Scottish Parliament to make provision](https://img.pdfslide.us/doc/110x75/5edd51c8ad6a402d66685e3b/national-parks-scotland-bill-scottish-parks-scotland-billb12s1pdf-national.jpg)