Embed Size (px)
Citation preview
Address: 480 Smuts Drive, Halfway Gardens | Postal: P O Box 5260, Halfway House, 1685 Tel: +27 (0)11 805 1940 | Fax: +27 (0)11 805 7010
www.airshed.co.za
Air Quality Impact Assessment for the Proposed Kriel Power Station FFP Retrofit
Project done on behalf of Wandima Environmental Services
Report Compiled by: T Bird
Project Manager: R von Gruenewaldt
Report No: 15WES01 | Date: April 2016

Air Quality Impact Assessment for the Proposed Kriel Power Station FFP Retrofit
Report No.: 15WES01 Draft i
REPORT DETAILS
Reviewed by 15WES01
Status Draft
Report Title Air Quality Impact Assessment for the Proposed Kriel Power Station FFP Retrofit
Date April 2016
Client Wandima Environmental Services
Prepared by Terri Bird, PhD (Wits)
Reviewed by Renee von Gruenewaldt, (Pr. Sci. Nat.), MSc (University of Pretoria)
Notice
Airshed Planning Professionals (Pty) Ltd is a consulting company located in Midrand, South Africa, specialising in all aspects of air quality, ranging from nearby neighbourhood concerns to regional air pollution impacts as well as noise impact assessments. The company originated in 1990 as Environmental Management Services, which amalgamated with its sister company, Matrix Environmental Consultants, in 2003.
Declaration Airshed is an independent consulting firm with no interest in the project other than to fulfil the contract between the client and the consultant for delivery of specialised services as stipulated in the terms of reference.
Copyright Warning
Unless otherwise noted, the copyright in all text and other matter (including the manner of presentation) is the exclusive property of Airshed Planning Professionals (Pty) Ltd. It is a criminal offence to reproduce and/or use, without written consent, any matter, technical procedure and/or technique contained in this document.
REVISION RECORD
Revision Number Date Reason for Revision
Draft April 2016 For Client Review
Air Quality Impact Assessment for the Proposed Kriel Power Station FFP Retrofit
Report No.: 15WES01 Draft ii
ABBREVIATIONS
Airshed Airshed Planning Professionals (Pty) Ltd
ADF Ash disposal facility
AEL Atmospheric Emissions Licence
AIR Atmospheric Impact Report
AMS American Meteorological Society
AQA Air Quality Act
AQM Air quality management
AQG(s) Air Quality Guideline(s)
AQSRs Air Quality Sensitive Receptor(s)
AST Anemometer starting threshold
ASTM American Society for Testing and Materials
BAT Best available technology
CSP Coal stock-pile
DEA Department of Environmental Affairs
ESP Electrostatic precipitator
FFP Fabric Filter Plant
GLCs Ground-level concentration(s)
HPA Highveld Priority Area
I&APs Interested and Affected Parties
IFC International Finance Corporation
IPPC Integrated Pollution Prevention and Control
ISC Industrial Source Complex Short Term
IT Interim Target
mamsl Meters above mean sea level
MES Minimum Emission Standards
NAAQ Limit National Ambient Air Quality Limit concentration
NAAQS National Ambient Air Quality Standards (as a combination of the NAAQ Limit and the allowable frequency of
exceedance)
NEM(A) National Environmental Management (Act)
SABS South African Bureau of Standards
SANAS South African National Accreditation System
US-EPA United States Environmental Protection Agency
Air Quality Impact Assessment for the Proposed Kriel Power Station FFP Retrofit
Report No.: 15WES01 Draft iii
GLOSSARY
Air pollution(a) The presence of substances in the atmosphere, particularly those that do not occur naturally
Dispersion(a) The spreading of atmospheric constituents, such as air pollutants
Dust(a) Solid materials suspended in the atmosphere in the form of small irregular particles, many of which are microscopic in size
Instability(a) A property of the steady state of a system such that certain disturbances or perturbations introduced into the steady state will increase in magnitude, the maximum perturbation amplitude always remaining larger than the initial amplitude
Mechanical mixing(a) Any mixing process that utilizes the kinetic energy of relative fluid motion
Oxides of nitrogen (NOx)
The sum of nitrogen oxide (NO) and nitrogen dioxide (NO2) expressed as nitrogen dioxide (NO2)
Particulate matter (PM)
Total particulate matter, that is solid matter contained in the gas stream in the solid state as well as insoluble and soluble solid matter contained in entrained droplets in the gas stream
PM2.5 Particulate Matter with an aerodynamic diameter of less than 2.5 μm
PM10 Particulate Matter with an aerodynamic diameter of less than 10 μm
Stability(a) The characteristic of a system if sufficiently small disturbances have only small effects, either decreasing in amplitude or oscillating periodically; it is asymptotically stable if the effect of small disturbances vanishes for long time periods
Notes:
(a) Definition from American Meteorological Society’s glossary of meteorology (AMS, 2014)
Air Quality Impact Assessment for the Proposed Kriel Power Station FFP Retrofit
Report No.: 15WES01 Draft iv
SYMBOLS AND UNITS °C Degree Celsius
CH4 Methane
CO Carbon monoxide
CO2 Carbon dioxide
g Gram(s)
g/s Gram(s) per second
K Kelvin (temperature)
kg Kilograms
1 kilogram 1 000 grams
km² Square kilometre
kpa kilo Pascal
m Meters
m/s Meters per second
MW Megawatt
MWth Megawatt (thermal output)
µg Microgram(s)
µg/m³ Micrograms per cubic meter
µm Micrometre
mg Milligram(s)
mg/Nm³ Milligrams per normal cubic meter
m² Square meter
mm Millimetres
NO Nitrogen oxide
N2O Nitrous oxide
NO2 Nitrogen dioxide
NOx Oxides of nitrogen
PM2.5 Inhalable particulate matter (aerodynamic diameter less than 2.5 µm)
PM10 Thoracic particulate matter (aerodynamic diameter less than 10 µm)
SO2 Sulfur dioxide
tpa Tonnes per annum
TSP Total Suspended Particulates
1 ton 1 000 000 grams
Air Quality Impact Assessment for the Proposed Kriel Power Station FFP Retrofit
Report No.: 15WES01 Draft v
EXECUTIVE SUMMARY
Kriel Power Station intends to replace the current electrostatic precipitators (ESP) with retrofitted fabric filter plants (FFP).
The retrofit of the FFP technology at Kriel Power Station is to ensure compliance with the Minimum Emission Standards for
particulate emissions from Solid Fuel Combustion Installations (Government Notice 893, November 2013 – Government
Gazette No. 37054).
Airshed Planning Professionals (Pty) Ltd (Airshed) was appointed by Wandima Environmental Services to conduct an air
quality impact assessment for this project. The main objective of the air quality study is to determine air quality related
impacts as a result of the Kriel Power Station before and after the retrofit of the FFP technology. Fine particulates with
aerodynamic diameters than 10 μm and 2.5 μm (PM10 and PM2.5, respectively) were the pollutants of concern for the Kriel
Power Station retrofit.
The nearest residential areas to the Kriel Power Station are the staff villages of Kriel and Matla Power Stations, and the
Matla mine (within 5 km of the power station); and the town of Kriel (7.5 km east). Current land use near the Project area,
excluding the power stations and coal mine, is predominantly agricultural.
Near-site surface meteorological data, recorded at the Eskom-operated Kriel Village ambient air quality monitoring station,
was used to generate AERMOD-ready meteorological files. The period of the meteorological data was 8th January 2013 to
30 November 2015. The wind field was dominated by winds from the north-west; north-east; and, less frequently the south-
west. Calm conditions, after correction, occurred less than 1% of the time.
Measured ambient PM10 concentrations at the Kriel Village monitoring station were non-compliant with the National Ambient
Air Quality Standards (NAAQS) (for daily and annual averaging periods) for the three-years assessed (2013 to 2015).
The quantification of sources of emission was restricted to current (ESP) and future (FFP) operations at the Kriel Power
Station. The wind-blown dust from the coal stockpile and ash disposal facility located near the Power Station was also
quantified as part of the assessment. Although other background sources were identified, such sources were not quantified.
The main findings from the impact assessment due to current operations and proposed FFP retrofit at all six units were as
follows:
The simulated daily and annual PM10 and PM2.5 concentrations within the domain (due to current and future power
station stack releases, existing ash dam operations and coal stockpile operations only) were within the NAAQS.
The simulated FFP retrofit to the Kriel Power Station units would reduce the impact of PM10 from the stacks (only)
by ~96%. Before and after the retrofit the simulated annual PM10 concentrations (due to stack emissions only)
were predicted to be a maximum of 0.90 μg/m³ and 0.52 μg/m³ respectively.
The low simulated annual concentrations for the Power Station stack emissions only highlight the contribution of the fugitive
sources at the Power Station and sources off-site to be background measured values where non-compliance with the
ambient standards were recorded for the period assessed. It is recommended that the FFP retrofit be implemented as an air
quality management measure to meet Minimum Emission Standards and to ensure the lowest possible impacts on the
surrounding environment.
Air Quality Impact Assessment for the Proposed Kriel Power Station FFP Retrofit
Report No.: 15WES01 Draft vi
TABLE OF CONTENTS
Report Details ............................................................................................................................................................................. i
Revision Record .......................................................................................................................................................................... i
Abbreviations ............................................................................................................................................................................. ii
Glossary .................................................................................................................................................................................... iii
Symbols and Units .................................................................................................................................................................... iv
Executive Summary ................................................................................................................................................................... v
Table of Contents...................................................................................................................................................................... vi
List of Tables............................................................................................................................................................................ viii
List of Figures ........................................................................................................................................................................... ix
Air Quality Impact Assessment for the Proposed Kriel Power Station FFP Retrofit .................................................................. 1
1 Introduction....................................................................................................................................................................... 1
1.1 Scope of Work ........................................................................................................................................................ 1
1.2 Description of Project Activities from an Air Quality Perspective ............................................................................ 3
1.3 Approach and Methodology .................................................................................................................................... 3
1.3.1 Atmospheric Dispersion Model Selection .......................................................................................................... 3
1.3.2 Meteorological Data Requirements ................................................................................................................... 4
1.3.3 Source Data Requirements ............................................................................................................................... 5
1.3.4 Modelling Domain .............................................................................................................................................. 5
1.4 Assumptions, Exclusions and Limitations ............................................................................................................... 5
2 Regulatory Requirements and Assessment Criteria ........................................................................................................ 6
2.1 National Ambient Air Quality Standards (NAAQS) ................................................................................................. 6
2.2 Listed Activities and Minimum Emissions Standards ............................................................................................. 6
2.3 Highveld Priority Area ............................................................................................................................................. 7
3 Description of the Receiving Environment ....................................................................................................................... 9
3.1 Air Quality Sensitive Receptors (AQSRs) ............................................................................................................... 9
3.2 Atmospheric Dispersion Potential ........................................................................................................................... 9
3.2.1 Surface Wind Field ............................................................................................................................................ 9
3.2.2 Temperature .................................................................................................................................................... 11
3.3 Existing Sources of Emissions near the Kriel Power Station ................................................................................ 12
3.4 Status Quo Ambient Air Quality ............................................................................................................................ 12
4 Dispersion Modelling Assessment of Baseline Air Quality ............................................................................................. 16
4.1.1 Emissions Inventory ......................................................................................................................................... 16
Air Quality Impact Assessment for the Proposed Kriel Power Station FFP Retrofit
Report No.: 15WES01 Draft vii
4.1.2 Screening of Simulated Human Health Impacts .............................................................................................. 17
5 Impact of the Future Operations on the Ambient Air Quality .......................................................................................... 21
5.1 Construction Phase .............................................................................................................................................. 21
5.2 Operational Phase ................................................................................................................................................ 21
5.2.1 Dispersion Modelling Parameters and Emissions Quantification .................................................................... 21
5.2.2 Screening of Simulated Human Health Impacts .............................................................................................. 22
5.3 Decommissioning Phase ...................................................................................................................................... 26
6 Recommended Air Quality Management Measures....................................................................................................... 27
6.1 Proposed FFP Technology ................................................................................................................................... 27
6.1.1 Relation of FFP to World-Wide Best Practice .................................................................................................. 27
6.1.2 Monitoring ........................................................................................................................................................ 27
6.2 Record-keeping, Environmental Reporting and Community Liaison .................................................................... 28
6.2.1 Compliance Monitoring .................................................................................................................................... 28
6.2.2 Reporting Requirements .................................................................................................................................. 29
6.2.3 Liaison Strategy for Communication with I&APs ............................................................................................. 29
7 Conclusions and Recommendations .............................................................................................................................. 30
7.1 Recommendations ................................................................................................................................................ 30
8 References ..................................................................................................................................................................... 31
9 Appendix A – Wind Erosion Emission Quantification ..................................................................................................... 32
Air Quality Impact Assessment for the Proposed Kriel Power Station FFP Retrofit
Report No.: 15WES01 Draft viii
LIST OF TABLES
Table 1-1: Air emissions and pollutants associated with coal-fired power plants ...................................................................... 3
Table 2-1: NAAQS for pollutants of concern for the current assessment .................................................................................. 6
Table 2-2: Section 1 on Combustion Installations, Subcategory 1.1. Solid Fuel Combustion Installations ............................... 7
Table 3-1: Availability of meteorological data from the Kriel Village air quality monitoring station ............................................ 9
Table 3-2: Summary of PM10 concentrations measured at the Kriel Village station (January 2013 to November 2015) ....... 13
Table 4-1: Kriel Power Station chimney stack particulate emissions: baseline operations ...................................................... 16
Table 4-2: Stack parameters of the Kriel Power Station .......................................................................................................... 16
Table 4-3: Ash disposal facility and coal stockpile properties .................................................................................................. 17
Table 4-4: Particle size distribution (given as a percentage) of the ash disposal facility and the coal stockpile ...................... 17
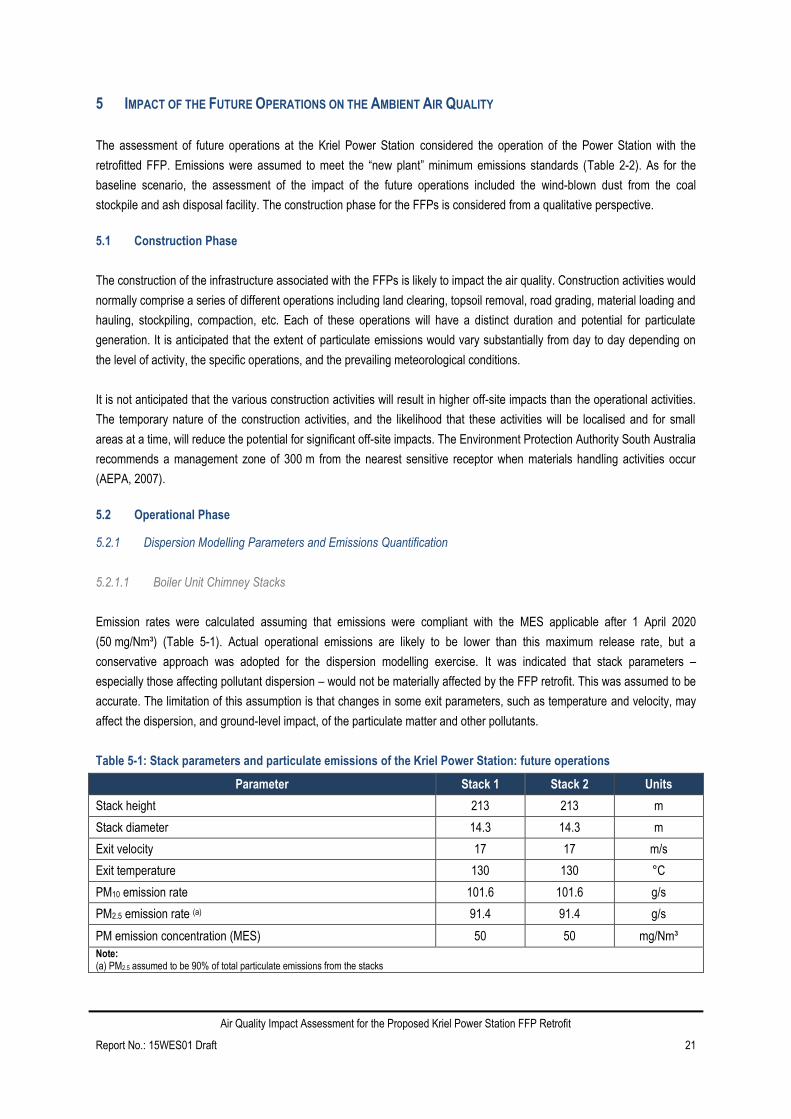
Table 5-1: Stack parameters and particulate emissions of the Kriel Power Station: future operations ................................... 21
Table 5-2: Comparative impact of the stack emissions only for the baseline and future scenarios ......................................... 23
Table 6-1: Recommended source based performance indicators ........................................................................................... 28
Air Quality Impact Assessment for the Proposed Kriel Power Station FFP Retrofit
Report No.: 15WES01 Draft ix
LIST OF FIGURES
Figure 1-1: Location map of the Kriel Power Station ................................................................................................................. 2
Figure 3-1: Period average, day-time and night-time wind roses (measured data; 2013 to 2015) .......................................... 10
Figure 3-2: Seasonal wind roses (measured data; 2013 to 2015) ........................................................................................... 11
Figure 3-3: Monthly temperature profile (measured data; 2013 to 2015) ................................................................................ 12
Figure 3-4: Daily average PM10 concentrations measured at Kriel Village for the period January 2013 to November 2015 ... 13
Figure 3-5: Daily median PM10 polar plot ................................................................................................................................. 14
Figure 3-6: Time variation of PM10 concentrations at the Kriel Village monitoring station ....................................................... 15
Figure 4-1: Simulated daily PM10 concentrations (Baseline) .................................................................................................... 18
Figure 4-2: Simulated annual PM10 concentrations (Baseline) (maximum simulated concentration 2.9 µg/m3) ..................... 19
Figure 4-3: Simulated daily PM2.5 concentrations (Baseline) ................................................................................................... 19
Figure 4-4: Simulated annual PM2.5 concentrations (Baseline) (maximum simulated concentration 1.4 µg/m3) ..................... 20
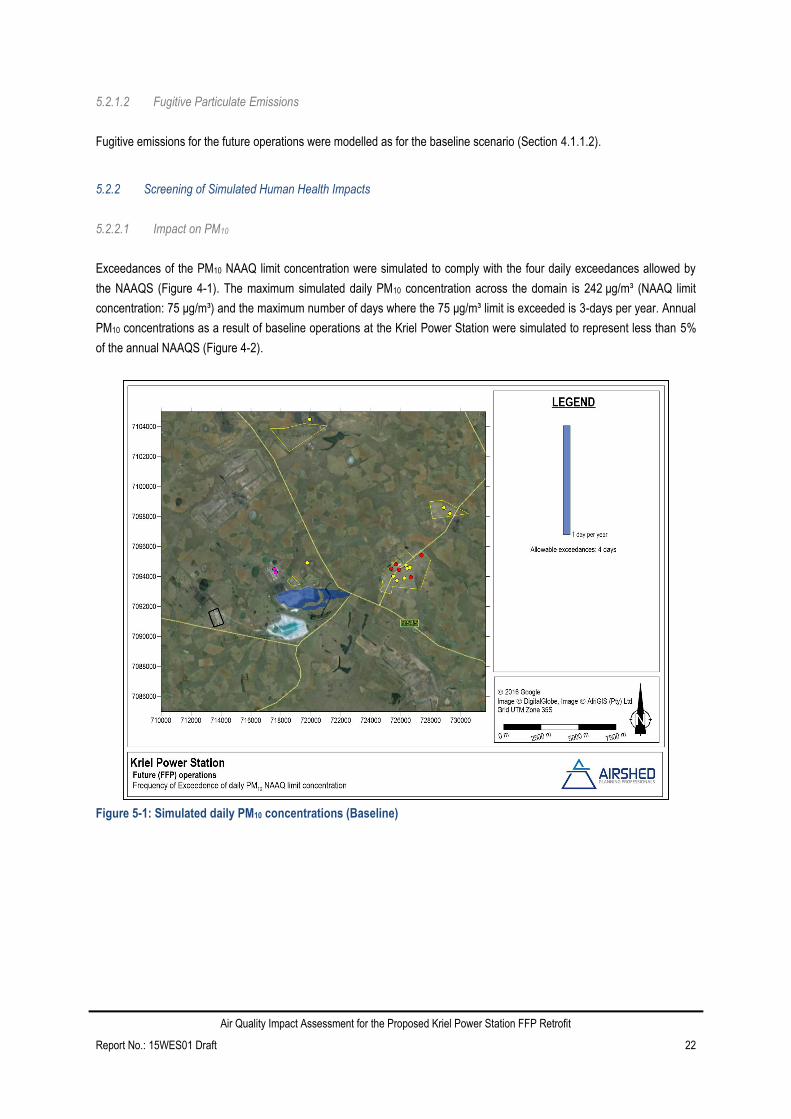
Figure 5-1: Simulated daily PM10 concentrations (Baseline) .................................................................................................... 22
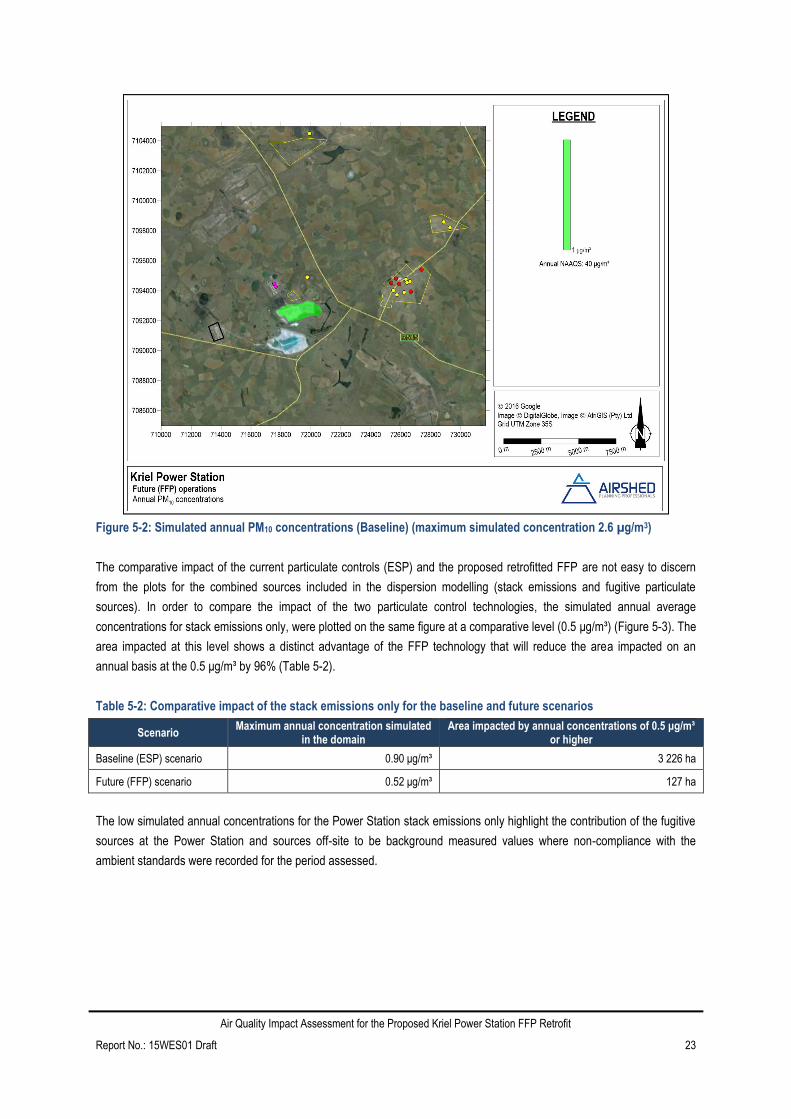
Figure 5-2: Simulated annual PM10 concentrations (Baseline) (maximum simulated concentration 2.6 µg/m3) ..................... 23
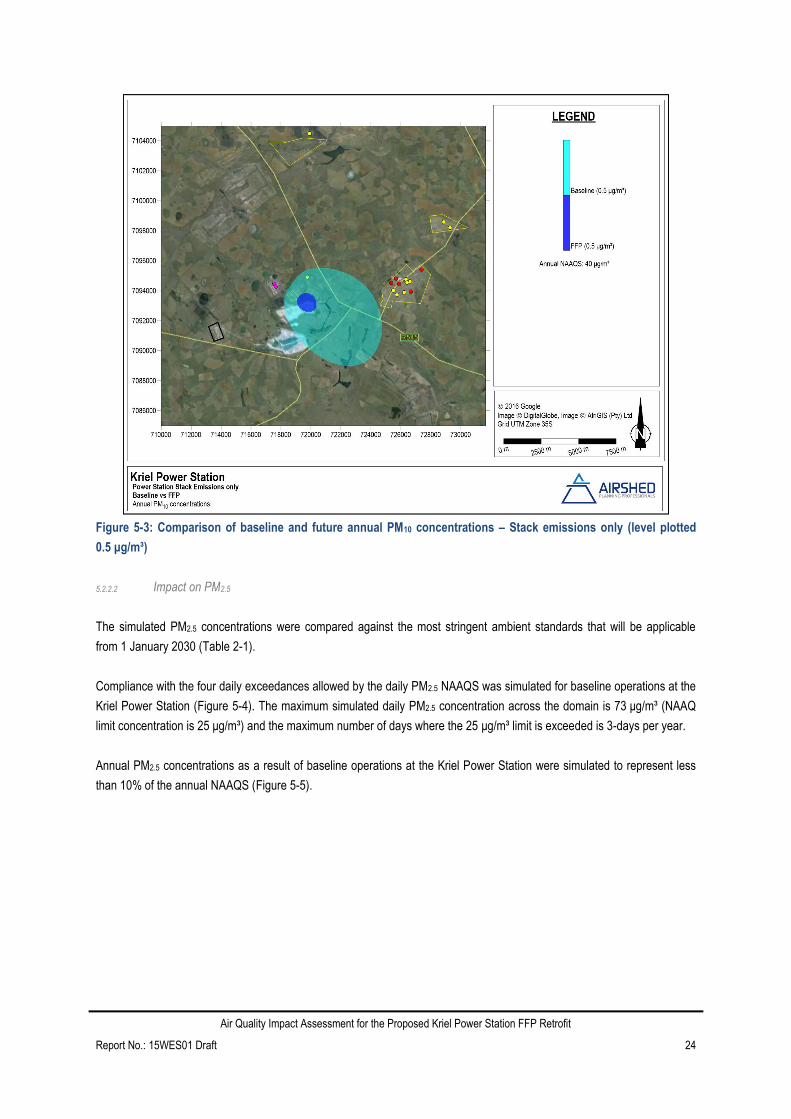
Figure 5-3: Comparison of baseline and future annual PM10 concentrations – Stack emissions only (level plotted 0.5 μg/m³)
................................................................................................................................................................................................. 24
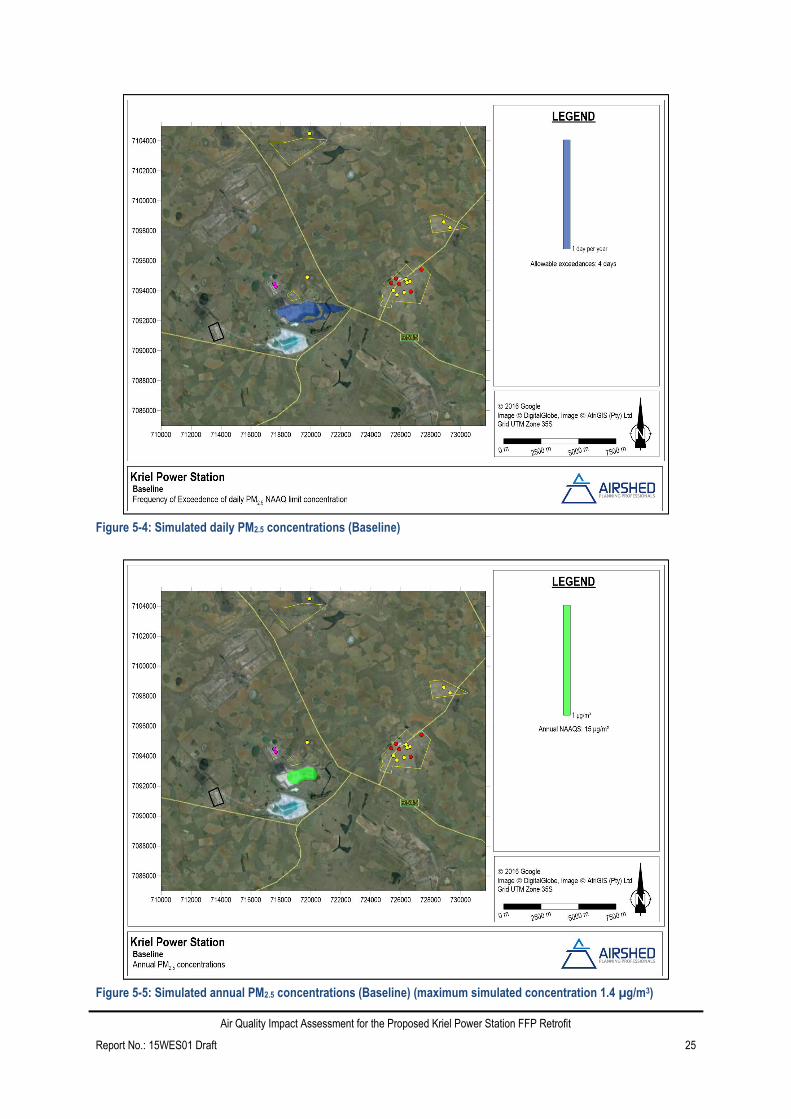
Figure 5-4: Simulated daily PM2.5 concentrations (Baseline) ................................................................................................... 25
Figure 5-5: Simulated annual PM2.5 concentrations (Baseline) (maximum simulated concentration 1.4 µg/m3) ..................... 25
Air Quality Impact Assessment for the Proposed Kriel Power Station FFP Retrofit
Report No.: 15WES01 Draft 1
AIR QUALITY IMPACT ASSESSMENT FOR THE PROPOSED KRIEL POWER
STATION FFP RETROFIT
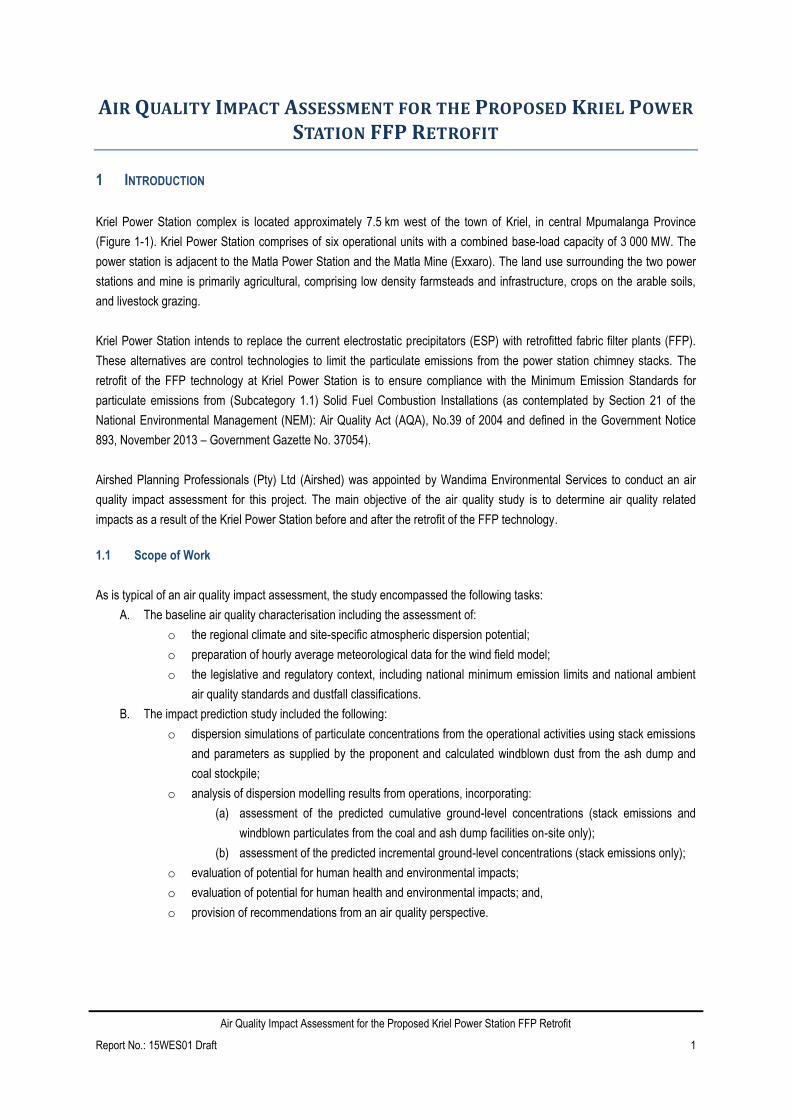
1 INTRODUCTION
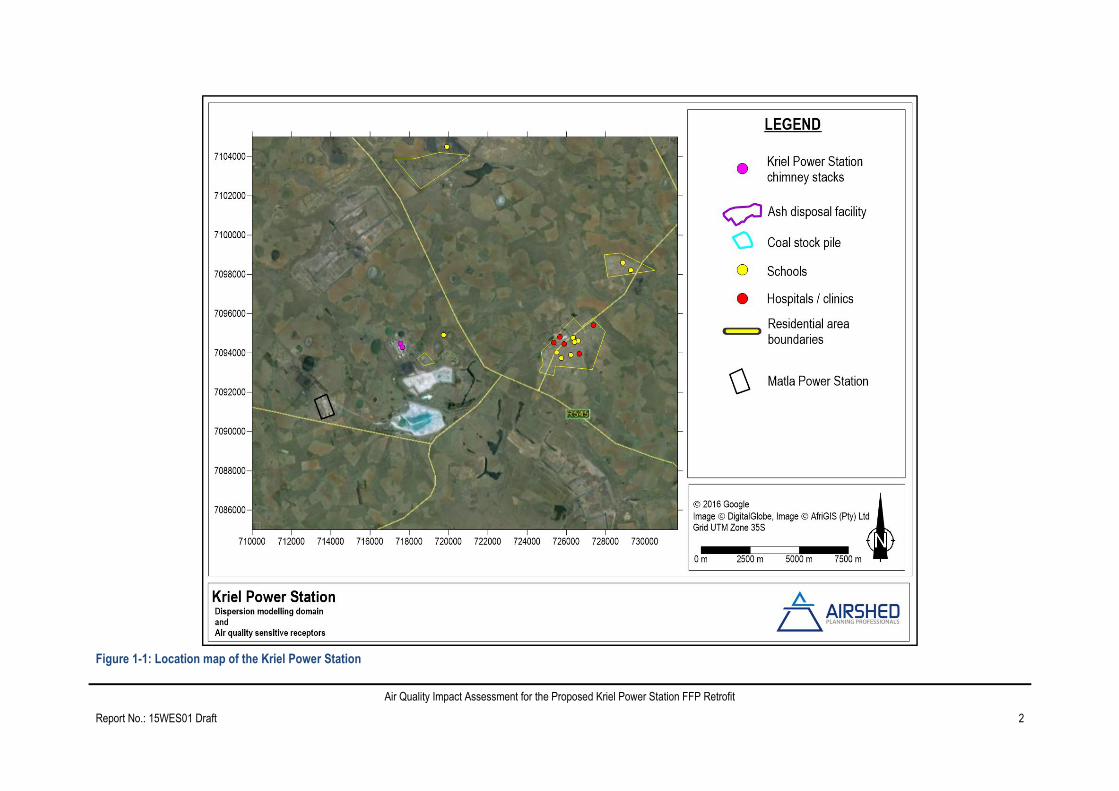
Kriel Power Station complex is located approximately 7.5 km west of the town of Kriel, in central Mpumalanga Province
(Figure 1-1). Kriel Power Station comprises of six operational units with a combined base-load capacity of 3 000 MW. The
power station is adjacent to the Matla Power Station and the Matla Mine (Exxaro). The land use surrounding the two power
stations and mine is primarily agricultural, comprising low density farmsteads and infrastructure, crops on the arable soils,
and livestock grazing.
Kriel Power Station intends to replace the current electrostatic precipitators (ESP) with retrofitted fabric filter plants (FFP).
These alternatives are control technologies to limit the particulate emissions from the power station chimney stacks. The
retrofit of the FFP technology at Kriel Power Station is to ensure compliance with the Minimum Emission Standards for
particulate emissions from (Subcategory 1.1) Solid Fuel Combustion Installations (as contemplated by Section 21 of the
National Environmental Management (NEM): Air Quality Act (AQA), No.39 of 2004 and defined in the Government Notice
893, November 2013 – Government Gazette No. 37054).
Airshed Planning Professionals (Pty) Ltd (Airshed) was appointed by Wandima Environmental Services to conduct an air
quality impact assessment for this project. The main objective of the air quality study is to determine air quality related
impacts as a result of the Kriel Power Station before and after the retrofit of the FFP technology.
1.1 Scope of Work
As is typical of an air quality impact assessment, the study encompassed the following tasks:
A. The baseline air quality characterisation including the assessment of:
o the regional climate and site-specific atmospheric dispersion potential;
o preparation of hourly average meteorological data for the wind field model;
o the legislative and regulatory context, including national minimum emission limits and national ambient
air quality standards and dustfall classifications.
B. The impact prediction study included the following:
o dispersion simulations of particulate concentrations from the operational activities using stack emissions
and parameters as supplied by the proponent and calculated windblown dust from the ash dump and
coal stockpile;
o analysis of dispersion modelling results from operations, incorporating:
(a) assessment of the predicted cumulative ground-level concentrations (stack emissions and
windblown particulates from the coal and ash dump facilities on-site only);
(b) assessment of the predicted incremental ground-level concentrations (stack emissions only);
o evaluation of potential for human health and environmental impacts;
o evaluation of potential for human health and environmental impacts; and,
o provision of recommendations from an air quality perspective.
Air Quality Impact Assessment for the Proposed Kriel Power Station FFP Retrofit
Report No.: 15WES01 Draft 2
Figure 1-1: Location map of the Kriel Power Station
Air Quality Impact Assessment for the Proposed Kriel Power Station FFP Retrofit
Report No.: 15WES01 Draft 3
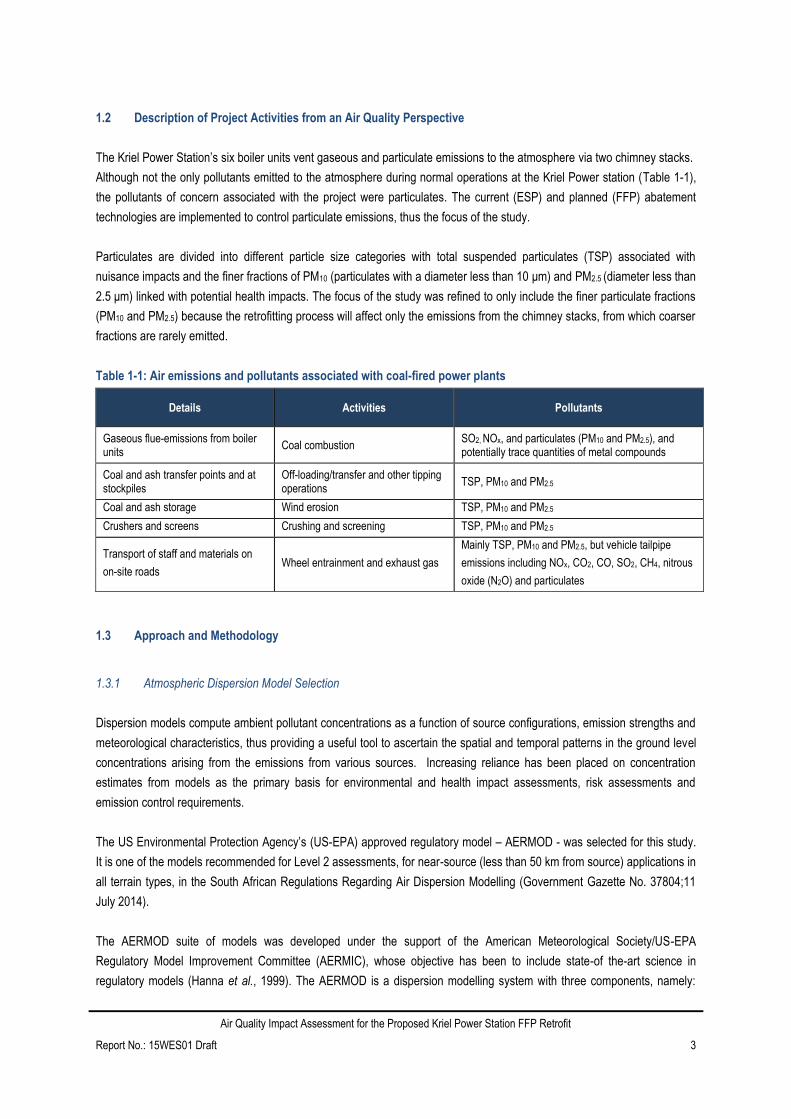
1.2 Description of Project Activities from an Air Quality Perspective
The Kriel Power Station’s six boiler units vent gaseous and particulate emissions to the atmosphere via two chimney stacks.
Although not the only pollutants emitted to the atmosphere during normal operations at the Kriel Power station (Table 1-1),
the pollutants of concern associated with the project were particulates. The current (ESP) and planned (FFP) abatement
technologies are implemented to control particulate emissions, thus the focus of the study.
Particulates are divided into different particle size categories with total suspended particulates (TSP) associated with
nuisance impacts and the finer fractions of PM10 (particulates with a diameter less than 10 μm) and PM2.5 (diameter less than
2.5 μm) linked with potential health impacts. The focus of the study was refined to only include the finer particulate fractions
(PM10 and PM2.5) because the retrofitting process will affect only the emissions from the chimney stacks, from which coarser
fractions are rarely emitted.
Table 1-1: Air emissions and pollutants associated with coal-fired power plants
Details Activities Pollutants
Gaseous flue-emissions from boiler units
Coal combustion SO2, NOx, and particulates (PM10 and PM2.5), and potentially trace quantities of metal compounds
Coal and ash transfer points and at stockpiles
Off-loading/transfer and other tipping operations
TSP, PM10 and PM2.5
Coal and ash storage Wind erosion TSP, PM10 and PM2.5
Crushers and screens Crushing and screening TSP, PM10 and PM2.5
Transport of staff and materials on
on-site roads Wheel entrainment and exhaust gas
Mainly TSP, PM10 and PM2.5, but vehicle tailpipe
emissions including NOx, CO2, CO, SO2, CH4, nitrous
oxide (N2O) and particulates
1.3 Approach and Methodology
1.3.1 Atmospheric Dispersion Model Selection
Dispersion models compute ambient pollutant concentrations as a function of source configurations, emission strengths and
meteorological characteristics, thus providing a useful tool to ascertain the spatial and temporal patterns in the ground level
concentrations arising from the emissions from various sources. Increasing reliance has been placed on concentration
estimates from models as the primary basis for environmental and health impact assessments, risk assessments and
emission control requirements.
The US Environmental Protection Agency’s (US-EPA) approved regulatory model – AERMOD - was selected for this study.
It is one of the models recommended for Level 2 assessments, for near-source (less than 50 km from source) applications in
all terrain types, in the South African Regulations Regarding Air Dispersion Modelling (Government Gazette No. 37804;11
July 2014).
The AERMOD suite of models was developed under the support of the American Meteorological Society/US-EPA
Regulatory Model Improvement Committee (AERMIC), whose objective has been to include state-of the-art science in
regulatory models (Hanna et al., 1999). The AERMOD is a dispersion modelling system with three components, namely:
Air Quality Impact Assessment for the Proposed Kriel Power Station FFP Retrofit
Report No.: 15WES01 Draft 4
AERMOD (AERMIC Dispersion Model), AERMAP (AERMOD terrain pre-processor), and AERMET (AERMOD
meteorological pre-processor).
AERMOD is an advanced new-generation model. It is designed to predict pollution concentrations from continuous point,
flare, area, line, and volume sources. AERMOD offers new and potentially improved algorithms for plume rise and
buoyancy, and the computation of vertical profiles of wind, turbulence and temperature however retains the single straight
line trajectory limitation of ISCST3 (Hanna et al., 1999).
AERMET is a meteorological pre-processor for the AERMOD model. Input data can come from hourly cloud cover
observations, surface meteorological observations and twice-a-day upper air soundings. Output includes surface
meteorological observations and parameters and vertical profiles of several atmospheric parameters.
AERMAP is a terrain pre-processor designed to simplify and standardize the input of terrain data for the AERMOD model.
Input data includes receptor terrain elevation data. The terrain data may be in the form of digital terrain data. For each
receptor, output includes location and height scale, which are elevations used for the computation of air flow around hills.
There will always be some error in any geophysical model, but it is desirable to structure the model in such a way to
minimise the total error. A model represents the most likely outcome of an ensemble of experimental results. The total
uncertainty can be thought of as the sum of three components: the uncertainty due to errors in the model physics; the
uncertainty due to data errors; and the uncertainty due to stochastic processes (turbulence) in the atmosphere.
The stochastic uncertainty includes all errors or uncertainties in data such as source variability, observed concentrations,
and meteorological data. Even if the field instrument accuracy is excellent, there can still be large uncertainties due to
unrepresentative placement of the instrument (or taking of a sample for analysis). Model evaluation studies suggest that the
data input error term is often a major contributor to total uncertainty. Even in the best tracer studies, the source emissions
are known only with an accuracy of ±5%, which translates directly into a minimum error of that magnitude in the model
predictions. It is also well known that wind direction errors are the major cause of poor agreement, especially for relatively
short-term predictions (minutes to hourly) and long downwind distances. All of the above factors contribute to the
inaccuracies not even associated with the mathematical models themselves.
Dispersion models do not contain all the features of a real environmental system but contain the feature of interest for the
management issue or scientific problem to be solved (MFE, 2001). Gaussian plume models are generally regarded to have
an uncertainty range between -50% to 200%. It has generally been found that the accuracy of off-the-shelf dispersion
models improve with increased averaging periods. The accurate prediction of instantaneous peaks are the most difficult and
are normally performed with more complicated dispersion models specifically fine-tuned and validated for the location.
Input data types required for the AERMOD model include: meteorological data, source data, and information on the nature
of the receptor grid. Each of these data types will be described below.
1.3.2 Meteorological Data Requirements
AERMOD requires two specific input files generated by the AERMET pre-processor. AERMET is designed to be run as a
three-stage processor and operates on three types of data (upper air data, on-site measurements, and the national
meteorological database). Near-site surface meteorological data (including wind speed, wind direction and temperature)
recorded at the Eskom-operated Kriel Village ambient air quality monitoring station was used to generate AERMOD-ready
meteorological files. The period of the meteorological data was January 2013 to November 2015.
Air Quality Impact Assessment for the Proposed Kriel Power Station FFP Retrofit
Report No.: 15WES01 Draft 5
1.3.3 Source Data Requirements
The AERMOD model is able to model point, area, volume and line sources. The atmospheric emissions of the particulate
fractions of concern, as a result of operations from the proposed project, were modelled as point sources (chimney stacks),
and area sources (ash disposal facility and coal stock pile).
1.3.4 Modelling Domain
The dispersion of pollutants was modelled for an area covering 28 km (north-south) by 28 km (east-west) centred over the
power station. The modelling domain was selected on the basis of the sources of emissions and potential impact areas. This
area was divided into a grid with a resolution of 250 m (north-south) by 250 m (east-west). A finer grid (100 m resolution)
was used within 5 km of the power station. AERMOD simulates ground-level concentrations for each of the receptor grid
points.
1.4 Assumptions, Exclusions and Limitations
A number of assumptions had to be made resulting in certain limitations associated with the results. The most important
assumptions and limitations of the air quality impact assessment are:
The quantification of sources of emission was restricted to current (ESP) and future (FFP) operations at the Kriel
Power Station. The wind-blown dust from the coal stockpile and ash disposal facility located near the Power
Station was also quantified as part of the assessment. Although other background sources were identified, such
sources were not quantified.
PM10 and PM2.5 were the pollutants of concern for the Kriel Power Station retrofit.
o All particulate emissions assumed to be PM10 or smaller. PM2.5 assumed to be 90% of total particulate
emissions from the stacks
Annual emissions from the power plant were provided and modelled based on normal operating conditions.
Atmospheric releases occurring as a result of accidents, maintenance or start-up conditions were not accounted
for.
Stack parameters were used as reported in the recent Kriel Power Station AIR (uMoya-NILU, 2014).
o It was indicated that stack parameters – especially those affecting pollutant dispersion – would not be
materially affected by the FFP retrofit. This was assumed to be accurate. The limitation of this
assumption is that changes in some exit parameters, such as temperature and velocity, may affect the
dispersion and ground-level impact of the particulate matter and other pollutants.
Three years of meteorological data (from the Kriel Village ambient air quality monitoring station) were used in the
atmospheric dispersion modelling with a data availability of over 78%.
The construction was assessed qualitatively due to the temporary nature of these operations.
As a conservative approach, proposed operations were assumed operate over twenty-four hours a day; 365-days
per year.
Air Quality Impact Assessment for the Proposed Kriel Power Station FFP Retrofit
Report No.: 15WES01 Draft 6
2 REGULATORY REQUIREMENTS AND ASSESSMENT CRITERIA
The air quality guidelines and standards are fundamental to effective air quality management, providing the link between the
source of atmospheric emissions and the user of that air at the downstream receptor site. The ambient air quality guideline
values indicate safe daily exposure levels for the majority of the population, including the very young and the elderly,
throughout an individual’s lifetime. The air quality guidelines and standards are normally given for specific averaging
periods.
Ambient air quality standard, for pollutants applicable to this assessment are discussed in Section 2.2 and the legislative
context of minimum emissions standards for power stations are discussed in Section 2.3.
2.1 National Ambient Air Quality Standards (NAAQS)
The South African Bureau of Standards (SABS) was engaged to assist Department of Environmental Affairs (DEA) in the
facilitation of the development of ambient air quality standards. This included the establishment of a technical committee to
oversee the development of standards. National Ambient Air Quality Standards (NAAQS) were determined based on
international best practice for PM2.5, PM10, SO2, NO2, CO, ozone, lead and benzene. The NAAQS for the pollutants of
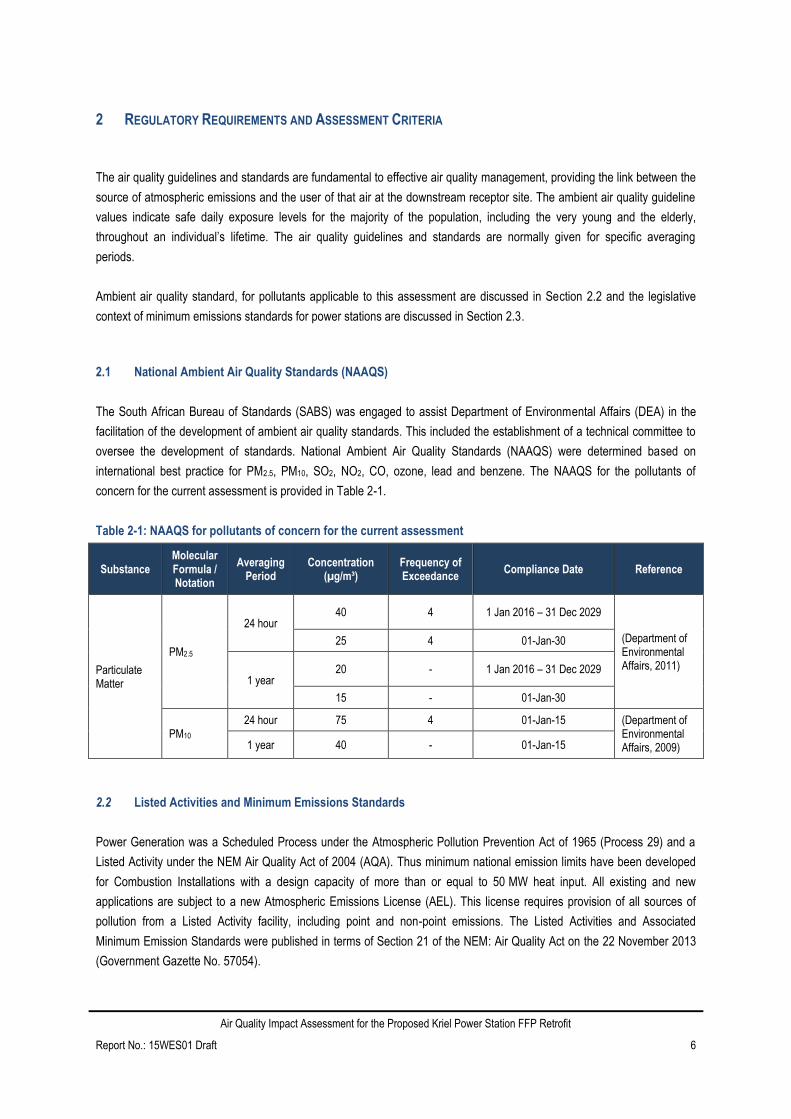
concern for the current assessment is provided in Table 2-1.
Table 2-1: NAAQS for pollutants of concern for the current assessment
Substance Molecular Formula / Notation
Averaging Period
Concentration (µg/m³)
Frequency of Exceedance
Compliance Date Reference
Particulate Matter
PM2.5
24 hour 40 4 1 Jan 2016 – 31 Dec 2029
(Department of Environmental Affairs, 2011)
25 4 01-Jan-30
1 year 20 - 1 Jan 2016 – 31 Dec 2029
15 - 01-Jan-30
PM10 24 hour 75 4 01-Jan-15 (Department of
Environmental Affairs, 2009) 1 year 40 - 01-Jan-15
2.2 Listed Activities and Minimum Emissions Standards
Power Generation was a Scheduled Process under the Atmospheric Pollution Prevention Act of 1965 (Process 29) and a
Listed Activity under the NEM Air Quality Act of 2004 (AQA). Thus minimum national emission limits have been developed
for Combustion Installations with a design capacity of more than or equal to 50 MW heat input. All existing and new
applications are subject to a new Atmospheric Emissions License (AEL). This license requires provision of all sources of
pollution from a Listed Activity facility, including point and non-point emissions. The Listed Activities and Associated
Minimum Emission Standards were published in terms of Section 21 of the NEM: Air Quality Act on the 22 November 2013
(Government Gazette No. 57054).
Air Quality Impact Assessment for the Proposed Kriel Power Station FFP Retrofit
Report No.: 15WES01 Draft 7
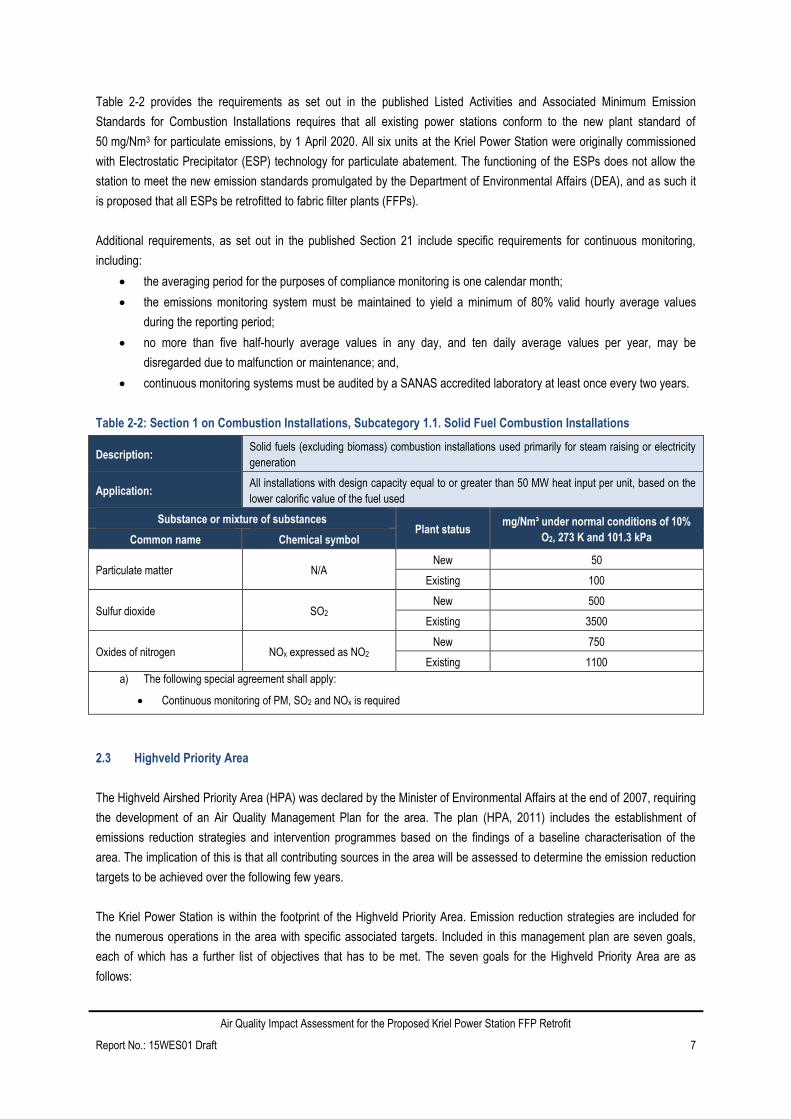
Table 2-2 provides the requirements as set out in the published Listed Activities and Associated Minimum Emission
Standards for Combustion Installations requires that all existing power stations conform to the new plant standard of
50 mg/Nm3 for particulate emissions, by 1 April 2020. All six units at the Kriel Power Station were originally commissioned
with Electrostatic Precipitator (ESP) technology for particulate abatement. The functioning of the ESPs does not allow the
station to meet the new emission standards promulgated by the Department of Environmental Affairs (DEA), and as such it
is proposed that all ESPs be retrofitted to fabric filter plants (FFPs).
Additional requirements, as set out in the published Section 21 include specific requirements for continuous monitoring,
including:
the averaging period for the purposes of compliance monitoring is one calendar month;
the emissions monitoring system must be maintained to yield a minimum of 80% valid hourly average values
during the reporting period;
no more than five half-hourly average values in any day, and ten daily average values per year, may be
disregarded due to malfunction or maintenance; and,
continuous monitoring systems must be audited by a SANAS accredited laboratory at least once every two years.
Table 2-2: Section 1 on Combustion Installations, Subcategory 1.1. Solid Fuel Combustion Installations
Description: Solid fuels (excluding biomass) combustion installations used primarily for steam raising or electricity
generation
Application: All installations with design capacity equal to or greater than 50 MW heat input per unit, based on the
lower calorific value of the fuel used
Substance or mixture of substances Plant status
mg/Nm³ under normal conditions of 10%
O2, 273 K and 101.3 kPa Common name Chemical symbol
Particulate matter N/A New 50
Existing 100
Sulfur dioxide SO2 New 500
Existing 3500
Oxides of nitrogen NOx expressed as NO2 New 750
Existing 1100
a) The following special agreement shall apply:
Continuous monitoring of PM, SO2 and NOx is required
2.3 Highveld Priority Area
The Highveld Airshed Priority Area (HPA) was declared by the Minister of Environmental Affairs at the end of 2007, requiring
the development of an Air Quality Management Plan for the area. The plan (HPA, 2011) includes the establishment of
emissions reduction strategies and intervention programmes based on the findings of a baseline characterisation of the
area. The implication of this is that all contributing sources in the area will be assessed to determine the emission reduction
targets to be achieved over the following few years.
The Kriel Power Station is within the footprint of the Highveld Priority Area. Emission reduction strategies are included for
the numerous operations in the area with specific associated targets. Included in this management plan are seven goals,
each of which has a further list of objectives that has to be met. The seven goals for the Highveld Priority Area are as
follows:

Air Quality Impact Assessment for the Proposed Kriel Power Station FFP Retrofit
Report No.: 15WES01 Draft 8
Goal 1: By 2015, organisational capacity in government is optimised to efficiently and effectively maintain, monitor
and enforce compliance with ambient air quality standards
Goal 2: By 2020, industrial emissions are equitably reduced to achieve compliance with ambient air quality
standards and dust fallout limit values
Goal 3: By 2020, air quality in all low-income settlements is in full compliance with ambient air quality standards
Goal 4: By 2020, all vehicles comply with the requirements of the National Vehicle Emission Strategy
Goal 5: By 2020, a measurable increase in awareness and knowledge of air quality exists
Goal 6: By 2020, biomass burning and agricultural emissions will be 30% less than current
Goal 7: By 2020, emissions from waste management are 40% less than current.
Goal 2 applies directly to the Kriel Power Station, the objectives associated with this goal include:
Emissions are quantified from all sources.
Gaseous and particulate emissions are reduced.
Fugitive emissions are minimised.
Emissions from dust generating activities are reduced.
Incidences of spontaneous combustion are reduced.
Abatement technology is appropriate and operational.
Industrial Air Quality Management (AQM) decision making is robust and well-informed, with necessary information
available.
Clean technologies and processes are implemented.
Adequate resources are available for AQM in industry.
Ambient air quality standard and dust fallout limit value exceedances as a result of industrial emissions are
assessed.
A line of communication exists between industry and communities.
Each of these objectives is further divided into activities, each of which has a timeframe, responsibility and indicator. Refer
to the Highveld Priority Management Plan for further details (HPA, 2011).
Air Quality Impact Assessment for the Proposed Kriel Power Station FFP Retrofit
Report No.: 15WES01 Draft 9
3 DESCRIPTION OF THE RECEIVING ENVIRONMENT
3.1 Air Quality Sensitive Receptors (AQSRs)
The nearest residential areas to the Kriel Power Station are the staff villages of Kriel and Matla Power Stations, and the
Matla mine (within 5 km of the power station); and the town of Kriel (7.5 km east). Current land use near the Project area,
excluding the power stations and coal mine, is predominantly agricultural (Figure 1-1). These residential areas, as well as
schools and hospitals within the modelling domain, were included in the model simulations as additional receptors.
3.2 Atmospheric Dispersion Potential
Physical and meteorological mechanisms govern the dispersion, transformation, and eventual removal of pollutants from the
atmosphere. The analysis of hourly average meteorological data is necessary to facilitate a comprehensive understanding of
the dispersion potential of the site. Parameters useful in describing the dispersion and dilution potential of the site i.e. wind
speed, wind direction, temperature and atmospheric stability, are subsequently discussed. The availability of the
meteorological parameters from the Kriel village ambient air quality monitoring station for the period 8th January 2013 to 30
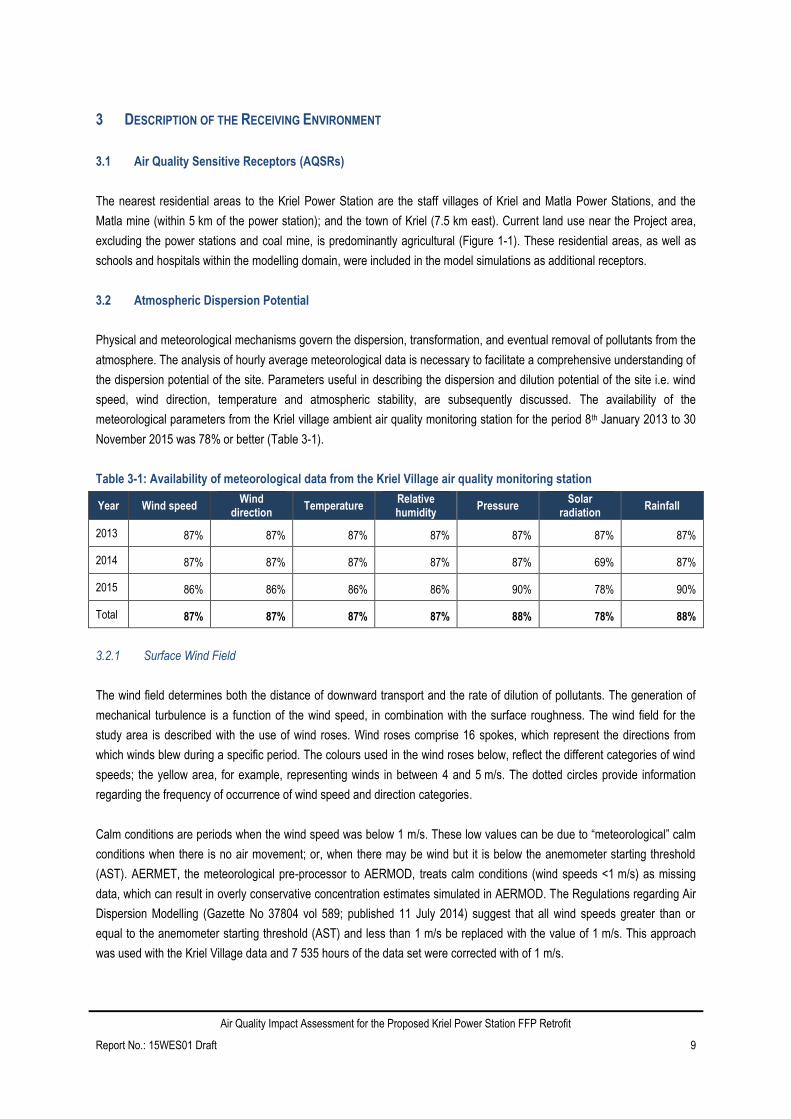
November 2015 was 78% or better (Table 3-1).
Table 3-1: Availability of meteorological data from the Kriel Village air quality monitoring station
Year Wind speed Wind
direction Temperature
Relative humidity
Pressure Solar
radiation Rainfall
2013 87% 87% 87% 87% 87% 87% 87%
2014 87% 87% 87% 87% 87% 69% 87%
2015 86% 86% 86% 86% 90% 78% 90%
Total 87% 87% 87% 87% 88% 78% 88%
3.2.1 Surface Wind Field
The wind field determines both the distance of downward transport and the rate of dilution of pollutants. The generation of
mechanical turbulence is a function of the wind speed, in combination with the surface roughness. The wind field for the
study area is described with the use of wind roses. Wind roses comprise 16 spokes, which represent the directions from
which winds blew during a specific period. The colours used in the wind roses below, reflect the different categories of wind
speeds; the yellow area, for example, representing winds in between 4 and 5 m/s. The dotted circles provide information
regarding the frequency of occurrence of wind speed and direction categories.
Calm conditions are periods when the wind speed was below 1 m/s. These low values can be due to “meteorological” calm
conditions when there is no air movement; or, when there may be wind but it is below the anemometer starting threshold
(AST). AERMET, the meteorological pre-processor to AERMOD, treats calm conditions (wind speeds <1 m/s) as missing
data, which can result in overly conservative concentration estimates simulated in AERMOD. The Regulations regarding Air
Dispersion Modelling (Gazette No 37804 vol 589; published 11 July 2014) suggest that all wind speeds greater than or
equal to the anemometer starting threshold (AST) and less than 1 m/s be replaced with the value of 1 m/s. This approach
was used with the Kriel Village data and 7 535 hours of the data set were corrected with of 1 m/s.
Air Quality Impact Assessment for the Proposed Kriel Power Station FFP Retrofit
Report No.: 15WES01 Draft 10
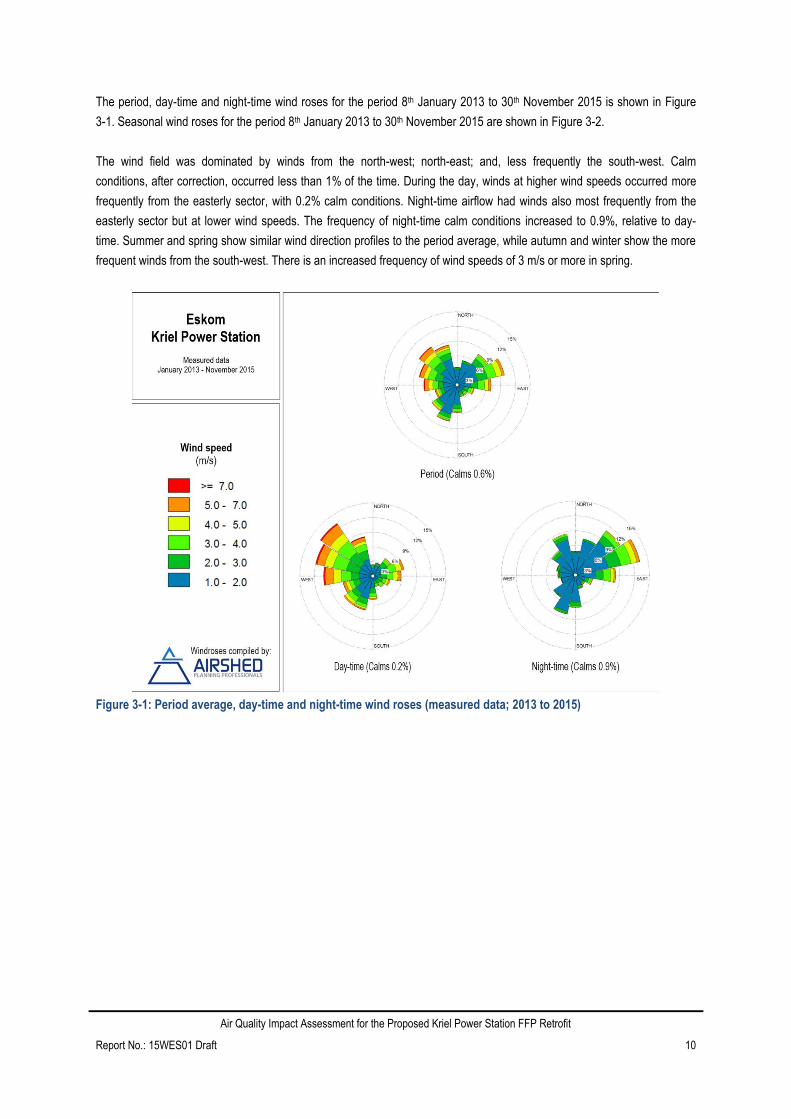
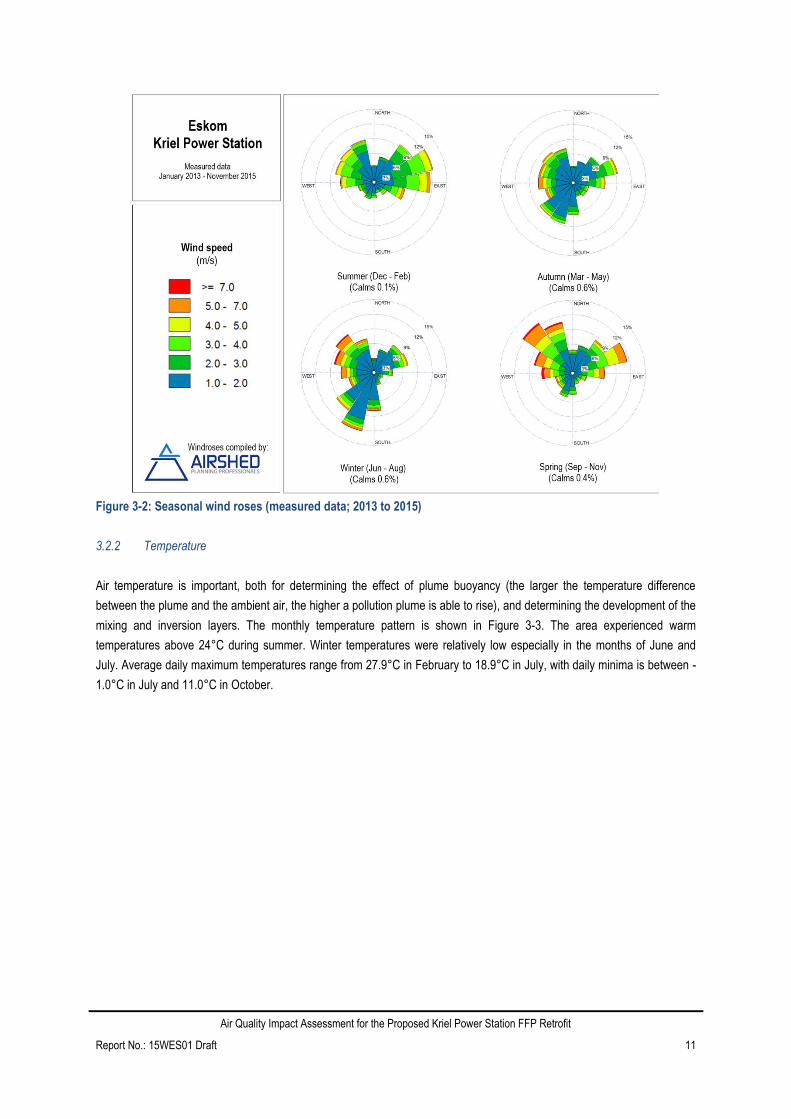
The period, day-time and night-time wind roses for the period 8th January 2013 to 30th November 2015 is shown in Figure
3-1. Seasonal wind roses for the period 8th January 2013 to 30th November 2015 are shown in Figure 3-2.
The wind field was dominated by winds from the north-west; north-east; and, less frequently the south-west. Calm
conditions, after correction, occurred less than 1% of the time. During the day, winds at higher wind speeds occurred more
frequently from the easterly sector, with 0.2% calm conditions. Night-time airflow had winds also most frequently from the
easterly sector but at lower wind speeds. The frequency of night-time calm conditions increased to 0.9%, relative to day-
time. Summer and spring show similar wind direction profiles to the period average, while autumn and winter show the more
frequent winds from the south-west. There is an increased frequency of wind speeds of 3 m/s or more in spring.
Figure 3-1: Period average, day-time and night-time wind roses (measured data; 2013 to 2015)
Air Quality Impact Assessment for the Proposed Kriel Power Station FFP Retrofit
Report No.: 15WES01 Draft 11
Figure 3-2: Seasonal wind roses (measured data; 2013 to 2015)
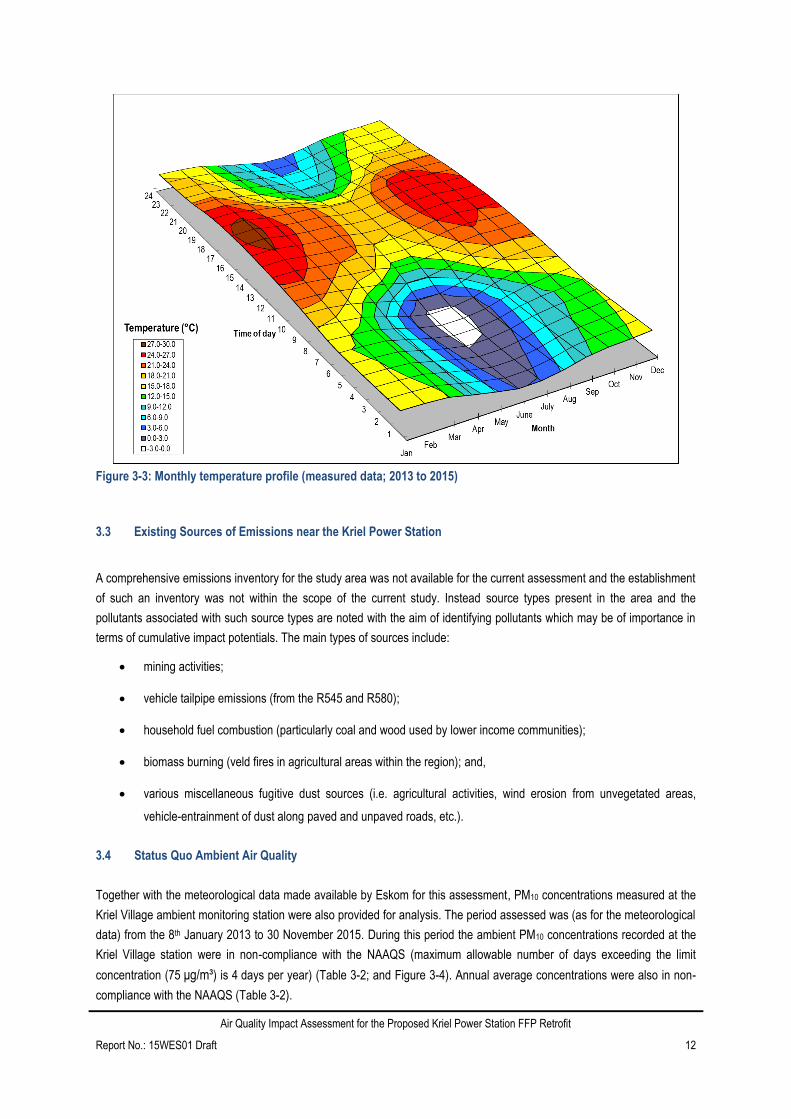
3.2.2 Temperature
Air temperature is important, both for determining the effect of plume buoyancy (the larger the temperature difference
between the plume and the ambient air, the higher a pollution plume is able to rise), and determining the development of the
mixing and inversion layers. The monthly temperature pattern is shown in Figure 3-3. The area experienced warm
temperatures above 24°C during summer. Winter temperatures were relatively low especially in the months of June and
July. Average daily maximum temperatures range from 27.9°C in February to 18.9°C in July, with daily minima is between -
1.0°C in July and 11.0°C in October.
Air Quality Impact Assessment for the Proposed Kriel Power Station FFP Retrofit
Report No.: 15WES01 Draft 12
Figure 3-3: Monthly temperature profile (measured data; 2013 to 2015)
3.3 Existing Sources of Emissions near the Kriel Power Station
A comprehensive emissions inventory for the study area was not available for the current assessment and the establishment
of such an inventory was not within the scope of the current study. Instead source types present in the area and the
pollutants associated with such source types are noted with the aim of identifying pollutants which may be of importance in
terms of cumulative impact potentials. The main types of sources include:
mining activities;
vehicle tailpipe emissions (from the R545 and R580);
household fuel combustion (particularly coal and wood used by lower income communities);
biomass burning (veld fires in agricultural areas within the region); and,
various miscellaneous fugitive dust sources (i.e. agricultural activities, wind erosion from unvegetated areas,
vehicle-entrainment of dust along paved and unpaved roads, etc.).
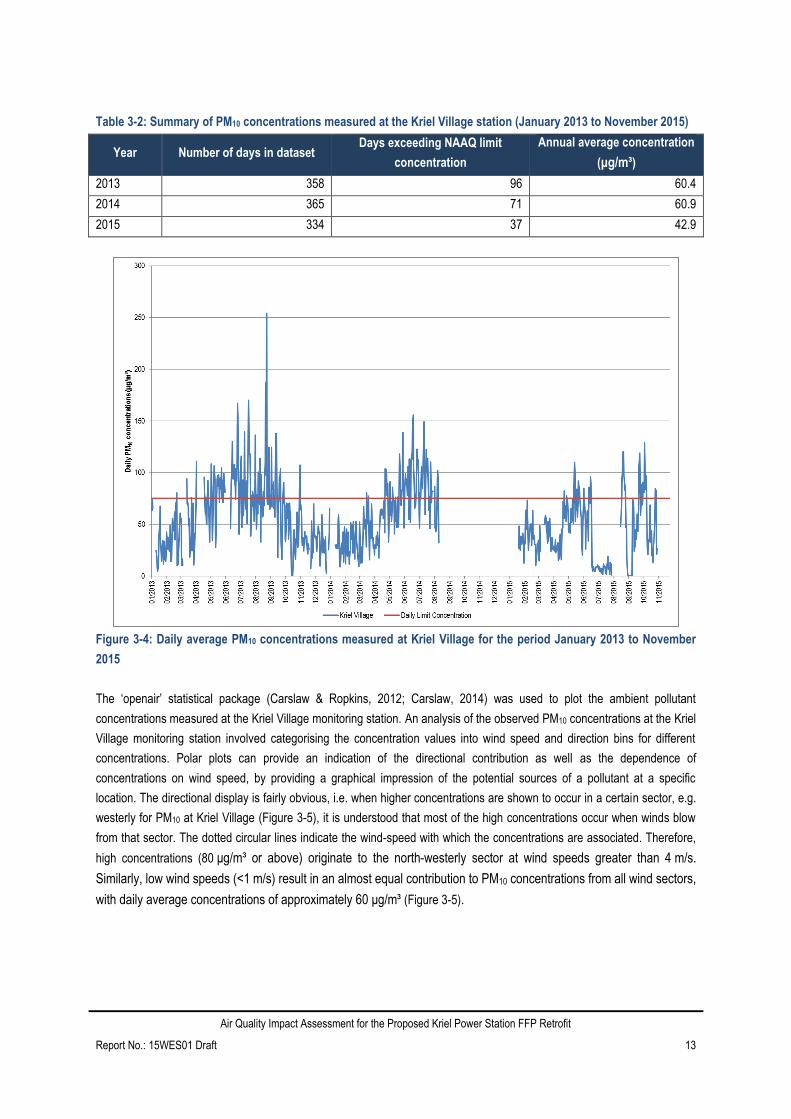
3.4 Status Quo Ambient Air Quality
Together with the meteorological data made available by Eskom for this assessment, PM10 concentrations measured at the
Kriel Village ambient monitoring station were also provided for analysis. The period assessed was (as for the meteorological
data) from the 8th January 2013 to 30 November 2015. During this period the ambient PM10 concentrations recorded at the
Kriel Village station were in non-compliance with the NAAQS (maximum allowable number of days exceeding the limit
concentration (75 μg/m³) is 4 days per year) (Table 3-2; and Figure 3-4). Annual average concentrations were also in non-
compliance with the NAAQS (Table 3-2).
Air Quality Impact Assessment for the Proposed Kriel Power Station FFP Retrofit
Report No.: 15WES01 Draft 13
Table 3-2: Summary of PM10 concentrations measured at the Kriel Village station (January 2013 to November 2015)
Year Number of days in dataset Days exceeding NAAQ limit
concentration
Annual average concentration
(μg/m³)
2013 358 96 60.4
2014 365 71 60.9
2015 334 37 42.9
Figure 3-4: Daily average PM10 concentrations measured at Kriel Village for the period January 2013 to November
2015
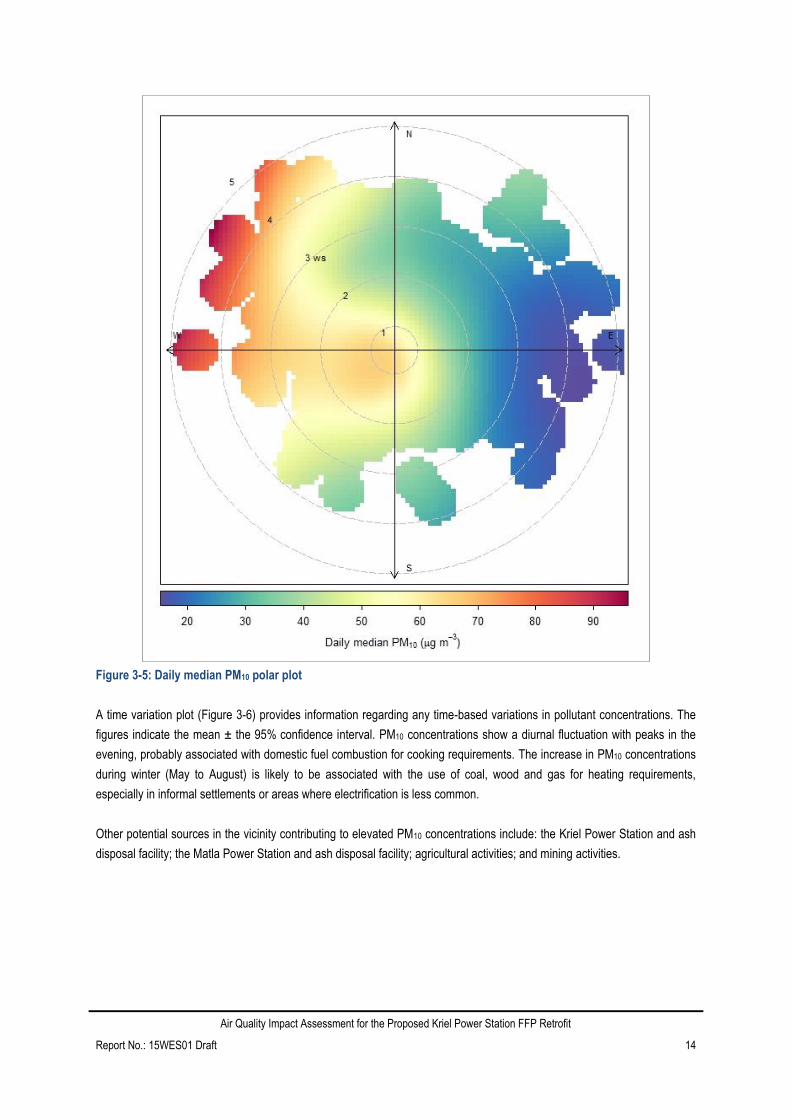
The ‘openair’ statistical package (Carslaw & Ropkins, 2012; Carslaw, 2014) was used to plot the ambient pollutant
concentrations measured at the Kriel Village monitoring station. An analysis of the observed PM10 concentrations at the Kriel
Village monitoring station involved categorising the concentration values into wind speed and direction bins for different
concentrations. Polar plots can provide an indication of the directional contribution as well as the dependence of
concentrations on wind speed, by providing a graphical impression of the potential sources of a pollutant at a specific
location. The directional display is fairly obvious, i.e. when higher concentrations are shown to occur in a certain sector, e.g.
westerly for PM10 at Kriel Village (Figure 3-5), it is understood that most of the high concentrations occur when winds blow
from that sector. The dotted circular lines indicate the wind-speed with which the concentrations are associated. Therefore,
high concentrations (80 μg/m³ or above) originate to the north-westerly sector at wind speeds greater than 4 m/s.
Similarly, low wind speeds (<1 m/s) result in an almost equal contribution to PM10 concentrations from all wind sectors,
with daily average concentrations of approximately 60 μg/m³ (Figure 3-5).
Air Quality Impact Assessment for the Proposed Kriel Power Station FFP Retrofit
Report No.: 15WES01 Draft 14
Figure 3-5: Daily median PM10 polar plot
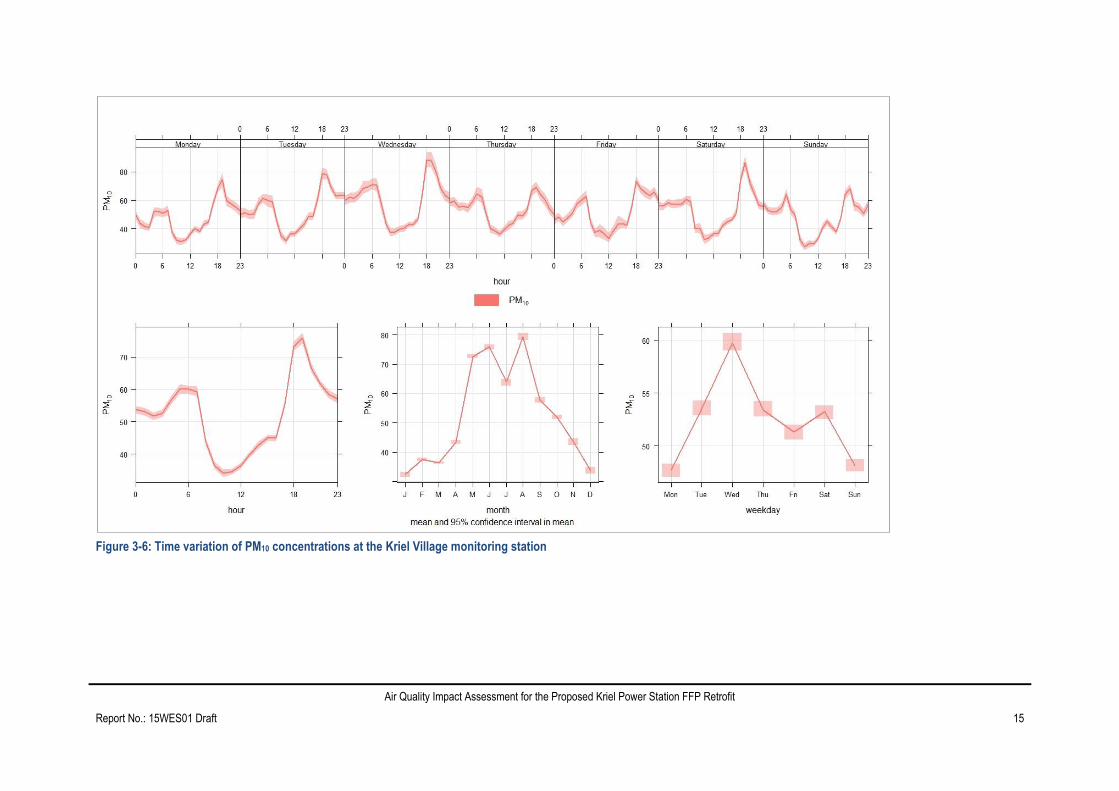
A time variation plot (Figure 3-6) provides information regarding any time-based variations in pollutant concentrations. The
figures indicate the mean ± the 95% confidence interval. PM10 concentrations show a diurnal fluctuation with peaks in the
evening, probably associated with domestic fuel combustion for cooking requirements. The increase in PM10 concentrations
during winter (May to August) is likely to be associated with the use of coal, wood and gas for heating requirements,
especially in informal settlements or areas where electrification is less common.
Other potential sources in the vicinity contributing to elevated PM10 concentrations include: the Kriel Power Station and ash
disposal facility; the Matla Power Station and ash disposal facility; agricultural activities; and mining activities.
Air Quality Impact Assessment for the Proposed Kriel Power Station FFP Retrofit
Report No.: 15WES01 Draft 15
Figure 3-6: Time variation of PM10 concentrations at the Kriel Village monitoring station
Air Quality Impact Assessment for the Proposed Kriel Power Station FFP Retrofit
Report No.: 15WES01 Draft 16
4 DISPERSION MODELLING ASSESSMENT OF BASELINE AIR QUALITY
4.1.1 Emissions Inventory
The establishment of an emission inventory formed the basis for the assessment of the air quality impacts from Baseline
and Future (FFP) operations. Emission sources for both current and future operations included: the boiler unit chimney
stacks; and fugitive emissions from the ash disposal facility, and the coal stock pile. Fugitive emissions refer to emissions
that are spatially distributed over a wide area and not confined to a specific discharge point as would be the case for
process related emissions (IFC, 2007).
4.1.1.1 Boiler Unit Chimney Stacks
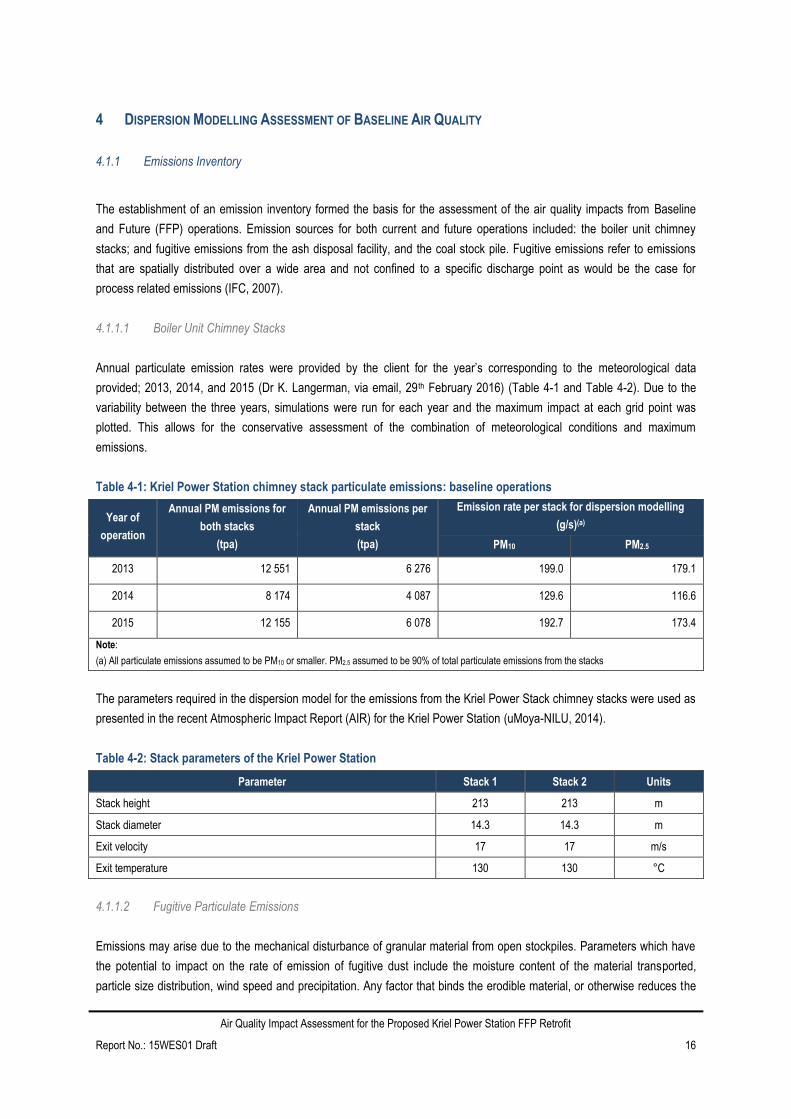
Annual particulate emission rates were provided by the client for the year’s corresponding to the meteorological data
provided; 2013, 2014, and 2015 (Dr K. Langerman, via email, 29th February 2016) (Table 4-1 and Table 4-2). Due to the
variability between the three years, simulations were run for each year and the maximum impact at each grid point was
plotted. This allows for the conservative assessment of the combination of meteorological conditions and maximum
emissions.
Table 4-1: Kriel Power Station chimney stack particulate emissions: baseline operations
Year of
operation
Annual PM emissions for
both stacks
(tpa)
Annual PM emissions per
stack
(tpa)
Emission rate per stack for dispersion modelling
(g/s)(a)
PM10 PM2.5
2013 12 551 6 276 199.0 179.1
2014 8 174 4 087 129.6 116.6
2015 12 155 6 078 192.7 173.4
Note:
(a) All particulate emissions assumed to be PM10 or smaller. PM2.5 assumed to be 90% of total particulate emissions from the stacks
The parameters required in the dispersion model for the emissions from the Kriel Power Stack chimney stacks were used as
presented in the recent Atmospheric Impact Report (AIR) for the Kriel Power Station (uMoya-NILU, 2014).
Table 4-2: Stack parameters of the Kriel Power Station
Parameter Stack 1 Stack 2 Units
Stack height 213 213 m
Stack diameter 14.3 14.3 m
Exit velocity 17 17 m/s
Exit temperature 130 130 °C
4.1.1.2 Fugitive Particulate Emissions
Emissions may arise due to the mechanical disturbance of granular material from open stockpiles. Parameters which have
the potential to impact on the rate of emission of fugitive dust include the moisture content of the material transported,
particle size distribution, wind speed and precipitation. Any factor that binds the erodible material, or otherwise reduces the
Air Quality Impact Assessment for the Proposed Kriel Power Station FFP Retrofit
Report No.: 15WES01 Draft 17
availability of erodible material on the surface, decreases the erosion potential of the fugitive source. High moisture
contents, whether due to precipitation or deliberate wetting, promote the aggregation and cementation of fines to the
surfaces of larger particles, thus decreasing the potential for dust emissions. The particle size distribution of the material is
important since it determines the rate of entrainment of material from the surface, the nature of dispersion of the dust plume,
and the rate of deposition, which may be anticipated (Burger, 1994).
The potential emissions due to wind-blown dust from the existing Kriel ash disposal facility and coal stockpile were assessed
Figure 1-1. The properties of the ash disposal facility and coal stockpile material and particle size distribution (as obtained
from similar processes) is given in Table 4-3 and Table 4-4 respectively. It should be noted that the current ash disposal
facility was conservatively considered to have no coverage by re-vegetation or additional dust suppression through watering
for dispersion modelling purposes. A detailed description of the emission factors used in the calculation of the wind-blown
dust from the ash disposal facility and coal stockpile is provided in Appendix A.
Table 4-3: Ash disposal facility and coal stockpile properties
Sample ID Bulk Density (t/m³) Component >2mm (%) Component <2mm
>1mm (%) Component <1mm
(%)
Ash disposal facility 1.01 5 4 90
Coal Stockpile 0.98 32 15 52
Table 4-4: Particle size distribution (given as a percentage) of the ash disposal facility and the coal stockpile
Ash Disposal Facility Coal Stockpile
Size (µm) Percentage (%) Size (µm) Percentage (%)
1000 4 1000 15
301 1 879 10
140 18 409 13
103 9 222 12
76 8 104 4
56 7 66 5
48 3 23 3
30 9 11 2
16 12 6 3
10 8 1 1
6 6
3 6
2 2
1 3
4.1.2 Screening of Simulated Human Health Impacts
The results from the dispersion modelling assessment are included below the criteria pollutants considered in the Baseline
scenario in the form of isopleth plots indicating simulated ground-level concentrations compared with the adopted evaluation
criteria, for the applicable averaging periods (Table 2-1).
Air Quality Impact Assessment for the Proposed Kriel Power Station FFP Retrofit
Report No.: 15WES01 Draft 18
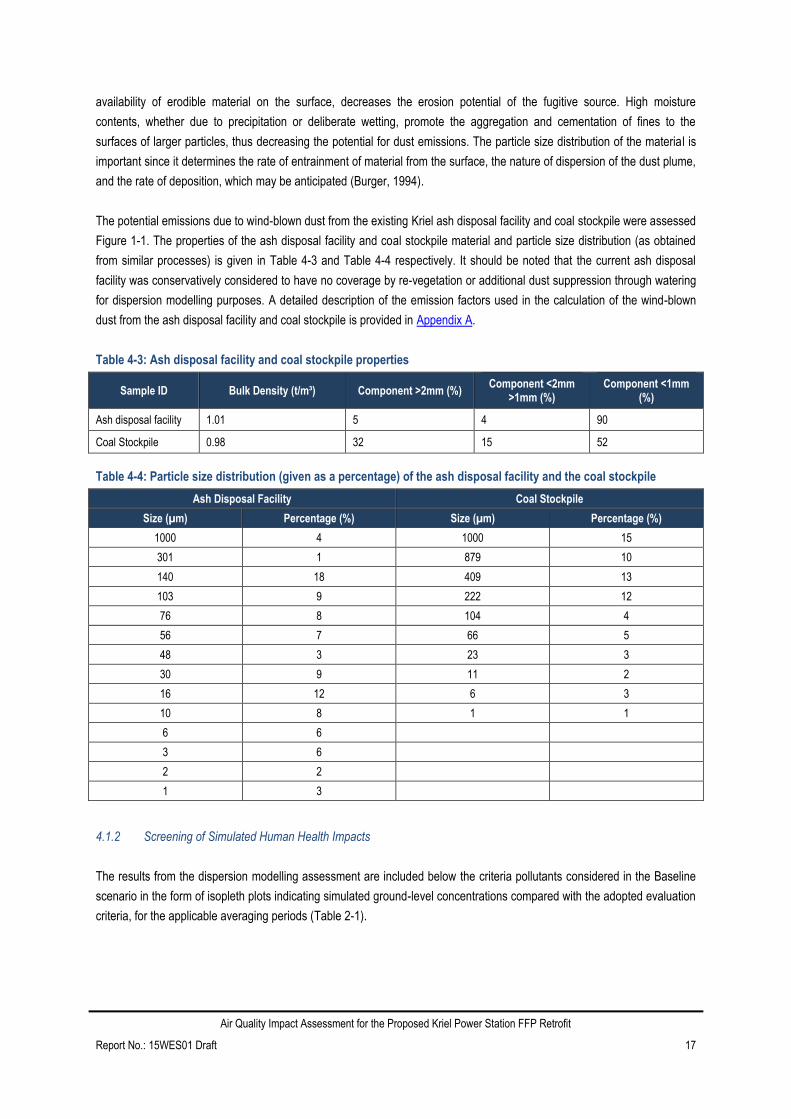
4.1.2.1 Impact on PM10
Exceedances of the PM10 NAAQ limit concentration were simulated to comply with the four daily exceedances allowed by
the NAAQS (Figure 4-1). The maximum simulated daily PM10 concentration across the domain is 242 μg/m³ (NAAQ limit
concentration is 75 μg/m³) and the maximum number of days where the 75 μg/m³ limit is exceeded is 3-days per year.
Annual PM10 concentrations as a result of baseline operations at the Kriel Power Station were simulated to represent less
than 10% of the annual NAAQS (Figure 4-2).
Figure 4-1: Simulated daily PM10 concentrations (Baseline)
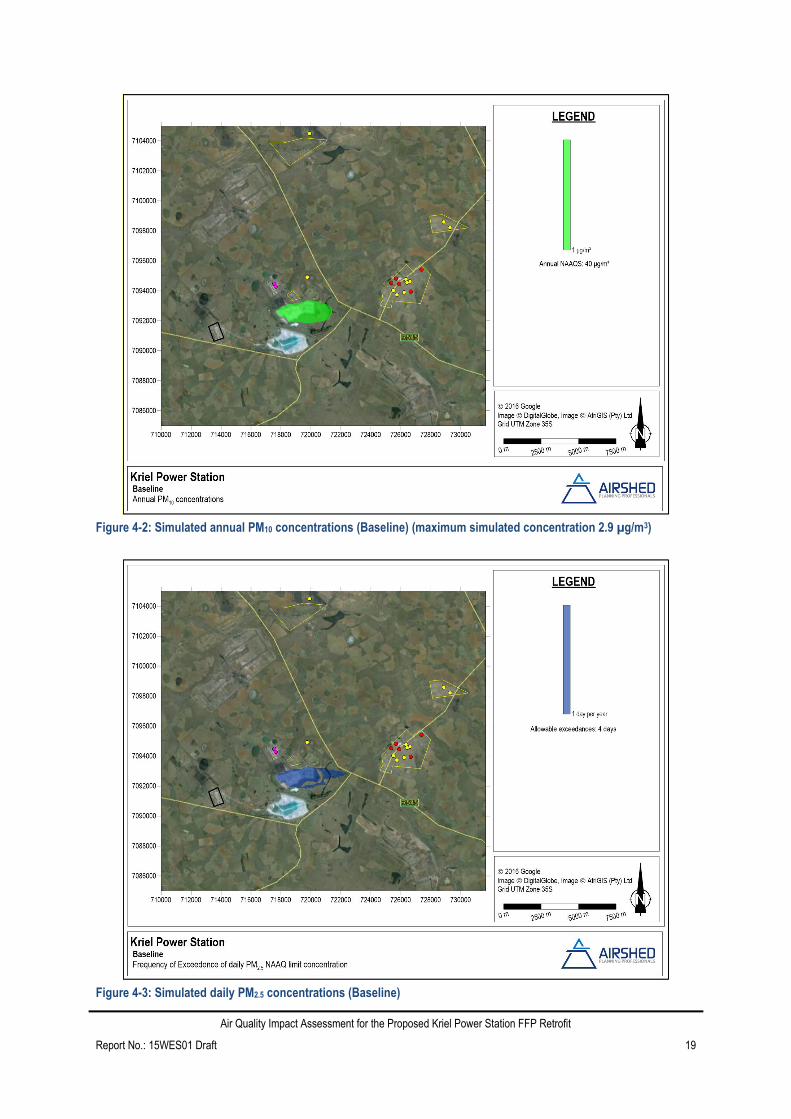
4.1.2.2 Impact on PM2.5
The simulated PM2.5 concentrations were compared against the most stringent ambient standards that will be applicable
from 1 January 2030 (Table 2-1).
Compliance with the four daily exceedances allowed by the daily PM2.5 NAAQS was simulated for baseline operations at the
Kriel Power Station (Figure 4-3). The maximum simulated daily PM2.5 concentration across the domain is 73 μg/m³ (NAAQ
limit concentration is 25 μg/m³) and the maximum number of days where the 25 μg/m³ limit is exceeded is 3-days per year.
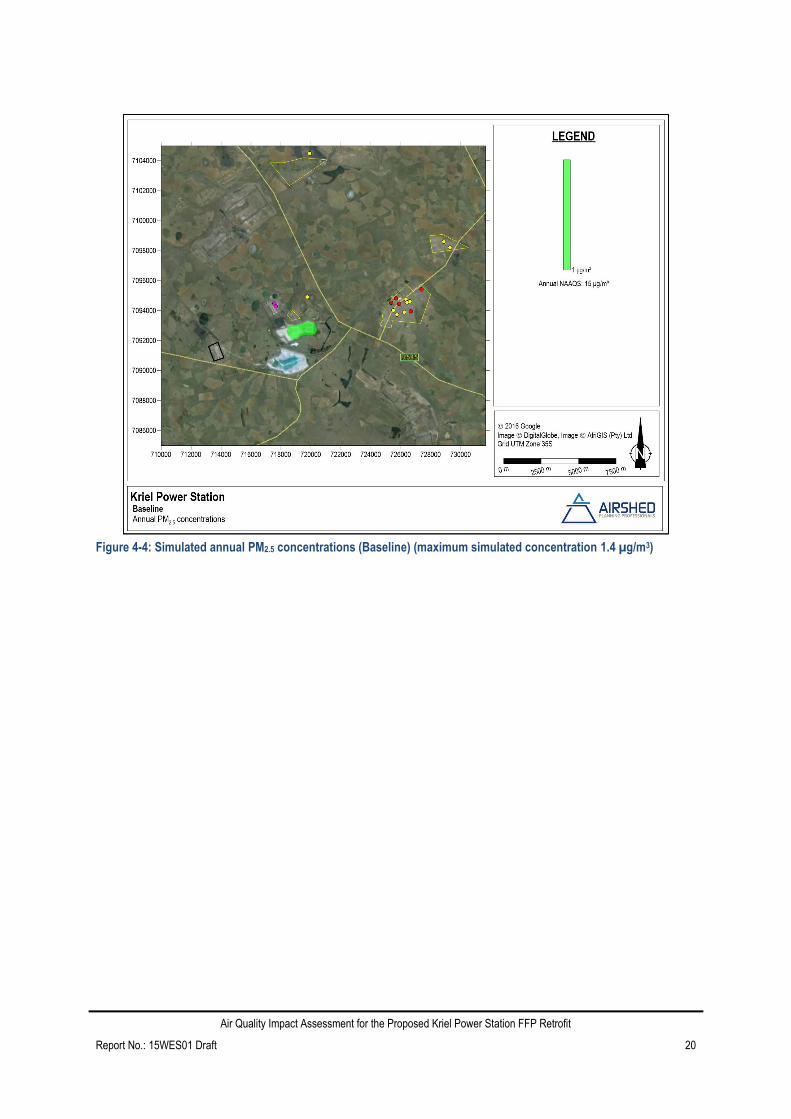
Annual PM2.5 concentrations as a result of baseline operations at the Kriel Power Station were simulated to represent less
than 10% of the annual NAAQS (Figure 4-4).
Air Quality Impact Assessment for the Proposed Kriel Power Station FFP Retrofit
Report No.: 15WES01 Draft 19
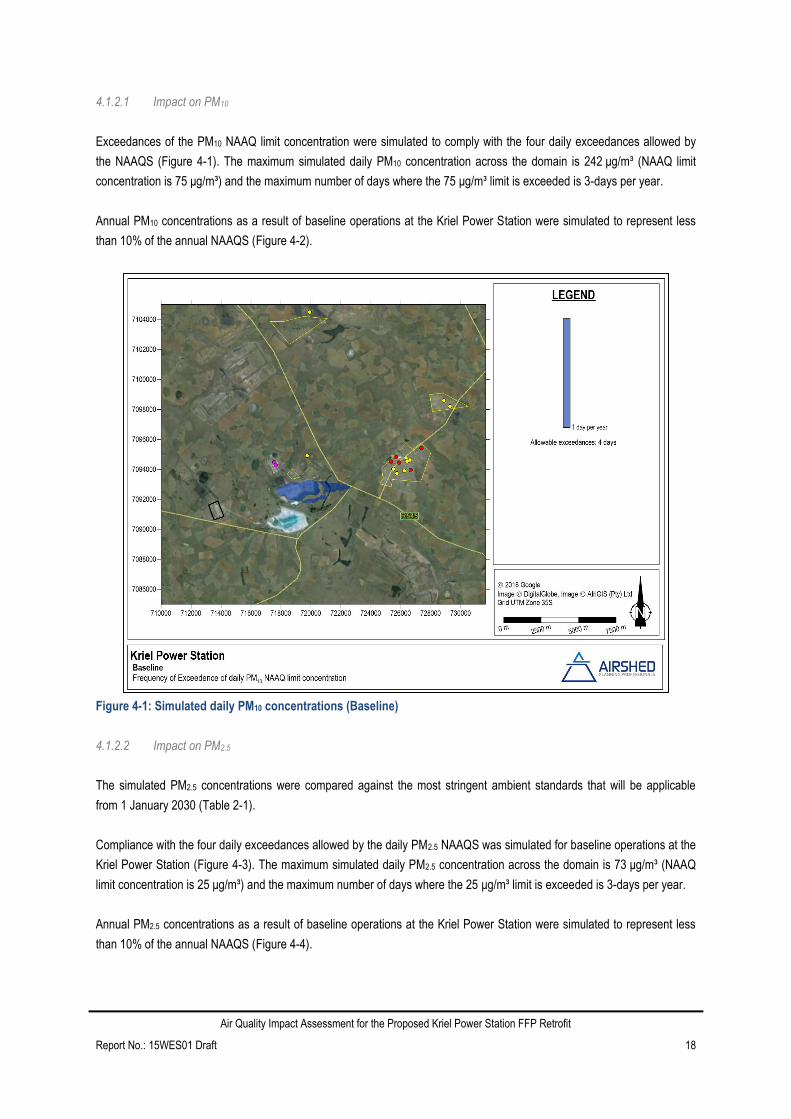
Figure 4-2: Simulated annual PM10 concentrations (Baseline) (maximum simulated concentration 2.9 µg/m3)
Figure 4-3: Simulated daily PM2.5 concentrations (Baseline)
Air Quality Impact Assessment for the Proposed Kriel Power Station FFP Retrofit
Report No.: 15WES01 Draft 20
Figure 4-4: Simulated annual PM2.5 concentrations (Baseline) (maximum simulated concentration 1.4 µg/m3)
Air Quality Impact Assessment for the Proposed Kriel Power Station FFP Retrofit
Report No.: 15WES01 Draft 21
5 IMPACT OF THE FUTURE OPERATIONS ON THE AMBIENT AIR QUALITY
The assessment of future operations at the Kriel Power Station considered the operation of the Power Station with the
retrofitted FFP. Emissions were assumed to meet the “new plant” minimum emissions standards (Table 2-2). As for the
baseline scenario, the assessment of the impact of the future operations included the wind-blown dust from the coal
stockpile and ash disposal facility. The construction phase for the FFPs is considered from a qualitative perspective.
5.1 Construction Phase
The construction of the infrastructure associated with the FFPs is likely to impact the air quality. Construction activities would
normally comprise a series of different operations including land clearing, topsoil removal, road grading, material loading and
hauling, stockpiling, compaction, etc. Each of these operations will have a distinct duration and potential for particulate
generation. It is anticipated that the extent of particulate emissions would vary substantially from day to day depending on
the level of activity, the specific operations, and the prevailing meteorological conditions.
It is not anticipated that the various construction activities will result in higher off-site impacts than the operational activities.
The temporary nature of the construction activities, and the likelihood that these activities will be localised and for small
areas at a time, will reduce the potential for significant off-site impacts. The Environment Protection Authority South Australia
recommends a management zone of 300 m from the nearest sensitive receptor when materials handling activities occur
(AEPA, 2007).
5.2 Operational Phase
5.2.1 Dispersion Modelling Parameters and Emissions Quantification
5.2.1.1 Boiler Unit Chimney Stacks
Emission rates were calculated assuming that emissions were compliant with the MES applicable after 1 April 2020
(50 mg/Nm³) (Table 5-1). Actual operational emissions are likely to be lower than this maximum release rate, but a
conservative approach was adopted for the dispersion modelling exercise. It was indicated that stack parameters –
especially those affecting pollutant dispersion – would not be materially affected by the FFP retrofit. This was assumed to be
accurate. The limitation of this assumption is that changes in some exit parameters, such as temperature and velocity, may
affect the dispersion, and ground-level impact, of the particulate matter and other pollutants.
Table 5-1: Stack parameters and particulate emissions of the Kriel Power Station: future operations
Parameter Stack 1 Stack 2 Units
Stack height 213 213 m
Stack diameter 14.3 14.3 m
Exit velocity 17 17 m/s
Exit temperature 130 130 °C
PM10 emission rate 101.6 101.6 g/s
PM2.5 emission rate (a) 91.4 91.4 g/s
PM emission concentration (MES) 50 50 mg/Nm³
Note: (a) PM2.5 assumed to be 90% of total particulate emissions from the stacks
Air Quality Impact Assessment for the Proposed Kriel Power Station FFP Retrofit
Report No.: 15WES01 Draft 22
5.2.1.2 Fugitive Particulate Emissions
Fugitive emissions for the future operations were modelled as for the baseline scenario (Section 4.1.1.2).
5.2.2 Screening of Simulated Human Health Impacts
5.2.2.1 Impact on PM10
Exceedances of the PM10 NAAQ limit concentration were simulated to comply with the four daily exceedances allowed by
the NAAQS (Figure 4-1). The maximum simulated daily PM10 concentration across the domain is 242 μg/m³ (NAAQ limit
concentration: 75 μg/m³) and the maximum number of days where the 75 μg/m³ limit is exceeded is 3-days per year. Annual
PM10 concentrations as a result of baseline operations at the Kriel Power Station were simulated to represent less than 5%
of the annual NAAQS (Figure 4-2).
Figure 5-1: Simulated daily PM10 concentrations (Baseline)
Air Quality Impact Assessment for the Proposed Kriel Power Station FFP Retrofit
Report No.: 15WES01 Draft 23
Figure 5-2: Simulated annual PM10 concentrations (Baseline) (maximum simulated concentration 2.6 µg/m3)
The comparative impact of the current particulate controls (ESP) and the proposed retrofitted FFP are not easy to discern
from the plots for the combined sources included in the dispersion modelling (stack emissions and fugitive particulate
sources). In order to compare the impact of the two particulate control technologies, the simulated annual average
concentrations for stack emissions only, were plotted on the same figure at a comparative level (0.5 μg/m³) (Figure 5-3). The
area impacted at this level shows a distinct advantage of the FFP technology that will reduce the area impacted on an
annual basis at the 0.5 μg/m³ by 96% (Table 5-2).
Table 5-2: Comparative impact of the stack emissions only for the baseline and future scenarios
Scenario Maximum annual concentration simulated
in the domain Area impacted by annual concentrations of 0.5 μg/m³
or higher
Baseline (ESP) scenario 0.90 μg/m³ 3 226 ha
Future (FFP) scenario 0.52 μg/m³ 127 ha
The low simulated annual concentrations for the Power Station stack emissions only highlight the contribution of the fugitive
sources at the Power Station and sources off-site to be background measured values where non-compliance with the
ambient standards were recorded for the period assessed.
Air Quality Impact Assessment for the Proposed Kriel Power Station FFP Retrofit
Report No.: 15WES01 Draft 24
Figure 5-3: Comparison of baseline and future annual PM10 concentrations – Stack emissions only (level plotted
0.5 μg/m³)
5.2.2.2 Impact on PM2.5
The simulated PM2.5 concentrations were compared against the most stringent ambient standards that will be applicable
from 1 January 2030 (Table 2-1).
Compliance with the four daily exceedances allowed by the daily PM2.5 NAAQS was simulated for baseline operations at the
Kriel Power Station (Figure 5-4). The maximum simulated daily PM2.5 concentration across the domain is 73 μg/m³ (NAAQ
limit concentration is 25 μg/m³) and the maximum number of days where the 25 μg/m³ limit is exceeded is 3-days per year.
Annual PM2.5 concentrations as a result of baseline operations at the Kriel Power Station were simulated to represent less
than 10% of the annual NAAQS (Figure 5-5).
Air Quality Impact Assessment for the Proposed Kriel Power Station FFP Retrofit
Report No.: 15WES01 Draft 25
Figure 5-4: Simulated daily PM2.5 concentrations (Baseline)
Figure 5-5: Simulated annual PM2.5 concentrations (Baseline) (maximum simulated concentration 1.4 µg/m3)

Air Quality Impact Assessment for the Proposed Kriel Power Station FFP Retrofit
Report No.: 15WES01 Draft 26
5.3 Decommissioning Phase
During the decommissioning phase of the project all power station operations will have ceased. Emissions are likely to
originate from the demolition of structures, wind-blown dust from exposed stockpiles (topsoil, overburden, coal and the ash)
and unpaved roads. Generally emissions from this phase are minor, infrequent, and are expected to have minimal impacts
on the environment provided proper rehabilitation efforts are put in place early-on during the operational phase.
Air Quality Impact Assessment for the Proposed Kriel Power Station FFP Retrofit
Report No.: 15WES01 Draft 27
6 RECOMMENDED AIR QUALITY MANAGEMENT MEASURES
6.1 Proposed FFP Technology
Primary kinds of particulate control used for coal combustion, according to the Air Pollution Engineering Manual (AWMA,
2000), include multiple cyclones, ESPs, fabric filters and venture scrubbers. The type of technology is guided by the type of
furnace, coal properties and operating conditions. In the USA, ESPs were the preferred technology for emissions control in
the 1970’s. Due to significant progress in the recent years in the design and operation of fabric filter collectors, specifically
for the collection of coal fly ash, these have become more popular for use in coal-fired power stations (AWMA, 2000).
Whereas ESPs remove particles from the gas stream through electrical forces, fabric filters remove dust by passing the gas
stream through porous fabric. The efficacy of dust removal by bag filters is dependent on the design parameters; however,
in general bag filters have higher removal efficiency for fine, sub-micrometre particles than ESPs. Bag filter designs are
usually either reverse-air or pulse-jet types. The latter removes the particles by sending a pulsed jet of compressed air into
the bag, resulting in an effective way of cleaning (AWMA, 2000).
6.1.1 Relation of FFP to World-Wide Best Practice
Best Available Techniques (BAT) according to the Integrated Pollution Prevention and Control (IPPC, 2004) on Large
Combustion Plants includes either ESPs or FFPs. It states that particulate emission control of less than 20 mg/Nm³ can be
achieved for coal and lignite plants of more than 300 MWth through ESPs and/ or FFPs. The IPPC confirms that FFPs
achieve higher control efficiencies on the removal of small particles (i.e. 99.6% on particles <1 μm) than ESPs (i.e. 96.5% on
particles <1 μm). Both technology options can achieve 99.95% removal of particles larger than 10 μm (IPPC, 2004).
The World Bank emission limits for Boilers (Solid Fuels Plant >=600 MWth) in degraded areas is 30 mg/Nm³ (IFC, 2008).
The South African Minimum Emission Limits are however based on international best practice and applied. The FFP should
therefore achieve, as a minimum, 50 mg/Nm³.
6.1.2 Monitoring
The Minimum Emission Standards require continuous stack emissions for Combustion Installations with design capacity of
equal to or greater than 50 MW heat input per unit. This is in place at Kriel Power Station and is expected to continue after
the in retrofit of the FFPs.
Stack emission parameters, including temperature, flow rate, and exit velocity, will be monitored in order to assess pollutant
emission compliance. Variations in these parameters may affect the dispersion and ground-level impact of the particulate
matter and other pollutants. It is recommended that these parameters be monitored for deviation from those used in this
impact assessment, with the possible need to assess the impact of other pollutants on human health and the environment.
Air Quality Impact Assessment for the Proposed Kriel Power Station FFP Retrofit
Report No.: 15WES01 Draft 28
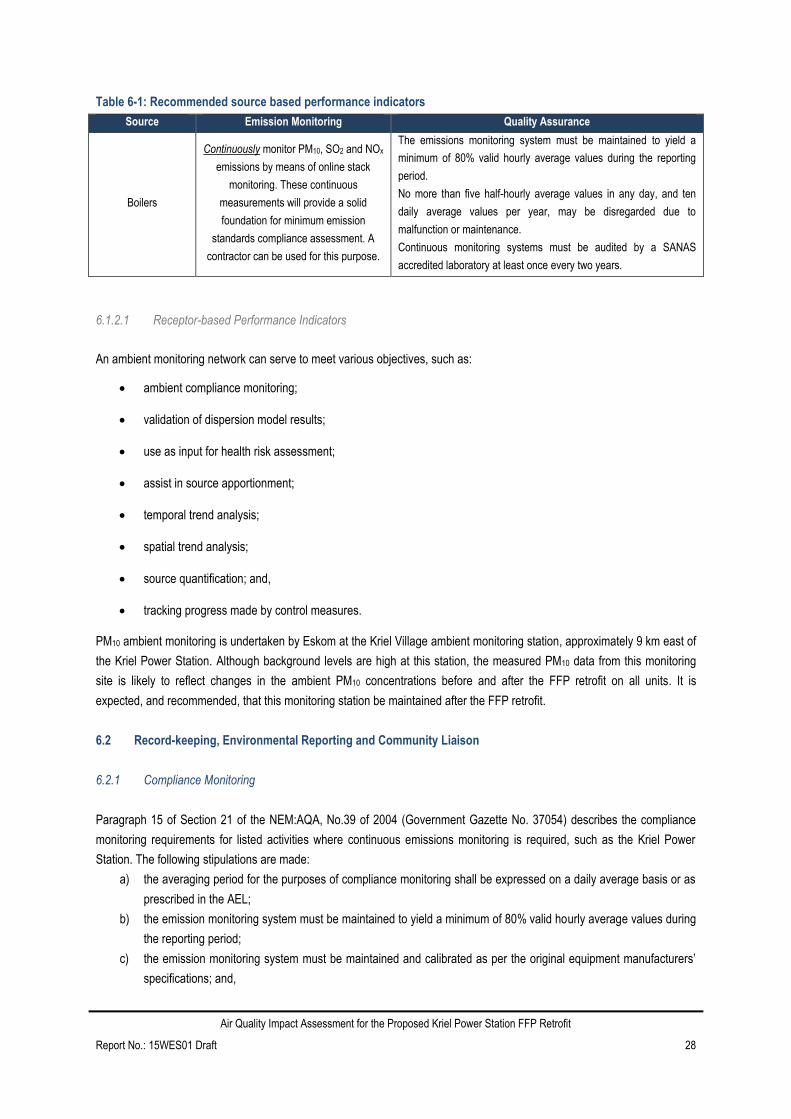
Table 6-1: Recommended source based performance indicators
Source Emission Monitoring Quality Assurance
Boilers
Continuously monitor PM10, SO2 and NOx
emissions by means of online stack
monitoring. These continuous
measurements will provide a solid
foundation for minimum emission
standards compliance assessment. A
contractor can be used for this purpose.
The emissions monitoring system must be maintained to yield a
minimum of 80% valid hourly average values during the reporting
period.
No more than five half-hourly average values in any day, and ten
daily average values per year, may be disregarded due to
malfunction or maintenance.
Continuous monitoring systems must be audited by a SANAS
accredited laboratory at least once every two years.
6.1.2.1 Receptor-based Performance Indicators
An ambient monitoring network can serve to meet various objectives, such as:
ambient compliance monitoring;
validation of dispersion model results;
use as input for health risk assessment;
assist in source apportionment;
temporal trend analysis;
spatial trend analysis;
source quantification; and,
tracking progress made by control measures.
PM10 ambient monitoring is undertaken by Eskom at the Kriel Village ambient monitoring station, approximately 9 km east of
the Kriel Power Station. Although background levels are high at this station, the measured PM10 data from this monitoring
site is likely to reflect changes in the ambient PM10 concentrations before and after the FFP retrofit on all units. It is
expected, and recommended, that this monitoring station be maintained after the FFP retrofit.
6.2 Record-keeping, Environmental Reporting and Community Liaison
6.2.1 Compliance Monitoring
Paragraph 15 of Section 21 of the NEM:AQA, No.39 of 2004 (Government Gazette No. 37054) describes the compliance
monitoring requirements for listed activities where continuous emissions monitoring is required, such as the Kriel Power
Station. The following stipulations are made:
a) the averaging period for the purposes of compliance monitoring shall be expressed on a daily average basis or as
prescribed in the AEL;
b) the emission monitoring system must be maintained to yield a minimum of 80% valid hourly average values during
the reporting period;
c) the emission monitoring system must be maintained and calibrated as per the original equipment manufacturers’
specifications; and,

Air Quality Impact Assessment for the Proposed Kriel Power Station FFP Retrofit
Report No.: 15WES01 Draft 29
d) continuous emission monitoring systems must be audited by a SANAS accredited laboratory at least once every
two (2) years.
It is understood that continuous emissions monitoring occurs at Kriel Power Station and that, for compliance purposes, it will
continue during and after the FFP retrofit.
6.2.2 Reporting Requirements
Reporting requirements for listed activities are described in Paragraph 17 and 18 of Section 21 of the NEM:AQA
(Government Gazette No. 37054) where the holder of an AEL should submit annual reports to the Licensing Authority
(unless otherwise specified in the AEL). The annual reports for facilities requiring continuous emissions monitoring should
include:
(i) Results of the spot measurements or correlation test carried out to verify the accuracy of the continuous
emissions measurements;
(ii) The most recent correlation tests; and,
(iii) The availability of the system in terms of the number of full hours per annum that valid results were obtained.
Where exceedances of the MES were recorded by the continuous emissions monitoring systems occurred in the reporting
period, an explanation of the circumstances, and the remedial actions and plans aimed to ensure that similar events do not
re-occur.
It is understood that the Kriel Power Station complies with the reporting requirements and will continue to do so after the
FFP retrofit.
6.2.3 Liaison Strategy for Communication with I&APs
It is recommended that a complaints register be initiated, if not already in use, to record complaints lodged by I&APs. It is
also suggested that a collaborative Environmental Management forum be established, including representatives from the
mining operations as well as the power stations. This forum would be an appropriate mechanism for communication with
I&APs potentially affected by the Power Stations and near-by mining.
Air Quality Impact Assessment for the Proposed Kriel Power Station FFP Retrofit
Report No.: 15WES01 Draft 30
7 CONCLUSIONS AND RECOMMENDATIONS
The main findings from the baseline assessment were as follows:
The main sources likely to contribute to cumulative particulate ground-level concentrations in the vicinity of Kriel
Power Station are: Matla Power Station; Matla coal mine; surrounding agricultural activities; biomass burning,
domestic fuel burning; other mining activities, especially open cast mining; vehicle entrainment on unpaved road
surfaces; and, persistent pollutants from more distant industrial sources.
The nearest sensitive receptors the Kriel Power Station are the town of Kriel; staff villages at the Kriel and Matla
Power Stations; and the surrounding settlements (including farm houses).
Measured ambient PM10 concentrations at the Kriel Village monitoring station were non-compliant with the NAAQS
(for daily and annual averaging periods) for the three-years assessed (2013 to 2015).
The main findings from the impact assessment due to current operations and proposed FFP retrofit at all six units were as
follows:
The simulated daily and annual PM10 and PM2.5 concentrations within the domain (due to current and future power
station stack releases, existing ash dam operations and coal stockpile operations only) were within the NAAQS.
The simulated FFP retrofit to the Kriel Power Station units would reduce the impact of PM10 from the stacks (only)
by ~96%. Before and after the retrofit the simulated annual PM10 concentrations (due to stack emissions only)
were predicted to be a maximum of 0.90 μg/m³ and 0.52 μg/m³ respectively.
The low simulated annual concentrations for the Power Station stack emissions only highlight the contribution of
the fugitive sources at the Power Station and sources off-site to be background measured values where non-
compliance with the ambient standards were recorded for the period assessed.
7.1 Recommendations
In light of the findings, it is recommended that the FFP retrofit be implemented as an air quality management measure to
meet Minimum Emission Standards and to ensure the lowest possible impacts on the surrounding environment.
Air Quality Impact Assessment for the Proposed Kriel Power Station FFP Retrofit
Report No.: 15WES01 Draft 31
8 REFERENCES
AEPA. (2007). Guidelines for Separation Distances. Environment Protection Authority South Australia.
Burger, L. W. (1994). Ash Dump Dispersion Modelling, in Held G: Modelling of Blow-Off Dust From Ash Dumps. Eskom
Report TRR/S94/185, Cleveland, 40 pp.
Burger, L., Held, G., & Snow, N. (1995). Ash Dump Dispersion Modeling Sensitivity Analysis of Meteorological and Ash
Dump Parameters. Cleveland: Eskom Report TRR/S95/077.
Carslaw, D. (2014). The openair manual - open-source tools for analysing air pollution data. Manual for version 1.0. King's
College London.
Carslaw, D., & Ropkins, K. (2012). openair - an R package for air quality data analysis. Environmental Modelling and
Software, 27-28, 52 - 61.
Department of Environmental Affairs. (2009, December 24). Gazette No: 32816.
Department of Environmental Affairs. (2011, August 5). Gazette No. 34493.
Hanna, S. R., Egan, B. A., Purdum, J., & Wagler, J. (1999). Evaluation of ISC3, AERMOD, and ADMS Dispersion Models
with Observations from Five Field Sites.
HPA. (2011). The Highveld Priority Area Air Quality Management Plan. Durban: Report issued by uMoya-NILU Consulting
(Pty) Ltd, Report number uMN003-10, on behalf of the Department of Environmental Affairs .
IFC. (2007). General Environmental, Health and Safety Guidelines. World Bank Group.
Marticorena, B., & Bergametti, G. (1995). Modelling the Atmospheric Dust Cycle 1 Design of a Soil-Derived Dust Emission
Scheme. Journal of Geophysical Research, 100, 16415-16430.
Pasquill, F. (1974). Atmospheric Diffusion: The Dispersion of Windborne Material from Industrial and other Sources. London:
Van Norstand Company Ltd.
Scire, J. S., Strimaitis, D. G., & Yamartino, R. J. (2000). A User’s Guide for the CALPUFF Dispersion Model (Version 5).
Concord, MA: Earth Tech Inc.
uMoya-NILU. (2014). Atmospheric Impact Report in support of Eskom’s application for postponement of the Minimum
Emission Standards compliance timeframes for the Kriel Power Station. Durban: uMoya-NILU (Pty) Ltd., Report
No. uMN0046-2014, February 2014.
US-EPA. (1987). Ambient Monitoring Guidelines for Prevention of Significant Deterioration (PSD). Research Triangle Park
NC: US-EPA.
US-EPA. (1998). Interagency Workgroup on Air Quality Modeling (IWAQM) Phase 2 Summary Report and
Recommendations for Modeling Long-Range Transport Impacts. Research Triangle Park, NC: EPA‐454/R‐98‐
019; U.S. Environmental Protection Agency.
Air Quality Impact Assessment for the Proposed Kriel Power Station FFP Retrofit
Report No.: 15WES01 Draft 32
9 APPENDIX A – WIND EROSION EMISSION QUANTIFICATION
Wind-blown dust as a source of particulate matter was included due to large exposed areas and generally dry environment,
resulting in potential particulate emissions from the exposed areas, including slimes dams, tailings facilities and stockpiles.
Significant emissions arise due to the mechanical disturbance of granular material from open areas and storage piles.
Parameters which have the potential to impact on the rate of emission of fugitive dust include the extent of surface
compaction, moisture content, groundcover, the shape of the area, particle size distribution, wind speed and precipitation.
Any factor that binds the erodible material, or otherwise reduces the availability of erodible material on the surface,
decreases the erosion potential of the fugitive source. High moisture contents, whether due to precipitation or deliberate
wetting, promote the aggregation and cementation of fines to the surfaces of larger particles, thus decreasing the potential
for dust emissions. Surface compaction and ground cover similarly reduces the potential for dust generation. The shape of a
storage pile or disposal dump influences the potential for dust emissions through the alteration of the airflow field. The
particle size distribution of the material on the disposal site is important since it determines the rate of entrainment of
material from the surface, the nature of dispersion of the dust plume, and the rate of deposition, which may be anticipated
(Burger, Held, & Snow, 1997).
The calculation of emission rates for various wind speeds and stability classes representative of the simulation period was
carried out using the ADDAS model. This model is based on the dust emission model by Marticorena and Bergametti
(1995). The model attempts to account for the variability in source erodibility through the parameterisation of the erosion
threshold (based on the particle size distribution of the source) and the roughness length of the surface. Shao (2008)
proposed a three dust-emission mechanism to describe the vertical mass flux (Figure 9-1). With aerodynamic lift, dust
particles can be lifted from the surface directly by aerodynamic forces, however as the importance of gravity and
aerodynamic forces diminishes for smaller particles and inter-cohesion becomes more important, dust emission arising from
this mechanism is small in general. With saltation bombardment, particles strike the surface and cause localised impacts
which are strong enough to overcome the binding forces acting upon dust particles leading to dust emissions. This
mechanism can be an order of magnitude larger than the aerodynamic entrainment. Disaggregation occurs when particles
are released from aggregates in soil typically with high clay content. During a weak wind erosion event, sand particles
coated with dusts behave as individuals and dust particles may not be released. During strong wind-erosion events,
dustcoats and aggregates may disintegrate resulting in increased dust emissions.
Emission rates for the construction phases were calculated using both the Marticorena and Bergametti and Shao models. In
this case the Marticorena and Bergametti model was the most conservative.
Emission rates were calculated based on the Kriel Village meteorological data (between 2013 and 2015) and appropriate
particle size distributions (PSD). A conservative moisture content of all materials was used in the calculation to illustrate the
worst-case scenario with respect to wind-blown dust. The parameters used to calculate emissions from wind-blown dust are
presented in Table 4-3 and Table 4-4.
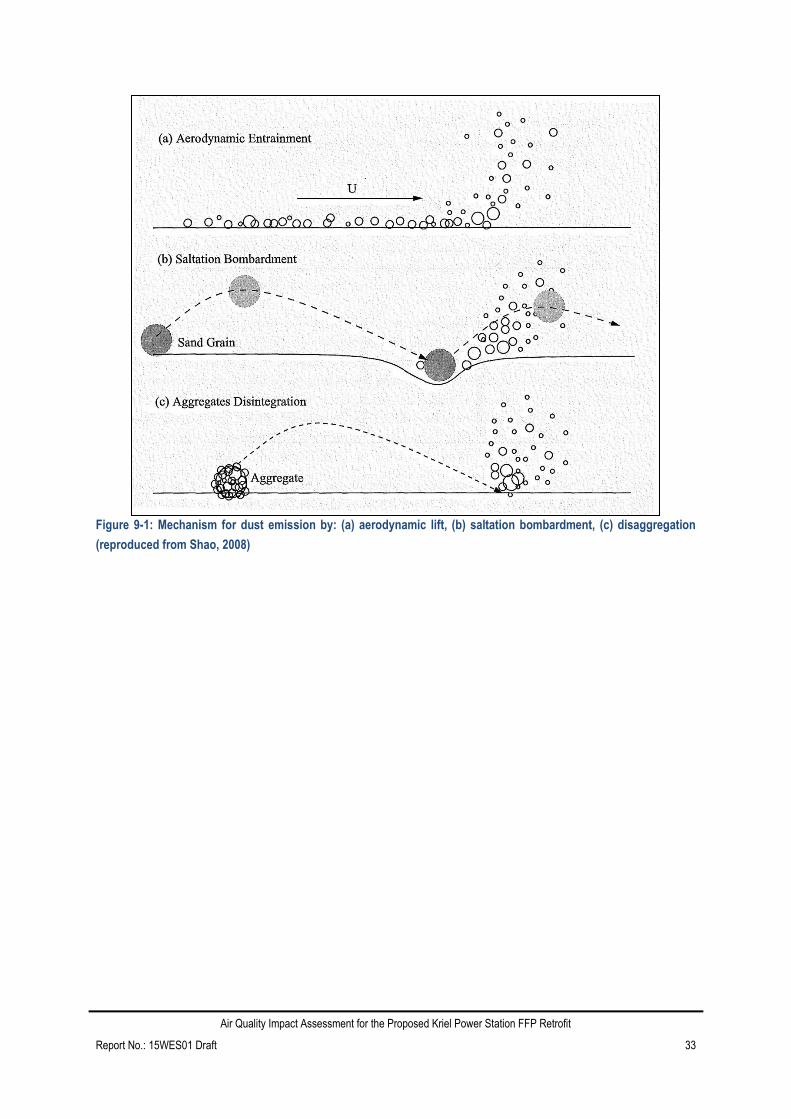
Air Quality Impact Assessment for the Proposed Kriel Power Station FFP Retrofit
Report No.: 15WES01 Draft 33
Figure 9-1: Mechanism for dust emission by: (a) aerodynamic lift, (b) saltation bombardment, (c) disaggregation
(reproduced from Shao, 2008)


![HANDBOOK FOR HOSTING, The Dean Kriel HANDBOOK FOR …...Stories, notes and anecdotes prepared by The Dean Kriel, for you and your [MARS] journey If man could experience the world…](https://img.pdfslide.us/doc/110x75/5f772923dc9a4a5b0f16541e/handbook-for-hosting-the-dean-kriel-handbook-for-stories-notes-and-anecdotes.jpg)