Embed Size (px)
Citation preview

Air Quality Effects of Urban Trees and Parks
DAVID J. NOWAK
GORDON M. HEISLER
R E S E A R C H S E R I E S | 2 0 1 0


1
Air Quality Effects of Urban Trees and Parks www.NRPA.org
NationalRecreationandParkAssociation ©2010AllRightsReserved
Table of Contents
Executive Summary . . . . . . . . . . . . . . . . . . . . . . . . . . . . . . . . . . . . . . . . . . . . . . . . . . . . . . . . . . . . . . . 3
Air Temperature Reduction . . . . . . . . . . . . . . . . . . . . . . . . . . . . . . . . . . . . . . . . . . . . . . . . . . . . . . . 4
Air Pollution Reduction . . . . . . . . . . . . . . . . . . . . . . . . . . . . . . . . . . . . . . . . . . . . . . . . . . . . . . . . . . 4
Ultraviolet Radiation Reduction . . . . . . . . . . . . . . . . . . . . . . . . . . . . . . . . . . . . . . . . . . . . . . . . . . . . 4
Carbon Dioxide (Climate Change) Reduction . . . . . . . . . . . . . . . . . . . . . . . . . . . . . . . . . . . . . . . . . . 5
Recommendations and Goals for Park Management . . . . . . . . . . . . . . . . . . . . . . . . . . . . . . . . . . . . 5
Introduction . . . . . . . . . . . . . . . . . . . . . . . . . . . . . . . . . . . . . . . . . . . . . . . . . . . . . . . . . . . . . . . . . . . . . 6
Trees and Parks in Our Cities . . . . . . . . . . . . . . . . . . . . . . . . . . . . . . . . . . . . . . . . . . . . . . . . . . . . . . . . 6
Highlights . . . . . . . . . . . . . . . . . . . . . . . . . . . . . . . . . . . . . . . . . . . . . . . . . . . . . . . . . . . . . . . . . . . 6
Trees, Parks and Air Temperature . . . . . . . . . . . . . . . . . . . . . . . . . . . . . . . . . . . . . . . . . . . . . . . . . . . . .12
Highlights . . . . . . . . . . . . . . . . . . . . . . . . . . . . . . . . . . . . . . . . . . . . . . . . . . . . . . . . . . . . . . . . . . .12
Urban Heat Islands . . . . . . . . . . . . . . . . . . . . . . . . . . . . . . . . . . . . . . . . . . . . . . . . . . . . . . . . . . . .12
Baltimore Parks Case Study – Reducing Local Air Temperatures . . . . . . . . . . . . . . . . . . . . . . . . . . .14
Air Temperature Effects of Parks in Other Cities . . . . . . . . . . . . . . . . . . . . . . . . . . . . . . . . . . . . . . .19
Recommendations . . . . . . . . . . . . . . . . . . . . . . . . . . . . . . . . . . . . . . . . . . . . . . . . . . . . . . . . . . . . .21
Trees, Parks and Air Pollution . . . . . . . . . . . . . . . . . . . . . . . . . . . . . . . . . . . . . . . . . . . . . . . . . . . . . . . .22
Highlights . . . . . . . . . . . . . . . . . . . . . . . . . . . . . . . . . . . . . . . . . . . . . . . . . . . . . . . . . . . . . . . . . . .22
Tree Effects on Air Pollution . . . . . . . . . . . . . . . . . . . . . . . . . . . . . . . . . . . . . . . . . . . . . . . . . . . . . .22
1) Effects of trees on local microclimate . . . . . . . . . . . . . . . . . . . . . . . . . . . . . . . . . . . . . . . . .22
2) Removal of air pollutants . . . . . . . . . . . . . . . . . . . . . . . . . . . . . . . . . . . . . . . . . . . . . . . . . .23
3) Emission of chemicals . . . . . . . . . . . . . . . . . . . . . . . . . . . . . . . . . . . . . . . . . . . . . . . . . . . .25
Overall Effect of Vegetation on Air Pollution . . . . . . . . . . . . . . . . . . . . . . . . . . . . . . . . . . . . . . . . . . .26
Health Effects . . . . . . . . . . . . . . . . . . . . . . . . . . . . . . . . . . . . . . . . . . . . . . . . . . . . . . . . . . . . . . . .26
Importance of Parks to Clean Air . . . . . . . . . . . . . . . . . . . . . . . . . . . . . . . . . . . . . . . . . . . . . . . . . .26
Recommendations . . . . . . . . . . . . . . . . . . . . . . . . . . . . . . . . . . . . . . . . . . . . . . . . . . . . . . . . . . . . .26
Trees, Parks and Ultraviolet Radiation . . . . . . . . . . . . . . . . . . . . . . . . . . . . . . . . . . . . . . . . . . . . . . . . . .27
Highlights . . . . . . . . . . . . . . . . . . . . . . . . . . . . . . . . . . . . . . . . . . . . . . . . . . . . . . . . . . . . . . . . . . .27
Recommendations . . . . . . . . . . . . . . . . . . . . . . . . . . . . . . . . . . . . . . . . . . . . . . . . . . . . . . . . . . . . .29
Trees, Parks and Climate Change . . . . . . . . . . . . . . . . . . . . . . . . . . . . . . . . . . . . . . . . . . . . . . . . . . . . .29
Highlights . . . . . . . . . . . . . . . . . . . . . . . . . . . . . . . . . . . . . . . . . . . . . . . . . . . . . . . . . . . . . . . . . . .29
Tree and Park Effects on Climate Change . . . . . . . . . . . . . . . . . . . . . . . . . . . . . . . . . . . . . . . . . . . .29
Carbon Storage . . . . . . . . . . . . . . . . . . . . . . . . . . . . . . . . . . . . . . . . . . . . . . . . . . . . . . . . . . .29
Carbon Emissions . . . . . . . . . . . . . . . . . . . . . . . . . . . . . . . . . . . . . . . . . . . . . . . . . . . . . . . . . .33
Reduced Carbon Emissions through Cooler Temperatures and Reduced Energy Use . . . . . . . . .33
Recommendations . . . . . . . . . . . . . . . . . . . . . . . . . . . . . . . . . . . . . . . . . . . . . . . . . . . . . . . . . . . . .33

NationalRecreationandParkAssociation ©2010AllRightsReserved
2
Case Study—Chicago Parks . . . . . . . . . . . . . . . . . . . . . . . . . . . . . . . . . . . . . . . . . . . . . . . . . . . . . . . .33
Appendix—Examples of Species with Relatively Large Air Quality Benefits . . . . . . . . . . . . . . . . . . . . . . . .35
Bibliography . . . . . . . . . . . . . . . . . . . . . . . . . . . . . . . . . . . . . . . . . . . . . . . . . . . . . . . . . . . . . . . . . . . .38
Literature Cited . . . . . . . . . . . . . . . . . . . . . . . . . . . . . . . . . . . . . . . . . . . . . . . . . . . . . . . . . . . . . . . . . .40

3
Air Quality Effects of Urban Trees and Parks www.NRPA.org
NationalRecreationandParkAssociation ©2010AllRightsReserved
Air Quality Effects of Urban Trees and Parks
David J. Nowak
ProjectLeader
UnitedStatesDepartmentofAgriculture–ForestService
Gordon M. Heisler
Meteorologist
UnitedStatesDepartmentofAgriculture–ForestService
Executive Summary
Estimated Value of Trees in U .S . Urban Parks
• Structural value = $300 billion
• Air temperature reduction = unknown, but likely in the billions of dollars per year
• Air pollution removal = $500 million per year
• Reduced ultraviolet radiation = unknown, but likely substantial
• Carbon storage (trees): $1 .6 billion
• Annual carbon removal (trees): $50 million per year
Estimated Value of Trees in Parks in Chicago, Illinois
• Structural value = $192 million
• Air temperature reduction = unknown
• Air pollution removal = $344,000 per year
• Reduced ultraviolet radiation = unknown
• Carbon storage (trees): $1 .1 million
• Annual carbon removal (trees): $32,800 per year
Parks are significant parts of the urban landscape and comprise about 6% of city and town areas in the conterminous United States . These urban parks are estimated to contain about 370 million trees with a structural value of approximately $300 billion . The number of park trees varies by region of the country, but they can produce significant air quality effects in and near parks, related to air temperatures, air pollution, ultraviolet radiation, and carbon dioxide (a dominant greenhouse gas related to global climate change) . Additional open space and other vacant lands in cities, which may contain trees and other vegetation, contribute significant additional benefits . Effects of parks and open space at the city scale can vary significantly depending on the amount of parkland and amount of tree cover within the parkland .

Air Quality Effects of Urban Trees and Parks www.NRPA.org
NationalRecreationandParkAssociation ©2010AllRightsReserved
4
Air Temperature Reduction
Parks generally have lower air temperatures than surrounding areas . Temperatures are usually cooler toward the center of a park than around its edges . At night, the center of a large park may be 13°F (7°C) cooler than surrounding city areas .
The cooler air from parks often moves out into adjacent developed neighborhoods . This cooling of surrounding areas tends to increase with park size and percentage of the park covered by trees .
Most studies show that temperature reductions by parks are greater at night than during the day . On clear nights with low wind speed, park lawn areas may be cooler than areas under trees . Thus, parks that include a variety of site conditions, areas with trees close together as well as open lawns, will maximize the options for comfort of visitors .
Cooler air temperatures provided by urban parks can have significant impacts on human health . During heat wave events, which can kill hundreds of people, park areas may provide city dwellers with some respite from high air temperatures, particularly in the evening . During hot, sunny days tree shade can greatly increase human comfort .
Because park influences on air temperature extend to developed areas outside of parks, local energy use for heating and cooling buildings is also affected . Although the net annual effect of parks on energy costs by reducing temperatures is difficult to estimate, at least in the southern United States the effect will usually be a net annual benefit . Furthermore, large park trees will reduce winds and may provide a benefit for winter heating of buildings near the park .
Although the overall economic effect of urban trees and parks on air temperature reduction is not fully known, it is likely on the order of billions of dollars annually at the national scale in terms of improved environmental quality and human health .
Air Pollution Reduction
Trees and vegetation in parks can help reduce air pollution both by directly removing pollutants and by reducing air temperatures and building energy use in and near parks . These tree effects can reduce pollutant emissions and formation . However, park vegetation can increase some pollutants by either directly emitting volatile organic compounds that can contribute to ozone and carbon monoxide formation or indirectly by the emission of air pollutants through vegetation maintenance practices such as operation of chain saws and use of transportation fuels .
Annual pollution removal and economic benefits by U .S . urban park trees is estimated at about:
• 75,000 tons ($500 million) or
• 80 pounds per acre of tree cover ($300 per acre of tree cover)
Ultraviolet Radiation Reduction
Park trees can shield people from ultraviolet (UV) radiation, as tree leaves absorb about 95% of UV radiation . The reduction in UV exposure to park visitors is important because excess exposure to UV is the cause or contributing factor for three types of skin cancer, and UV radiation is also blamed for contributing to cataracts of the eye .
While the overall economic effect of reduced UV exposure to park visitors is unknown, it is likely substantial . In 2004, the total direct cost associated with the treatment for the most common skin cancers, non-melanoma skin cancer, was $1 .5 billion . The total expense for cataract operations is also great, because this is the most common surgery in the United States .

5
Air Quality Effects of Urban Trees and Parks www.NRPA.org
NationalRecreationandParkAssociation ©2010AllRightsReserved
Carbon Dioxide (Climate Change) Reduction
Trees and vegetation in parks can help reduce carbon dioxide (a dominant greenhouse gas) by directly removing and storing carbon dioxide and indirectly by reducing air temperature and building energy use in and near parks . Park vegetation can increase carbon dioxide by either directly emitting carbon dioxide from the vegetation (e .g ., decomposition) or indirectly through emissions from vegetation maintenance practices .
Carbon storage and annual removal by urban park trees and soils in the United States is estimated at about:
• Carbon storage (trees): 75 million tons ($1 .6 billion)
• Carbon storage (soils): 102 million tons of carbon ($2 .1 billion)
• Annual carbon removal (trees): 2 .4 million tons ($50 million)
On a per acre basis, carbon effects for U .S . parks are estimated to be:
• Carbon storage (per acre of tree cover): 40 tons ($800)
• Carbon storage (per acre of soil): 32 tons ($650)
• Annual carbon removal (per acre of tree cover): 1 .2 tons ($25)
Recommendations and Goals for Park Management
• Consider that most of the effects of trees on microclimate and air quality are beneficial for park users and nearby residents .
• Park designs that include a variety of land cover—areas of dense trees, scattered trees, and lawn—are likely to provide the greatest opportunities for optimum physical comfort of visitors .
• Increase the number of healthy trees (increases pollution removal and carbon storage) .
• Sustain existing tree cover (maintains pollution removal levels and carbon storage) .
• Maximize use of low volatile organic compound (VOC) emitting trees (reduces ozone and carbon monoxide formation) .
• Sustain large, healthy trees (large trees have greatest per tree effects on pollution and carbon removal) .
• Use long-lived trees (reduces long-term pollutant emissions from planting and removal) .
• Use low maintenance trees (reduces pollutants and carbon emissions from maintenance activities) .
• Reduce fossil fuel use in maintaining vegetation (reduces pollutant and carbon emissions) .
• Plant trees in energy conserving locations (reduces pollutant emissions from power plants) .
• Plant trees to shade parked cars (reduces vehicular VOC emissions) .
• Supply ample water to vegetation (enhances pollution removal and temperature reduction) .
• Avoid pollutant sensitive species in heavily polluted areas (increases tree health) .
• Utilize evergreen trees for particulate matter reduction (year-round removal of particles) .
• Where feasible, provide park recreation areas with large trees to give visitors the option of being in shade .
• Consider posting for park visitors up-to-date recommendations from health authorities on avoiding excessive exposure to UV radiation . Usually these recommendations include seeking shade around midday .
• Utilize wood from removed trees for energy or in long-term products . (This reduces the need for fossil-based energy or reduces or delays carbon emissions .)

Air Quality Effects of Urban Trees and Parks www.NRPA.org
NationalRecreationandParkAssociation ©2010AllRightsReserved
6
Introduction
Trees in cities and parks have a significant impact on air quality for local residents . Not only do trees affect the concentration of air pollutants that we breathe, they also affect local air temperatures and the amount of ultraviolet radiation we are exposed to . Trees also can help reduce greenhouse gas concentra-tion and emissions that affect climate change . Thus, there are four main factors of air quality being ad-dressed in this chapter: air temperature, air pollution, ultraviolet radiation, and climate change . Trees and parks can affect each of these factors, and each factor has important implications for environmental quality and human health in our cities .
Park ecosystems often offer significant amounts of open space that allow for relatively high densi-ties of trees, shrubs, grasses, and other vegetated surfaces . This chapter focuses mainly on the effects of trees, particularly in urban park settings . Other vegetation types such as shrubs and grasses will have similar effects to trees, but often to a lesser degree due to their smaller stature . For example, healthy shrubs and grass will remove air pollution to a lesser degree than trees . However, their effects are not always similar . For example, shrubs and grass will not have the same effect as trees in reducing ultraviolet radiation loads on humans because they often do not reach the height necessary to block solar radiation reaching humans .
This paper will explore how trees in cities, particularly in park settings, can improve air quality . It will discuss the current tree resources in cities in the United States, why each attribute of air quality is impor-tant to local residents, and how trees and parks can improve air quality in our cities . Because an important concern with air quality is human health, we also discuss the associated tree influences on air temperature and ultraviolet radiation, which also have implications for human health .
Trees and Parks in our Cities
Highlights
• On average, parks comprise about 6% of city land, but in addition, vacant and open-space lands, which may contain parklands, comprise another 24% of city area .
• Parks and open space land can comprise greater than 50% of a city area .
• Tree cover in parks varies locally and regionally .
• The structural value of U .S . urban park trees is on the order of $300 billion .
Trees in cities are a significant resource that varies across the nation . Tree canopies on average, when viewed from above, cover about 27% of urban areas in the United States or about 16 million acres of urban land (Figure 1) . The influence of trees varies by geography, with cities developed in forested areas averaging about 34% tree cover, trees in grassland areas averaging about 18%, and trees in desert regions averaging about 9% .1

7
Air Quality Effects of Urban Trees and Parks www.NRPA.org
NationalRecreationandParkAssociation ©2010AllRightsReserved
Figure 1. Percentage of tree cover in urban areas based on National Land Cover Data (NLCD) tree cover estimate2
Likewise, tree cover in parks tends to follow a similar pattern . While parks comprise only about 6% of a city’s area, tree cover in parks also tends to be higher in cities developed in forested areas (49% tree cover) than parks in grassland cities (27%) and desert cities (11%) . The amount of available space (i .e ., space not covered by impervious surfaces or water) filled with tree canopies in parks also tends to be higher in forested areas (52%) than in grassland (34%) and desert (13%) areas . The 6% estimate of parkland is likely conservative, as the park area and tree cover estimates were derived from photo-inter-pretation . Some parklands that could not be clearly identified as parks (e .g ., more natural parks) could be classified within the vacant land use category (24% of city area) (Figure 2) .
Figure 2. Mean proportion of city occupied by various land uses.3 “Other” land use Includes agriculture, orchards, transportation (e.g., freeways, airports, shipyards), and miscellaneous. Vacant includes lands with no apparent land use (e.g., undeveloped areas).

Air Quality Effects of Urban Trees and Parks www.NRPA.org
NationalRecreationandParkAssociation ©2010AllRightsReserved
8
Figure 3. Mean percent tree cover for U.S. cities developed in different vegetation types by land use3
Figure 4. Mean percent of available space (land not covered with impervious cover or water) covered with tree canopies for U.S. cities in different vegetation types, by land use3
Overall, in the conterminous United States, there are an estimated 3 .8 billion trees in urban areas . Given the estimated parkland and park tree cover among regions, there are an estimated 370 million urban park trees in the conterminous United States .4 The proportion of total city tree populations within parks and/or open space varies from 7 .6% (parks only) to 59 .5% (parks and open space) in select cities (Table 1) . This park and open space land contributes significant amounts of ecosystem services (i .e ., benefits provided by natural ecosystem processes, for example, air pollution removal) from its trees and other

9
Air Quality Effects of Urban Trees and Parks www.NRPA.org
NationalRecreationandParkAssociation ©2010AllRightsReserved
vegetation, particularly in and around the parkland areas . The influence of parks extends beyond the parks into surrounding land uses . Thus park vegetation not only affects air quality in parks, but also can significantly affect the air quality of people who live near parks .
Table 1. Tree populations in parks and open space in select cities.
City # of Trees% of Total City Tree Population
Casper, WY (parks)5 13,900 11.3
Chicago, IL (parks)6 274,000 7.6
Chicago, IL (park/open space)6 1,039,000 29.0
New York, NY (open space)7 1,972,000 37.9
Philadelphia, PA (parks)8 183,000 8.7
San Francisco, CA (open space)9 207,000 30.9
Washington, DC (park/open space)10 1,147,000 59.5
Note: determining consistent park land categories from cities is difficult as some cities designate parks with an open space category, some within a park category, and some cities have both park and open space as land use categories.
Figure 5. Park trees (shown in darker red on this color-infrared image of Central Park, New York City) can significantly affect the surrounding environment and human population.

Air Quality Effects of Urban Trees and Parks www.NRPA.org
NationalRecreationandParkAssociation ©2010AllRightsReserved
10
Parks tend to have the highest percent tree cover of all land uses in cities (Figure 3 and Figure 4), with the exception of residential areas in desert regions . Thus, on an equal area basis, parklands have the greatest potential to provide numerous ecosystem services that are derived from trees and forests . How-ever, trees may not be the most appropriate vegetation structure for all parks . For example, sustaining tree cover in parks in desert regions will often require significant amounts of water, which tends to be a limited resource in these areas . In water limited areas, more natural vegetation structure in parks may be most appropriate to sustain vegetation cover and associated influences on air quality . However, primary-treated wastewater may be used for irrigation of park vegetation in some dry climates .
The trees and other vegetation in urban areas and parks have structural value based on the physical resource itself (e .g ., the cost of replacing the vegetation or estimated compensation value for trees that cannot be replaced) . The estimated 3 .8 billion urban trees in the lower United States have an estimated structural value of $2 .4 trillion .11 Average structural value per acre of tree cover is approximately $120,000 (Figure 6) . Given the estimated parkland and park tree cover among regions, the structural value of U .S . urban park trees is on the order of $300 billion .12 This value equates to an average value per park tree of about $800 . However, the structural value of individual park trees can range from very low values for dead, unhealthy, or small trees to tens of thousands of dollars for large healthy trees in prominent landscape positions . In addition to the structural value of the trees, the trees also produce annual functional values or benefits that are derived related to air quality . The following text will discuss these annual benefits related to air quality, but it is important to note that vegetation in urban areas also has significant structural values, with larger healthier trees typically being of greater value on a per tree basis .
Figure 6. Average structural value per acre of tree cover in select cities11
The key to understanding these ecosystem services and values from trees and parks is to understand the structure (e .g ., species composition, number of trees, vegetation sizes, distribution, and health) of the city or parklands, because structure directly determines that magnitude of many ecosystem services . For example, greater tree cover will likely lead to greater improved air quality, or different species configura-tions may lead to greater air temperature reductions . Park managers can directly influence parks structure (e .g ., through tree planting, maintenance, and removals) and can therefore affect the benefits or ecosystem services derived from parks . These ecosystem services or benefits extend beyond air quality issues and include other benefits such as aesthetics, wildlife habitat, recreation, and improvements in water quality and human health .

11
Air Quality Effects of Urban Trees and Parks www.NRPA.org
NationalRecreationandParkAssociation ©2010AllRightsReserved
One of the first steps in developing management plans to improve parks is to assess the current structure of the park and its various ecosystem services . A free suite of tools known as i-Tree (www .itreetools .org) can help in this endeavor and has been used in many cities to assess the overall tree population and benefits based on sampling the city tree population (e .g ., Casper, Chicago, Los Angeles, New York, Toronto, and Washington, D .C .) .
Figure 7. Park trees can serve as “lungs of the city” to improve air quality as well as provide numerous other benefits.
Several of the key ecosystem services derived from parks are related to air quality . In the 1800’s, parks were referred to as the “lungs” of a city in reference to their ability to refresh the atmosphere (Figure 7) . The Royal Parks of London were referred to as the “lungs of London” by several people in the early 1800s, and later Central Park in New York City was referred to as the “lungs of the city” by Fredrick Law Olmsted .13 These early park advocates intuitively understood the role of parks in improving air quality . In more recent times, science has confirmed the substantial role that trees and parks play in improving air quality and the lives and health of urban populations .
Air Quality Effects of Urban Trees and Parks www.NRPA.org
NationalRecreationandParkAssociation ©2010AllRightsReserved
12
Trees, Parks and Air Temperature
Highlights
• Cities are generally warmer than surrounding agricultural or forest areas . The relative warmth is often referred to as the urban heat island (UHI) effect . UHIs have been documented in cities throughout the world .
• Parks with a large portion of their area in vegetation, especially trees, will reduce the UHI in the park as well as the area surrounding the park, sometimes for a distance as great as the diameter of the park .
• A measure of park effects on air temperature is the maximum difference in temperature between the coolest point in the park and areas surrounding the park . Measurements have shown such differences can be about 13°F (7°C) .
• Park effects on air temperature moderate air pollution, save energy by cooling buildings, reduce ozone production, affect human comfort and health, and in heat-wave conditions may save lives .
Heat waves in cities can kill hundreds and sometimes thousands of people . For example, more than 700 deaths in Chicago were attributed to a heat wave in July 1995 .14 More than 30,000 excess deaths were related to the heat waves in Western Europe during the summer of 2003 .15 Having parks with veg-etation and water features can produce cooler air temperatures and potentially help protect the lives of susceptible populations .
The physical processes that cause the UHI effect are related to the processes that cause most urban parks to be cooler than the developed parts of a city, and parks may significantly modify a city’s UHI . Therefore we describe UHI effects before considering the park effects, which are usually at a smaller scale .
Urban Heat Islands
Cities are essentially islands of warmer temperatures in a sea of rural cooler temperatures (Figure 8 and Figure 9) . The UHI effect is strongest after sundown when skies are free of clouds and wind speeds are low .
The magnitude of the urban-rural temperature difference and the timing of the maximum UHI depend on differences in rates of heating and cooling of the materials and soils in the urban and in the adjacent rural area that is used for the temperature comparison .16, 17 In moist, temperate climates, the UHI effect causes cities to be slightly warmer in midday than rural areas . In dry climates, irrigation of vegetation in cities may cause slight midday cooling in comparison to rural areas—an urban oasis effect .17
In most climates, including in dry regions, maximum UHIs occur within a few hours after sunset on days with clear skies and calm winds; but the timing depends on the type of rural reference, for example whether the rural area is in short-crop agriculture or forest . Maximum UHI intensities increase with city size and may commonly reach 18°F (10°C) for the largest cities .18

13
Air Quality Effects of Urban Trees and Parks www.NRPA.org
NationalRecreationandParkAssociation ©2010AllRightsReserved
Figure 8. A frequently used representation of an urban heat island, suggesting the gener-ally warmer temperatures in a city compared to the surrounding rural area, with variations in temperature in different land uses of the city, including a park. Typically, maximum heat island temperatures would be larger than depicted here, and would occur after sunset. (Original by Joe Huang appeared in a U.S. Environmental Protection Agency guidebook to heat island remediation.19)
Although cities are generally warmer than surrounding rural areas, the patterns of air temperature across a city differ according to land use . Areas with high tree cover are usually cooler than areas with large percentages of built structures and impervious cover . Thus parks, which usually have low percentag-es of impervious cover and higher amounts of vegetation cover, tend to be cooler than nearby areas with high building density, resulting in a park cool island (PCI) .20
Figure 9. Hypothetical concept of the features of an urban heat island at about the 5-foot (1.5-meter) height for a large city near the time of maximum heat island formation, usually several hours after sunset on a clear night with calm winds.21 Here the tem-peratures are in centigrade, and the maximum UHI is about 8°C or 14.4°F. A park area is depicted as being about 3°F cooler than the surrounding city.

Air Quality Effects of Urban Trees and Parks www.NRPA.org
NationalRecreationandParkAssociation ©2010AllRightsReserved
14
Baltimore Parks Case Study—Reducing Local Air Temperatures
Reports of park influences on air temperature vary depending on actual park effects, but also on methods of data collection, whether measurements were continuous or just samples over short time periods, whether temperature comparisons are for points or for area averages over the park . Furthermore, the reference temperature outside the park may be from park surroundings, the city center, or from the warmest point in the city . In this case study we present an example of park influences on temperature by methods that included computation of average temperatures over park and city areas .
A study of air temperature across the city of Baltimore, Maryland, produced maps of air temperature differences (ΔT) across the region . The ΔT was the difference in temperature between any point on the map and the warmest point on the map (Figure 10) . Invariably, the warmest point was near the center of the city . The maximum ΔT was about -18°F (-10°C) with the temperature difference related to land use (particularly tree and impervious cover) .22 Parks were generally cooler than areas surrounding the parks .
Baltimore temperatures, including those in parks, are influenced by elevation . Parks at the higher elevations in the northern part of the city were about 2°F (1°C) cooler than parks at the lower elevations . Generally, more impervious surfaces tend to increase air temperatures, and more tree cover tends to cool air temperatures . The ΔT temperature difference depends in part on the time of day and general weather conditions; usually ΔT is larger at night and when wind is calm and skies are clear .
Figure 10. Predicted pattern of air temperature differences (ΔT) across the Baltimore, Maryland, region at a time of large urban heat island influence, June 20, 9 p.m.22 The warmest locations (red) are in the more densely developed areas; compare this figure to land use in Figure 11. Temperatures are also influenced by elevation, with cooler temperatures in the higher elevations. Note that parks in this figure are generally cooler than their surrounding areas. Values of ΔT are given as temperature at a point minus temperature of the warmest point on the map. Therefore, points with more negative temperature differences are cooler.

15
Air Quality Effects of Urban Trees and Parks www.NRPA.org
NationalRecreationandParkAssociation ©2010AllRightsReserved
Figure 11. Land use in the region of Baltimore, Maryland, according to the 2001 NLCD.23 Most parks are shown as light pink for the “Developed, Open Space” category. Note the close correlation between land use and predicted temperature differences in the previous figure.
A closer look at individual parks in Baltimore shows that park temperatures are strongly influenced by vegetation within the park as well as by surrounding land cover, but parks also influence temperatures of surrounding areas . Averaged over the whole park area, the largest park, Patapsco Valley State Park, had the coolest air temperatures of any of the parks in the analysis . Patapsco Valley Park, which is heavily forested with 68% tree cover, was 13°F (7 .1°C) cooler in the evening and about 5°F (2 .7°C) cooler in daytime relative to the warm inner city (Table 2) . The park’s very low impervious cover and relatively high elevation also led to cooler temperatures .
The finding of relatively larger reductions of temperatures in parks at night compared to daytime is consistent with most other studies of park temperatures,24 but not all . Measurements for a large park in Nagoya, Japan, showed reductions in park air temperature that were larger in the day than after sunset .25
However, in Nagoya, the park temperature was measured in a small dense forest stand within the park, but close to its edge . Nighttime temperatures in the park were probably cooler near the center of the park, especially because there was a large open area there, which would have led to more rapid cooling by outgoing longwave (thermal) radiation than under the forest canopy .
Air Quality Effects of Urban Trees and Parks www.NRPA.org
NationalRecreationandParkAssociation ©2010AllRightsReserved
16
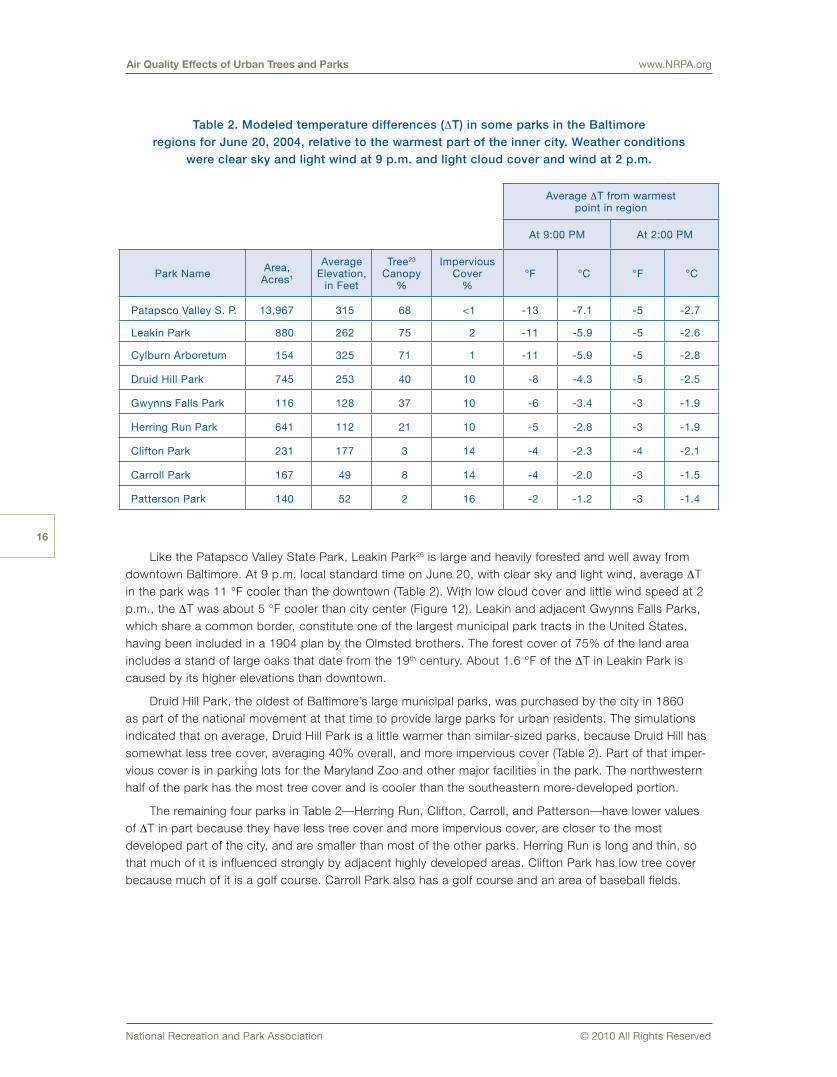
Table 2. Modeled temperature differences (ΔT) in some parks in the Baltimore regions for June 20, 2004, relative to the warmest part of the inner city. Weather conditions
were clear sky and light wind at 9 p.m. and light cloud cover and wind at 2 p.m.
AverageΔTfromwarmestpointinregion
At9:00PM At2:00PM
ParkName Area,Acres1
AverageElevation,
inFeet
Tree23
Canopy%
ImperviousCover
%°F °C °F °C
Patapsco Valley S. P. 13,967 315 68 <1 -13 -7.1 -5 -2.7
Leakin Park 880 262 75 2 -11 -5.9 -5 -2.6
Cylburn Arboretum 154 325 71 1 -11 -5.9 -5 -2.8
Druid Hill Park 745 253 40 10 -8 -4.3 -5 -2.5
Gwynns Falls Park 116 128 37 10 -6 -3.4 -3 -1.9
Herring Run Park 641 112 21 10 -5 -2.8 -3 -1.9
Clifton Park 231 177 3 14 -4 -2.3 -4 -2.1
Carroll Park 167 49 8 14 -4 -2.0 -3 -1.5
Patterson Park 140 52 2 16 -2 -1.2 -3 -1.4
Like the Patapsco Valley State Park, Leakin Park26 is large and heavily forested and well away from downtown Baltimore . At 9 p .m . local standard time on June 20, with clear sky and light wind, average ΔT in the park was 11 °F cooler than the downtown (Table 2) . With low cloud cover and little wind speed at 2 p .m ., the ΔT was about 5 °F cooler than city center (Figure 12) . Leakin and adjacent Gwynns Falls Parks, which share a common border, constitute one of the largest municipal park tracts in the United States, having been included in a 1904 plan by the Olmsted brothers . The forest cover of 75% of the land area includes a stand of large oaks that date from the 19th century . About 1 .6 °F of the ΔT in Leakin Park is caused by its higher elevations than downtown .
Druid Hill Park, the oldest of Baltimore’s large municipal parks, was purchased by the city in 1860 as part of the national movement at that time to provide large parks for urban residents . The simulations indicated that on average, Druid Hill Park is a little warmer than similar-sized parks, because Druid Hill has somewhat less tree cover, averaging 40% overall, and more impervious cover (Table 2) . Part of that imper-vious cover is in parking lots for the Maryland Zoo and other major facilities in the park . The northwestern half of the park has the most tree cover and is cooler than the southeastern more-developed portion .
The remaining four parks in Table 2—Herring Run, Clifton, Carroll, and Patterson—have lower values of ΔT in part because they have less tree cover and more impervious cover, are closer to the most developed part of the city, and are smaller than most of the other parks . Herring Run is long and thin, so that much of it is influenced strongly by adjacent highly developed areas . Clifton Park has low tree cover because much of it is a golf course . Carroll Park also has a golf course and an area of baseball fields .

17
Air Quality Effects of Urban Trees and Parks www.NRPA.org
NationalRecreationandParkAssociation ©2010AllRightsReserved
Figure 12. Heavy forest cover in the Leakin and Gwynns Falls Park complex can lead, under maximum UHI conditions, to cooling of more than 11°F compared to the city center. (Photo from Google Earth street view)
The effects of Patterson Park are especially interesting because it is the closest park to downtown Baltimore and is surrounded by dense residential areas . At 9 p .m . the park had average temperatures only about 2°F (1 .2°C) cooler than the warmest city area (Figure 13), but the coolest temperatures in Patterson Park are near its center with cool temperatures extending beyond the park boundary . Thus, while tempera-tures in the park are influenced by the surrounding neighborhoods, the park also cools adjacent neighbor-hoods (Figure 14 and Figure 15) .
Figure 13. Differences in air temperature in and near Patterson Park at 9 p.m. on June 20 relative to the warmest point in the region (left). Also shown are tree canopy cover (center) and impervious cover (right). The park is surrounded by high impervious cover. Blue cross hatch is part of the Baltimore harbor. [Degrees C = (degrees F/1.8)].

Air Quality Effects of Urban Trees and Parks www.NRPA.org
NationalRecreationandParkAssociation ©2010AllRightsReserved
18
Figure 14. Residential area north of Baltimore’s Patterson Park (left), and the north edge of the park (right). (Photo from Google Earth street view)
Figure 15. Aerial view of part of Patterson Park in Baltimore and the high-density residential area to its north. Trees in this inner-city park are scattered, rather than forming a dense canopy as in the forests of Leakin and Gwynns Falls Park. (Photo from Bing Maps)
Contrasts between temperatures inside a park and in zones at different distances around a park give some indication of the degree to which a park may influence temperatures in adjacent areas . That is, if the park is providing cooling to adjacent areas, we expect the park to be cooler than immediately surround-ing zones, but that temperatures will increase as we go farther from the park . For parks in Baltimore, we estimated the limit of park influence to be approximately at the distance where air temperatures stabilized and no longer continued to increase with distance from the park (Table 3) .
19
Air Quality Effects of Urban Trees and Parks www.NRPA.org
NationalRecreationandParkAssociation ©2010AllRightsReserved
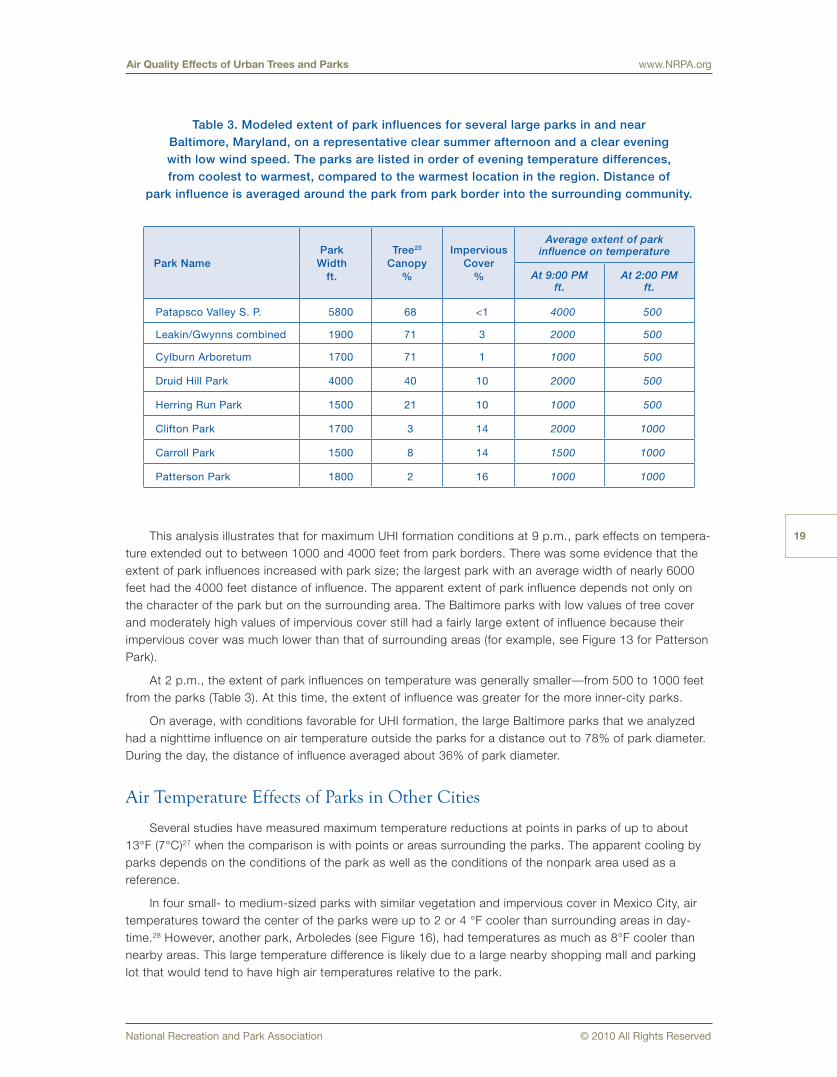
Table 3. Modeled extent of park influences for several large parks in and near Baltimore, Maryland, on a representative clear summer afternoon and a clear evening with low wind speed. The parks are listed in order of evening temperature differences, from coolest to warmest, compared to the warmest location in the region. Distance of
park influence is averaged around the park from park border into the surrounding community.
Park NamePark
Width ft.
Tree23
Canopy %
Impervious Cover
%
Average extent of park influence on temperature
At 9:00 PM ft.
At 2:00 PM ft.
Patapsco Valley S. P. 5800 68 <1 4000 500
Leakin/Gwynns combined 1900 71 3 2000 500
Cylburn Arboretum 1700 71 1 1000 500
Druid Hill Park 4000 40 10 2000 500
Herring Run Park 1500 21 10 1000 500
Clifton Park 1700 3 14 2000 1000
Carroll Park 1500 8 14 1500 1000
Patterson Park 1800 2 16 1000 1000
This analysis illustrates that for maximum UHI formation conditions at 9 p .m ., park effects on tempera-ture extended out to between 1000 and 4000 feet from park borders . There was some evidence that the extent of park influences increased with park size; the largest park with an average width of nearly 6000 feet had the 4000 feet distance of influence . The apparent extent of park influence depends not only on the character of the park but on the surrounding area . The Baltimore parks with low values of tree cover and moderately high values of impervious cover still had a fairly large extent of influence because their impervious cover was much lower than that of surrounding areas (for example, see Figure 13 for Patterson Park) .
At 2 p .m ., the extent of park influences on temperature was generally smaller—from 500 to 1000 feet from the parks (Table 3) . At this time, the extent of influence was greater for the more inner-city parks .
On average, with conditions favorable for UHI formation, the large Baltimore parks that we analyzed had a nighttime influence on air temperature outside the parks for a distance out to 78% of park diameter . During the day, the distance of influence averaged about 36% of park diameter .
Air Temperature Effects of Parks in Other Cities
Several studies have measured maximum temperature reductions at points in parks of up to about 13°F (7°C)27 when the comparison is with points or areas surrounding the parks . The apparent cooling by parks depends on the conditions of the park as well as the conditions of the nonpark area used as a reference .
In four small- to medium-sized parks with similar vegetation and impervious cover in Mexico City, air temperatures toward the center of the parks were up to 2 or 4 °F cooler than surrounding areas in day-time .28 However, another park, Arboledes (see Figure 16), had temperatures as much as 8°F cooler than nearby areas . This large temperature difference is likely due to a large nearby shopping mall and parking lot that would tend to have high air temperatures relative to the park .
Air Quality Effects of Urban Trees and Parks www.NRPA.org
NationalRecreationandParkAssociation ©2010AllRightsReserved
20
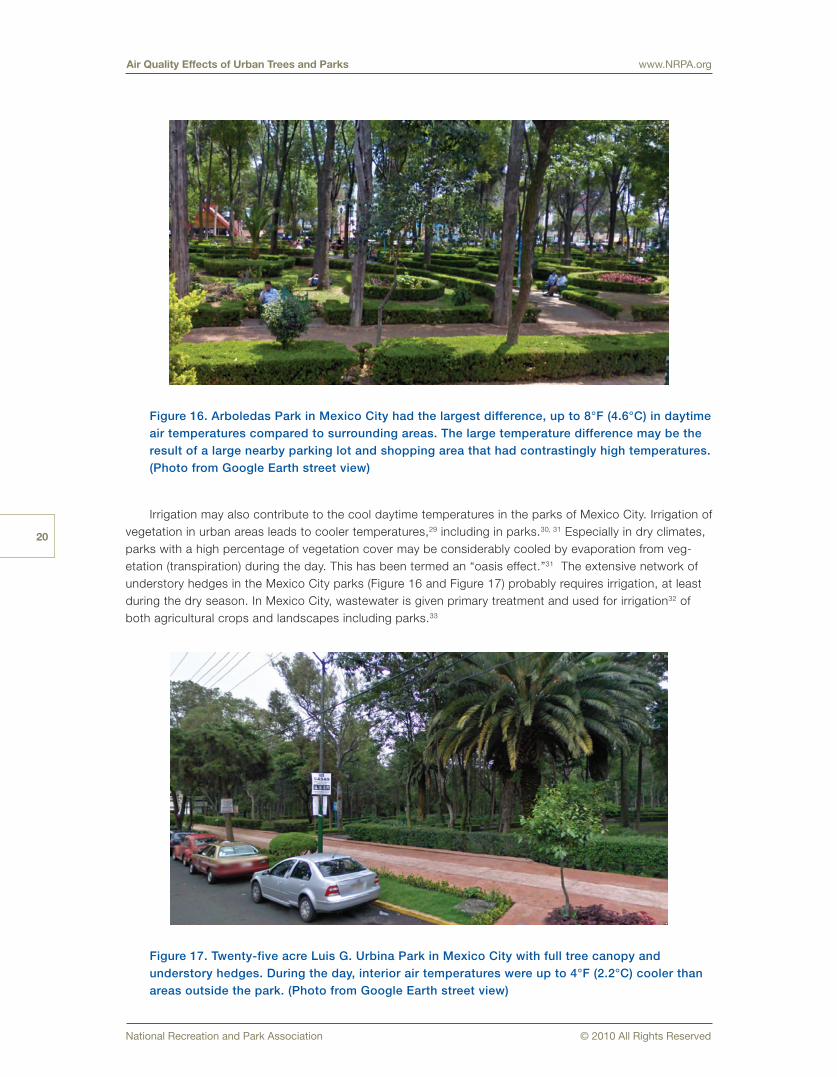
Figure 16. Arboledas Park in Mexico City had the largest difference, up to 8°F (4.6°C) in daytime air temperatures compared to surrounding areas. The large temperature difference may be the result of a large nearby parking lot and shopping area that had contrastingly high temperatures. (Photo from Google Earth street view)
Irrigation may also contribute to the cool daytime temperatures in the parks of Mexico City . Irrigation of vegetation in urban areas leads to cooler temperatures,29 including in parks .30, 31 Especially in dry climates, parks with a high percentage of vegetation cover may be considerably cooled by evaporation from veg-etation (transpiration) during the day . This has been termed an “oasis effect .”31 The extensive network of understory hedges in the Mexico City parks (Figure 16 and Figure 17) probably requires irrigation, at least during the dry season . In Mexico City, wastewater is given primary treatment and used for irrigation32 of both agricultural crops and landscapes including parks .33
Figure 17. Twenty-five acre Luis G. Urbina Park in Mexico City with full tree canopy and understory hedges. During the day, interior air temperatures were up to 4°F (2.2°C) cooler than areas outside the park. (Photo from Google Earth street view)

21
Air Quality Effects of Urban Trees and Parks www.NRPA.org
NationalRecreationandParkAssociation ©2010AllRightsReserved
Perhaps the largest park effect reported anywhere was the intriguing 20°F (11°C) from measurements in 195234 for the nighttime temperature difference between Golden Gate Park in San Francisco and the city center . The study authors did not explain the large difference other than to indicate their belief it was not caused by effects of cool ocean temperature . There seem to be no recent measurements to confirm the 20°F difference . Although such a large park effect may be questioned, several factors do suggest a larger than typical effect . The park is very large; it has 1017 acres and a rectangular shape about one-half mile wide by 2 miles long . One of the especially cool points in the 1952 measurements was near a large garden that probably was irrigated in April at the start of the spring planting season . Furthermore, the 20°F differ-ence was between the coolest point in the park and the warmest point in the city, whereas less dramatic park effects are reported for the difference between area-averaged temperatures in a park and locations in nearby areas outside the park that may have been somewhat cooler than the warmest city location .
Small parks with few trees and a high percentage of impervious cover may not be much cooler or may be warmer than surrounding areas . In Taipei,35 at noon in summer, parks with more than 50% of the surface paved and without much tree and shrub cover were on average warmer than their surroundings . Interpreting the findings requires consideration of study methods . The 61 parks that were sampled in Taipei ranged in size from 0 .01 hectares (0 .025 acres or about 1100 feet2) to a little more than 20 hectares (50 acres) . All parks that were warmer than surroundings were less than 2 hectares (5 acres) in size—much smaller than the Baltimore parks and smaller than most of the Mexico City parks .
Studies in a variety of cities suggest that the area of park influence on temperatures in surrounding areas extends to about the width of the park away from its borders . This seemed to be true in Chapultepec Park, a 500-hectare (1240-acre) park in Mexico City, where air temperatures were 4° to 5°F (2° to 3°C) cooler than the area surrounding the park on nights with conditions for high UHI effects . The park’s air temperature effects extended to a distance equal to the width of the park (2 km),36 similar to the effects we found for Baltimore parks .
Along with the effects of the amount of vegetation and impervious surface in parks on air temperature, tree species can also have an effect (see the Appendix for a list of tree species with high evaporation po-tential) . Large trees that evaporate large amounts of water can potentially cool air temperatures more than smaller trees with lower evaporation rates .
The air temperature reductions in areas surrounding parks can lead to savings in energy used for air conditioning . For example, near a park about of about 500 acres in a city near Tokyo, Japan, temperatures were estimated to be reduced by the park over an area of about 120 acres . The reduced temperatures led to savings of air conditioning electricity use estimated to be $650 (1998 U .S . dollars) per hour between 1 p .m . and 2 p .m .37
Recommendations
• Park effects on microclimate should be considered in park planning and management .
• Consider that tree influences on microclimate (modified air temperature, wind speed, humidity, shade) may be positive or negative, but most are beneficial for park users and nearby residents, especially for air temperature .
• Park designs that include a variety of land cover—areas of dense trees, scattered trees, and lawn—are likely to provide the greatest opportunities for optimum physical comfort of visitors .
• All the recommendations for the following section apply to considerations of air temperature as well .

Air Quality Effects of Urban Trees and Parks www.NRPA.org
NationalRecreationandParkAssociation ©2010AllRightsReserved
22
Trees, Parks and Air Pollution
Highlights
• Poor air quality affects 127 million people in the United States .
• Air pollution can significantly affect human and ecosystem health .
• Trees and parks affect air pollution by:
– Reducing air temperatures and consequently pollutant emissions
– Directly removing pollution from the air
– Emitting chemicals that contribute to pollution formation
• Pollution removal by U .S . urban park trees is on the order of 75,000 tons per year ($500 million/ year) .
Since 1990, air quality in the United States has improved for the six common air pollutants . Despite these improvements in air quality, approximately 127 million people live in areas that exceeded the national ambient air quality standards (NAAQS) in 2008 .38
Air pollution can significantly affect human and ecosystem health . Human health problems from air pollution include aggravation of respiratory and cardiovascular disease, decreased lung function, increased frequency and severity of respiratory symptoms (e .g ., difficulty breathing and coughing, increased sus-ceptibility to respiratory infections, effects on the nervous system (e .g ., impacts on learning, memory, and behavior), cancer, and premature death . People with pre-existing conditions (e .g ., heart disease, asthma, emphysema) and diabetes, and older adults and children are at greater risk for air pollution-related health effects .
Air pollution also affects the environment . Ozone and other pollutants can damage plants and trees and pollution can lead to acid rain . Acid rain can harm vegetation by damaging tree leaves and stressing trees through changing the chemical and physical composition of the soil . Particles in the atmosphere can also reduce visibility .
Tree Effects on Air Pollution
There are three main ways that trees in urban parks affect local air pollution levels .
1) Effects of trees on local microclimate
Trees evaporate significant amounts of water through their leaves (transpiration), which can significant-ly reduce local air temperatures (as discussed previously) . Lower air temperatures can lead to lower emis-sions of pollutants (Figure 18), as pollutant emissions are often related to air temperatures (e .g ., evapora-tion of volatile organic compounds, or VOCs) .
In addition, reduced air temperatures in and around parks can reduce the amount of energy used to cool buildings in the summertime because people do not need to run their air conditioners as much when air temperatures are cooler . This reduced energy use consequently leads to reduced pollutant emis-sions from power plants that produce the energy used to cool buildings . Some utilities (e .g ., Sacramento Municipal Utility District) fund millions of dollars for tree planting to reduce energy use .39 Reduced air temperatures by trees and parks can not only lead to reduced emission of air pollutants from numerous sources (e .g . cars, power plants), it can also lead to reduced formation of ozone as ozone formation tends to increase with increasing air temperatures .

23
Air Quality Effects of Urban Trees and Parks www.NRPA.org
NationalRecreationandParkAssociation ©2010AllRightsReserved
In addition to temperature effects, trees affect wind speeds and mixing of pollutants in the atmosphere that affects local pollution concentrations . These changes in wind speeds can lead to both positive and negative effects related to air pollution .
Figure 18. Park trees can reduce local air temperatures, which can consequently reduce pollutant emissions from various sources in cities.
2) Removal of air pollutants
Trees remove gaseous air pollution primarily by uptake through the leaves, though some gases are removed by the plant surface . Trees also remove pollution by intercepting airborne particles . Many of the particles that are intercepted are eventually resuspended back to the atmosphere, washed off by rain, or dropped to the ground with leaf and twig fall .
Healthy trees in cities can remove significant amounts of air pollution . The amount of pollution re-moved is directly related to the amount or air pollution in the atmosphere . (If there is no air pollution, the trees will remove no air pollution .) Areas with a high proportion of tree cover (e .g ., parks) will remove more pollution and have the potential for greater reduction in air pollution concentrations in and around these areas .
Pollution removal by trees in cities can range up to 11,100 tons per year with societal values ranging up $89 million per year (Jacksonville, Florida) .41 The values of pollution removal are based on economists’ estimates of “externality values,” which are used to place an economic value to the negative side effects of air pollution on society . Parks, being smaller in extent than entire cities, would have lower total removal rates and values, but could have greater removal effects per acre than the city average due to their rela-tively high tree cover .
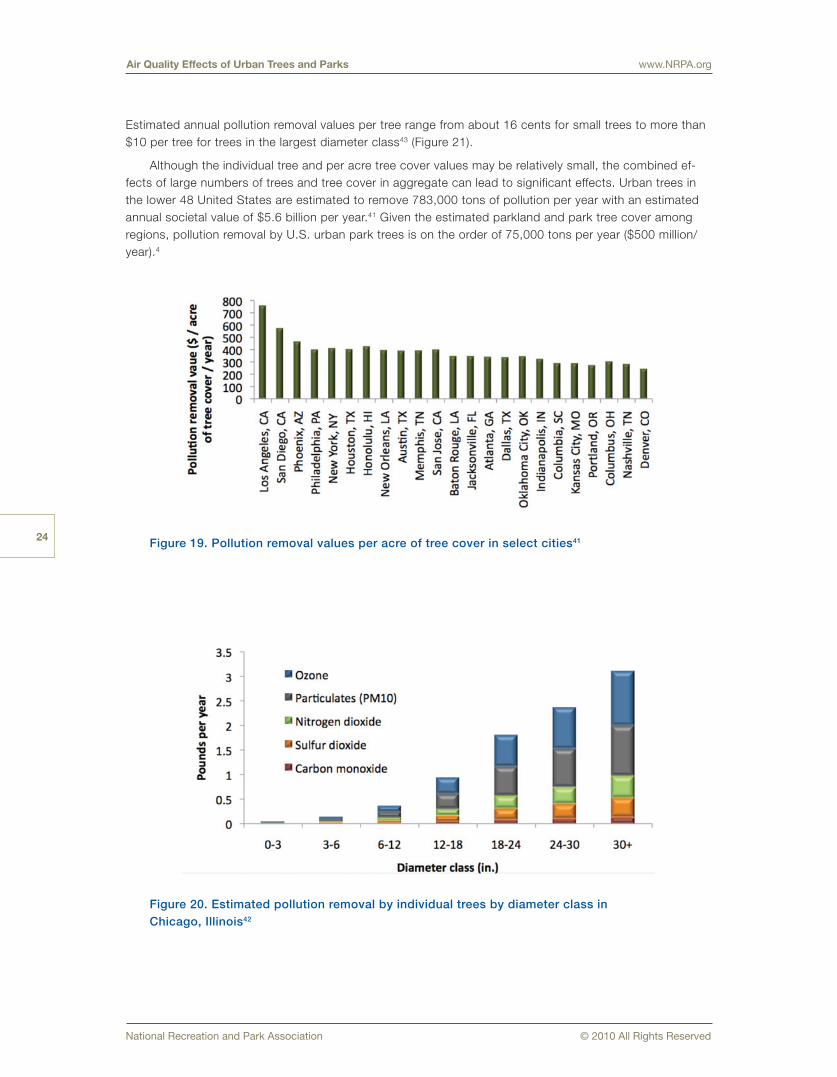
One acre of tree cover in a park will likely have pollution removal totals around 80 pounds per year, but the total could exceed 200 pounds per year in more polluted areas with long growing seasons (e .g ., Los Angeles) .40 The average value of pollution removal per acre of tree cover is about $300 per year41 (Figure 19) . These per acre pollution removal rates differ among cities according to the amount of air pollution, length of in-leaf season, precipitation, and other meteorological variables . Large healthy trees greater than 30 inches in stem diameter remove approximately 60 to 70 times more air pollution annually (3 .1 pounds/year) than small healthy trees less than 3 inches in diameter (0 .05 pounds/year) .42 (See Figure 20 .)
Air Quality Effects of Urban Trees and Parks www.NRPA.org
NationalRecreationandParkAssociation ©2010AllRightsReserved
24
Estimated annual pollution removal values per tree range from about 16 cents for small trees to more than $10 per tree for trees in the largest diameter class43 (Figure 21) .
Although the individual tree and per acre tree cover values may be relatively small, the combined ef-fects of large numbers of trees and tree cover in aggregate can lead to significant effects . Urban trees in the lower 48 United States are estimated to remove 783,000 tons of pollution per year with an estimated annual societal value of $5 .6 billion per year .41 Given the estimated parkland and park tree cover among regions, pollution removal by U .S . urban park trees is on the order of 75,000 tons per year ($500 million/year) .4
Figure 19. Pollution removal values per acre of tree cover in select cities41
Figure 20. Estimated pollution removal by individual trees by diameter class in Chicago, Illinois42

25
Air Quality Effects of Urban Trees and Parks www.NRPA.org
NationalRecreationandParkAssociation ©2010AllRightsReserved
Figure 21. Estimated pollution removal value by individual trees by diameter class in Chicago, Illinois43
Though the amount of air pollution removal by trees may be significant, the percentage of air qual-ity improvement in an area will depend upon on the amount of vegetation and meteorological conditions . Air quality improvement by trees in cities during daytime of the in-leaf season averages around 0 .51% for particulate matter, 0 .45% for ozone, 0 .44% for sulfur dioxide, 0 .33% for nitrogen dioxide, and 0 .002% for carbon monoxide . However, in park areas with 100% tree cover (i .e ., contiguous forest stands), air pollu-tion improvements average around 4 times greater than city averages with short-term improvements in air quality (one hour) as high as 16% for ozone and sulfur dioxide, 13% for particulate matter, 8% for nitrogen dioxide, and 0 .05% for carbon monoxide .
3) Emission of chemicals
While trees can reduce air pollution by changing the local microclimate and directly removing pollution, trees can also emit various chemicals that can contribute to air pollution . In addition, the maintenance of tree and other vegetation can emit pollutants . Because urban and park trees often require relatively large inputs of energy, primarily in the form of fossil fuels used to maintain trees and other vegetation, the emis-sions from these maintenance activities need to be considered in determining the ultimate net effect of the trees on air pollution .
One type of chemical that plants emit is volatile organic compounds . Emissions of volatile organic com-pounds by trees and other sources can also contribute to the formation of ozone . VOC emission rates vary by species . Because VOC emissions are temperature dependent and trees generally lower air temperatures, increased tree cover can lower overall VOC emissions and, consequently, ozone levels in urban areas .

Air Quality Effects of Urban Trees and Parks www.NRPA.org
NationalRecreationandParkAssociation ©2010AllRightsReserved
26
Overall Effect of Vegetation on Air Pollution
There are many factors that determine the ultimate effect of trees and parks on pollution . Many plant and park effects are positive in terms of reducing pollution concentrations . For example, trees can reduce temperatures and thereby reduce emissions from various sources, and they can directly remove pollution from the air . However the altering of wind patterns and speeds can affect pollution concentration in both positive and negative ways . Also, plant compound emissions and emissions from vegetation maintenance can contribute to air pollution . Various studies on ozone, a chemical that is not directly emitted, rather formed through chemical reactions, have helped to illustrate that the cumulative and interactive effects of trees is generally a reduction in air pollution concentrations .44, 45, 46, 47, 48
Health Effects
There are numerous studies that link air pollution to human health effects . With relation to trees, most studies have investigated the magnitude of the effect of trees on pollution removal or concentrations, while only a limited number of studies have looked at the estimated health effects of pollution removal by trees . In the United Kingdom, woodlands are estimated to save between five and seven deaths and between four and six hospital admissions per year due to reduced pollution of sulfur dioxide and particulate matter (PM10) .49 Modeling for London estimates that 25% tree cover removes 90 .4 metric tons of PM10 pollution per year, which equates to a reduction of two deaths and two hospital stays per year .50 Trees in U .S . cities remove about 215,000 tons of PM10 per year,40 but because U .S . cities have different population densities than London, effects on human health will differ .
Importance of Parks to Clean Air
In September 2004, the U .S . Environmental Protection Agency (EPA) released a guidance document titled “Incorporating Emerging and Voluntary Measures in a State Implementation Plan (SIP) .”51 This EPA guidance details how new measures, which may include “strategic tree planting,” can be incorporated in SIPs as a means to help meet air quality standards set by the EPA . As many of the standard strategies to meet clean air standards may not be sufficient to reach attainment, new and emerging strategies (e .g ., tree planting, increasing surface reflectivity) may provide a means to help an area reach compliance with the new clean air standard for ozone . “In light of the increasing incremental cost associated with stationary source emission reductions and the difficulty of identifying additional stationary sources of emission reduc-tion,” the document says, “EPA believes that it needs to encourage innovative approaches to generating emissions reductions .”51 As many urban areas are designated as nonattainment areas for the ozone clean air standard and are required to reach attainment, trees in cities and parks may play an important role in reaching clean air standards and can be integrated within SIPs .52
Recommendations53
• Increase the number of healthy trees (increases pollution removal) .
• Sustain existing tree cover (maintains pollution removal levels) .
• Maximize use of low VOC emitting trees (reduces ozone and carbon monoxide formation) .
• Sustain large, healthy trees (large trees have the greatest per tree effects) .
• Use long-lived trees (reduces long-term pollutant emissions from planting and removal) .
• Use low maintenance trees (reduces pollutant emissions from maintenance activities) .
• Reduce fossil fuel use in maintaining vegetation (reduces pollutant emissions) .
• Plant trees in energy conserving locations (reduces pollutant emissions from power plants) .
• Plant trees to shade parked cars (reduces vehicular VOC emissions) .

27
Air Quality Effects of Urban Trees and Parks www.NRPA.org
NationalRecreationandParkAssociation ©2010AllRightsReserved
• Supply ample water to vegetation (enhances pollution removal and temperature reduction) .
• Avoid pollutant sensitive species in heavily polluted areas (increases tree health) .
• Utilize evergreen trees for particulate matter reduction (year-round removal of particles) .
In terms of vegetation designs for parks, some of the best designs are likely related to developing forest stands (where environmentally appropriate—for example, not in desert areas where water is scarce) . Visitors to forest stands in parks will likely receive reduced air pollution concentrations while in the stand than exterior to the stand of trees . The farther into the stand the park visitor would go, the more likely and potentially greater the reduction in air pollution .54 However, this is a generalization based on contiguous tree cover . As the tree cover becomes more disaggregated, pollution mixing within the stand from outside sources can lead to variable pollutant concentrations . Also, if vehicles are allowed to drive within the forest stand, concentrations from auto emissions may remain relatively high under the tree canopy as the disper-sion of the emissions is reduced .
In general, in terms of vegetation designs for trees, the more tree cover the better, as the trees can reduce air temperatures and directly remove pollution . Tree cover that is aggregated together in forest stands can reduce pollutant concentrations toward the center of the stands . However, species composition can also affect pollution effects . For example, pollen allergenicity varies by species,55 and species composition in parks can affect local pollen allergies . Recommended tree species for air quality improvement can be found in the Appendix .
Trees, Parks and Ultraviolet Radiation
Highlights
• Of the wavelengths of radiation from the sun that reach the surface of Earth, ultraviolet radiation (UV) has unique properties because of its very short wavelength .
• Medical authorities are divided on recommendations for human exposure to UV radiation, but they agree that exposure to the extent of receiving sun-burned skin should be avoided .
• Tree shade can reduce exposure of people to ultraviolet radiation .
Ultraviolet radiation is shortwave radiation from the sun that can have human health effects . Human diseases that are linked to UV radiation include several kinds of skin cancer that are often lethal (including melanoma), several eye diseases, and damage to the immune system . In addition, UV radiation is responsible for sunburn and for skin aging and wrinkling . Sunburn itself is a health issue, but more importantly, some cancers are believed to be related to episodes of sunburn . Exposure to UV radiation is also blamed for causing or contributing to cataracts of the eye, which creates the need for correction by eye operations .
There are also benefits to ultraviolet radiation exposure, including the production and regulation of vitamin D, which is claimed to reduce risk for many noncutaneous cancers .56
Estimating the monetary benefits of tree shade by reduced UV radiation to people is hardly feasible, but some idea comes from the fact that in 2004, the total direct cost associated with the treatment for nonmelanoma skin cancer was $1 .5 billion .57 Also, consider that cataract surgery is the most common surgery performed in the United States .

Air Quality Effects of Urban Trees and Parks www.NRPA.org
NationalRecreationandParkAssociation ©2010AllRightsReserved
28
Figure 22. Broadleaf trees that block most of the sky from view are very effective in reducing UVB exposure of people below their canopies, because UVB radiation does not penetrate leaves. In this image of a leaf cross section, the penetration of UVB and UVA radiation, the shortest wavelengths that we get on Earth from the sun are compared to average penetration of blue and red light, which goes deep into leaves, a portion going entirely through.58 (The abbreviation “nm” stands for nanometer, one-billionth of a meter. A µm is one millionth of a meter.)
Trees can reduce exposure to UV radiation for park visitors . Tree leaves can absorb around 95% of ultraviolet radiation (Figure 22), though using tree shade as protection from UV is not intuitively obvious . Under most conditions, 50% or more of the UV radiation reaching the lower atmosphere is not directly from sunbeams, rather from other parts of the sky due to scattering in the atmosphere . In the shade of a single tree, visible light may be reduced by 85% or 90% where UV radiation is reduced only about 60% due to the scattering of radiation from parts of the sky not obscured by the tree .
For people standing where tree crowns block the view of most of the sky, there is little UV radiation exposure . Where small canopy gaps allow sun rays to break through the canopy, protection from UV radiation is still substantial because most of the sky view will be blocked .
In recent years some health professionals have contended that some exposure to UV radiation is good if it is below the level that causes sunburn, because UV on the skin is required for production of vitamin D . Some believe that acquiring vitamin D naturally is more beneficial than taking vitamin D supplements . Although tree shade reduces exposure to UV radiation, in most park tree-shade settings, UV radiation sufficient for vitamin D production will be available even in the tree shade . Because the pleasures of park experiences encourage people to spend more time outdoors, especially in comfortable tree shaded loca-tions, the net effect of park trees on UV exposure is probably positive for many individuals, because they will have sufficient time in the sun to acquire vitamin D without becoming sunburned .59
Although configurations of trees are important in reducing exposure to UV radiation from both sun and sky, tree species can have an impact because amount of shade from trees can vary based on tree size and crown density (Appendix) .
Recommendations

29
Air Quality Effects of Urban Trees and Parks www.NRPA.org
NationalRecreationandParkAssociation ©2010AllRightsReserved
Where feasible, provide park recreation areas with large trees to give visitors the option of being in shade .
Consider posting, in prominent locations for park visitors, up-to-date recommendations from health authorities on avoiding excessive exposure to UV radiation . Usually these recommendations include seeking shade around midday .
Trees, Parks and Climate Change
Highlights
• Park trees affect atmospheric carbon levels by:
– Removing carbon and storing it in their tissue
– Reducing air temperatures and associated carbon emissions for building energy use
– Emitting carbon through vegetation decomposition and maintenance activities
• One acre of park tree cover will likely store, on average, around 40 tons of carbon ($800) and remove about 1 .2 tons of carbon per year ($25/year) .
• Large trees greater than 30 inches in trunk diameter store approximately 800 to 900 times more carbon than small trees less than 3 inches in diameter .
• Park trees nationally store about 75 million tons of carbon ($1 .6 billion) .
• Park trees nationally annually remove about 2 .4 million tons of carbon ($50 million) .
• Park soils nationally store about 102 million tons of carbon ($2 .1 billion) .
Climate change refers to any significant change in measures of climate (e .g ., temperature, precipita-tion) that occurs over an extended period (e .g ., decades) . This change could be due to natural factors and/or from human activities . The IPCC report60 states, “Warming of the climate system is unequivocal, as is now evident from observations of increases in global average air and ocean temperatures, widespread melting of snow and ice, and rising average sea levels .”
Tree and Park Effects on Climate Change
Tree effects on climate change are similar to the types of effects of trees on air pollution . There are three main ways that urban forests can affect carbon dioxide levels: (1) by removing carbon dioxide; (2) by emitting carbon dioxide either directly from the vegetation (e .g ., decomposition) or indirectly through vegetation maintenance practices; and (3) by altering urban microclimates (e .g ., air temperature reductions) and building energy use and consequently emissions from power plants .53
Carbon Storage
Trees, through their growth process, remove carbon dioxide from the atmosphere and sequester the carbon within their biomass . However, when a tree dies and the wood is allowed to decompose or is burned, most of the stored carbon goes back to the atmosphere, though some of the carbon can be retained in the park soils . Through their growth process, trees can sequester significant amounts of carbon in their biomass .
Carbon storage by trees in cities can range up to over 1 .3 million tons of carbon with societal value of approximately $28 million (New York, New York) . (See Figure 23 and 24 .) Annual removal of carbon by trees in cities can reach more than 45,000 tons of carbon per year with a value of approximately $1 .0 million per year (Atlanta, Georgia) .62 Parks, being smaller in extent, would have lower storage and removal

Air Quality Effects of Urban Trees and Parks www.NRPA.org
NationalRecreationandParkAssociation ©2010AllRightsReserved
30
rates and values, but they could have greater removal effects per acre than the city average due to rela-tively high tree cover (Figure 25) . One acre of park tree cover will likely store, on average, around 40 tons of carbon and remove about 1 .2 tons of carbon per year . The average value of carbon storage per acre of tree cover is about $800 (Figure 24), with an average removal value of about $25 per year61 (Figure 26) .
Figure 23. Carbon storage per acre of tree cover in select cities61
Figure 24. Carbon storage value per acre of tree cover in select cities61

31
Air Quality Effects of Urban Trees and Parks www.NRPA.org
NationalRecreationandParkAssociation ©2010AllRightsReserved
Figure 25. Annual carbon removed per acre of tree cover in select cities61
Figure 26. Annual carbon removed value per acre of tree cover in select cities61
Large trees greater than 30 inches in trunk diameter store approximately 800 to 900 times more carbon than small trees less than 3 inches in diameter . Large healthy trees also remove about 50 times more carbon annually than small healthy trees . In Chicago, estimated carbon storage values per tree range from about 6 cents for small trees to more than $53 per tree for trees in the largest diameter class6
(Figure 27) .

Air Quality Effects of Urban Trees and Parks www.NRPA.org
NationalRecreationandParkAssociation ©2010AllRightsReserved
32
Figure 27. Average carbon stored per tree by diameter class in Chicago6
Figure 28. Average carbon removal per tree per year by diameter class in Chicago6
The combined effects of individual trees across a landscape can be significant in terms of carbon storage and annual removal . Urban trees in the lower 48 United States are estimated to store about 770 million tons of carbon ($16 billion) and remove about 25 million tons of carbon per year ($520 million) .61 Given the estimated park and tree cover among regions, carbon storage by U .S . park trees is estimated at around 75 million tons ($1 .6 billion), with an additional estimated annual carbon removal of around 2 .4 million tons ($50 million) .
Some species that offer the potential for relatively large amounts of carbon storage are given in Appendix 1 . Tree planting and carbon sequestration also offer the potential for carbon credits . Carbon credits provide ownership or “rental” rights to the sequestered carbon, and a company may buy, sell, or apply the credits to offset its own emissions .62 The Chicago Climate Exchange is the first operating market in the U .S . for greenhouse gas emissions trading .62
Parks with forestlike conditions can enhance carbon storage through time because net carbon can be accumulated in the soil along with the carbon retained in the trees . In forest ecosystems in the United States, 61% of the total carbon is stored in the soil environment .63 The amount of carbon in urban soils in parks in the United States is estimated at around 102 million tons or $2 .1 billion . Parks are estimated to have soil organic carbon densities of about 32 tons per acre ($650 per acre) .64
When forests are removed and/or soils disturbed, net carbon storage will diminish through time, as accumulated carbon in both trees and soil will convert back to carbon dioxide through decomposition . Various management practices can be used to help enhance the long-term impacts of forests on

33
Air Quality Effects of Urban Trees and Parks www.NRPA.org
NationalRecreationandParkAssociation ©2010AllRightsReserved
atmospheric carbon . Utilization of tree biomass into long-term products can delay carbon releases for long-periods . Keeping soils intact and using tree biomass in long-term products can delay carbon releases for long-periods .
Carbon Emissions
Urban forests lead to the emission of carbon dioxide through decomposition of stored carbon and through emissions due to urban tree maintenance (e .g ., from vehicles, chain saws, backhoes, etc .) . The amount of carbon stored by park trees can be lost back to the atmosphere when the trees die and decompose unless the wood from the tree is contained in some long-term storage capacity (e .g ., wood products) . Also, forest regeneration on the site can be used to maintain or enhance carbon storage levels, because regenerating trees can remove carbon to offset the carbon lost by decomposing trees . In addition, some carbon from dead trees will be retained in the soil .
Reduced Carbon Emissions Through Cooler Temperatures and Reduced Energy Use
As discussed previously, trees and parks can help mitigate heat island effects and reduce energy use and consequently carbon emissions from power plants .65 In addition, utilizing removed park trees for energy production can reduce carbon emissions from fossil fuel burning power plants .66 This cooling effect may be particularly important in the future, with projected warmer temperatures due to climate change occurring in an urban environment already warmer due to urban heat islands .
Recommendations
• Increase the number of healthy trees (increases carbon storage and annual removal) .
• Sustain existing tree cover (maintains carbon storage) .
• Sustain large, long-lived, healthy trees (provide greatest carbon benefits) .
• Use low-maintenance trees (reduces carbon emissions from maintenance activities) .
• Reduce fossil fuel use in maintaining vegetation (reduces carbon emissions) .
• Plant trees in energy conserving locations (reduces greenhouse gas emissions from power plants) .
• Utilize wood from removed trees for energy or in long-term products (reduces need for fossil-based energy, or reduces or delays carbon emissions) .
Case Study—Chicago ParksTo illustrate some of the values of parks’ related air quality effects of air pollution removal and carbon
storage, some values for the parks in Chicago, Illinois, are given based on a recent assessment of Chicago .6 For this assessment, 6,300 acres of parkland were assessed (out of the 7,700 acre total park system) . This assessment revealed that there are approximately 274,000 parks trees (7 .6% of the total city tree population) with an average tree density of 43 .2 trees/acre . Over 58 different tree species were identified in the sampling of the parks (Figure 29), with park trees covering 31 .6% of the park area . The trees contribute a total leaf surface area of approximately 12 .5 square miles with an estimated structural value of $192 million (Figure 30) . Additionally, these park trees:
• Store 52,700 tons of carbon ($1 .1 million)
• Remove 1,600 additional tons of carbon per year ($32,800/year)
• Remove 64 tons of air pollution per year ($344,000/year)

Air Quality Effects of Urban Trees and Parks www.NRPA.org
NationalRecreationandParkAssociation ©2010AllRightsReserved
34
Figure 29. Tree species distribution in sampled Chicago parks
Figure 30. Trees in Chicago parks have a structural value of over $190 million and contribute hundreds of thousands of dollars of values related to air quality annually.
35
Air Quality Effects of Urban Trees and Parks www.NRPA.org
NationalRecreationandParkAssociation ©2010AllRightsReserved
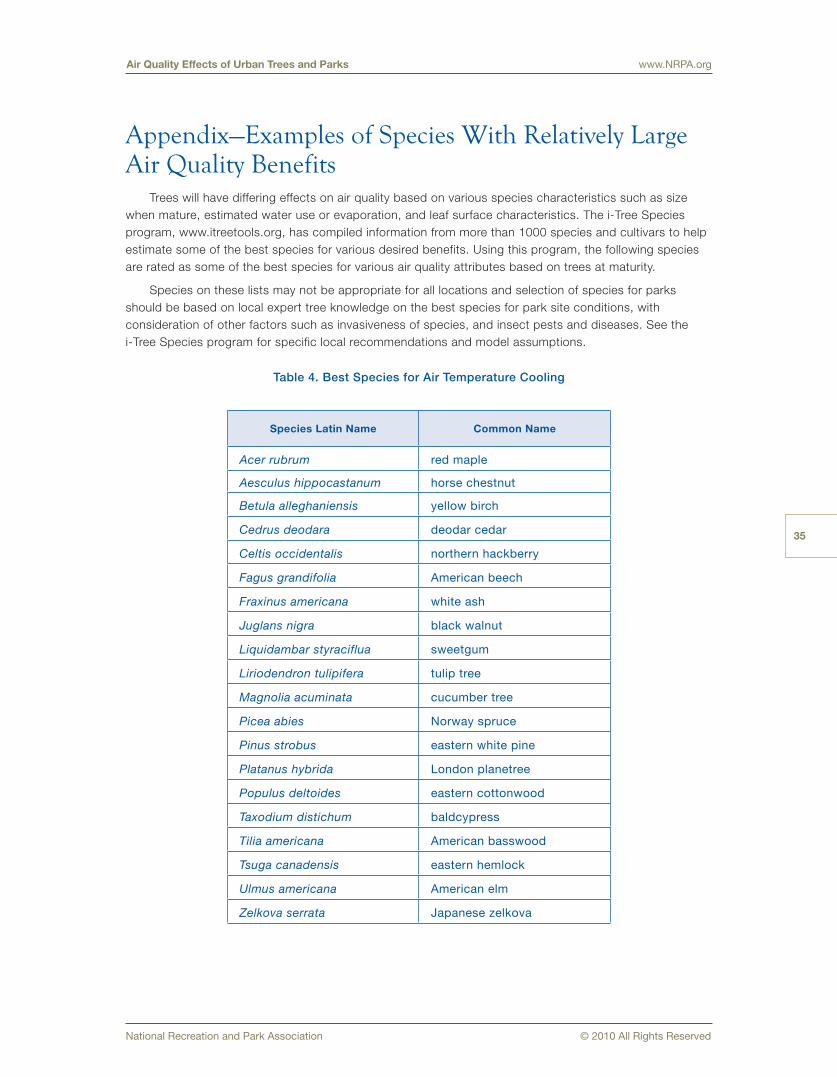
Appendix—Examples of Species With Relatively Large Air Quality Benefits
Trees will have differing effects on air quality based on various species characteristics such as size when mature, estimated water use or evaporation, and leaf surface characteristics . The i-Tree Species program, www .itreetools .org, has compiled information from more than 1000 species and cultivars to help estimate some of the best species for various desired benefits . Using this program, the following species are rated as some of the best species for various air quality attributes based on trees at maturity .
Species on these lists may not be appropriate for all locations and selection of species for parks should be based on local expert tree knowledge on the best species for park site conditions, with consideration of other factors such as invasiveness of species, and insect pests and diseases . See the i-Tree Species program for specific local recommendations and model assumptions .
Table 4. Best Species for Air Temperature Cooling
Species Latin Name Common Name
Acer rubrum red maple
Aesculus hippocastanum horse chestnut
Betula alleghaniensis yellow birch
Cedrus deodara deodar cedar
Celtis occidentalis northern hackberry
Fagus grandifolia American beech
Fraxinus americana white ash
Juglans nigra black walnut
Liquidambar styraciflua sweetgum
Liriodendron tulipifera tulip tree
Magnolia acuminata cucumber tree
Picea abies Norway spruce
Pinus strobus eastern white pine
Platanus hybrida London planetree
Populus deltoides eastern cottonwood
Taxodium distichum baldcypress
Tilia americana American basswood
Tsuga canadensis eastern hemlock
Ulmus americana American elm
Zelkova serrata Japanese zelkova
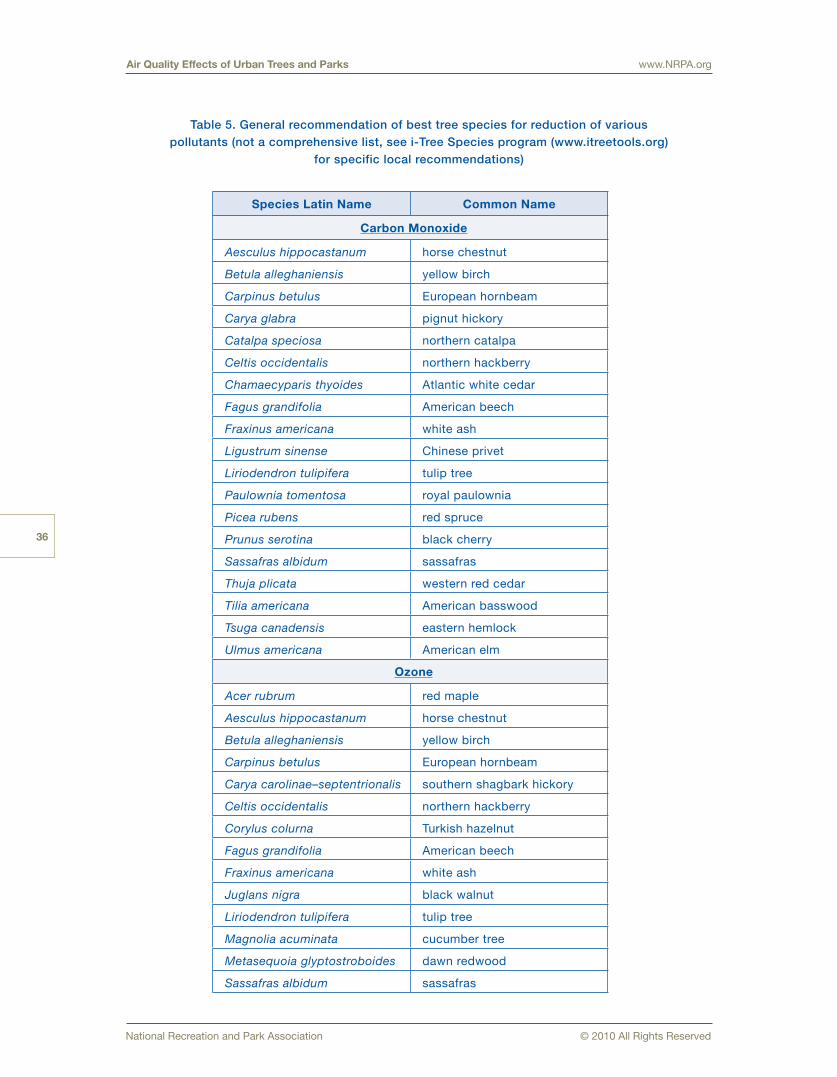
Air Quality Effects of Urban Trees and Parks www.NRPA.org
NationalRecreationandParkAssociation ©2010AllRightsReserved
36
Table 5. General recommendation of best tree species for reduction of various pollutants (not a comprehensive list, see i-Tree Species program (www.itreetools.org)
for specific local recommendations)
Species Latin Name Common Name
Carbon Monoxide
Aesculus hippocastanum horse chestnut
Betula alleghaniensis yellow birch
Carpinus betulus European hornbeam
Carya glabra pignut hickory
Catalpa speciosa northern catalpa
Celtis occidentalis northern hackberry
Chamaecyparis thyoides Atlantic white cedar
Fagus grandifolia American beech
Fraxinus americana white ash
Ligustrum sinense Chinese privet
Liriodendron tulipifera tulip tree
Paulownia tomentosa royal paulownia
Picea rubens red spruce
Prunus serotina black cherry
Sassafras albidum sassafras
Thuja plicata western red cedar
Tilia americana American basswood
Tsuga canadensis eastern hemlock
Ulmus americana American elm
Ozone
Acer rubrum red maple
Aesculus hippocastanum horse chestnut
Betula alleghaniensis yellow birch
Carpinus betulus European hornbeam
Carya carolinae–septentrionalis southern shagbark hickory
Celtis occidentalis northern hackberry
Corylus colurna Turkish hazelnut
Fagus grandifolia American beech
Fraxinus americana white ash
Juglans nigra black walnut
Liriodendron tulipifera tulip tree
Magnolia acuminata cucumber tree
Metasequoia glyptostroboides dawn redwood
Sassafras albidum sassafras

37
Air Quality Effects of Urban Trees and Parks www.NRPA.org
NationalRecreationandParkAssociation ©2010AllRightsReserved
Sequoia sempervirens coast redwood
Prunus serotina black cherry
Tilia americana American basswood
Tsuga canadensis eastern hemlock
Ulmus americana American elm
Zelkova serrata Japanese zelkova
Sulfur and Nitrogen Oxides
Acer rubrum red maple
Aesculus hippocastanum horse chestnut
Betula alleghaniensis yellow birch
Cedrus deodara deodar cedar
Celtis occidentalis northern hackberry
Fagus grandifolia American beech
Fraxinus americana white ash
Ginkgo biloba ginkgo
Gymnocladus dioicus Kentucky coffeetree
Juglans nigra black walnut
Liriodendron tulipifera tulip tree
Magnolia acuminata cucumber tree
Picea abies Norway spruce
Pinus strobus eastern white pine
Platanus hybrida London planetree
Populus deltoides eastern cottonwood
Tilia americana American basswood
Tsuga canadensis eastern hemlock
Ulmus americana American elm
Zelkova serrata Japanese zelkova
Particulate Matter, PM10
Abies concolor white fir
Calocedrus decurrens incense cedar
Cedrus deodara deodar cedar
Chamaecyparis thyoides Atlantic white cedar
Cryptomeria japonica Japanese red cedar
Cuppressus macrocarpa Monterey cypress
Magnolia grandiflora Southern magnolia
Picea abies Norway spruce
Picea pungens blue spruce
Picea rubens red spruce
Pinus ponderosa ponderosa pine

Air Quality Effects of Urban Trees and Parks www.NRPA.org
NationalRecreationandParkAssociation ©2010AllRightsReserved
38
Bibliography
Baes, C .F ., and Ragsdale, H .L . 1981 . Age-specific lead distribution in xylem rings of three tree genera in Atlanta, Georgia . Environmental Pollution (Series B) . 2:21-35 .
Baes, C .F ., and McLaughlin, S .B . 1984 . Trace elements in tree rings: evidence of recent and historical air pollution . Science . 224:494-497 .
Bidwell R .G .S ., and Fraser, D .E . 1972 . Carbon monoxide uptake and metabolism by leaves . Canadian Journal of Botany . 50:1435-1439 .
Black, V .J . 1985 . SO2 effects on stomatal behavior . In W .E . Winner, H . A . Mooney, and R .A . Goldstein (Eds .), Sulfur dioxide and vegetation . Stanford, CA: Stanford University Press: 96-117 .
Brasseur, G .P ., and Chatfield, R .B . 1991 . The fate of biogenic trace gases in the atmosphere . In T . D .Sharkey, E .A . Holland, and H .A . Mooney (Eds .), Trace gas emissions by plants . New York: Academic Press: 1-27 .
Colbeck, I ., and Harrison, R .M . 1985 . Dry deposition of ozone: some measurements of deposition velocity and of vertical profiles to 100 meters . Atmospheric Environment . 19(11):1807-1818 .
Crutzen, P .J ., Delany, A .C ., Greenberg, J . Haagenson, P ., Heidt, L . Lueb, R ., Pollock, W ., Seiler, W ., Wartburg, A ., and Zimmerman, P . 1985 . Tropospheric chemical composition measurements in Brazil during the dry season . J . Atmos . Chem . 2:233-256
Darley, E .F . 1971 . Vegetation damage from air pollution . In: E . S . Starkman (Ed .), Combustion-generated air pollution . New York: Plenum Press: 245-255 .
Dasch, J .M . 1987 . Measurement of dry deposition to surfaces in deciduous and pine canopies . Environmental Pollution . 44:261-277 .
Dasch, J .M . 1989 . Dry deposition of sulfur dioxide or nitric acid to oak, elm and pine leaves . Environmental Pollution . 59: 1-16 .
Davidson, C .I ., and Wu, Y .L . 1990 . Dry deposition of particles and vapors . In S . E .Lindberg, A .L . Page, and S .A . Norton (Eds .), Acid precipitation . Volume 3: sources, deposition, and canopy interactions . New York: Springer-Verlag: 103-216 .
Fowler, D ., and Cape, J .N . 1983 . Dry deposition of SO2 onto a Scots pine forest . In H .R . Pruppacher, R .G . Semonin, and W .G .N . Slinn (Eds .), Precipitation scavenging, dry deposition and resuspension . New York: Elsevier: 763-773 .
Garsed, S .G . 1985 . SO2 uptake and transport . In W .E .Winner, H .A . Mooney, and R .A .Goldstein (Eds .), Sulfur dioxide and vegetation . Stanford, CA: Stanford University Press: 75-95 .
Geron, C .D ., Guenther, A .B ., and Pierce, T .E . 1994 . An improved model for estimating emissions of volatile organic compounds from forests in the eastern United States . J . Geophys . Res . 99(D6):12,773-12,791 .
Pinus strobus eastern white pine
Pinus taeda loblolly pine
Sequoia sempervirens coast redwood
Taxus cuspidata Japanese yew
Thuja plicata western red cedar
Tilia americana American basswood
Tsuga canadensis eastern hemlock
Ulmus americana American elm
Zelkova serrata Japanese zelkova

39
Air Quality Effects of Urban Trees and Parks www.NRPA.org
NationalRecreationandParkAssociation ©2010AllRightsReserved
Graham, R .L ., Wright, L .L ., and Turhollow, A .F . 1992 . The potential for short-rotation woody crops to reduce U .S . CO2 emissions . Climatic Change . 22:223-238 .
Heisler, G .M . 1986 . Energy savings with trees . Journal of Arboriculture . 12(5):113-125 . http://www .nrs .fs .fed .us/pubs/jrnl/1986/nrs_1986_heisler_002 .pdf
Jacob, D .J ., and Wofsy, S .C . 1988 . Photochemistry of biogenic emissions over the Amazon forest . J . Geophys . Res . 93(D2):1477-1486 .
Kramer, P .J ., and Kozlowski, T .T . 1979 . Physiology of woody plants . New York: Academic Press . 811 p .
Murphy, C .E ., Sinclair, T .R ., and Knoerr, K .R . 1977 . An assessment of the use of forests as sinks for the removal of atmospheric sulfur dioxide . Journal of Environmental Quality . 6(4):388-396 .
National Acid Precipitation Assessment Program . 1991 . 1990 integrated assessment report . Washington, DC: National Acid Precipitation Assessment Program . 520 p .
Nowak, D .J . 1991 . Urban forest structure and the functions of hydrocarbon emissions and carbon storage . In: Proceed-ings of the fifth national urban forest conference; Los Angeles, CA . Washington, DC: American Forestry Association: 48-51 .
Nowak, D .J ., Crane, D .E ., Stevens, J .C ., and Ibarra, M . 2002 . Brooklyn’s Urban Forest . USDA Forest Service Gen . Tech . Rep . NE-290 . 107 p .
Office of Technology Assessment . 1989 . Catching our breath: next steps for reducing urban ozone . OTA-0-412 . Washington, DC: Office of Technology Assessment .
Oke, T .R . 1987 . Boundary Layer Climates . Methuen, London and New York .
Oke, T .R . 1989 . The micrometeorology of the urban forest . Philosophical Transactions of the Royal Society of London . Series B 324:335-349 .
Rennenberg, H . 1991 . The significance of higher plants in the emission of sulfur compounds from terrestrial ecosystems . In T .D . Sharkey, E .A . Holland, and H .A . Mooney (Eds .), Trace gas emissions by plants . New York: Academic Press: 217-260 .
Rolfe, G .L . 1974 . Lead distribution in tree rings . Forest Science . 20(3):283-286 .
Saxe, H . 1991 . Photosynthesis and stomatal responses to polluted air, and the use of physiological and biochemical responses for early detection and diagnostic tools . Adv . in Botan . Res . 18:1-128 .
Schjoerring, J .K . 1991 . Ammonia emission from the foliage of growing plants . In T .D . Sharkey, E .A . Holland, and H .A . Mooney (Eds .), Trace gas emissions by plants . New York: Academic Press: 267-292 .
Scott, K .I ., Simpson, J .R ., and McPherson, E .G . 1999 . Effects of tree cover on parking lot microclimate and vehicle emissions . J . Arboric . 25(3):129-142 .
Shafer, S .R ., and Heagle, A .S . 1989 . Growth responses of fieldgrown loblolly pine to chronic doses of ozone during multiple growing seasons . Canadian Journal of Forestry . 19:821-831 .
Sharkey, T .D ., Holland, E .A ., and Mooney, H .A . eds . 1991 . Trace gas emissions by plants . New York: Academic Press . 365 p .
Shieh, C .M ., Wesely, M .L ., and Hicks, B .B . 1979 . Estimated dry deposition velocities of sulfur over the eastern United States and surrounding regions . Atmospheric Environment . 13:1361-1368 .
Shiner, D .S ., Heck, W .W ., McLaughlin, S .B ., Johnson, D .W ., Irving, P .M ., Joslin, J .D ., and Peterson, C .E . 1990 . Response of vegetation to atmospheric deposition and air pollution . NAPAP SOS/T Report 18 . Washington, DC: National Acid Precipitation Assessment Program . 206 p .
Smith, W .H . 1984 . Pollutant uptake by plants . In M . Treshow (Ed .), Air pollution and plant life . New York: John Wiley and Sons: 417-450 .
Stoker, H .S ., and Seager, S .L . 1976 . Environmental chemistry: air and water pollution . Glenview, IL: Scott, Foresman and Company . 231 p .
Tingey, D .T ., Turner, D .P ., and Weber, J .A . 1991 . Factors controlling the emissions of monoterpenes and other volatile organic compounds . In T .D . Sharkey, E .A . Holland, and H .A . Mooney (Eds .), Trace gas emissions by plants . New York: Academic Press: 93-119 .

Air Quality Effects of Urban Trees and Parks www.NRPA.org
NationalRecreationandParkAssociation ©2010AllRightsReserved
40
U .S . Environmental Protection Agency . 1991 . Nonroad engine and vehicle emission study -- report . USEPA Office of Air and Radiation ANR-43 . EPA-21A-2001 . Washington, DC .
U .S . Environmental Protection Agency . 2009 . Reducing Urban Heat Islands: Compendium of Strategies . U .S . Environmental Protection Agency . Available by Internet http://www .epa .gov/hiri/resources/compendium .htm (verified July 8, 2010) .
Ziegler, I . 1973 . The effect of air-polluting gases on plant metabolism . In Environmental quality and safety . Volume 2 . New York: Academic Press: 182-208 .
Literature Cited1 Nowak, D .J ., Noble, M .H ., Sisinni, S .M ., and Dwyer, J .F . 2001 . Assessing the U .S . urban forest resource . J . For .
99(3):37-42 .
2 Nowak, D .J ., Stein, S .M ., Randler, P .B ., Greenfield, E .J ., Comas, S .J ., Carr, M .A ., and Alig, R .J . 2010 .
Sustaining America’s Urban Trees and Forests . USDA Forest Service, Northern Resource Bulletin NRS-62 .
Newtown Square, PA . 27 p .
3 Nowak, D .J ., Rowntree, R .A ., McPherson, E .G ., Sisinni, S .M ., Kerkmann, E ., and Stevens, J .C . 1996 . Measuring
and analyzing urban tree cover . Lands . Urban Plann . 36:49-57 .
4 Based on estimated national distribution of urban tree cover (derived from Nowak et al3 of 45 .1% of total urban
tree cover in residential land, 34 .1% in vacant, 9 .7% in parks, 4 .0% in institutional land, 3 .8% in commercial/
industrial land, and 3 .4% in other urban land .
5 Nowak, D .J ., Hoehn, R ., Crane, D .E ., Stevens, J .C ., and Walton, J .T . 2006 . Assessing urban forest effects
and values: Casper, WY’s urban forest . USDA Forest Service, Northern Resource Bulletin NRS-4 . Newtown
Square, PA . 20 p .
6 Nowak, D .J ., Hoehn, R ., Crane, D .E ., Stevens, J .C . and C . LeBlanc . 2010 . Assessing urban forest effects and
values: Chicago’s urban forest . USDA Forest Service, Northern Resource Bulletin NRS-37 . Newtown Square,
PA . 27 p .
7 Nowak, D .J ., Hoehn, R ., Crane, D .E ., Stevens, J .C ., and Walton, J .T . 2007 . Assessing urban forest effects and
values: New York City’s urban forest . USDA Forest Service, Northern Resource Bulletin NRS-9 . Newtown
Square, PA . 24 p .
8 Nowak, D .J ., Hoehn, R ., Crane, D .E ., Stevens, J .C ., and Walton, J .T . 2007 . Assessing urban forest effects
and values: Philadelphia’s urban forest . USDA Forest Service, Northern Resource Bulletin NRS-7 . Newtown
Square, PA . 24 p .
9 Nowak, D .J ., Hoehn, R ., Crane, D .E ., Stevens, J .C and Walton, J .T . 2007 . Assessing urban forest effects and val-
ues: San Francisco’s urban forest . USDA Forest Service, Northern Resource Bulletin NRS-8 . Newtown Square,
PA . 24 p .
10 Nowak, D .J ., Hoehn, R ., Crane, D .E ., Stevens, J .C ., and Walton, J .T . 2006 . Assessing urban forest effects and
values: Washington D .C .’s urban forest . USDA Forest Service, Northern Resource Bulletin NRS-1 . Newtown
Square, PA . 24 p .
11 Nowak, D .J ., Crane, D .E ., and Dwyer, J .F . 2002 . Compensatory value of urban trees in the United States . J .
Arboric . 28(4):194-199 .
12 Based on estimated national urban tree cover distribution4 with Council of Tree and Landscape Appraiser land
use values of 0 .75 for institutional and commercial, 0 .6 for park and residential, 0 .3 for other land uses, and
0 .2 for vacant .
13 Entry from August 10, 2005: “Lungs of the City” (Central Park) http://www .barrypopik .com/index .php/new_york_
city/entry/lungs_of_the_city_central_park/ (May 2010) .
14 U .S . Environmental Protection Agency . 2006 . Excessive Heat Events Guidebook . United States Environmental
Protection Agency, http://www .epa .gov/heatisland/about/heatguidebook .html, Washington, DC .
15 Golden, J .S ., Hartz, D ., Brazel, A ., Luber, G ., and Phelan, P . 2008 . A biometeorology study of climate and
heat-related morbidity in Phoenix from 2001 to 2006 . International Journal of Biometeorology 52:471-480 .
16 Oke, T .R . 1989 . The micrometeorology of the urban forest . Philosophical Transactions of the Royal Society of
London . Series B 324:335-349 .

41
Air Quality Effects of Urban Trees and Parks www.NRPA.org
NationalRecreationandParkAssociation ©2010AllRightsReserved
17 Heisler, G .M ., and Brazel, A .J . 2010 . The Urban Physical Environment: Temperature and Urban Heat Islands .
In: Aitkenhead-Peterson and A . Volder, eds . Urban Ecosystem Ecology (Agronomy Monograph) . Soil Science
Society of America, Madison, WI . 29-56 .
18 Oke, T .R . 1987 . Boundary Layer Climates . Methuen, London and New York .
19 U .S . Environmental Protection Agency . 1992 . Cooling our Communities: a Guidebook on Tree Planting and
Light-Colored Surfacing . US Government Printing Office, Pittsburgh, PA .
20 As pointed out by Sproken-Smith and Oke,30 the park effect is usually a depression in temperature, so the term
“island,” is somewhat misleading and therefore might better be called a “pool .” However, the term Park Cool
Island (PCI) has come into somewhat general usage .
21 Oke, T .R . 1982 . The energetic basis of the urban heat island . Quarterly J . Royal Meteorological Soc . 108(455):
1-24 .
22 Heisler, G ., Walton, J ., Yesilonis, I ., Nowak, D ., Pouyat, R ., Grant, R ., Grimmond, S ., Hyde, K ., and Bacon, G .
2007 . Empirical modeling and mapping of below-canopy air temperatures in Baltimore, MD and vicinity . In:
Seventh Urban Environment Symposium, San Diego, CA, Sep . 7 to 13, 2007 . American Meteorological
Society, Boston [http://ams .confex .com/ams/pdfpapers/126981 .pdf] .
23 Tree and impervious cover were derived from National Land Cover Data for year 2001 from the U .S . Geological
Survey as described by:
Homer, C ., Huang, C ., Yang, L ., Wylie, B ., and Can, M . 2004 . Development of a 2001 National Land Cover
Database for the United States . Photogrammetric Engineering and Remote Sensing 70:829-840 .
The NLCD estimates of tree and impervious cover are sometimes underestimated, according to recent studies:
Greenfield, E .J ., Nowak, D .J ., and Walton, J .T . 2009 . Assessment of 2001 NLCD Percent Tree and Impervious
Cover Estimates . Photogrammetric Engineering & Remote Sensing 75:1279-1286 .
Nowak, D .J ., and Greenfield, E . 2010 . Evaluating the National Land Cover Database tree canopy and impervi-
ous cover estimates across the conterminous United States: A comparison with photo-interpreted estimates .
Environmental Management . 46: 378-390 .
24 Jansson, C ., Jansson, P .-E ., and Gustafsson, D . 2007 . Near surface climate in an urban vegetated park and its
surroundings . Theor . Appl . Climatol . 89:185-193 .
25 Hamada, S ., and Ohta, T . 2010 . Seasonal variations in the cooling effect of urban green areas on surrounding
urban areas . Urban Forestry & Urban Greening 9:15-24 .
26 Information on Baltimore City parks is from the Baltimore City Department of Recreation and Parks, http://
www .baltimorecity .gov/Government/AgenciesDepartments/RecreationandParks .aspx
27 Eliasson, I ., and Upmanis, H . 2000 . Nocturnal airflow urban parks--Implications for city ventilation . Theoretical
and Applied Climatology 66:95-107 .
28 Barradas, V .L . 1991 . Air temperature and humidity and human comfort index of some city parks of Mexico City .
Internatl . J . Biomet . 35:24-28 .
29 Brazel, A ., Selover, N ., Vose, R ., and Heisler, G . 2000 . The tale of two climates—Baltimore and Phoenix urban
LTER sites . Climate Research 15:123-135 .
30 Sproken-Smith, R .A ., and Oke, T .R . 1998 . The thermal regime of urban parks in two cities with different summer
climate . International Journal of Remote Sensing 19:2085-2104 .
31 Sproken-Smith, R .A ., Oke, T .R ., and Lowry, W .P . 2000 . Advection and the surface energy balance across an
irrigated urban park . International Journal of Climatology 20:1033-1047 .
32 Jiménez-Cisneros, B ., and Chávez-Mejía, A . 1997 . Treatment of Mexico City wastewater for irrigation purposes .
Environmental Technology 18:721-729 .
33 Clark, G .T . 1997 . MEXICO CITY: GIS mapping: A mix of old and new technologies . PB Network 38(XI):2 .
www .pbworld .com/news_events/publications/network/issue_38/38_14_clarkg_gismappingtechnologies .asp .
(May 2010) .
34 Duckworth, F .S ., and Sandberg, J .S . 1954 . The effect of cities upon horizontal and vertical temperature
gradients . Bulletin of the American Meteorological Society 35:198-207 .
35 Chang, C .-R ., Li, M .-H ., and Chang, S .-D . 2007 . A preliminary study on the local cool-island intensity of Taipei
city parks . Landscape and Urban Planning 80:386-395 .

Air Quality Effects of Urban Trees and Parks www.NRPA.org
NationalRecreationandParkAssociation ©2010AllRightsReserved
42
36 Jaurequi, E . 1991 . Influence of large urban parks on temperature and convective precipitation in tropical cities .
Energy and Buildings 15:457-463 .
37 Ca, V .T ., Asaeda, T . , and Abu, E .M . 1998 . Reductions in air conditioning energy caused by a nearby park .
Energy and Buildings 29:83-92 .
38 U .S . Environmental Protection Agency . 2010 . Our nation’s air: status and trends through 2008 . EPA-454 /
R-09-002 . Office of Air Quality Planning and Standards . Triangle Park, NC . 49 p .
39 Akbari, H ., Davis, S ., Dorsano, S ., Huang, J ., and Winnett, S . 1992 . Cooling Our Communities . A Guidebook on
Tree Planting and Light –Colored Surfaces . US EPA PM-221 . 217 p .
40 Nowak, D .J ., Crane, D .E ., and Stevens, J .C . 2006 . Air pollution removal by urban trees and shrubs in the United
States . Urban Forestry and Urban Greening . 4:115-123
41 Data from 42 updated to 2007 dollar values based on producer price index: U .S . Department of Labor, Bureau of
Labor Statistics . www .bls .gov/ppi/ (June 2007)
42 Nowak, D .J . 1994 . Air pollution removal by Chicago’s urban forest . In: McPherson, E .G, Nowak, D .J ., and
Rowntree, R .A . Chicago’s Urban Forest Ecosystem: Results of the Chicago Urban Forest Climate Project .
USDA Forest Service General Technical Report NE-186 . pp . 63 81 .
43 Data from reference 36 updated to 2007 dollar values based on producer price index: U .S . Department of Labor
Bureau of Labor Statistics . www .bls .gov/ppi/ (June 2007)
44 Cardelino, C .A ., and Chameides, W .L . 1990 . Natural hydrocarbons, urbanization, and urban ozone . J . Geophys .
Res . 95(D9):13,971-13,979
45 Taha, H . 1996 . Modeling impacts of increased urban vegetation on ozone air quality in the South Coast Air Basin .
Atmos . Environ . 30(20):3423-3430 .
46 Nowak, D .J ., Civerolo, K .L ., Rao, S .T ., Sistla, S ., Luley, C .J ., and Crane, D .E . 2000 . A modeling study of the
impact of urban trees on ozone . Atmos . Environ . 34:1601-1613 .
47 Luley, C .J ., and Bond, J . 2002 . A plan to integrate management of urban trees into air quality planning . Report to
Northeast State Foresters Association . Davey Resource Group, Kent, OH . 73 p .
48 Bytnerowicz, A ., Fenn, M .E ., Miller, P .R ., and Arbaugh, M .J . 1999 . Wet and dry pollutant deposition to the mixed
conifer forest . In: Oxidant Air Pollution Impacts in the Montane Forests of Southern California: A Case Study of
the San Bernardino Mountains (Eds . Miller, P .R ., and McBride, J .R .) Springer-Verlag . New York . pp . 235-269 .
49 Powe, N .A ., and Willis, K .G . 2004 . Mortality and morbidity benefits of air pollution (SO2 and PM10) absorption
attributable to woodland in Britain . J . Environ . Manage . 70: 119-128 .
50 Tiwary, A ., Sinnett, D ., Peachey, C ., Chalabi, Z ., Vardoulakis, S ., Fletcher, T ., Leonardi, G ., Grundy, C ., Azapagic,
A ., and Hutchings, T .R . 2009 . An integrated tool to assess the role of new plantings in PM10 capture and the
human health benefits: A case study in London . Environ . Poll . 157: 2645-2653 .
51 U .S . Environmental Protection Agency . 2004 . Incorporating emerging and voluntary measures in a State
Implementation Plan (SIP) . http://www .epa .gov/ttn/oarpg/t1/memoranda/evm_ievm_g .pdf (May 2010) .
52 Nowak, D .J . 2005 . Strategic tree planting as an EPA encouraged pollutant reduction strategy: How urban trees
can obtain credit in State Implementation Plans . http://www .nrs .fs .fed .us/units/urban/local-resources/
downloads/Emerging_Measures_Summary .pdf (May 2010) .
53 Nowak, D .J . 2000 . The interactions between urban forests and global climate change . In: Abdollahi, K ., Ning,
Z .H ., and Appeaning, A . (Eds .) Global Climate Change and the Urban Forest . GCRCC and Franklin Press,
Baton Rouge, LA . pp . 31-44 .
54 Cavanagh, J .E ., Zawar-Reza, P ., and Wilson, J .G . 2009 . Spatial attenuation of ambient particulate matter air
pollution within an urbanized native forest patch . Urban Forestry and Urban Greening . 8: 21-30 .
55 Ogren, T .L . 2000 . Allergy-free gardening . Ten Speed Press, Berkeley, CA . 267 p .
56 Heisler, G .M . 2005 . Health effects of ultraviolet radiation in urban ecosystems: a review . Proceedings of SPIE Vol .
5886 Ultraviolet Ground-and Space-based Measurements, Models, and Effects V . p . 1-17 .
57 American Melanoma Foundation . 2010 . Facts about melanoma . http://www .melanomafoundation .org/facts/
statistics .htm (May 2010) .
58 Qi, Y ., Heisler, G .M ., Gao, W ., Vogelmann, T .C ., and Bai, S . 2010 . Characteristics of UV-B radiation tolerance in

43
Air Quality Effects of Urban Trees and Parks www.NRPA.org
NationalRecreationandParkAssociation ©2010AllRightsReserved
broadleaf trees in Southern USA . p . 509-530, In W . Gao, et al ., eds . UV Radiation in Global Climate Change:
Measurements, Modeling, and Effects on Ecosystems . Springer, Heidelberg and Tsinghua University Press,
Beijing .
59 Heisler, G .M . 2010 . Urban forest influences on exposure to UV radiation and potential consequences for human
health . p . 331-369, In W . Gao, et al ., eds . UV Radiation in Global Climate Change: Measurements, Modeling,
and Effects on Ecosystems . Springer, Heidelberg and Tsinghua University Press, Beijing .
60 Intergovernmental Panel on Climate Change . 2007 . Climate Change 2007: The Physical Science Basis . Summary
for Policymakers . IPCC Secretariat, Geneva . (http://www .ipcc .ch/pdf/assessment-report/ar4/wg1/ar4-wg1-
spm .pdf ) (July 2008) .
61 Nowak, D .J ., and Crane, D .E . 2002 . Carbon storage and sequestration by urban trees in the USA . Environ . Poll .
116(3):381-389 updated to carbon values of $22 .8 per metric ton .
62 U .S . EPA . (no date) . Fact Sheet: Carbon Sequestration: A Local Solution with Global Implications . http://www .
epa .gov/aml/revital/cseqfact .pdf (July 2010) .
63 Birdsey, R .A ., and Heath, L .S . 1995 . Carbon changes in U .S . forests . In: Joyce, L .A . (ed .) Climate change and
the productivity of America’s forests . USDA Forest Service General Technical Report RM-271, Fort Collins, CO .
pp . 56-70 .
64 Based on calculations from Pouyat, R .V ., Yesilonis, I .D ., and Nowak, D . 2006 . Carbon storage by urban soils in
the United States . J . Environ . Quality . 35: 1,566-1,575 .
65 Nowak, D .J . 1993 . Atmospheric carbon reduction by urban trees . J . Environ . Manage . 37(3): 207-217 .
66 Nowak, D .J ., Stevens, J .C ., Sisinni, S .M ., and Luley, C .J . 2002 . Effects of urban tree management and species
selection on atmospheric carbon dioxide . J . Arboric . 28(3):113-122 .

NationalRecreationandParkAssociation ©2010AllRightsReserved
44
Air Quality Effects of Urban Trees and Parks
BIOGRAPHICAL PROFILE
David J. Nowak
ProjectLeader
UnitedStatesDepartmentofAgriculture–ForestService
BIOGRAPHICAL PROFILE
researchers from universities including SUNY in Syracuse, Purdue, Princeton, Penn State, Rutgers, University of Connecticut, and Southern University in Baton Rouge . In 2005, SPIE—The International Society for Optical Engineering, presented Dr . Heisler with an award for “a career of excellence in pioneering studies on the effects of urban forests on UV radiation .” He has been involved with the Baltimore Ecosystem Study, a Long Term Ecological Research program, for the last 13 years . He is active in the American Meteorological Society and the International Association for Urban Climate .
Gordon M. Heisler
Meteorologist
UnitedStatesDepartmentofAgriculture–ForestService
Dr.GordonHeislerbecame interested in micrometeorology while studying what happens to snow landing on conifer forests for his Ph .D . thesis at the State University of New York College of Forestry in Syracuse in the late 1960’s . After that Syracuse stint, he spent 2 years at a science resource center near Hartford, CT, where he taught ecology and meteorology to grades 1 to 12 and meteorol-ogy at the University of Hartford . Since 1972 he has been a research meteorologist with the U .S . Forest Service in New Jersey, Pennsylvania, and for 19 years in Syracuse, NY, the entire time collaborating in studies of environmental impacts of forests with
DavidJ.Nowakis a Project Leader with the USDA Forest Service, Northern Research Station in Syracuse, NY . Dr . Nowak received a B .S . and M .S . from SUNY College of Environmental Science and Forestry, and a Ph .D . from the University of California, Berkeley . He has authored over 190 publications and is a recipient of the National Arbor Day Foundation’s highest honor - the J . Sterling Morton Award, which recognizes lifelong commitment to tree planting and conservation at a national or international level, American Forests’ Urban Forest Medal recognizing outstanding national contributions in urban forest research, the
Distinguished Science Award of the Northeastern Research Station, the Forest Service Chief’s Honor Award for Engaging Urban America, New York State Arborists-ISA Chapter Research Award, and was a contributing member of the 2007 Nobel Peace Prize winning Inter-governmental Panel on Climate Change . His research investigates urban forest structure, health, and change, and its effect on air quality and greenhouse gases . He also leads teams developing software tools to quantify ecosystem services from urban vegetation (e .g ., UFORE and i-Tree programs) .

44

22377 Belmont Ridge Road Ashburn, VA 20148-4501
800 .626 .NRPA (6772) • www .NRPA .org