Embed Size (px)
Citation preview
Subchapter 2.2 Air Quality
2.2-1
2.2 Air Quality
An Air Quality Technical Report was prepared for the project by RECON Environmental,Inc. (2013a). The following section is a summary of this report, which can be found in itsentirety in Appendix D of this EIR. The impact analysis is based on the County’sGuidelines for Determining Significance and Report Format and Content Requirements –Air Quality (County of San Diego 2007a).
2.2.1 Existing Conditions
2.2.1.1 Climate
The project area, like the rest of San Diego County’s inland valley areas, has aMediterranean climate characterized by warm, dry summers and mild, wet winters. Theaverage annual precipitation is 13 inches, falling primarily from November to April. Themean annual temperature for the project area is 74 degrees Fahrenheit (°F). Winter lowtemperatures in the project area average about 44°F, and summer high temperaturesaverage about 81°F (U.S. Department of Commerce 2006).
The dominant meteorological feature affecting the region is the Pacific High PressureZone, which produces the prevailing westerly to northwesterly winds. These winds tendto blow pollutants away from the coast toward the inland areas. Consequently, airquality near the coast is generally better than that which occurs at the base of thecoastal mountain range.
Generally, atmospheric temperature decreases as one moves higher and further fromthe earth’s surface; however, fluctuations in the strength and pattern of winds from thePacific High Pressure Zone throughout the day produce periodic temperature inversions.A temperature inversion is a thin layer of the atmosphere where the decrease intemperature with elevation is less than normal. The inversion acts like a “lid” keepingpollutants “trapped” within the area under the inversion layer. This area is called themixing depth. Generally, the morning inversion layer is lower than the afternooninversion layer. The greater the change between the morning and afternoon mixingdepths, the greater the ability of the atmosphere to disperse pollutants.
Throughout the year, the elevation of the temperature inversion within the San Diego AirBasin (SDAB) in the afternoon varies between approximately 1,500 and 2,500 feetabove MSL. In winter, the morning inversion layer is about 800 feet above MSL. Insummer, the morning inversion layer is about 1,100 feet above MSL. Therefore, airquality tends to be better in winter than in summer because there is a greater change inthe morning and afternoon mixing depths, allowing the dispersal of “trapped” pollutants.The project site is situated at an elevation of approximately 650 feet above MSL.
The prevailing westerly wind pattern is sometimes interrupted by regional “Santa Ana”conditions. A Santa Ana occurs when a strong high pressure develops over theNevada-Utah area and overcomes the prevailing westerly coastal winds, sending strong,steady, hot, dry northeasterly winds over the mountains and out to sea.
Strong Santa Anas tend to blow pollutants out over the ocean, producing clear days.However, at the onset or during breakdown of these conditions, or if the Santa Ana isweak, emissions from the South Coast Air Basin to the north are blown out over the

Subchapter 2.2 Air Quality
2.2-2
ocean, and low pressure over Baja California draws this pollutant-laden air masssouthward. As the high pressure weakens, prevailing northwesterly winds reassertthemselves and send this cloud of contamination ashore in the SDAB. When this eventdoes occur, the combination of transported and locally produced contaminantsgenerates the worst air quality measurements within the SDAB.
2.2.1.2 Regulatory Framework
Federal Regulations
The federal Clean Air Act (CAA) was enacted in 1970 and amended in 1977 and 1990(42 United States Code [U.S.C.] 7401) for the purposes of protecting and enhancing thequality of the nation’s air resources to benefit public health, welfare, and productivity. In1971, in order to achieve the purposes of the CAA the U.S. Environmental ProtectionAgency (EPA) developed primary and secondary national ambient air quality standards(NAAQS) for seven pollutants known as “criteria” pollutants: ozone (O3), carbonmonoxide (CO), sulfur dioxide (SO2), nitrogen dioxide (NO2), lead (Pb), and particulatematter less than 10- and 2.5-micron in size (PM10 and PM2.5) (Table 2.2-1).
Primary NAAQS are required to protect human health with an adequate margin of safety.Secondary standards are designed to protect property and the public welfare from airpollutants in the atmosphere (42 U.S.C. 7409(b)(2)).
The SDAB is currently a federal non-attainment area for the 8-hour ozone standard anda maintenance area for the CO standard. The SDAB is in attainment for the NAAQS forall other criteria pollutants.
State Regulations
California Clean Air Act
The U.S. EPA allows the states the option to develop their own ambient air qualitystandards provided they are at least as stringent as the federal standards. The CaliforniaAir Resource Board (CARB) has set more stringent limits on six of the seven criteriapollutants in the California Ambient Air Quality Standards (CAAQS). The standards areshown in Table 2.2-1.
Assembly Bill (AB) 2595, known as the California Clean Air Act, became effective onJanuary 1, 1989, and requires that districts implement regulations to reduce emissionsfrom mobile sources through the adoption and enforcement of transportation controlmeasures and:
• Demonstrate the overall effectiveness of the air quality program;
• Reduce nonattainment pollutants at a rate of five percent per year, or include all
feasible measures and expeditious adoption schedule;
• Ensure no net increase in emissions from new or modified stationary sources;

Subchapter 2.2 Air Quality
2.2-3
• Reduce population exposure to severe nonattainment pollutants according to a
prescribed schedule;
• Include any other feasible controls that can be implemented, or for which
implementation can begin, within 10 years of adoption of the most recent air
quality plan; and
• Rank control measures by cost-effectiveness.
The SDAB is a non-attainment area for the state O3, PM10, and PM2.5 standards. TheSDAB is in attainment for the CAAQS for all other criteria pollutants.
Toxic Air Contaminants
The public’s exposure to toxic air contaminants (TACs) is a significant public healthissue in California. In 1983, the California Legislature enacted a program to identify thehealth effects of TACs and to reduce exposure to these contaminants to protect thepublic health (AB 1807: Health and Safety Code sections 39650-39674). The Legislatureestablished a two-step process to address the potential health effects from TACs. Thefirst step is the risk assessment (or identification) phase. The second step is the riskmanagement (or control) phase of the process.
In April 2005, the CARB published the “Air Quality and Land Use Handbook: ACommunity Health Perspective.” The handbook makes recommendations directed atprotecting sensitive land uses while balancing a myriad of other land use issues (e.g.,housing, transportation needs, economics). It notes that the handbook is not regulatoryor binding on local agencies and recognizes that application takes a qualitativeapproach. As reflected in the CARB handbook, there is currently no adopted standardfor the significance of health effects from mobile sources. Therefore, the CARB hasprovided guidelines for the siting of land uses near heavily traveled roadways. Ofpertinence to this study, the CARB guidelines indicate that siting new sensitive land useswithin 500 feet of a freeway, urban roads with 100,000 vehicles per day, or rural roadswith 50,000 vehicles per day should be avoided when possible.
As an ongoing process, the CARB will continue to establish new programs andregulations for the control of diesel particulate emissions as appropriate. The continueddevelopment and implementation of these programs and policies will ensure that thepublic exposure to diesel particulate matter will continue to decline.
State Implementation Plan (SIP)
The SIP is a collection of documents that set forth the state’s strategies for achieving airquality standards. The San Diego Air Pollution Control District (SDAPCD) is the localagency responsible for preparing and implementing the portion of the SIP applicable tothe SDAB. The SDAPCD adopts rules, regulations, and programs to attain state andfederal air quality standards, and appropriates money (including permit fees) to achievethe objectives of the SIP.

Subchapter 2.2 Air Quality
2.2-4
Local Regulations
San Diego Air Pollution Control District
The SDAPCD prepared the 1991/1992 Regional Air Quality Standards (RAQS) inresponse to the requirements set forth in AB 2595. The draft was adopted, withamendments, on June 30, 1992. Attached as part of the RAQS are the transportationcontrol measures (TCM) for the air quality plan prepared by SANDAG in accordancewith AB 2595 and adopted by SANDAG on March 27, 1992, as Resolution Number92-49 and Addendum. The required triennial update of the RAQS and correspondingTCM were adopted in December 12, 1995, 1998, 2001, 2004, and 2009. The RAQSand TCM plan set forth the steps needed to accomplish attainment of state and federalambient air quality standards.
The SDAPCD has also established a set of rules and regulations initially adopted onJanuary 1, 1969, and periodically reviewed and updated. The rules and regulationsdefine requirements regarding stationary sources of air pollutants and fugitive dust.
2.2.1.3 Existing Air Quality
As stated above, the project site is within the SDAB. Air quality at a particular location isa result of the types and amounts of pollutants being emitted both into the air locally andthroughout the basin coupled with the dispersal rates of pollutants within the region. Themajor factors affecting pollutant dispersion are wind speed and direction, the verticaldispersion of pollutants, which is affected by inversions, and the local topography.
Air quality is commonly expressed as the number of days in which air pollution levelsexceed state standards set by the CARB and federal standards set by the U.S. EPA(see Table 2.2-1). The concentration of pollutants within the SDAB is measured at11 stations maintained by the SDAPCD and the CARB. Table 2.2-2 summarizes thenumber of days per year during which state and federal standards were exceeded in theSDAB during the years 2007 to 2011.
The Camp Pendleton monitoring station, located 15 miles southwest of the project area,the Escondido–East Valley Parkway monitoring station, located 10 miles southeast ofthe project area, and the Del Mar–Mira Costa College monitoring station, located22 miles southwest of the project area, are the nearest stations to the project area. TheCamp Pendleton monitoring station measures O3, NO2, PM10, and PM2.5. TheEscondido–East Valley Parkway monitoring station measures O3, CO, NO2, PM10, andPM2.5. The Del Mar–Mira Cost College monitoring station measures O3.
Table 2.2-3 provides a summary of measurements of O3, CO, NO2, SO2, PM10, andPM2.5 collected at the Camp Pendleton, the Escondido–East Valley Parkway, and theDel Mar–Mira Costa College monitoring stations, for the years 2007 through 2011.
Ozone
Ozone, or smog, is the primary source of air pollution in the SDAB. Nitrogen oxides andhydrocarbons, known as reactive organic gases (ROGs), are the chief “precursors” ofozone. These compounds react in the presence of sunlight to produce ozone. Becausesunlight plays such an important role in the formation of smog, it is at its highest

Subchapter 2.2 Air Quality
2.2-5
concentration during the daytime in summer months. About half of these smog-formingpollutants come from automobiles (County of San Diego 2004). Population growth inSan Diego has resulted in a large increase in the number of automobiles operating onarea roadways.
In the SDAB overall, during the five-year period of 2007 to 2011 the state 1-hour O3
standard of 0.09 ppm was exceeded 21 days in 2007, 18 days in 2008, 8 days in 2009,and 7 days in 2010, and 5 days in 2011.
The 1-hour state standard for O3 of 0.09 ppm was exceeded one time at the CampPendleton monitoring station, four times at the Del Mar–Mira Costa College monitoringstation, and 13 times at the Escondido–East Valley Parkway monitoring station duringthe five-year period of 2007 to 2011.
In order to address adverse health effects due to prolonged exposure, the U.S. EPAphased out the national one-hour ozone standard and replaced it with the moreprotective eight-hour ozone standard. The SDAB is currently a nonattainment area forthe national eight-hour standard.
In the SDAB overall, the revised national 8-hour standard of 0.075 was exceeded by 35days in 2008, 24 days in 2009, and 14 days in 2010 and 10 days in 2011. The stricter50 days in 2007, 69 days in 2008, 47 days in 2009, and 21 days in 2010, and 33 days in2011.
The revised national 8-hour standard of 0.075 ppm was exceeded four times at theCamp Pendleton monitoring station, seven times at the Del Mar–Mira Costa Collegemonitoring station, and 22 times at the Escondido-East Valley Parkway monitoringstation during the 5-year period from 2007 to 2011. The stricter state 8-hour ozonestandard of 0.07 ppm was exceeded 15 times at the Camp Pendleton monitoring station,21 times at the Del Mar–Mira Costa College monitoring station, and 25 times at theEscondido-East Valley Parkway monitoring station during the five-year period from2007 to 2011.
Not all of the ozone within the SDAB is derived from local sources. Under certainmeteorological conditions, such as during Santa Ana wind events, ozone and otherpollutants are transported from the South Coast Air Basin (the air basin to the north thatincludes portions of Los Angeles) and combine with ozone formed from local emissionssources to produce elevated ozone levels in the SDAB. Local agencies can controlneither the source nor the transportation of pollutants from outside the SDAB. TheSDAPCD’s policy, therefore, has been to control local sources effectively enough toreduce locally produced contamination to clean air standards. Through the use of airpollution control measures outlined in the RAQS, the SDAPCD has effectively reducedozone levels in the SDAB; however, the SDAB remains designated a nonattainmentarea for both national and state standards for ozone.
Carbon Monoxide
The SDAB is classified as a state attainment area for CO and as a federal maintenancearea for carbon monoxide. Until 2003, no violations of the state standard for CO hadbeen recorded in the SDAB since 1991, and no violations of the national standard hadbeen recorded in the SDAB since 1989. The violations that took place in 2003 were

Subchapter 2.2 Air Quality
2.2-6
likely the result of massive wildfires that occurred through the county. Such an eventwould be covered under the U.S. EPA’s Natural Events Policy, which provides for theexclusion of air quality data attributable to uncontrollable natural events (e.g., volcanicactivity, wildland fires, and high wind events). No violations of the state or federal COstandards have occurred since 2003. As shown in Tables 2.2-2 and 2.2-3, the state andfederal standards have not been exceeded in the SDAB or at the Camp Pendletonmonitoring station during the five-year period from 2007 through 2011.
Small-scale, localized concentrations of CO above the state and national standards arecalled “CO hot spots.” These have the potential to occur at intersections with stagnationpoints, such as those that occur on major highways and heavily traveled and congestedroadways.
PM10
PM10 is a particulate matter with an aerodynamic diameter of 10 microns or less. Tenmicrons is about one-seventh of the diameter of a human hair. Particulate matter is acomplex mixture of very tiny solid or liquid particles composed of chemicals, soot, anddust. Sources of PM10 emissions in the SDAB consist mainly of activities that disturb thesoil including travel on roads and construction, mining, or agricultural operations, dustsuspended by vehicle traffic, as well as secondary aerosols formed by reactions in theatmosphere. Other sources include windblown dust, salts, brake dust, and tire wear(County of San Diego 1998).
Under typical conditions (i.e., no wildfires) particles classified under the PM10 categoryare mainly emitted directly from activities that disturb the soil including travel on roadsand construction, mining, or agricultural operations. Other sources include windblowndust, salts, brake dust, and tire wear (County of San Diego 1998). For several reasonshinging on the area’s dry climate and coastal location, the SDAB has special difficulty indeveloping adequate tactics to meet present state particulate standards.
The SDAB is designated as federal unclassified and state non-attainment for PM10. Themeasured federal PM10 standard was exceeded once in 2007, and once in 2008 in theSDAB. The 2007 exceedance occurred on October 21, 2007, at a time when majorwildfires were raging throughout San Diego County. Consequently, this exceedance waslikely caused by or was a subsequent result of the wildfires and would be beyond thecontrol of the SDAPCD (CARB 2010b). As such, these events are covered under theU.S. EPA’s Natural Events Policy that permits, under certain circumstances, theexclusion of air quality data attributable to uncontrollable natural events (e.g., volcanicactivity, wildland fires, and high wind events). The 2008 exceedance did not occur duringwildfires and is not covered under this policy.
The stricter state standard was exceeded a calculated number of days of 158.6 days in2007, 163.4 days in 2008, 146.4 days in 2009, 136 days in 2010, and 138.5 days in2011. Calculated days are the estimated number of days that a measurement wouldhave been greater than the level of the standard, had measurements been collectedevery day. Particulate measurements are collected every six days.
At the Escondido—East Valley Parkway monitoring station, the national 24-hour PM10
standard was not exceeded during the years 2007 through 2011. The stricter state 24-hour standard was exceeded two days in 2007, one day in 2008, and one day in 2009

Subchapter 2.2 Air Quality
2.2-7
(CARB 2012). These exceedances resulted in a calculated number of days that the statestandard was exceeded of 11.5 days in 2007 and 5.6 days in 2009. Information wasavailable for the calculated number of days in 2008.
PM2.5
Airborne, inhalable particles with aerodynamic diameters of 2.5 microns or less havebeen recognized as a pollutant requiring regular monitoring. Federal regulationsrequired that PM2.5 monitoring begin January 1, 1999 (County of San Diego 1999). TheEscondido–East Valley Parkway monitoring station is one of five stations in the SDABthat monitors PM2.5. Federal PM2.5 standards established in 1997 include an annualarithmetic mean of 15 micrograms per cubic meter (g/m3) and a 24-hour concentrationof 65 g/m3. The 24-hour PM2.5 standard has since been revised to 35 g/m3. StatePM2.5 standards established in 2002 are an annual arithmetic mean of 12 g/m3.
The SDAB was classified as an attainment area for the previous federal 24-hour PM2.5
standard of 65 g/m3 and has also been classified as an attainment area for the revisedfederal 24-hour PM2.5 standard of 35 g/m3 (U.S. EPA 2009). The SDAB is a non-attainment area for the state PM2.5 standard (CARB 2005).
In the SDAB overall the new national standard of 35 g/m3 was exceeded a calculatednumber of days of 11.4 days in 2007, 3.5 days in 2008, 3.4 days in 2009, 2 days in2010, and 3 days in 2011. Additionally, although the federal annual standard was notexceeded during the period from 2007 through 2011, the state annual standard wasroutinely exceeded during this period in the SDAB overall.
The new 24-hour PM2.5 standard of 35 g/m3 was not exceeded at the Camp PendletonStreet monitoring station during the years 2007 through 2011. The new standard of35 g/m3 was exceeded a calculated 11.4 days in 2007, 2 days in 2009, and 2 days in2010, and 3 days in 2011 at the Escondido–East Valley Parkway monitoring station.
Other Criteria Pollutants
The federal and state standards for NO2, SO2, and lead are being met in the SDAB andthe latest pollutant trends suggest that these standards will not be exceeded in theforeseeable future. New standards for these pollutants have been adopted, and newdesignations for the SDAB will be determined in the future. The SDAB is also inattainment of the state standards for hydrogen sulfides, sulfates, and visibility reducingparticles.
2.2.2 Analysis of Project Impacts and Determination of Significance
The project would result in a significant impact if it would:
1. Conformance to Regional Air Quality Strategy: Conflict with a regional air qualityplan or strategy.
2. Conformance to Federal and State Ambient Air Quality Standards: Violate any airquality standard.

Subchapter 2.2 Air Quality
2.2-8
3. Cumulatively Considerable Net Increase of Criteria Pollutants: Result in the netincrease of any criteria pollutant during construction or operational phases.
4. Impacts to Sensitive Receptors: Expose sensitive receptors to substantialpollutant concentrations.
5. Odor Impacts: Generate objectionable odors near sensitive receptors.
2.2.2.1 Issue 1: Conformance to Regional Air Quality Strategy
Guidelines for the Determination of Significance
Based on the County’s Guidelines for Determining Significance – Air Quality (County ofSan Diego 2007a), a significant impact would occur if the project would conflict with orobstruct the implementation of the San Diego RAQS and/or applicable portions of theSIP.
Impact Analysis
The RAQS was developed pursuant to California CAA requirements and identifiesfeasible emission control measures to provide expeditious progress in the County towardattaining the state O3 standard. The pollutants addressed are ROGs and oxides ofnitrogen (NOX), precursors to the photochemical formation of O3, the primary componentof smog. The RAQS does not address CO or particulates; however, the 2007 SIPincludes a CO maintenance plan for the region (SDAPCD 2004). The RAQS controlmeasures focus on emission sources under SDAPCD authority, specifically stationarysources and some area-wide sources. The RAQS identifies area-wide sources as mostlyresidential sources, including water heaters, furnaces, architectural coatings, andconsumer products. It is noted that fireplaces are not included. Assumptions for land usedevelopment used in the RAQS are taken from local and regional planning documents,including general plan land use designations.
Consistency with the RAQS is determined by analyzing a project with the assumptions inthe RAQS. Thus, the emphasis of this criterion is to evaluate if the project’s land useswould be consistent with or less than the emission forecasts for the project sitecontained in the RAQS. Forecasts used in the RAQS are developed by SANDAG.SANDAG forecasts are based on local general plans and other related documents thatare used to develop population projections and traffic projections.
As discussed above, the County’s General Plan specifies the project site as a semi-ruralarea. The project would require a General Plan Amendment, a Specific Plan, and aRezone in order to implement the Master and Phase I Implementing Maps and an MUP.These changes are necessary to accommodate the 903 single-family detachedresidences, 164 single-family attached residences, 468 single-family senior residences,211 mixed-use residences, 75,000 square feet of commercial use, a school site, a groupresidential/group care facility, an RF, an on-site a WRF, and other project features.
Given that these uses are not currently permitted under the existing General Plan, therefinement in land uses would exceed and intensify the land uses planned for under theCounty General Plan. Therefore, the project is inconsistent with the RAQS. Accordingly,implementation of the project would conflict with and exceed the assumptions used to

Subchapter 2.2 Air Quality
2.2-9
develop the current RAQS. While the project contains smart growth features, whichwould serve to reduce vehicle miles traveled (VMT), a major goal of the RAQS TCMs,this would not eliminate this inconsistency with RAQS for the SDAB. This inconsistencycan only be rectified when SANDAG updates the RAQS based on the growth projectionsafter the project has been approved. Thus, the project would result in a significantimpact (Impact AQ-1).
2.2.2.2 Issue 2: Conformance to Federal and State Ambient Air QualityStandards
Guidelines for the Determination of Significance
Based on the County’s Guidelines for Determining Significance: Air Quality (County ofSan Diego 2007a), a significant impact would occur if the project would:
Result in emissions that exceed 250 pounds per day of NOx, or 75 pounds perday of volatile organic compound (VOC).
Result in emissions of carbon monoxide that when totaled with the ambientconcentrations will exceed a 1-hour concentration of 20 parts per million (ppm) oran 8-hour average of 9 ppm.
Result in emissions of PM2.5 that exceed 55 pounds per day.
Result in emissions of PM10 that exceed 100 pounds per day and increase theambient PM10 concentration by 5 μg/m3 or greater at the maximum exposedindividual.
Impact Analysis
Construction
Construction emissions associated with development of the project were quantified usingthe California Emissions Estimator Model (CalEEMod). Construction emissions weremodeled using project-specific construction information when available. Where project-specific information was not available, default assumptions contained in CalEEMod wereused to estimate construction emissions.
The project applicant has provided approximate timeframes for the five phases ofconstruction activities. Each phase is estimated to be approximately 1.5 years in lengthwith the exception of Phase III, which is estimated to be three to four years in length.
Assumptions used to model construction emissions for each of the phases were basedon equipment lists and cut and fill calculation provided by the project applicant.Construction equipment, schedule, and phase overlap assumptions are detailed in theAir Quality Technical Report contained in Appendix D.
Blasting operations would also be required for site preparation. For modeling purposes itwas assumed that blasting operations would occur during the grading stage of eachphase of construction; however, actual blasting operations would occur independentlyfrom grading activities. Assuming that blasting would occur during grading operations

Subchapter 2.2 Air Quality
2.2-10
results in a worst-case analysis, blasting operations would occur in all five phases of theproject, and the explosive material would consist of ammonium nitrate and fuel oil,known as ANFO. It is estimated that each blast would require 10,000 pounds ofexplosive per blast and there would be a total of 8 blasts for the project. This totals to80,000 pounds of ANFO for the project.
Project-specific data was input into CalEEMod and used to calculate maximum dailyemissions associated with construction of each phase of the project. To present areasonable worst-case assessment of the potential impacts, the construction schedule inCalEEMod was developed with overlapping phases. For air quality modeling purposes,construction activities were assumed to commence in July 2014 and conclude inDecember 2021, which represents a slightly compressed construction schedule ascompared to that proposed. Emission rates for equipment and vehicles would beexpected to decrease with time. Therefore, the modeled construction scenario representsthe highest emission rates for individual pieces of construction equipment and vehicles.
In accordance with Section 87.428 of the County’s Grading, Clearing, and WatercoursesOrdinance, specific dust-control measures have been identified for implementationduring grading activities, which have been included in the construction emissionsmodeling. These would consist of watering the project site three times a day, applyingnonchemical soil stabilizers to disturbed areas during grading activities or equivalentmeasures. With respect to architectural coatings, a limited VOC content per gallon ofcoating is required by SDAPCD Rule 67.
Emissions from construction equipment were quantified by overlapping the on-siteconstruction phases. The worst-case scenarios of the overlapping phases were analyzedfor impact determination. Additionally, for purposes of the air quality analysis, all off-siteemissions were modeled during construction of Phase I improvements. The off-siteimpacts consist of road widening activities over a total area of approximately 2.7 acresand were calculated using the Road Construction Emissions Model. Table 2.2-4summarizes the total emissions for each of the overlapping phases during construction.

Subchapter 2.2 Air Quality
2.2-11
TABLE 2.2-4UNMITIGATED MAXIMUM DAILY CONSTRUCTION EMISSIONS (ON- AND OFF-SITE)
(pounds per day)
Construction Phase1
ROG NOX CO SO2 PM102
PM2.52
Phase 1With Blasting 18.3 236.4 411.6 10.2 469.7 103.7Without Blasting 18.3 151.43 76.6 0.3 469.7 103.7
Phase 1/Phase 4With Blasting 39.2 262.5 448.7 10.2 447.8 100.6Without Blasting 39.2 177.5 113.7 0.2 447.8 100.6
Phase 4/Phase 2With Blasting 32.4 249.7 454.0 10.3 449.3 99.8Without Blasting 32.4 164.7 119.0 0.3 449.3 99.8
Phase 2/Phase 5With Blasting 50.1 238.3 451.3 10.3 448.8 99.1Without Blasting 50.1 153.3 116.3 0.3 448.8 99.1
Phase 5/Phase 3With Blasting 34.0 240.6 454.7 10.3 449.6 99.2Without Blasting 34.0 155.6 119.7 0.3 449.6 99.2
Maximum Daily Emissions 50.1. 262.5 454.7 10.3 469.7 103.7Screening Level Thresholds 75 250 550 250 100 55Significant Impact? No Yes No No Yes Yes
ROG =reactive organic gases; NOX = oxides of nitrogen; CO = carbon monoxide; SO2 = sulfur dioxide;PM10 = suspended particulate matter; PM2.5 = fine particulate matter; SLT = Screening Level Thresholds1Blasting would occur during the grading phase of all construction phases.
2PM emissions include water site 3x/day and a “track-out” gravel bed.
Bold data indicate a threshold has been exceeded.
As shown in Table 2.2-4, criteria pollutant emissions would exceed the Screening LevelThresholds (SLT) for PM10, PM2.5 and NOX, and would therefore result in a significantdirect impact. The remaining criteria pollutants would be below the SLT and would notresult in significant impacts. Design considerations in the modeling include implementingstandard dust control measures, using SDAPCD-compliant ROG paints for architecturalcoating, as well as using Tier III or better equipment during the construction phases asdetailed in the Air Quality Technical Report (see Appendix D). Even with implementationof these design considerations, construction emissions would result in a significantimpact (Impact AQ-2).
Operation
The operation of the project would result in emissions from the area and mobile sources.Vehicle trip generation rates are used by CalEEMod to estimate the mobile sourceoperational emissions for each corresponding land use. Daily trip generation rates wereestimated in the project’s Traffic Impact Study (see Appendix E). CalEEMod defaultswere used for vehicle fleet mix and trip lengths.
Area sources associated with the project would include architectural coating, consumerproducts, hearths, landscaping, and natural gas. The following project designconsiderations were included:
No wood-burning fireplaces will be installed and all fireplaces were assumed to
be natural gas. No fireplaces at all were assumed for the 200-person congregate

Subchapter 2.2 Air Quality
2.2-12
care facility, while 90 percent of the other residential land uses were assumed to
have no fireplaces.
The proposed project also includes pedestrian friendly design and includes traffic
reduction measures, such as complete sidewalk coverage within the project,
internal trails, and bike lanes.
All new residential units will have smart meters installed.
The project includes a planting plan for approximately 35,000 additional trees
within the project site to reduce energy consumption through the provision of
shade.
The project is designed to achieve a 30 percent improvement in energy efficiency
of the 2008 Title 24 energy efficiency requirements.
The analysis of traffic operations is based on information provided by the Traffic ImpactStudy (see Appendix E). The traffic report uses five scenarios to characterize operations,Phase 1 only corresponds to Scenario A, Phases 1 and 4 together are Scenario B,Phases 1, 2, and 4 together are Scenario C, Phases 1, 2, 4, and 5 together are ScenarioD, and project build-out is Scenario E (Chen Ryan 2013). The total maximum dailyoperational emissions for Scenarios A through E are summarized in Table 2.2-5. Eachconsecutive phase adds land uses; therefore, the total emissions increase as they areimplemented in the order of A to E. Starting at Scenario C, operational emissions wouldexceed the County’s SLT for ROG, CO, and PM10. Operational assumptions are detailedin the Air Quality Technical Report contained in Appendix D.

Subchapter 2.2 Air Quality
2.2-13
Table 2.2-5 summarizes the total emissions that would occur from project operation.
TABLE 2.2-5OPERATIONAL SOURCE EMISSIONS
(pounds per day)
Operational Scenario/Emissions Source
ROG NOX CO SO2 PM10 PM2.5
Scenario A Operations
Mobile Sources 21.45 46.22 216.33 0.39 45.43 2.73
Area Sources1
18.8 0.35 29.66 0 0.58 0.58
Total Scenario A 40.25 46.57 245.99 0.39 46.01 3.31
Scenario B Operations
Mobile Sources 32.23 69.47 325.16 0.59 68.29 4.11
Area Sources1
30.25 0.71 61.09 0 0.96 0.95
Total Scenario B 62.48 70.18 386.25 0.59 69.25 5.06
Scenario C Operations
Mobile Sources 68.14 144 672.31 1.2 138.32 8.35
Area Sources1
54.03 1.16 100.19 0.01 1.73 1.72
Total Scenario C 122.17 145.16 772.5 1.21 140.05 10.07
Scenario D Operations
Mobile Sources 81.46 172.62 806.18 1.44 166.32 10.04
Area Sources1
70.31 1.44 124.93 0.01 2.79 2.76
Total Scenario D 151.77 174.06 931.11 1.45 169.11 12.8
Scenario E "Build-out" Operations
Mobile Sources 113.61 241.44 1,127.97 2.02 233.42 14.08
Area Sources1 97.32 1.87 162.78 0.01 3 2.98
Total Scenario E “Build-out” 210.93 243.31 1,290.75 2.03 236.42 17.06
Screening Level Thresholds 75 250 550 250 100 55
Significant Impact? Yes No Yes No Yes No
ROG = reactive organic gases; NOX = oxides of nitrogen; CO = carbon monoxide; SO2 = sulfur dioxide;PM10 = suspended particulate matter; PM2.5 = fine particulate matter; SLT = Screening Level Threshold1The area sources calculation includes the natural gas energy calculations from CalEEMod.
Bold data indicate a threshold has been exceeded.
As shown, emissions are projected to exceed the applicable SLTs for ROG, CO, andPM10. Operation emissions would be considered a significant impact to regional airquality (Impact AQ-3).
2.2.2.3 Issue 3: Cumulatively Considerable Net Increase of Criteria Pollutants
Guidelines for the Determination of Significance
Based on the County’s Guidelines for Determining Significance: Air Quality (County2007i), a significant impact would occur if the project would result in a cumulativelyconsiderable net increase of any criteria pollutant for which the SDAB is non-attainmentunder an applicable federal or state AAQS.

Subchapter 2.2 Air Quality
2.2-14
As discussed above, the SDAB is a federal non-attainment area for ozone, and a statenon-attainment area for ozone, PM10, and PM2.5. Based on the County’s Guidelines forDetermining Significance: Air Quality (San Diego County 2007a), the followingGuidelines for Determining Significance must be used for determining the cumulativelyconsiderable net increases during the construction phase:
A project that has a significant direct impact on air quality with regard toemissions of PM10, PM2.5, NOX and/or VOCs would also have a significantcumulatively considerable net increase.
In the event direct impacts from a proposed project are less than significant, aproject may still have a cumulatively considerable impact on air quality if theemissions of concern from the proposed project, in combination with theemissions of concern from other proposed projects or reasonably foreseeablefuture projects within a proximity relevant to the pollutants of concern, are inexcess of the guidelines identified in subchapter 2.2.2.1.
Additionally, the following Guidelines for Determining Significance must be used fordetermining the cumulatively considerable net increases during the operational phase:
A project that does not conform to the RAQS and/or has a significant directimpact on air quality with regard to operational emissions of PM10, PM2.5, NOX
and/or VOCs, would also have a significant cumulatively considerable netincrease.
Projects that cause road intersections to operate at or below a level of service(LOS) E (analysis only required when the addition of peak-hour trips from theproposed project and the surrounding projects exceeds 2,000) and create a CO“hotspot” create a cumulatively considerable net increase of CO.
Impact Analysis
As discussed previously, construction and operational emissions would result insignificant direct impacts (Impacts AQ-1, AQ-2, and AQ-3). As phases ofconstruction become operational, later phases would continue to be constructed, thusresulting in combined daily construction and operational emissions from the project.Table 2.2-6 summarizes the cumulative unmitigated construction emissions with theunmitigated operational emissions that would overlap during the same period. Thiscumulative analysis provides information on which combination of operational andconstruction phases surpass the significance thresholds.

Subchapter 2.2 Air Quality
2.2-15
TABLE 2.2-6CONSTRUCTION + OPERATIONAL EMISSIONS
OverlappingProject Phases
ROG(lb/day)
NOx(lb/day)
CO(lb/day)
SO2
(lb/day)PM10
(lb/day)PM2.5
(lb/day)Phase 1 18.3 236.4 411.6 10.2 469.7 103.7Phases 1 & 4 39.2 262.5 448.7 10.2 447.8 100.6Phases 2 & 4 32.4 249.7 454.0 0.0 449.3 99.8Scenario A Operational 40.3 46.6 246.0 0.4 46.0 3.3Total A + Maximum Construction 79.4 309.1 700.0 10.5 495.3 107.0Phases 2 & 5 50.1 238.3 451.3 10.3 448.8 99.1Scenario B Operational 62.5 70.2 386.3 0.6 69.3 5.1Total B + 2&5 112.5 308.5 837.6 10.9 518.1 104.2Phases 3 & 5 34.0 240.6 454.7 10.3 449.6 99.2Scenario C Operational 122.2 145.2 772.5 1.2 140.1 10.1Total C + 3&5 156.2 385.7 1227.2 11.5 589.7 109.3Phase 3 16.9 207.7 411.0 10.2 442.2 97.3Scenario D Operational 151.8 174.1 931.1 1.5 169.1 12.8Total D + 3 168.7 381.7 1342.1 11.6 611.3 110.1Scenario E Operational 210.9 243.3 1290.8 2.0 236.4 17.1SLT 75 250 550 250 100 55Significant Impact? Yes Yes Yes No Yes NoNote: SLT = Significance Level Threshold; Italicized = Combined totals of operational and construction phases for theproject. Bold = Emissions exceeds SLT.
As show in Table 2.2-6, air emissions of ROG, NOX, CO, PM2.5, and PM10 would exceedthe County’s SLT when construction emissions are combined with operational emissionsafter opening of Phase 1 and with the exception of NOX and PM2.5, which are primarilyassociated with diesel-fueled engines, these emissions would continue to exceed theCounty SLT at full build-out.
Additionally, the County’s General Plan specifies the project area as a semi-rural area.The project would require a General Plan Amendment, a Specific Plan, and a Rezone inorder to implement the Master and Phase 1 Implementing Tentative Maps. Given theseuses are not currently permitted under the existing General Plan, the refinement in landuses would exceed and intensify the land uses planned for under the County GeneralPlan. Therefore, the project is considered inconsistent with the RAQS.
Implementation of the project would therefore result in a cumulatively considerable netincrease of criteria pollutants because the project conflicts with the SDAPCD RAQS,leads to long-term operational emissions that exceed the County SLT and as a result ofoperational and construction impacts occurring simultaneously. Thus, this impact wouldbe a significant impact (AQ-4).
2.2.2.4 Issue 4: Impacts to Sensitive Receptors
Guidelines for the Determination of Significance
Based on the County’s Guidelines for Determining Significance: Air Quality (San DiegoCounty 2007a), a significant impact would occur if the project would:
Subchapter 2.2 Air Quality
2.2-16
Place sensitive receptors near CO "hotspots" or create CO "hotspots" nearsensitive receptors.
Result in exposure to TACs resulting in a maximum incremental cancer riskgreater than one in one million without application of Toxics-Best AvailableControl Technology or a health hazard index greater than one.
Impact Analysis
Construction
Carbon Monoxide
Roadway segments and intersections are rated by a LOS standard developed as aprofessional industry standard to determine area traffic impacts. The LOS standardsrange from A to F depending on the amount of typical traffic flow measured in averagedaily traffic (ADT). The generally accepted regionwide goal is LOS D (or better).According to the Traffic Impact Analysis there are existing intersections that operate atLOS E or worse. Construction-related traffic is not anticipated to significantly impact theLOS rating. Additionally, construction trips are estimated to be below the 3,000 vehicletrips used by the County as a screening level for hotspot analysis and therefore are notrequired to be analyzed. The phased approach to development would also limit the dailyvolume of construction workers on local roads associated with the project. Thus,construction-related traffic is not expected to impact local intersections or cause anexceedance of the County of San Diego’s guidelines for assessing impacts to sensitivereceptors. This impact would be less than significant.
Toxic Air Contaminants—Diesel Particulate Matter
Construction of the project would result in short-term diesel exhaust emissions from on-site heavy-duty equipment. Particulate exhaust emissions from diesel-fueled engines(diesel PM or DPM) were identified as a TAC by CARB in 1998. Project constructionwould result in the generation of DPM emissions from the use of off-road dieselconstruction equipment required for mass site grading and earthmoving, trenching,asphalt paving, and other construction activities. Other construction-related sources ofDPM include material delivery trucks and construction worker vehicles; however, thesesources are minimal relative to construction equipment. Not all construction workervehicles would be diesel fueled and most DPM emissions associated with materialdelivery trucks and construction worker vehicles would occur off-site.
Generation of DPM from construction projects typically occur in a single area for a shortperiod. The dose (of TACs) to which receptors are exposed to is the primary factor usedto determine health risk. Dose is a function of the concentration of a substance orsubstances in the environment and the extent of exposure a person has with thesubstance. Dose is positively correlated with time, meaning that a longer exposureperiod to a fixed amount of emissions would result in a higher exposure level for theMaximally Exposed Individual (MEI) and higher health risks. According to the Office ofEnvironmental Health Hazard Assessment (OEHHA), health risk assessments (HRA),which are the tool used to determine the exposure of sensitive receptors to TACemissions, should be based on a 70-year exposure period, however, such assessmentsshould be limited to the period/duration of activities associated with the project. The

Subchapter 2.2 Air Quality
2.2-17
OEHHA Guidance Manual for Preparation of Health Risk Assessments (HRA Guidance)allows a nine-year exposure period to represent the first nine years of a child’s life, whichphysiologically and behaviorally result in higher exposure levels. However, the HRAGuidance does not support a HRA for exposures less than nine years. For cases whereexposure would last for less than nine years, OEHHA suggests assuming a minimumexposure of nine years.
Construction activities would occur for approximately 8 years (July 2014 to December2021) over the length of five phases. Grading, trenching, and asphalt paving operationstypically generate the most DPM emissions because these activities require the mostheavy-duty construction equipment. A health risk assessment was performed combiningall the annual exhaust PM10 emissions for the entire project calculated by CalEEMod andaveraging them over an 8-year period. The Maximally Exposed Individual (MEI) wasassumed to be the nearest sensitive receptor to the existing project site, which ismodeled to be located as close as one meter from the project site. In reality, theexposure of all sensitive receptors to construction-related emissions of DPM would vary,as construction activities would move between Phases 1 through 5 of the project.
Although some proposed residents are expected to begin living in the initially completedphases as construction starts on the next sequential phase, the construction activitiesare planned to occur at further distances from these residents. Therefore, constructionactivities would occur for a total length of 8 years with the exposure level changing asthe construction activities move further away.
The DPM emissions for the construction phases were estimated using exhaust PM10
values from CalEEMod annual emission estimates. These values were summed andaveraged over the length of the 8-year project. The resulting exhaust PM10 value wasthen converted into grams per second and input into the AERSCREEN modelingprogram, which calculates pollutant concentrations from various types of sources. Theassessment considers exposure via inhalation.
Using guidance provided by OEHHA, maximum diesel PM concentrations and cancerrisks were calculated. Health risks assumptions are detailed in the Air Quality TechnicalReport contained in Appendix E. It was calculated that the maximum annual DPMconcentration would be 0.1910 µg/m3 and would occur at 431 meters from the modeledarea. This value would represent a cancer risk of 6.95 in one million. Therefore, whilethe modeled cancer risks would exceed the County’s significance threshold of one inone million, the project design incorporated the use of best available controltechnologies (BACT), i.e., Tier II or better equipment. The County’s threshold for projectsimplementing BACT is 10 in 1 million, which the project would comply with. Thus, theproject’s construction-related TAC impacts to sensitive receptors would be less thansignificant.
Additionally, DPM has chronic (i.e., long-term) non-cancer health impacts. The chronicnon-cancer inhalation hazard indices for the project were calculated by dividing themodeled annual average concentrations of the DPM by the Reference Exposure Level(REL). The OEHHA has recommended an ambient concentration of 5 µg/m3 as thechronic inhalation REL for DPM.
The REL is the concentration at or below which no adverse health effects are anticipatedand this is referenced as the acute, 8-hour, and chronic hazard index. The resulting

Subchapter 2.2 Air Quality
2.2-18
value is 0.0382 µg/m3. This DPM concentration for the project is below the REL and isunder the County’s more stringent significance threshold of 1 for non-cancer healthimpacts. Therefore, the non-cancer health impacts associated with the project’sconstruction-related TAC impacts to sensitive receptors would be less than significant.
Crystalline Silica
Crystalline silica was evaluated for its effect on existing residents, future projectoccupants, and construction workers. Overexposure to respirable crystalline silica cancause silicosis which is a disabling, nonreversible and sometimes fatal lung disease.Crystalline silica is a basic component of soil, granite, and most other types of rock(Occupational Safety & Health Administration [OSHA] 2012). Silicosis is considered anoccupational hazard that is primarily limited to construction workers and miners.
The following are sources of crystalline silica:
Sandblasting for surface preparation
Crushing and drilling rock and concrete
Masonry and concrete work/building and road construction and repair
Mining/tunneling/demolition work.
There are currently no adopted CEQA significance thresholds for environmentalexposure of nearby receptors to airborne crystalline silica generated by constructionactivities. In a literature search, a study was produced by the SCAQMD that involvedcrystalline silica monitoring in Duarte and Azusa, California (South Coast Air QualityManagement District [SCAQMD] 2008) near a rock quarry operation. The atmosphericsampling for crystalline silica is based on sampling particulate matter, specifically PM4.OEHHA defines an inhalation REL of 3 µg/m3 for crystalline silica as the level belowwhich no adverse health effect would occur.
The Azusa Rock Quarry is permitted by the SCAQMD to specifically operate aggregatecrushing and screening at no more than 900,000 tons per month (which equates to37,500 tons per day) or 10.8 million tons per year (City of Azusa 2010); this includes a 6-day work week and operational hours between 6 A.M. and 10 P.M. The total size of themine is a proposed 270 acres, with a 190-acre disturbance footprint. The maximum 24-hour reported value in the SCAQMD study was 1.3 µg/m3 and the average was0.5 µg/m3; therefore, the results of the SCAQMD study show levels lower than the REL.
The proposed project involves construction grading of five individual phases of thefollowing sizes: 121.6 acres for Phase 1, 85.1 acres for Phase 2, 225.8 acres forPhase 3, 60.3 for Phase 4, and 115.2 for Phase 5. It has been conservatively assumedeach of these phases would involve grading of 50,000 tons per day of material, with thetotal movement of material, including aggregate rock, to be 4 million tons. The aggregaterock quantities are estimated to be approximately 15,000 tons per day (10,000 cy * 1.5tons/cy = 15,000 tons), based on the blasting analysis. The project has a work scheduleof 5 days a week, 8 hours a day. Thus, the project would not exceed the actual orpermitted aggregate mining operations assessed at the Azusa Rock Quarry.

Subchapter 2.2 Air Quality
2.2-19
The levels of crystalline silica resulting from the rock quarry operations at the AzusaRock Quarry are expected to be higher than the project given the lower level of activityand lower daily and total aggregate handling associated with the project. It can then beinferred that levels due to construction of the proposed project would be less than thoseassociated with the studied Azusa Rock Quarry, therefore, in the absence of additionalempirical evidence specific to construction projects, it is anticipated the project wouldgenerate concentrations of crystalline silica lower than the OEHHA REL of 3 µg/m3.Thus, construction and blasting activities from the project are expected to have impactsthat are less than significant due to crystalline silica.
Operation
Carbon Monoxide
Localized CO concentration is a direct function of motor vehicle activity at signalizedintersections (e.g., idling time and traffic flow conditions), particularly during peakcommute hours and meteorological conditions. Under specific meteorological conditions(e.g., stable conditions that result in poor dispersion), CO concentrations may reachunhealthy levels with respect to local sensitive land uses. A CO “hot spot” occurs whenlocalized CO concentrations exceed the NAAQS or CAAQS. As a result, the Countyrecommends analysis of CO emissions at a local as well as a regional level.
Following construction of the project, the project-related traffic would contribute vehicletrips on existing and future intersections. The addition of these trips could degrade theLOS of intersections to a level where a CO hotspot could occur. The County’s Air QualityGuidelines state that intersections that are likely to result in a CO hotspot would operateat a LOS E or worse and would include peak-hour trips exceeding 3,000 vehicle trips.
Another appropriate procedure for evaluating CO hot spots is provided in the proceduresand guidelines contained in the Caltrans Transportation Project-Level Carbon MonoxideProtocol (Caltrans Protocol) to determine whether a project poses the potential for a COhotspot (UCD ITS 1997). Similar to the County screening criteria, the Caltrans Protocolindicates projects may worsen air quality if they worsen traffic flow, defined as increasingaverage delay at signalized intersections operating at LOS E or F or causing anintersection that would operate at LOS D or better without the project, to operate atLOS E or F. Unsignalized intersections are not evaluated as they are typically signalizedas volumes increase and delays increase. The Caltrans Protocol also provides guidancefor preparing a detailed CO hotspot analysis.
Project-related traffic would contribute vehicle trips to existing and future intersections. Theaddition of these trips could degrade the LOS of intersections to a level where a COhotspot could occur. The County’s Air Quality Guidelines state that intersections that arelikely to result in a CO hotspot would operate at a LOS E or worse and would includepeak-hour trips exceeding 3,000 vehicle trips. This analysis included studying trafficvolumes in both Scenario A and the Build-out Scenarios in order to assess varyingdegrees of CO under two different levels of development intensity. It was determined thatthere was one signalized intersection operating at LOS E or worse, exceeding 3,000 trips;this was the SR-76/Old River Road/E. Vista Way intersection. Under Scenario A, thisintersection has 3,074 trips and under the Build-out Scenario it has 3,195 trips. Thesevolumes surpass the County’s threshold for a hot spot analysis and therefore a detailedanalysis was done for the intersection.

Subchapter 2.2 Air Quality
2.2-20
The CALINE4 model was used for inputting the trip volumes from the Traffic ImpactStudy and the emission factors for idling vehicles, which were taken from the 2011EMFAC database. Table 2.2-7 shows the PM volumes that were modeled in the hotspot analysis:
TABLE 2.2-7MAXIMUM CO CONCENTRATIONS AT
SR-76/OLD RIVER ROAD/EAST VISTA WAY
Scenario
Peak HourVolumes
PM
1-HourCOppm
1-HourCO Standard
CAAQS/NAAQS
8-HourCOppm
8-HourCO Standard
CAAQS/NAAQS
Scenario A 3,074 6.520/35
3.99/9Scenario A-E
(Build-out)3,195 6.6 2.16
CO = carbon monoxide; CAAQS = California Ambient Air Quality Standards;NAAQS = national ambient air quality standards
The ambient concentration of CO at this intersection would be 3.5 ppm. The hot spotanalysis showed that the increases of CO due to the project would be 3.0 ppm forScenario A and 3.1 for the Build-out Scenario. The combined concentrations of 6.5 and6.6 ppm are less than the CAAQS and NAAQS threshold of 20 and 35 ppm,respectively. In order to calculate the 8-hour concentration, the 1-hour value wasmultiplied by a conversion factor of 0.6, as recommended in the Protocol (UCD ITS1997). This resulted in a value of 3.9 ppm (Scenario A) and 4 ppm (Build-out), which isalso below the standard threshold of 9 ppm. Therefore, the project would not result in asignificant increase in CO, and the impact would be less than significant.
PM10
Guidance for assessing localized impacts from PM10 generated by traffic is provided bythe Federal Highway Administration (FHWA) in the Transportation Conformity Guidancefor Quantitative Hot-spot Analyses in PM2.5 and PM10 Nonattainment and MaintenanceAreas. Based on this guidance, projects of air quality concern include:
A project on a new highway or expressway that serves a significant volume of
diesel truck traffic, such as facilities with greater than 125,000 annual average
daily traffic (AADT) and 8 or more of such AADT is diesel truck traffic;
New exit ramps and other highway facility improvements to connect a highway or
expressway to a major freight, bus, or intermodal terminal;
Expansion of an existing highway or other facility that affects a congested
intersection (operated at LOS D, E, or F) that has a significant increase in the
number of diesel trucks; and,
Similar highway projects that involve a significant increase in the number of
diesel transit busses and/or diesel trucks.

Subchapter 2.2 Air Quality
2.2-21
The project does not meet any of the thresholds for projects of air quality concern basedon the following:
The project is not a highway improvement project and the volume on I-15 in thisarea is less than 125,000 AADT (Caltrans 2011).
Based on the Caltrans traffic volume data for I-15 between Deer Springs Roadand SR-76, the diesel truck traffic, the primary source of diesel exhaust,represent approximately 7 percent of the total traffic volume.
The project would not create new freeway ramps that would connect to a majorfreight, bus, or intermodal terminal.
The project is primarily residential and would not generate a substantial increasein diesel trucks or transit busses.
The project would result in the degradation of the intersection at SR-76/OldRiver/East Vista Way, SR-76/Olive Hill Road/Camino del Rey, and Old Highway395/SR-76; however, based on the I-15 traffic data, roadways in the project areaare comprised of less than 8 percent diesel trucks and the project would notsubstantially increase the number of diesel trucks.
Therefore, the proposed project would not result in adverse concentrations of localizedPM10 emissions and this would be a less than significant impact.
2.2.2.5 Issue 5: Odor Impacts
Guidelines for Determining Significance
Based on the County’s Guidelines for Determining Significance: Air Quality (San DiegoCounty 2007a), a significant impact would occur if the project would generateobjectionable odors or place sensitive receptors next to existing objectionable odors.
Impact Analysis
The project’s WRF is designed to include measures to reduce any potential odor impactsto the surrounding areas. Pursuant to Section 6300 of the County of San Diego ZoningOrdinance, odor control units would be designed to treat odorous air from withintreatment structures so not to emit matter causing unpleasant odors which areperceptible by the average person at or beyond the lot line of the WRF. Foul air from theplant headworks would be treated on-site prior to discharge. There are multipletechnologies that are available to treat odors which are generated within a treatmentplant. Some technologies are most efficient at reducing only specific odor generatingcompounds (for example wet scrubbers are efficient at the removal of H2S only). Theproposed means of foul air treatment would be activated carbon towers.
Activated charcoal or carbon has a large internal surface area (lots of micro-pores)which creates adsorption of odor. As contaminated water or air passes through anactivated carbon filter (or tower), the carbon traps a wide range of impurities andcontaminants, catching them in the carbon filter. Activated carbon filters have manyapplications in medicine, water and air filtration. In wastewater treatment plants, these

Subchapter 2.2 Air Quality
2.2-22
towers are used to trap the volatile organic compounds that are corrosive or odorous.These active carbon adsorption units provide excellent treatment of highly hydrophobicodorants (90–99 percent) (Lebrero et al. 2011).
With the inclusion of the carbon towers, the project would not result in a substantialincrease in odor levels at nearby sensitive receptors. Implementation of the projectwould result in less than significant odor impacts
2.2.3 Cumulative Impact Analysis
Because air quality is a regional issue, the cumulative study area for air quality impactscannot be limited to a defined localized area, but rather include the SDAB as a whole.Therefore, impacts to regional plans and policies, such as the RAQS and SIPs, must beconsidered as part of the cumulative analysis. Additionally, a project would have asignificant cumulative impact on air quality if it would result in a cumulativelyconsiderable net increase of any criteria pollutant for which the SDAB is listed asnonattainment under an applicable CAAQS. As previously stated, the SDAB is currentlyclassified as a federal nonattainment area for ozone and a state nonattainment area forozone, PM10, and PM2.5.
Additionally, according to the County’s guidelines, projects that cause road intersectionsto operate at or below a LOS E and create a CO “hotspot” create a cumulativelyconsiderable net increase of CO. A detailed CO hotspot analysis is required whensignalized intersections result in a 2,000 trip increase between the existing conditionsand the cumulative plus project plus the existing conditions.
There are three intersections, listed in Table 2.2-8, that result in an increase of over2,000 trips. These three intersections were modeled in CALINE4 in order to determine ifthe CO emissions exceeded the thresholds.
TABLE 2.2-8TRIP VOLUMES FOR SIGNALIZED INTERSECTIONS WITH A
CHANGE OVER 2,000 ADT
IntersectionExisting
Conditions
Cumulative+Project+Existing Change
SR-76/Old River/E. Vista Way 3,054 5,601 2,547SR-76/Olive Hill Road/Camino del Rey 2,948 5,668 2,720
Old Highway 395/SR-76 1,947 4,031 2,084
NOTE: Bold numbers are those that exceed the County’s threshold of 2,000.In this cumulativeanalysis, the 2022 emission factors at a 5-miles-per-hour (mph) velocity for a combinedvehicle mix were used for the three intersections. As shown in Table 2.2-9, the 1-hourand the 8-hour concentrations of CO at these intersections are below the CAAQS andNAAQS thresholds.

Subchapter 2.2 Air Quality
2.2-23
TABLE 2.2-9MAXIMUM CO CONCENTRATIONS AT SR-76/OLD RIVER ROAD/EAST VISTA WAY
Scenario
PeakHour
Volumes
1-hourCO
(ppm)
1-hour COStandardCAAQS/NAAQS
8-hourCO
(ppm)
8-hour COStandardCAAQS/NAAQS
SR-76/Old River/East Vista Way 5,601 6.9
20/35
4.14
9/9SR-76/Olive Hill Road/Camino del Rey 5,668 8 4.8
Old Highway 395/SR-76 4,031 7.5 4.5
CO = carbon dioxideppm = parts per millionCAAQS = California Ambient Air Quality StandardNAAQS = National Ambient Air Quality Standard
The ambient concentration of CO at these intersections is 3.5 ppm. The Hot Spotanalysis showed that the increases of CO due to the project would be 3.4 ppm at SR-76/Old River/East Vista Way, 4.5 ppm at SR-76/Olive Hill Road/Camino del Rey, and 4ppm at Old Highway 395/SR-76. The combined concentrations of 6.9, 8.0, and 7.5 ppmare less than the CAAQS threshold of 20 ppm and the NAAQS threshold of 35 ppm. Inorder to calculate the 8-hour concentration, the 1-hour value was multiplied by aconversion factor of 0.6, as recommended in the Caltrans Transportation Project-LevelCarbon Monoxide Protocol (the Protocol) (UCD ITS 1997). This results in values of4.14, 4.8, and 4.5 ppm which are also below the standard state and national threshold of9.0 ppm. Therefore, no cumulatively considerable impacts associated with CO wouldresult from implementation of the project. Cumulative impacts to sensitive receptorswould be less than significant.
As discussed in subchapter 2.2.2.1 under direct impacts, because the project includesdensities not currently described in the General Plan, the project is not represented inSANDAG growth forecasts nor included in the current RAQS or SIP. Because the entireair basin is affected by project level impacts, the project would result in a cumulativelyconsiderable net increase in emissions, representing a cumulatively significantimpact. (Impact AQ-5).
Additionally, as discussed in subchapter 2.2.2.3 direct operational emissions andconstruction and operational emissions occurring simultaneously would result in asignificant impact). In combination with the emissions of pollutants from other proposedprojects or reasonably foreseeable future projects, impacts would be cumulativelysignificant (AQ-6).
2.2.4 Significance of Impacts Prior to Mitigation
The following significant impacts related to air quality would occur with projectimplementation:
Impact AQ-1: Implementation of the project would conflict with and exceed theassumptions used to develop the current RAQS.
Impact AQ-2: Construction emissions are projected to exceed the applicable SLTs forPM10 and NOX.

Subchapter 2.2 Air Quality
2.2-24
Impact AQ-3: Operational emissions are projected to exceed the applicable SLTs forROG, CO, and PM10.
Impact AQ-4: The phasing of project construction would result in a cumulativelyconsiderable net increase of criteria pollutants as a result of operationaland construction impacts occurring simultaneously.
Impact AQ-5: Implementation of the project would result in a cumulativelyconsiderable increase in emissions conflicting with the current RAQS.
Impact AQ-6: Operational and construction impacts associated with the project’sphasing of construction, in combination with the emissions from otherproposed projects or reasonably foreseeable future projects, would becumulatively significant.
2.2.5 Mitigation
The following mitigation measure is required for Impacts AQ-1 and AQ-5.
M-AQ-1: The County shall provide a revised housing forecast to SANDAG toensure that any revisions to the population and employment projects usedin updating the RAQS and the SIP will accurately reflect anticipatedgrowth due to the proposed project.
The following mitigation measures are required for Impacts AQ-2, AQ-4 and AQ-6.
M-AQ-2: The following dust control measures will be implemented:
• A “trackout” gravel bed shall be installed at every access point used
during construction or at every location off-road equipment transitions
to paved surfaces. The gravel bed shall be 25 feet long and the width
of the access point/roadway.
• Chemical stabilizers shall be applied annually to all unpaved
storage/maintenance yards, parking areas, and unpaved roads.
• Speeds will be limited to 15 miles an hour or less and shall be
randomly verified by radar enforcement.
M-AQ-3: The following measure shall be implemented to reduce NOX emissionlevels during blasting days:
All construction activity shall be halted during any blasting operation andonly equipment required as part of the blasting operations, e.g., drill rig orequipment used to excavate and remove material, shall operate on thesame day as blasting occurs during the construction of Phase 4, given theexceedance of NOX during this phase.
M-AQ-4: The following measure shall be implemented to reduce PM10 and PM2.5
emissions levels during rock crushing days:

Subchapter 2.2 Air Quality
2.2-25
Any permit conditions for crushing equipment shall be followed. Materialshall be pre-watered prior to loading into the crusher as required tocomply with permit and opacity emission limits. The crusher’s emissionsopacity shall be monitored once every 30 days of operation and anopacity limit of 20 percent as average over a six-minute period shall bemaintained. Water shall be applied to crushed material to prevent dustplumes.
M-AQ-5: The following measure shall be implemented to reduce PM10 and PM2..5
emissions levels during blasting:
Blasting activities shall adhere to permitting requirements by theCalifornia Division of Industrial Safety or the best management practicesfor control of fugitive dust from construction and demolition for blasting,such as wet drilling and wetting the surface area prior to blasting.
The following mitigation measures are required for Impacts AQ-3 and AQ-6.
M-AQ-6: The project applicant/phase developer shall develop a Green CleaningProduct education program consisting of:
1) Provision of educational materials in rental offices, leasing spacesand/or on websites, on low ROG/VOC consumer products for plannedhouseholds and institutional consumers;
2) Educational materials shall be provided for detergents; cleaningcompounds; polishes; floor finishes; cosmetics; personal careproducts; home, lawn and garden products; disinfectants; sanitizers;aerosol paints; automotive specialty products; low ROG/VOC paintsand architectural coatings; and low emission landscape equipment.
3) Educational materials will include information on the importance ofrecycling and purchasing recycled material.
M-AQ-7: Promote and encourage ride share and alternative forms oftransportation.
2.2.6 Conclusion
2.2.6.1 Consistency with RAQS/SIP
Implementation of the project would conflict with the existing San Diego RAQS andapplicable SIP because the density proposed is not consistent with current land useplans and SANDAG housing forecasts (Impacts AQ-1 and AQ-4). This represents asignificant impact. M-AQ-1 requires that the County provide a revised housing forecastto SANDAG to ensure that any revisions to the population and employment projects. Theprovision of housing information would assist SANDAG in revising the housing forecast;however, until the anticipated growth is included in the emission estimates of the RAQSand the SIP, the direct and cumulative impacts (Impacts AQ-1 and AQ-4)) would remainsignificant and unavoidable.

Subchapter 2.2 Air Quality
2.2-26
2.2.6.2 Construction Emissions
As shown in Table 2.2-4, criteria pollutant emissions would exceed the SLTs for PM10
and NOX (Impact AQ-2). Construction emissions were calculated taking the mitigationmeasures M-AQ-2 through M-AQ-5 into account. The results are summarized inTable 2.2-10.
TABLE 2.2-10MITIGATED CONSTRUCTION EMISSIONS (ON- AND OFF-SITE)
(pounds per day)
Construction Phase1
ROG NOX CO SO2 PM10 PM2.5
Phase 1 13.6 175.9 425.5 10.2 49.4 14.5Phase 1/Phase 4 38.6 177.5 113.7 0.2 27.3 16.2Phase 4/Phase 2 33.1 202.4 466.1 10.3 52.5 16.3Phase 2/Phase 5 52.1 238.3 474.2 10.3 52.8 16.4Phase 5/Phase 3 36.14 203.7 474.0 10.3 53.6 16.5Maximum Daily Emissions 52.1 238.3 474.2 10.3 53.6 16.5SLT 75 250 550 250 100 55Significant Impact? No No No No No No
ROG = reactive organic gases; NOX = oxides of nitrogen; CO = carbon monoxide; SO2 = sulfur dioxide;PM10 = suspended particulate matter; PM2.5 = fine particulate matter; SLT = Screening Level Threshold1Blasting would occur during the grading phase of all construction phases.
Implementation of mitigation measure M-AQ-2 requires additional dust-control measuresbeyond standard dust and emission controls during grading operations. M-AQ-3 requiresstopping construction activities during blasting operations. M-AQ-4 requires pre-wateringof materials prior to loading into the crusher and to apply water to crushed material toprevent dust plumes. M-AQ-5 requires best management practices for control of fugitivedust from blasting materials. As shown in Table 2.2-10, implementation of thesemitigation measures would reduce construction related emissions to below the SLTs.Therefore, direct construction emissions would be a less than significant impact toregional air quality.
Construction-related traffic on local roads would not contribute traffic volumes tointersections that would cause a CO hotspot. Thus, construction-related impacts onlocalized CO concentrations would be considered less than significant.
The modeled cancer risks would not exceed the County’s significance threshold of 1 in 1million and the non-cancer health impacts would not exceed the REL or Countythresholds; therefore, the project’s construction-related TAC impacts to sensitivereceptors would be less than significant.
Overall, implementation of M-AQ-2 through M-AQ-5 would reduce direct and cumulativesignificant construction related impacts to less than significant.

Subchapter 2.2 Air Quality
2.2-27
2.2.6.3 Operational Emissions
Implementation of the project would result in traffic and area source emissions greaterthan the applicable thresholds for ROG, CO, and PM10 (Impact AQ-3). CO emissions inexcess of the County’s SLT are not considered significant as the project would not resultin a CO hot spot. ROG and PM10 emissions in excess of the County’s SLT areconsidered significant and unavoidable. The primary source of ROG emission would befrom consumer products, such as cleaning products and solvents, and the primarysource of PM10 would be from vehicles tire and brake wear which increases with VMTand would not be improved with vehicle efficiencies.
Operational emissions were calculated with the incorporation of the design considerationand mitigation measures described above. Mitigated operational emissions aresummarized in Table 2.2-11. As shown, emissions of ROG, CO, and PM10 would remaingreater than the SLT for these pollutants despite incorporation of all of the project designconsiderations. There is an approximate 2 percent reduction in ROG and CO and anapproximate 2.5 percent reduction in PM10 attributed to mitigation and project designmeasures reflected in CalEEMod. These pollutants cannot be fully mitigated as thesource is principally from motor vehicle and area sources that are dependent onconsumer behavior; however, mitigation measure M-AQ-6 includes the Green CleaningProduct education program, which will partially mitigate for ROG emissions over time assubstantial ROG emissions result from consumer products. Additionally, M-A-7 requiresthe promotion of ridesharing and alternate forms of transportation, as the ROG, CO, andPM10 emissions are primarily from motor vehicles which are associated with occupantsof the project area commuting to and from the project site. However, given thatcommuting and consumer behavior cannot be regulated, and the effects of thesemitigation measures cannot be quantified direct and cumulative operational relatedimpacts (Impacts AQ-3, AQ-4 and AQ-6) would remain significant and unavoidable.
In accordance with Section 15126.6(a), Chapter 4.0 of the EIR includes an analysis ofalternatives to the proposed project that would reduce or avoid significant impacts.Table 4-2 shows those alternatives that would reduce significant and unavoidable airquality impacts associated with the project. Refer to Chapter 4.0 for a detailed analysisof the alternatives.

Subchapter 2.2 Air Quality
2.2-28
TABLE 2.2-11MITIGATED OPERATIONAL EMISSIONS
(pounds per day)
Operational Scenario/Emissions Source ROG NOX CO SO2 PM10 PM2.5
Scenario A Operations1
Mobile Sources 21.05 45.21 211.52 0.38 44.26 2.66
Area Sources2
18.8 0.35 29.66 0 0.58 0.58
Total Scenario A 39.85 45.56 241.18 0.38 44.84 3.24
Scenario B Operations
Mobile Sources 31.64 67.96 317.92 0.58 66.53 4
Area Sources 30.25 0.71 61.09 0 0.96 0.95
Total Scenario B 61.89 68.67 379.01 0.58 67.49 4.95
Scenario C Operations
Mobile Sources 66.93 140.93 657.64 1.17 134.75 8.15
Area Sources 54.03 1.16 100.19 0.01 1.73 1.72
Total Scenario C 120.96 142.09 757.83 1.18 136.48 9.87
Scenario D Operations
Mobile Sources 80.02 168.93 788.54 1.4 162.04 9.79
Area Sources 70.31 1.44 124.93 0.01 2.79 2.76
Total Scenario D 150.33 170.37 913.47 1.41 164.83 12.55
Scenario E Build-out Operations
Mobile Sources 111.58 236.25 1,103.22 1.97 227.42 13.73
Area Sources 97.32 1.87 162.78 0.01 3 2.98
Total Scenario E Build-out 208.9 238.12 1,266 1.98 230.41 16.71
SLT 75 250 550 250 100 55
Significant Impact? Yes No Yes No Yes No
ROG =reactive organic gases; NOX = oxides of nitrogen; CO = carbon monoxide; SO2 = sulfur dioxide;PM10 = suspended particulate matter; PM2.5 = fine particulate matter; SLT = Screening Level Threshold1Emissions shown represent the maximum daily motor vehicle- or area-source emissions that would occur
from summertime operations calculated by CalEEMod.2The area sources calculation includes the natural gas energy calculations from CalEEMod.
Bold data indicate a threshold has been exceeded.
2.2.6.3 Cumulative Emissions
As the project would result in a cumulatively significant impact, the applicant shallimplement mitigation measures described in subchapter 2.2.5 to reduce constructionemissions.
Table 2.2-12 includes the combination of the mitigated construction and operationemissions would occur at the same point in time. This cumulative analysis provides asummary of which combination of operational and constructional phases surpass thesignificance thresholds even after application of all design considerations and mitigationmeasures previously identified are included.

Subchapter 2.2 Air Quality
2.2-29
TABLE 2.2-12MITIGATED CONSTRUCTION + OPERATIONAL EMISSIONS
OverlappingProject Phases
ROG(lb/day)
NOX
(lb/day)CO
(lb/day)SO2
(lb/day)PM10
(lb/day)PM2.5
(lb/day)Phase 1 13.6 175.9 425.5 10.2 49.4 14.5Phases 1 & 4 38.6 201.5 466.1 10.2 27.3 11.4Phases 2 & 4 33.1 202.4 474.2 10.3 29.6 11.5Scenario A Operational 39.9 45.6 241.2 0.4 44.8 3.2Total A + 2 & 4 73.0 247.9 715.4 10.6 74.4 14.7Phases 2 & 5 52.1 203.7 474.0 10.3 29.9 11.6Scenario B Operational 61.9 68.7 379.0 0.6 67.5 5.0Total B + 2 & 5 114.0 272.4 853.0 10.8 97.4 16.5Phases 3 & 5 36.1 206.0 477.4 10.3 30.7 11.7Scenario C Operational 121.0 142.1 757.8 1.2 136.5 9.9Total C + 3 & 5 157.0 348.1 1235.2 11.5 167.2 21.5Phase 3 14.1 173.2 432.0 10.2 23.1 9.5Scenario D Operational 150.3 170.4 913.5 1.4 164.8 12.6Total D + 3 164.4 343.6 1345.4 11.6 187.9 22.1Scenario E Operational 208.9 238.1 1266.0 2.0 230.4 16.7SLT 75 250 550 250 100 55Significant Impact? Yes No Yes No Yes NoNote: SLT = Significance Level Threshold; Italicized = Combined totals of operational and constructionphases for the project. Bold = Emissions exceeds SLT.
As discussed previously, even with incorporation of project design considerations andmitigation measures, these pollutants cannot be fully mitigated as the source isprincipally from motor vehicle and area sources that are dependent on consumerbehavior. However, given that commuting and consumer behavior cannot be regulated,cumulative impacts would remain significant and unavoidable.

Subchapter 2.2 Air Quality
2.2-30
TABLE 2.2-1AMBIENT AIR QUALITY STANDARDS
PollutantAveraging
TimeCalifornia Standards1 Federal Standards2
Concentration3 Method4 Primary3,5 Secondary3,6 Method7
Ozone1 Hour
0.09 ppm(180 µg/m3) Ultraviolet
Photometry
– Same asPrimary
Standard
UltravioletPhotometry
8 Hour0.07 ppm
(137 µg/m3)0.075 ppm(147 µg/m3)
RespirableParticulate
Matter(PM10)
24 Hour 50 µg/m3
Gravimetric orBeta
Attenuation
150 µg/m3
Same asPrimary
Standard
InertialSeparation and
GravimetricAnalysis
AnnualArithmetic
Mean20 µg/m3 –
FineParticulate
Matter(PM2.5)
24 Hour No Separate State Standard 35 µg/m3
Same asPrimary
Standard
InertialSeparation and
GravimetricAnalysis
AnnualArithmetic
Mean12 µg/m3
Gravimetric orBeta
Attenuation15 µg/m3
CarbonMonoxide
(CO)
1 Hour20 ppm
(23 mg/m3)Non-dispersive
InfraredPhotometry
35 ppm(40 mg/m3)
–
Non-dispersiveInfrared
Photometry
8 Hour9.0 ppm
(10 mg/m3)9 ppm
(10 mg/m3)–
8 Hour(Lake
Tahoe)
6 ppm(7 mg/m3)
– –
NitrogenDioxide(NO2)
8
1 Hour0.18 ppm
(339 µg/m3) Gas PhaseChemi-
luminescence
100 ppb(188 µg/m3)
–Gas Phase
Chemi-luminescence
AnnualArithmetic
Mean
0.030 ppm(57 µg/m3)
53 ppb(100 µg/m3)
Same asPrimary
Standard
SulfurDioxide(SO2)
9
1 Hour0.25 ppm
(655 µg/m3)
UltravioletFluorescence
75 ppb(196 µg/m3)
–
UltravioletFluorescence;
Spectrophotometry
(PararosanilineMethod)
3 Hour – –0.5 ppm
(1300 µg/m3)
24 Hour0.04 ppm
(105 µg/m3)
0.14 ppm(for certain
areas)9–
AnnualArithmetic
Mean–
0.030 ppm(for certain
areas)9–
Lead10,11
30 DayAverage
1.5 µg/m3
AtomicAbsorption
– –
High VolumeSampler and
AtomicAbsorption
CalendarQuarter
–1.5 µg/m3
(for certainareas)11 Same as
PrimaryStandardRolling
3-MonthAverage
– 0.15 µg/m3
VisibilityReducingParticles12
8 HourSee footnote
12
BetaAttenuation
andTransmittancethrough Filter
TapeNo Federal Standards
Sulfates 24 Hour 25 µg/m3 Ion Chroma-tography
HydrogenSulfide
1 Hour0.03 ppm(42 µg/m3)
UltravioletFluorescence
VinylChloride10 24 Hour
0.01 ppm(26 µg/m3)
Gas Chroma-tography
See footnotes on next page.
SOURCE: State of California 2012a.

Subchapter 2.2 Air Quality
2.2-31
TABLE 2.2-1AMBIENT AIR QUALITY STANDARDS
(continued)
ppm = parts per million; ppb = parts per billion; µg/m3 = micrograms per cubic meter; – = not applicable.
1California standards for ozone, carbon monoxide (except 8-hour Lake Tahoe), sulfur dioxide (1 and 24 hour),nitrogen dioxide, particulate matter (PM10, PM2.5, and visibility reducing particles), are values that are not to beexceeded. All others are not to be equaled or exceeded. California ambient air quality standards are listed in theTable of Standards in Section 70200 of Title 17 of the California Code of Regulations.
2National standards (other than ozone, particulate matter, and those based on annual arithmetic mean) are not tobe exceeded more than once a year. The ozone standard is attained when the fourth highest 8-hourconcentration measured at each site in a year, averaged over three years, is equal to or less than the standard.For PM10, the 24-hour standard is attained when the expected number of days per calendar year with a 24-houraverage concentration above 150 µg/m3 is equal to or less than one. For PM2.5, the 24-hour standard is attainedwhen 98 percent of the daily concentrations, averaged over three years, are equal to or less than the standard.Contact the U.S. EPA for further clarification and current national policies.
3Concentration expressed first in units in which it was promulgated. Equivalent units given in parentheses arebased upon a reference temperature of 25°C and a reference pressure of 760 torr. Most measurements of airquality are to be corrected to a reference temperature of 25°C and a reference pressure of 760 torr; ppm in thistable refers to ppm by volume, or micromoles of pollutant per mole of gas.
4Any equivalent measurement method which can be shown to the satisfaction of the Air Resources Board to giveequivalent results at or near the level of the air quality standard may be used.
5National Primary Standards: The levels of air quality necessary, with an adequate margin of safety to protect thepublic health.
6National Secondary Standards: The levels of air quality necessary to protect the public welfare from any known oranticipated adverse effects of a pollutant.
7Reference method as described by the U.S. EPA. An “equivalent method” of measurement may be used but musthave a “consistent relationship to the reference method” and must be approved by the U.S. EPA.
8To attain the 1-hour national standard, the 3-year average of the annual 98th percentile of the 1-hour dailymaximum concentrations at each site must not exceed 100 ppb. Note that the national standards are in units ofparts per billion (ppb). California standards are in units of parts per million (ppm). To directly compare thenational standards to the California standards the units can be converted from ppb to ppm. In this case, thenational standards of 53 ppb and 100 ppb are identical to 0.053 ppm and 0.100 ppm, respectively.
9On June 2, 2010, a new 1-hour SO2 standard was established and the existing 24-hour and annual primarystandards were revoked. To attain the 1-hour national standard, the 3-year average of the annual 99th percentileof the 1-hour daily maximum concentrations at each site must not exceed 75 ppb. The 1971 SO2 nationalstandards (24-hour and annual) remain in effect until one year after an area is designated for the 2010 standard,except that in areas designated nonattainment for the 1971 standards, the 1971 standards remain in effect untilimplementation plans to attain or maintain the 2010 standards are approved.
Note that the 1-hour national standard is in units of parts per billion (ppb). California standards are in units ofparts per million (ppm). To directly compare the 1-hour national standard to the California standard the units canbe converted to ppm. In this case, the national standard of 75 ppb is identical to 0.075 ppm.
10The ARB has identified lead and vinyl chloride as ‘toxic air contaminants’ with no threshold level of exposure foradverse health effects determined. These actions allow for the implementation of control measures at levelsbelow the ambient concentrations specified for these pollutants.
11The national standard for lead was revised on October 15, 2008 to a rolling 3-month average. The 1978 leadstandard (1.5 μg/m3 as a quarterly average) remains in effect until one year after an area is designated for the2008 standard, except that in areas designated nonattainment for the 1978 standard, the 1978 standard remainsin effect until implementation plans to attain or maintain the 2008 standard are approved.
12In 1989, the ARB converted both the general statewide 10-mile visibility standard and the Lake Tahoe 30-milevisibility standard to instrumental equivalents, which are “extinction of 0.23 per kilometer” and “extinction of 0.07per kilometer” for the statewide and Lake Tahoe Air Basin standards, respectively.

2.2-32
TABLE 2.2-2 AMBIENT AIR QUALITY SUMMARY—SAN DIEGO AIR BASIN
Pollutant Average
Time
California Ambient Air
Quality Standardsa
Attain-ment
Status
National Ambient Air
Quality Standardsb
Attain-ment
Statusc
Maximum Concentration Number of Days Exceeding State Standard Number of Days Exceeding National Standard
2007 2008 2009 2010 2011 2007 2008 2009 2010 2011 2007 2008 2009 2010 2011
O3 1 hour 0.09 ppm N N/A N/A 0.134 0.139 0.119 0.107 0.114 21 18 8 7 5 1 2 0 0 0
O3 8 hours 0.07ppm N 0.08 ppm (1997) N 0.092 0.110 0.098 0.088 0.093 50 69 47 21 33 7 11 4 1 3
O3 8 hours --- --- 0.075 ppm (2008) N 0.092 0.109 0.097 0.088 0.093 --- --- --- -- -- 27 35 24 14 10
CO 1 hour 20 ppm A 35 ppm A 8.7 4.6 Na Na Na 0 0 Na Na Na 0 0 Na Na Na
CO 8 hours 9 ppm A 9 ppm A 5.18 3.51 3.54 2.46 2.44 0 0 0 0 0 0 0 0 0 0
NO2 1 hour 0.18 ppm A N/A N/A 0.101 0.123 0.091 0.091 0.1 0 0 0 0 0 N/A N/A N/A N/A N/A
NO2 Annual 0.030 ppm N/A 0.053 ppm A 0.015 0.015 0.016 0.013 0.013 N/A N/A N/A N/A N/A NX NX NX NX NX
SO2 1 hour 25 pphm A N/A N/A 2.7 1.9 Na Na Na 0 0 Na Na Na N/A N/A N/A N/A N/A
SO2 3 hour --- N/A 50 pphmd A 1.7 1.4 Na Na Na N/A N/A N/A N/A N/A 0 0 Na Na Na
SO2 24 hours 4 pphm A 14 pphm A 0.9 0.7 Na Na Na 0 0 Na Na Na 0 0 Na Na Na
SO2 Annual N/A N/A 3 pphm A 0.3 0.2 Na Na Na N/A N/A N/A N/A N/A NX NX Na Na Na
PM10 24 hours 50 µg/m3 N 150 µg/m3 U 394 158 126 108 125 27/
158.6* 30/
163.4* 25/
146.4* 22/
136* 23/
138.5* 1/6.1* 1/Na* 0/Na* 0/0* 0/0*
PM10 Annual 20 µg/m3 N N/A N/A 58.4 56.1 53.9 47 46.2 EX EX EX EX EX N/A N/A N/A N/A N/A
PM2.5 24 hours N/A N/A 35 µg/m3 A 151 44 78.4 52.2 35.5 N/A N/A N/A N/A N/A
17/ 11.4 5/3.5 4/3.4 2/2 3/3
PM2.5 Annual 12 µg/m3 N 15 µg/m3 A 13.3 14.9 12.2 10.8 10.9 EX EX EX EX EX NX NX NX NX NX
SOURCE: State of California 2011a; U.S. EPA 2011a *Measured Days/Calculated Days—Calculated days are the estimated number of days that a measurement would have been greater than the level of the standard had measurements been collected every day. Particulate measurements are collected every six days. The number of days above the standard is not necessarily the number of violations of the standard for the year. aCalifornia standards for ozone, carbon monoxide (except at Lake Tahoe), sulfur dioxide (1-hour and 24-hour), nitrogen dioxide, and PM10 are values that are not to be exceeded. Some measurements gathered for pollutants with air quality standards that are based upon 1-hour, 8-hour, or 24-hour averages, may be excluded if the CARB determines they would occur less than once per year on average. bNational standards other than for ozone and particulates, and those based on annual averages or annual arithmetic means are not to be exceeded more than once a year. The 1-hour ozone standard is attained if, during the most recent 3-year period, the average number of days per year with maximum hourly concentrations above the standard is equal to or less than one. cA = attainment; N = non-attainment; U = Unclassifiable N/A = not applicable; Na = data not available; NX = annual average not exceeded; EX = annual average exceeded. ppm = parts per million, pphm = parts per hundred million, µg/m3 = micrograms per cubic meter. dSecondary Standard
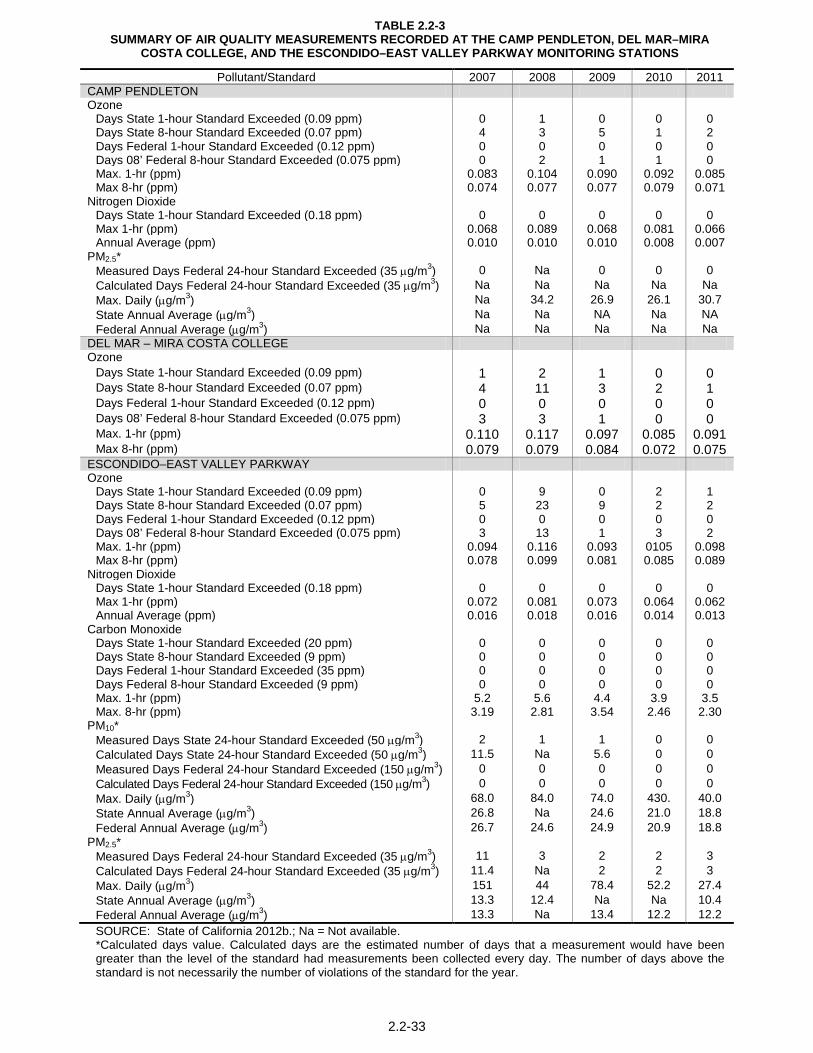
2.2-33
TABLE 2.2-3 SUMMARY OF AIR QUALITY MEASUREMENTS RECORDED AT THE CAMP PENDLETON, DEL MAR–MIRA
COSTA COLLEGE, AND THE ESCONDIDO–EAST VALLEY PARKWAY MONITORING STATIONS
Pollutant/Standard 2007 2008 2009 2010 2011 CAMP PENDLETON Ozone
Days State 1-hour Standard Exceeded (0.09 ppm) 0 1 0 0 0 Days State 8-hour Standard Exceeded (0.07 ppm) 4 3 5 1 2 Days Federal 1-hour Standard Exceeded (0.12 ppm) 0 0 0 0 0 Days 08’ Federal 8-hour Standard Exceeded (0.075 ppm) 0 2 1 1 0 Max. 1-hr (ppm) 0.083 0.104 0.090 0.092 0.085 Max 8-hr (ppm) 0.074 0.077 0.077 0.079 0.071
Nitrogen Dioxide Days State 1-hour Standard Exceeded (0.18 ppm) 0 0 0 0 0 Max 1-hr (ppm) 0.068 0.089 0.068 0.081 0.066 Annual Average (ppm) 0.010 0.010 0.010 0.008 0.007
PM2.5* Measured Days Federal 24-hour Standard Exceeded (35 µg/m3) 0 Na 0 0 0 Calculated Days Federal 24-hour Standard Exceeded (35 µg/m3) Na Na Na Na Na Max. Daily (µg/m3) Na 34.2 26.9 26.1 30.7 State Annual Average (µg/m3) Na Na NA Na NA Federal Annual Average (µg/m3) Na Na Na Na Na
DEL MAR – MIRA COSTA COLLEGE Ozone
Days State 1-hour Standard Exceeded (0.09 ppm) 1 2 1 0 0 Days State 8-hour Standard Exceeded (0.07 ppm) 4 11 3 2 1 Days Federal 1-hour Standard Exceeded (0.12 ppm) 0 0 0 0 0 Days 08’ Federal 8-hour Standard Exceeded (0.075 ppm) 3 3 1 0 0 Max. 1-hr (ppm) 0.110 0.117 0.097 0.085 0.091 Max 8-hr (ppm) 0.079 0.079 0.084 0.072 0.075
ESCONDIDO–EAST VALLEY PARKWAY Ozone
Days State 1-hour Standard Exceeded (0.09 ppm) 0 9 0 2 1 Days State 8-hour Standard Exceeded (0.07 ppm) 5 23 9 2 2 Days Federal 1-hour Standard Exceeded (0.12 ppm) 0 0 0 0 0 Days 08’ Federal 8-hour Standard Exceeded (0.075 ppm) 3 13 1 3 2 Max. 1-hr (ppm) 0.094 0.116 0.093 0105 0.098 Max 8-hr (ppm) 0.078 0.099 0.081 0.085 0.089
Nitrogen Dioxide Days State 1-hour Standard Exceeded (0.18 ppm) 0 0 0 0 0 Max 1-hr (ppm) 0.072 0.081 0.073 0.064 0.062 Annual Average (ppm) 0.016 0.018 0.016 0.014 0.013
Carbon Monoxide Days State 1-hour Standard Exceeded (20 ppm) 0 0 0 0 0 Days State 8-hour Standard Exceeded (9 ppm) 0 0 0 0 0 Days Federal 1-hour Standard Exceeded (35 ppm) 0 0 0 0 0 Days Federal 8-hour Standard Exceeded (9 ppm) 0 0 0 0 0 Max. 1-hr (ppm) 5.2 5.6 4.4 3.9 3.5 Max. 8-hr (ppm) 3.19 2.81 3.54 2.46 2.30
PM10* Measured Days State 24-hour Standard Exceeded (50 µg/m3) 2 1 1 0 0 Calculated Days State 24-hour Standard Exceeded (50 µg/m3) 11.5 Na 5.6 0 0 Measured Days Federal 24-hour Standard Exceeded (150 µg/m3) 0 0 0 0 0 Calculated Days Federal 24-hour Standard Exceeded (150 µg/m3) 0 0 0 0 0 Max. Daily (µg/m3) 68.0 84.0 74.0 430. 40.0 State Annual Average (µg/m3) 26.8 Na 24.6 21.0 18.8 Federal Annual Average (µg/m3) 26.7 24.6 24.9 20.9 18.8
PM2.5* Measured Days Federal 24-hour Standard Exceeded (35 µg/m3) 11 3 2 2 3 Calculated Days Federal 24-hour Standard Exceeded (35 µg/m3) 11.4 Na 2 2 3 Max. Daily (µg/m3) 151 44 78.4 52.2 27.4 State Annual Average (µg/m3) 13.3 12.4 Na Na 10.4 Federal Annual Average (µg/m3) 13.3 Na 13.4 12.2 12.2 SOURCE: State of California 2012b.; Na = Not available. *Calculated days value. Calculated days are the estimated number of days that a measurement would have been greater than the level of the standard had measurements been collected every day. The number of days above the standard is not necessarily the number of violations of the standard for the year.

Subchapter 2.2 Air Quality
2.2-34
THIS PAGE IS INTENTIONALLY BLANK.