Embed Size (px)
Citation preview
Air Quality Assessment:
Cumulative Impact of
Developments in
Stratford-on-Avon – Stage
1
December 2014
Cumulative Impact of Developments in Stratford-on-Avon – Stage 1 Air Quality Assessment
Air Quality Consultants Ltd 23 Coldharbour Road, Bristol BS6 7JT Tel: 0117 974 1086 12 Airedale Road, London SW12 8SF Tel: 0208 673 4313 [email protected]
Registered Office: 12 St Oswalds Road, Bristol, BS6 7HT Companies House Registration No: 2814570
Document Control
Client Stratford-on-Avon Principal Contact Nick Ellison
Report Prepared By: Penny Wilson
Document Status and Review Schedule
Report No. Date Status Reviewed by
2083/1/F1 5 December 2014 Final Report Prof. Duncan Laxen
This report has been prepared by Air Quality Consultants Ltd on behalf of the Client, taking into account the agreed scope of works.
Unless otherwise agreed, this document and all other Intellectual Property Rights remain the property of Air Quality Consultants
Ltd.
In preparing this report, Air Quality Consultants Ltd has exercised all reasonable skill and care, taking into account the objectives
and the agreed scope of works. Air Quality Consultants Ltd does not accept any liability in negligence for any matters arising
outside of the agreed scope of works. The Company operates a formal Quality Management System, which is certified to ISO
9001:2008, and a formal Environmental Management System, certified to ISO 14001:2004. QMF 08.
When issued in electronic format, Air Quality Consultants Ltd does not accept any responsibility for any unauthorised changes
made by others.
When printed by Air Quality Consultants Ltd, this report will be on Evolve Office, 100% Recycled paper.
Job Number J2083
Cumulative Impact of Developments in Stratford-on-Avon – Stage 1 Air Quality Assessment
J2083 1 of 21 December 2014
1 Introduction
1.1 This report sets out the first stage the consideration of the potential cumulative air quality impacts
associated with proposed development set out within the Stratford-on-Avon Core Strategy. It has
been prepared by Air Quality Consultants Ltd on behalf of Stratford-on-Avon District Council
(SDC).
1.2 The Stratford-on-Avon urban area has been designated an Air Quality Management Area (AQMA)
as a result of historically measured exceedences of the annual mean nitrogen dioxide objectives.
No exceedences of the objective have been measured in recent years and therefore SDC is
considering whether to revoke the AQMA. Prior to this decision SDC wishes to determine whether
there is a risk that the cumulative impacts of developments in the area could lead to exceedences
of the air quality objectives, and thus a requirement for an AQMA, in the future.
1.3 The consideration of the cumulative air quality impacts of the proposed developments is being
carried out following a two stage process. This report sets out the first stage, which is to identify
whether the Core Strategy developments could cumulatively increase traffic by a significant
amount in areas where there is a risk that the air quality objectives may be exceeded. Where such
areas are identified, the assessment will move on to a second stage involving air quality modelling
to determine whether the combined influence of these developments would be sufficient to lead to
an exceedence of the air quality objectives.
Cumulative Impact of Developments in Stratford-on-Avon – Stage 1 Air Quality Assessment
J2083 2 of 21 December 2014
2 Approach
2.1 The assessment is based on the Stratford-on-Avon traffic model, developed by Arup on behalf of
Warwickshire County Council. Arup has supplied modelled am and pm peak 4-hour traffic data
(0700 – 0900 and 1600 – 1800) for Stratford-on-Avon for the following scenarios1:
2015 reference case – includes Kipling Road, Shipston Road (Waitrose), NC Joseph
developments and network amendments
2028 reference case – includes the Stratford Transport Package (STP), Warwick Road
Dynamic Signage Strategy and a number of other proposed junction improvements
2028 Core Strategy Option 1 – dispersed development
2028 Core Strategy Option 3 – Long Marston Airfield (includes Western Relief Road)
2028 Core Strategy Option 4 – South East of Stratford (includes Eastern Relief Road)
2.2 The traffic data were supplied as 1-way flows for all the roads in each of the networks. These 1-
way flows have been paired to determine total 2-way peak traffic flows. The 2-way traffic flows for
each option have then been compared with the 2028 reference case to identify locations where
flows are predicted to increase by more than 5% as a result of cumulative developments. The
2028 reference case has also been compared with the 2015 reference case, to determine the
expected changes over this period.
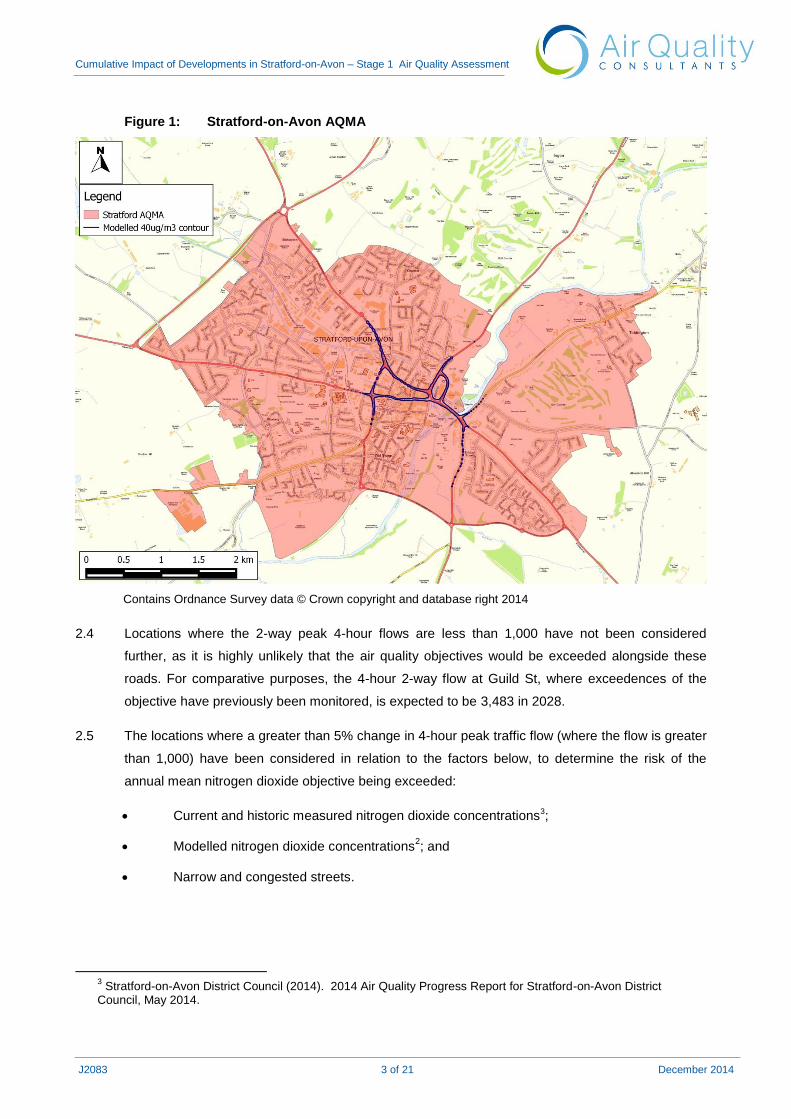
2.3 The assessment is confined to the Stratford-on-Avon AQMA, which covers the whole town area, as
shown in Figure 1. Within this area, the primary focus is on the area where exceedences of the
annual mean nitrogen dioxide objective of 40µg/m3 were modelled in the Further Assessment,
which was completed in 20102.
1 Warwickshire County Council (2014) Stratford-on-Avon Strategic Transport Assessment Options Analysis Report,
April 2014. 2 Air Quality Consultants Ltd (2010). Further Assessment of Air Quality in the Stratford-on-Avon AQMA, September
2010.
Cumulative Impact of Developments in Stratford-on-Avon – Stage 1 Air Quality Assessment
J2083 3 of 21 December 2014
Figure 1: Stratford-on-Avon AQMA
Contains Ordnance Survey data © Crown copyright and database right 2014
2.4 Locations where the 2-way peak 4-hour flows are less than 1,000 have not been considered
further, as it is highly unlikely that the air quality objectives would be exceeded alongside these
roads. For comparative purposes, the 4-hour 2-way flow at Guild St, where exceedences of the
objective have previously been monitored, is expected to be 3,483 in 2028.
2.5 The locations where a greater than 5% change in 4-hour peak traffic flow (where the flow is greater
than 1,000) have been considered in relation to the factors below, to determine the risk of the
annual mean nitrogen dioxide objective being exceeded:
Current and historic measured nitrogen dioxide concentrations3;
Modelled nitrogen dioxide concentrations2; and
Narrow and congested streets.
3 Stratford-on-Avon District Council (2014). 2014 Air Quality Progress Report for Stratford-on-Avon District
Council, May 2014.
Cumulative Impact of Developments in Stratford-on-Avon – Stage 1 Air Quality Assessment
J2083 4 of 21 December 2014
Limitations
2.6 It is not straightforward to take into consideration the direct impact of changes in congestion on air
quality. This screening assessment is therefore based solely on changes in peak traffic numbers.
The impact of changes in average speed will be considered where detailed modelling is carried out
at stage 2 of this project.
2.7 The impact of changes in vehicle emissions in the future is not taken into account at this stage.
Again this will be taken into account where detailed modelling is carried out at stage 2.
2.8 The traffic impacts of the Kipling Road residential development, Shipston Road neighbourhood
centre (Waitrose) and redevelopment of the NC Joseph site on Birmingham Road are included in
the 2015 and 2028 reference case models. These developments have only recently been
completed and therefore the full impact of these developments may not have been apparent in the
2013 air quality monitoring data used as the basis for this assessment. They will however,
influence monitoring data from 2014 and beyond.
Cumulative Impact of Developments in Stratford-on-Avon – Stage 1 Air Quality Assessment
J2083 5 of 21 December 2014
3 Analysis
2015 Reference Case compared with 2028 Reference Case
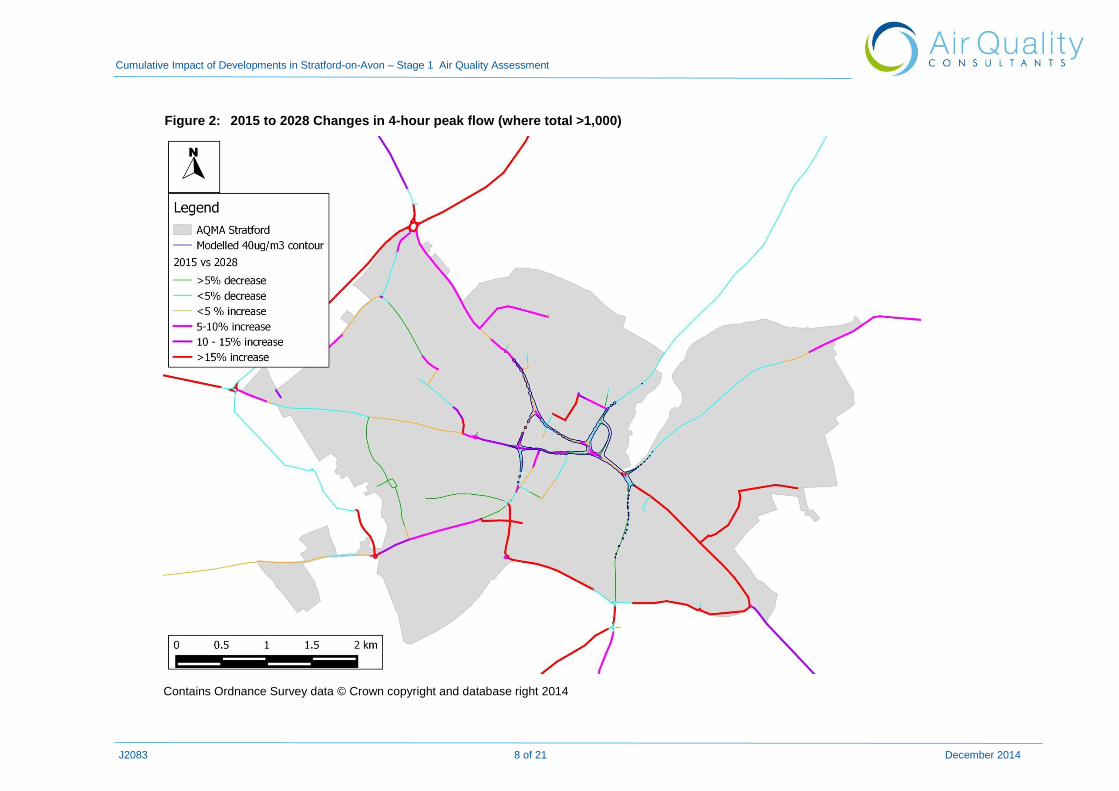
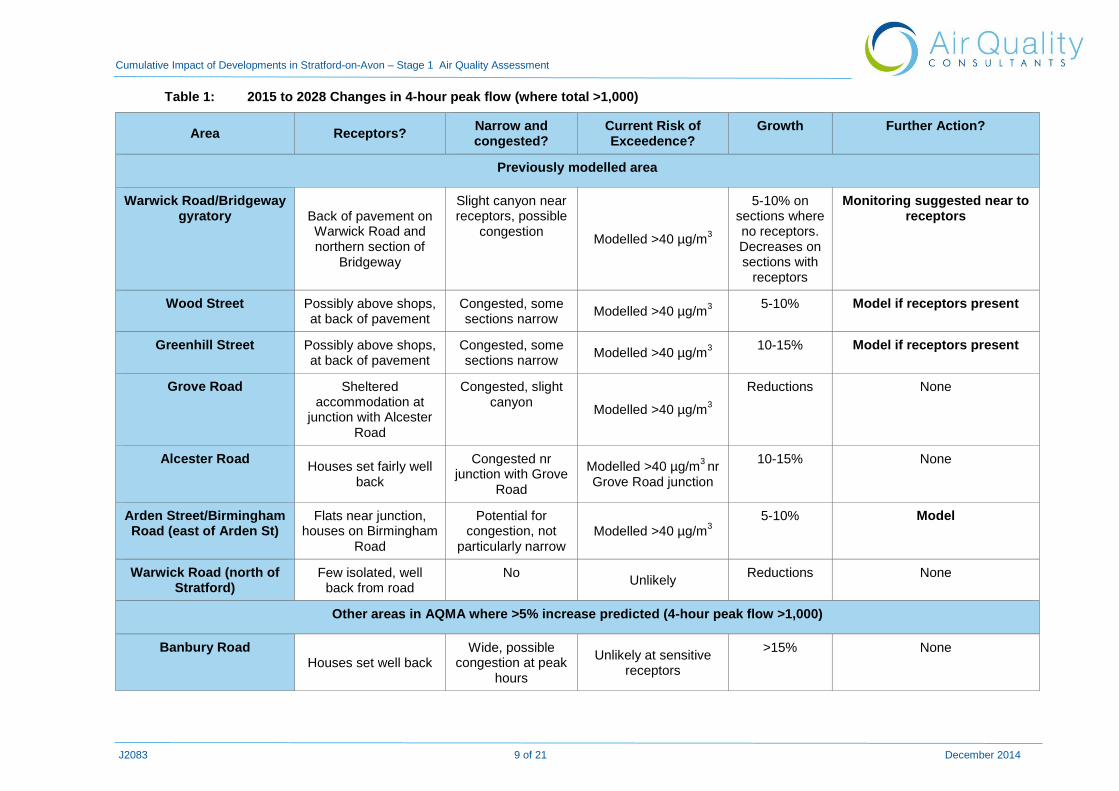
3.1 The locations where a greater than 5% increase in 4-hour peak traffic flow when the 2028
reference case is compared with the 2015 reference case (and flows >1,000) are shown in Figure
2. Analysis of these locations in relation to the factors contributing to a risk of an exceedence of
the air quality objectives is set out in Table 1.
3.2 Generally decreases are predicted by 2028 in areas where exceedences have previously been
modelled. This is as a result of a combination of factors, including the Stratford Transport
Package. However, increases are expected at the Arden Street/Birmingham Road junction, near
to receptors.
3.3 Some very large increases in traffic are predicted on wide roads with receptors set back from the
road, outside the previously modelled exceedence area. Some of these large increases are due to
increased capacity as a result of specific transport schemes, for example the increase on Banbury
Road is a result of the Tiddington Road scheme proposals.
Option 1
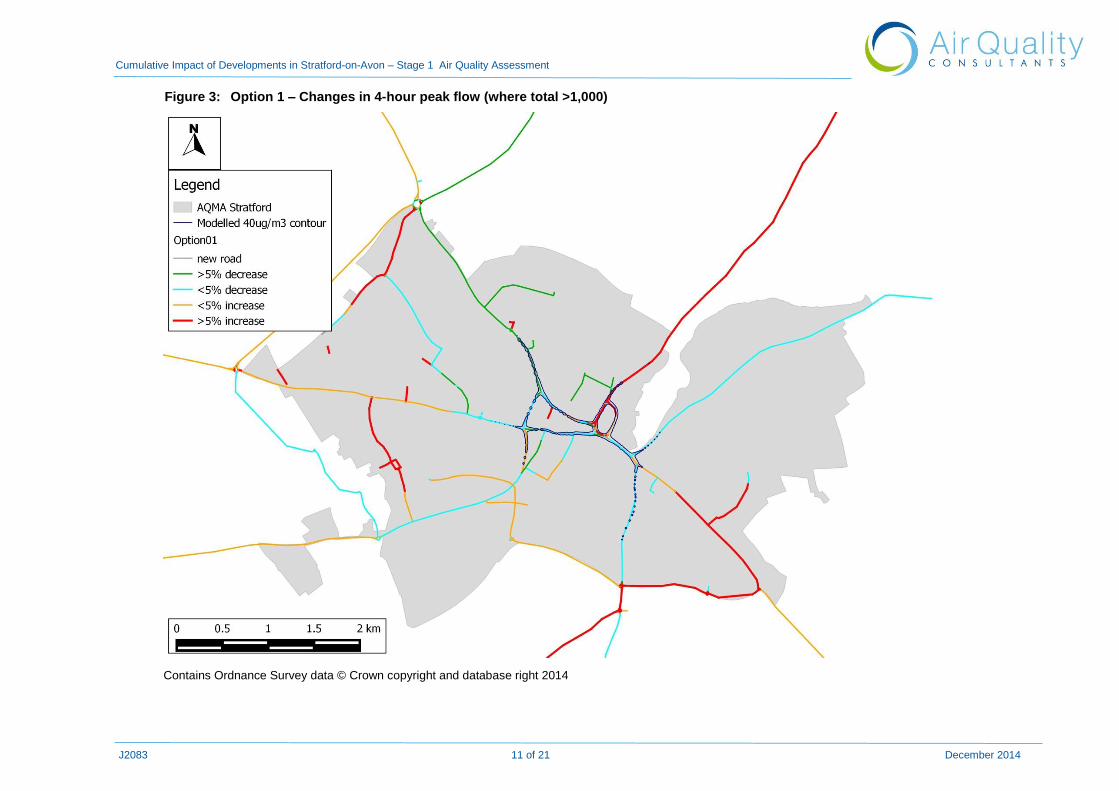
3.4 The locations where a greater than 5% increase in 4-hour peak traffic flow is predicted with Option
1 (and flows >1,000) are shown in Figure 3. Analysis of these locations, and all locations in the
previously modelled area, in relation to the factors which contribute to a risk of an exceedence of
the air quality objectives is set out in Table 2.
3.5 The traffic model indicates that there would be a greater than 5% increase in traffic around the
Warwick Road/Bridgeway gyratory with Core Strategy Option 1 (dispersed development).
Potential exceedences of the objective were previously modelled at this location and there are
sensitive receptors present. There has not been any previous monitoring carried out near to
receptors in this area. It is therefore recommended that both monitoring of existing levels and
modelling of future concentrations is carried out.
3.6 A greater than 5% increase in traffic is also predicted at the northern end of Windsor Street. There
are some houses fairly close to the road and possibly some flats above shops, and the street is
congested and narrow in places, however, traffic flows are relatively low and it was not in the
previously modelled exceedence area. On this basis consideration should be given to monitoring
and possibly modelling at relevant receptors.
3.7 In the rest of the previously modelled exceedence area, including locations where historic
exceedences of the objective have been measured, Option 1 is expected to lead to reductions in
traffic flow.
Cumulative Impact of Developments in Stratford-on-Avon – Stage 1 Air Quality Assessment
J2083 6 of 21 December 2014
3.8 At most other locations in the AQMA, where Option 1 is expected to increase traffic by more than
5%, houses are set well back from the road and there are unlikely to be exceedences of the
objective. The exception is Shottery, where sections of road are very narrow and there are some
houses at the back of narrow pavements. Whilst exceedences of the objective are unlikely with
current traffic flows, it is suggested that a short period of monitoring is carried out, to confirm this is
the case.
Option 3
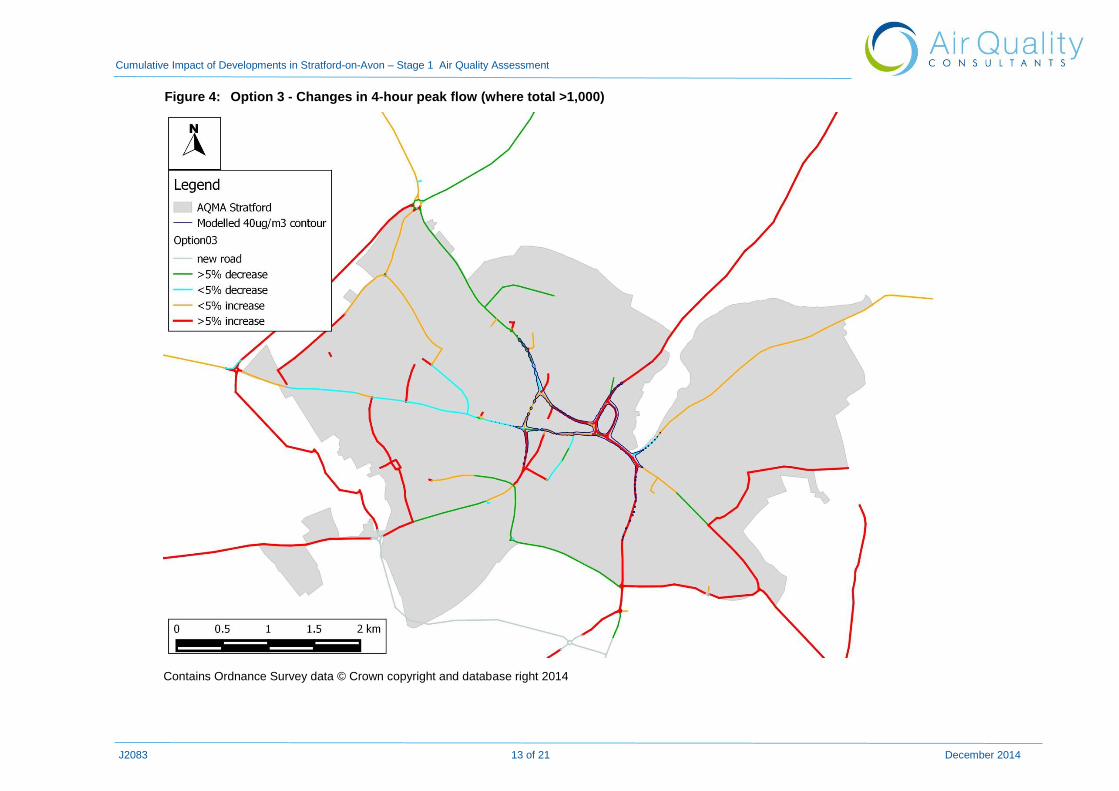
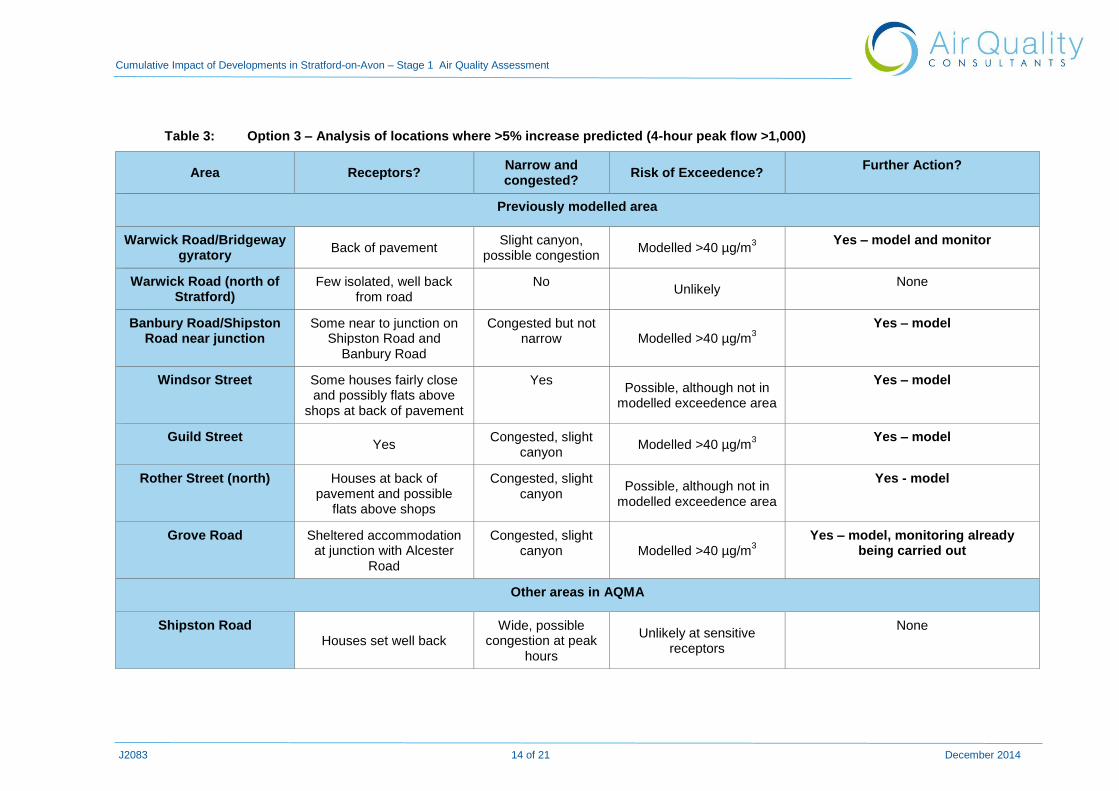
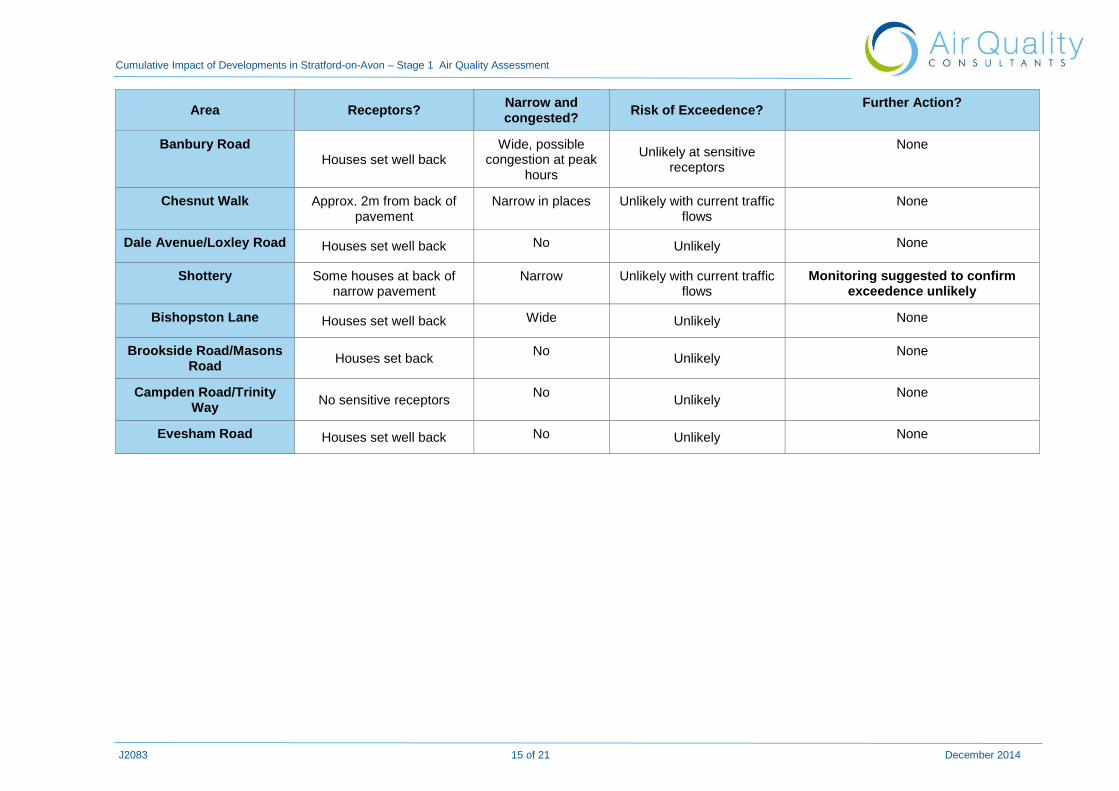
3.9 The locations where a greater than 5% increase in 4-hour peak traffic flow is predicted with Option
3 (and flows >1,000) are shown in Figure 4. Analysis of these locations in relation to the factors
which contribute to a risk of an exceedence of the air quality objectives is set out in Table 3.
3.10 The traffic model indicates that there would be a greater than 5% increase in traffic in much of the
previously modelled area with Core Strategy Option 3 (Long Marston). This includes the Warwick
Road/Bridgeway gyratory, the Banbury Road/Shipston Road junction, and Guild Street and Grove
Road. On this basis, it is recommended that detailed dispersion modelling of this area is carried
out.
3.11 At most other locations in the AQMA, where Option 3 is expected to increase traffic by more than
5%, houses are set well back from the road and there are unlikely to be exceedences of the
objective. Again, the exception is Shottery, where sections of road are very narrow and there are
some houses at the back of narrow pavements. Whilst exceedences of the objective are unlikely
with current traffic flows, it is suggested that a short period of monitoring is carried out, to confirm
this is the case.
Option 4
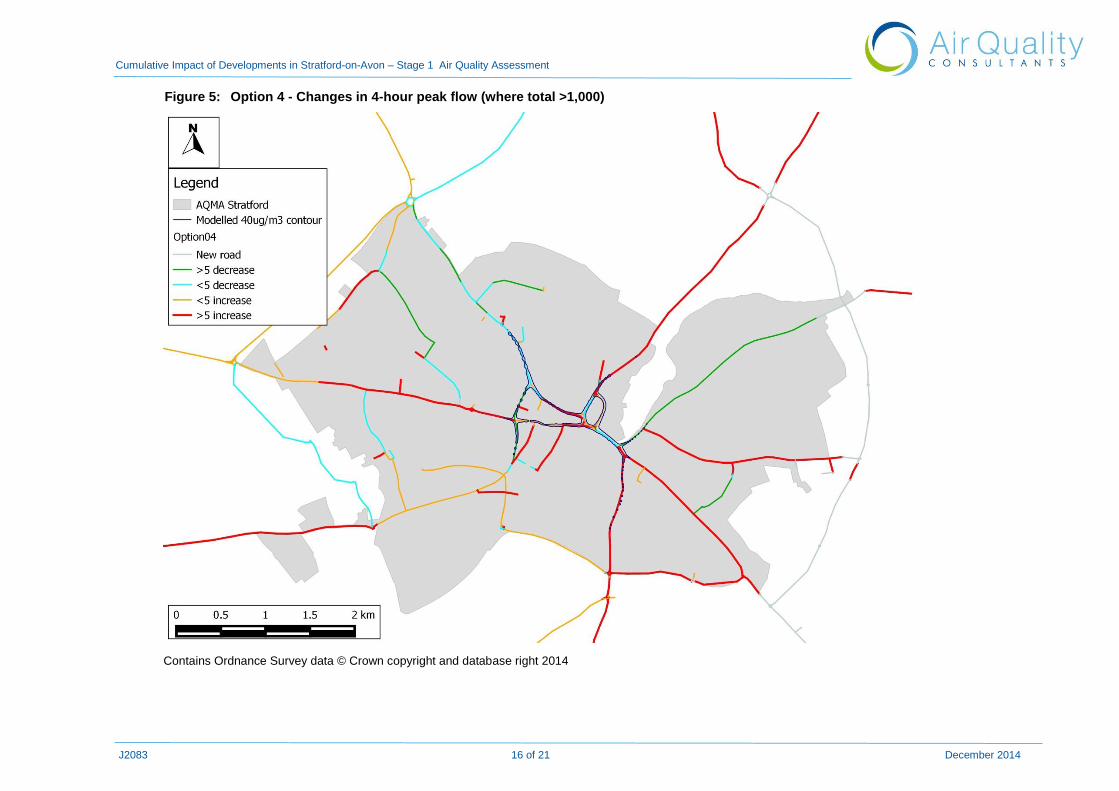
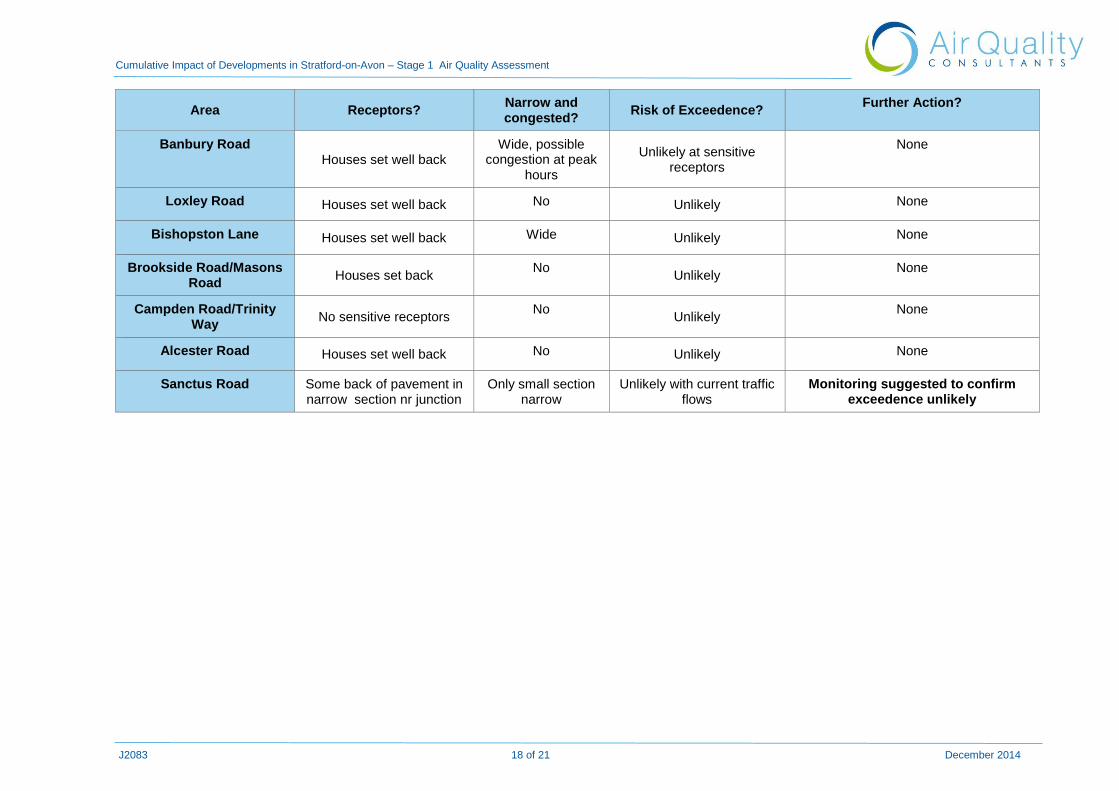
3.12 The locations where a greater than 5% increase in 4-hour peak traffic flow is predicted with Option
4 (and flows >1,000) are shown in Figure 5. Analysis of these locations in relation to the factors
which contribute to a risk of an exceedence of the air quality objectives is set out in Table 4.
3.13 The traffic model indicates that there would be a greater than 5% increase in traffic in much of the
previously modelled area with Core Strategy Option 4 (East of Stratford). This includes Warwick
Road near to the Warwick Road/Bridgeway gyratory, the Banbury Road/Shipston Road junction,
and Guild Street and Rother Street. On this basis, it is recommended that detailed dispersion
modelling of this area is carried out. Increases are also predicted on Bridge Street and High
Street. The buildings in these streets have predominantly retail uses, however, if there are flats
above the shops in this area, modelling should be carried out.
3.14 At most other locations in the AQMA, where Option 4 is expected to increase traffic by more than
5%, houses are set well back from the road and there are unlikely to be exceedences of the
objective. An exception is Sanctus Road, where sections of road are very narrow and there are

Cumulative Impact of Developments in Stratford-on-Avon – Stage 1 Air Quality Assessment
J2083 7 of 21 December 2014
some houses at the back of narrow pavements. Whilst exceedences of the objective are unlikely
with current traffic flows, it is suggested that a short period of monitoring is carried out, to confirm
this is the case.
Cumulative Impact of Developments in Stratford-on-Avon – Stage 1 Air Quality Assessment
J2083 8 of 21 December 2014
Figure 2: 2015 to 2028 Changes in 4-hour peak flow (where total >1,000)
Contains Ordnance Survey data © Crown copyright and database right 2014
Cumulative Impact of Developments in Stratford-on-Avon – Stage 1 Air Quality Assessment
J2083 9 of 21 December 2014
Table 1: 2015 to 2028 Changes in 4-hour peak flow (where total >1,000)
Area Receptors? Narrow and congested?
Current Risk of Exceedence?
Growth Further Action?
Previously modelled area
Warwick Road/Bridgeway gyratory Back of pavement on
Warwick Road and northern section of
Bridgeway
Slight canyon near receptors, possible
congestion Modelled >40 µg/m
3
5-10% on sections where no receptors. Decreases on sections with
receptors
Monitoring suggested near to receptors
Wood Street Possibly above shops, at back of pavement
Congested, some sections narrow
Modelled >40 µg/m3
5-10% Model if receptors present
Greenhill Street Possibly above shops, at back of pavement
Congested, some sections narrow
Modelled >40 µg/m3
10-15% Model if receptors present
Grove Road Sheltered accommodation at
junction with Alcester Road
Congested, slight canyon
Modelled >40 µg/m3
Reductions None
Alcester Road Houses set fairly well
back
Congested nr junction with Grove
Road
Modelled >40 µg/m3 nr
Grove Road junction
10-15% None
Arden Street/Birmingham Road (east of Arden St)
Flats near junction, houses on Birmingham
Road
Potential for congestion, not
particularly narrow Modelled >40 µg/m
3
5-10% Model
Warwick Road (north of Stratford)
Few isolated, well back from road
No Unlikely
Reductions None
Other areas in AQMA where >5% increase predicted (4-hour peak flow >1,000)
Banbury Road Houses set well back
Wide, possible congestion at peak
hours
Unlikely at sensitive receptors
>15% None
Cumulative Impact of Developments in Stratford-on-Avon – Stage 1 Air Quality Assessment
J2083 10 of 21 December 2014
Area Receptors? Narrow and congested?
Current Risk of Exceedence?
Growth Further Action?
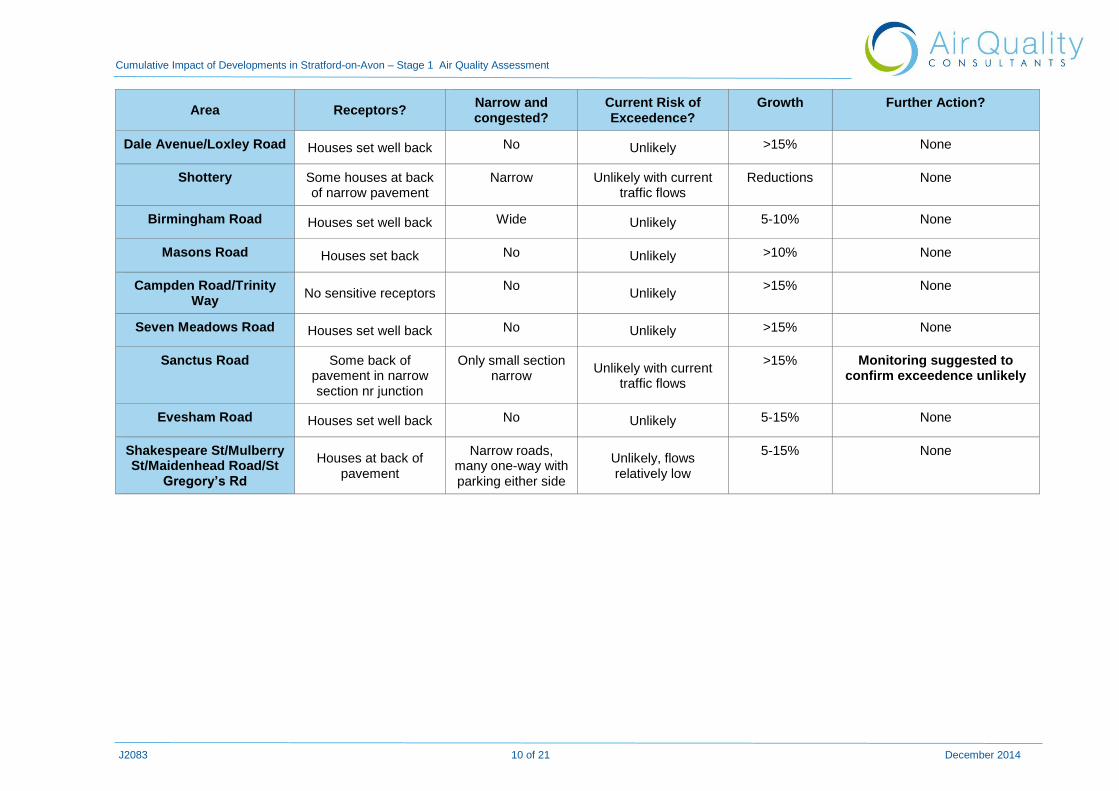
Dale Avenue/Loxley Road Houses set well back No Unlikely >15% None
Shottery Some houses at back of narrow pavement
Narrow Unlikely with current traffic flows
Reductions None
Birmingham Road Houses set well back Wide Unlikely 5-10% None
Masons Road Houses set back No Unlikely >10% None
Campden Road/Trinity Way
No sensitive receptors No
Unlikely >15% None
Seven Meadows Road Houses set well back No Unlikely >15% None
Sanctus Road Some back of pavement in narrow section nr junction
Only small section narrow
Unlikely with current traffic flows
>15% Monitoring suggested to confirm exceedence unlikely
Evesham Road Houses set well back No Unlikely 5-15% None
Shakespeare St/Mulberry St/Maidenhead Road/St
Gregory’s Rd
Houses at back of pavement
Narrow roads, many one-way with parking either side
Unlikely, flows relatively low
5-15% None
Cumulative Impact of Developments in Stratford-on-Avon – Stage 1 Air Quality Assessment
J2083 11 of 21 December 2014
Figure 3: Option 1 – Changes in 4-hour peak flow (where total >1,000)
Contains Ordnance Survey data © Crown copyright and database right 2014
Cumulative Impact of Developments in Stratford-on-Avon – Stage 1 Air Quality Assessment
J2083 12 of 21 December 2014
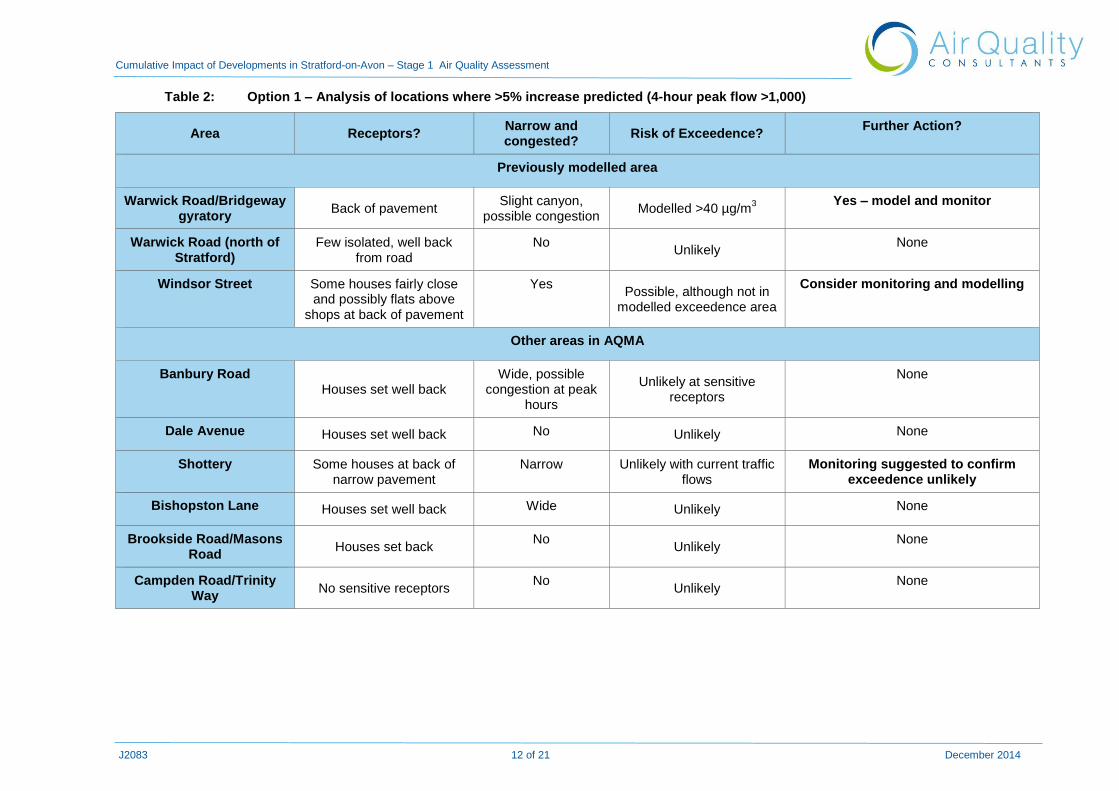
Table 2: Option 1 – Analysis of locations where >5% increase predicted (4-hour peak flow >1,000)
Area Receptors? Narrow and congested?
Risk of Exceedence? Further Action?
Previously modelled area
Warwick Road/Bridgeway gyratory
Back of pavement Slight canyon,
possible congestion Modelled >40 µg/m
3
Yes – model and monitor
Warwick Road (north of Stratford)
Few isolated, well back from road
No Unlikely
None
Windsor Street Some houses fairly close and possibly flats above
shops at back of pavement
Yes Possible, although not in
modelled exceedence area
Consider monitoring and modelling
Other areas in AQMA
Banbury Road Houses set well back
Wide, possible congestion at peak
hours
Unlikely at sensitive receptors
None
Dale Avenue Houses set well back No Unlikely None
Shottery Some houses at back of narrow pavement
Narrow Unlikely with current traffic flows
Monitoring suggested to confirm exceedence unlikely
Bishopston Lane Houses set well back Wide Unlikely None
Brookside Road/Masons Road
Houses set back No
Unlikely None
Campden Road/Trinity Way
No sensitive receptors No
Unlikely None
Cumulative Impact of Developments in Stratford-on-Avon – Stage 1 Air Quality Assessment
J2083 13 of 21 December 2014
Figure 4: Option 3 - Changes in 4-hour peak flow (where total >1,000)
Contains Ordnance Survey data © Crown copyright and database right 2014
Cumulative Impact of Developments in Stratford-on-Avon – Stage 1 Air Quality Assessment
J2083 14 of 21 December 2014
Table 3: Option 3 – Analysis of locations where >5% increase predicted (4-hour peak flow >1,000)
Area Receptors? Narrow and congested?
Risk of Exceedence? Further Action?
Previously modelled area
Warwick Road/Bridgeway gyratory
Back of pavement Slight canyon,
possible congestion Modelled >40 µg/m
3
Yes – model and monitor
Warwick Road (north of Stratford)
Few isolated, well back from road
No Unlikely
None
Banbury Road/Shipston Road near junction
Some near to junction on Shipston Road and
Banbury Road
Congested but not narrow Modelled >40 µg/m
3
Yes – model
Windsor Street Some houses fairly close and possibly flats above
shops at back of pavement
Yes Possible, although not in
modelled exceedence area
Yes – model
Guild Street Yes
Congested, slight canyon
Modelled >40 µg/m3
Yes – model
Rother Street (north) Houses at back of pavement and possible
flats above shops
Congested, slight canyon
Possible, although not in modelled exceedence area
Yes - model
Grove Road Sheltered accommodation at junction with Alcester
Road
Congested, slight canyon Modelled >40 µg/m
3
Yes – model, monitoring already being carried out
Other areas in AQMA
Shipston Road Houses set well back
Wide, possible congestion at peak
hours
Unlikely at sensitive receptors
None
Cumulative Impact of Developments in Stratford-on-Avon – Stage 1 Air Quality Assessment
J2083 15 of 21 December 2014
Area Receptors? Narrow and congested?
Risk of Exceedence? Further Action?
Banbury Road Houses set well back
Wide, possible congestion at peak
hours
Unlikely at sensitive receptors
None
Chesnut Walk Approx. 2m from back of pavement
Narrow in places Unlikely with current traffic flows
None
Dale Avenue/Loxley Road Houses set well back No Unlikely None
Shottery Some houses at back of narrow pavement
Narrow Unlikely with current traffic flows
Monitoring suggested to confirm exceedence unlikely
Bishopston Lane Houses set well back Wide Unlikely None
Brookside Road/Masons Road
Houses set back No
Unlikely None
Campden Road/Trinity Way
No sensitive receptors No
Unlikely None
Evesham Road Houses set well back No Unlikely None
Cumulative Impact of Developments in Stratford-on-Avon – Stage 1 Air Quality Assessment
J2083 16 of 21 December 2014
Figure 5: Option 4 - Changes in 4-hour peak flow (where total >1,000)
Contains Ordnance Survey data © Crown copyright and database right 2014

Cumulative Impact of Developments in Stratford-on-Avon – Stage 1 Air Quality Assessment
J2083 17 of 21 December 2014
Table 4: Option 4 – Analysis of locations where >5% increase predicted (4-hour peak flow >1,000)
Area Receptors? Narrow and congested?
Risk of Exceedence? Further Action?
Previously modelled area
Warwick Road/Bridgeway gyratory
Back of pavement, near Warwick Road, where
increases expected
Slight canyon, possible congestion Modelled >40 µg/m
3
Yes – model and monitor
Warwick Road (north of Stratford)
Few isolated, well back from road
No Unlikely
None
Banbury Road/Shipston Road near junction
Some near to junction on Shipston Road and
Banbury Road
Congested but not narrow Modelled >40 µg/m
3
Yes – model and monitor
Guild Street Yes
Congested, slight canyon
Modelled >40 µg/m3
Yes – model
Rother Street (north) Houses at back of pavement and possible
flats above shops
Congested, slight canyon
Possible, although not in modelled exceedence area
Yes - model
Bridge Street Possibly flats above shops Congested, wide Modelled >40 µg/m3 Model if receptors present
High Street Possibly flats above shops
Congested, slight canyon
Possible, although not in modelled exceedence area
Model if receptors present
Alcester Road Houses set fairly well back
Congested nr junction with Grove
Road
Modelled >40 µg/m3 nr
Grove Road junction
None
Other areas in AQMA
Shipston Road Houses set well back
Wide, possible congestion at peak
hours
Unlikely at sensitive receptors
None
Cumulative Impact of Developments in Stratford-on-Avon – Stage 1 Air Quality Assessment
J2083 18 of 21 December 2014
Area Receptors? Narrow and congested?
Risk of Exceedence? Further Action?
Banbury Road Houses set well back
Wide, possible congestion at peak
hours
Unlikely at sensitive receptors
None
Loxley Road Houses set well back No Unlikely None
Bishopston Lane Houses set well back Wide Unlikely None
Brookside Road/Masons Road
Houses set back No
Unlikely None
Campden Road/Trinity Way
No sensitive receptors No
Unlikely None
Alcester Road Houses set well back No Unlikely None
Sanctus Road Some back of pavement in narrow section nr junction
Only small section narrow
Unlikely with current traffic flows
Monitoring suggested to confirm exceedence unlikely
Cumulative Impact of Developments in Stratford-on-Avon – Stage 1 Air Quality Assessment
J2083 19 of 21 December 2014
4 Recommendations
4.1 It is recommended that detailed modelling is carried out for most of the previously modelled area in
the centre of Stratford, to include:
Warwick Road/Bridgeway gyratory;
Banbury Road/Shipston Road junction;
Greenhill Street/Grove Street junction;
Greenhill Street/Rother Street junction;
Arden Street/Birmingham Road junction;
Windsor Street/Guild Street junction; and
Bridge Street/High Street junction (if receptors present).
4.2 It is suggested that monitoring is carried out to determine whether there is a risk of exceedence of
the annual mean nitrogen dioxide objective in the following locations:
Warwick Road/Bridgeway gyratory;
Windsor Street;
Sanctus Road; and
Shottery.

Cumulative Impact of Developments in Stratford-on-Avon – Stage 1 Air Quality Assessment
J2083 20 of 21 December 2014
5 References
Air Quality Consultants Ltd (2010). Further Assessment of Air Quality in the Stratford-on-Avon
AQMA, September 2010
Stratford-on-Avon District Council (2014). 2014 Air Quality Progress Report for Stratford-on-Avon
District Council, May 2014
Warwickshire County Council (2014) Stratford-on-Avon Strategic Transport Assessment Options
Analysis Report, April 2014
Cumulative Impact of Developments in Stratford-on-Avon – Stage 1 Air Quality Assessment
J2083 21 of 21 December 2014
6 Glossary
AADT Annual Average Daily Traffic
AQMA Air Quality Management Area
Exceedence A period of time when the concentration of a pollutant is greater than the appropriate
air quality objective. This applies to specified locations with relevant exposure
μg/m3 Microgrammes per cubic metre
NO Nitric oxide
NO2 Nitrogen dioxide
NOx Nitrogen oxides (taken to be NO2 + NO)
Objectives A nationally defined set of health-based concentrations for nine pollutants, seven of
which are incorporated in Regulations, setting out the extent to which the standards
should be achieved by a defined date. There are also vegetation-based objectives for
sulphur dioxide and nitrogen oxides
Standards A nationally defined set of concentrations for nine pollutants below which health
effects do not occur or are minimal