Embed Size (px)
Citation preview
Air quality assessment for Cycle Enfield A1010 North proposals
Final Report
Prepared forEnfield Council
12th September 2016

Report Information
CERC Job Number: FM1065
Job Title: Air quality assessment for Cycle Enfield A1010 North proposals
Prepared for: Enfield Council
Report Status: Final
Report Reference: FM1065/A1010NR2/16
Issue Date: 12th September 2016
Author(s): Matthew Williams
Reviewer(s): Mark Attree
Issue Date Comments
12
31/08/1612/09/16
DraftFinal
Main File(s): FM1065_A1010NR2_12Sep16.pdf

Contents
1 SUMMARY ..........................................................................................................4
2 INTRODUCTION................................................................................................5
3 AIR QUALITY STANDARDS ...........................................................................6
4 EMISSIONS DATA.............................................................................................8
4.1 TRAFFIC EMISSIONS.........................................................................................84.1.1 Traffic flows ...............................................................................................84.1.2 Traffic queues...........................................................................................114.1.3 Bus stops ..................................................................................................124.1.4 Time varying profiles ...............................................................................124.1.5 Traffic emission factors............................................................................13
4.2 OTHER EMISSIONS.........................................................................................13
5 MODEL SET-UP ...............................................................................................14
5.1 SURFACE ROUGHNESS ...................................................................................145.2 STREET CANYONS .........................................................................................145.3 MONIN-OBUKHOV LENGTH...........................................................................155.4 METEOROLOGICAL DATA ..............................................................................155.5 BACKGROUND CONCENTRATIONS .................................................................16
6 MODEL VERIFICATION ...............................................................................17
7 2016 SCENARIO MODELLING .....................................................................19
7.1 NO2 AIR QUALITY MAPS ................................................................................197.2 PM10 AIR QUALITY MAPS...............................................................................257.3 PM2.5 CONCENTRATIONS ...............................................................................31
8 DISCUSSION .....................................................................................................36
APPENDIX A: SUMMARY OF ADMS-URBAN ..................................................37
Air quality assessment for Cycle Enfield proposals
4
1 Summary
Cycle Enfield is proposing to introduce segregated cycle lanes along the A1010, A105 and A110, including changes to the road layout in Enfield Town. Currently 0.7% of journeys in Enfield are by bike. As well as the introduction of safe cycle routes, Cycle Enfield is also providing free cycle training for anyone that lives, works or studies in Enfield, installing more cycle parking and introducing a £10 bike loan scheme. These are expected to increase the modal share to 5% by 2020.
The whole of the Borough of Enfield is declared an Air Quality Management Area due to concentrations of nitrogen dioxide (NO2) and particulate matter (PM10) exceeding the UK air quality objectives.
Air quality modelling was carried out for the area around the A1010 North using the ADMS-Urban model. Four scenarios were modelled for 2016:
a baseline scenario without the proposed scheme; and three scenarios with the scheme in place representing 2.5%, 5% and 10% reductions
in traffic flows with corresponding changes to traffic queues.
The modelling used traffic flow and queuing data for the A1010 North supplied by the Council, with data for the rest of London taken from the London Atmospheric Emissions Inventory.
With the introduction of the proposals and a 2.5% reduction in traffic, annual average NO2
concentrations are predicted to reduce by up to 0.5 µg/m³ at roadside locations. The introduction of the scheme is predicted to result in some increases in queue length and delay time leading to increases in concentrations at junctions. However, the area of these increases will be much smaller than the area of air quality improvements resulting from reduced traffic flows. As a result the majority of residents along this road will experience an improvement in air quality and corresponding health benefits.
With greater reductions in traffic flows, the increases in concentrations at queues generally become smaller and the decreases along the rest of the road become greater. With a traffic reduction of 10%, roadside annual average NO2 concentrations are predicted to decrease by up to 1.5 µg/m³.
The changes to the traffic flows along the A1010 are predicted to bring about only small decreases in PM10 and PM2.5 concentrations. The effect of the increased queuing on PM10
and PM2.5 concentrations is not as noticeable as for NO2 because there are no emissions from queuing traffic from brake wear, tyre wear, road wear or resuspension.

Air quality assessment for Cycle Enfield proposals
5
2 Introduction
Cycle Enfield is proposing to introduce segregated cycle lanes along the A1010, A105 and A110, including changes to the road layout in Enfield Town. Currently 0.7% of journeys in Enfield are by bike. As well as the introduction of safe cycle routes, Cycle Enfield is also providing free cycle training for anyone that lives, works or studies in Enfield, installing more cycle parking and introducing a £10 bike loan scheme. These are expected to increase the modal share to 5% by 2020.
Changes to the road layout, traffic flows and speeds and levels of congestion could all have an impact on air quality.
Cambridge Environmental Research Consultants Ltd (CERC) was commissioned by EnfieldCouncil to carry out air dispersion modelling to assess the impact of the proposed changes onnitrogen dioxide (NO2) and particulate matter (PM10 and PM2.5) concentrations in the area surrounding these roads. This report describes the assessment for the A1010 North. Four scenarios were modelled for 2016:
a baseline scenario without the proposed scheme; and three scenarios with the scheme in place representing 2.5%, 5% and 10% reductions
in traffic flows with corresponding changes to traffic queues.
This report describes the data and assumptions used in the modelling, and presents the model results. Section 3 sets out the air quality standards, with which the calculated concentrations are compared. The traffic and emissions data and model set-up are summarised in Sections 4and 5, respectively. Model verification was carried out to check the data and assumptions are valid and this is described in Section 6. The results of the modelling for each of the scenarios are presented in Section 7. A discussion of the results is presented in Section 8.
Air quality assessment for Cycle Enfield proposals
6
3 Air quality standards
The EU ambient air quality directive (2008/50/EC) sets binding limits for concentrations of air pollutants, which take into account the effects of each pollutant on the health of those who are most sensitive to air quality. The directive has been transposed into English legislation as the Air Quality Standards Regulations 20101, which also incorporates the provisions of the 4th air quality daughter directive (2004/107/EC).
The Air Quality Standards Regulations 2010 include limit values and target values. Local authorities are required to work towards air quality objectives. In doing so, they assist the Government in meeting the limit values. The limit values are presented in Table 3.1.
Table 3.1: Air quality limit valuesValue
(µg/m3)Description of standard
NO2
200Hourly mean not to be exceeded more than 18 times a calendar year
(modelled as 99.79th percentile)
40 Annual average
PM1050
24-hour mean not to be exceeded more than 35 times a calendar year(modelled as 90.41st percentile)
40 Annual average
PM2.5 25 Annual average
The regulations also include national exposure reduction targets for PM2.5, as set out in Table 3.2. These are based on the average exposure indicator (AEI) which is calculated as the three-year average of all measured PM2.5 concentrations at urban background locations, e.g. the AEI for 2010 must be based on measurements for the years 2009, 2010 and 2011.
Table 3.2: Exposure reduction target for PM2.5 relative to the AEI in 2010
Initial concentration (µg/m³) Reduction target (%)Year by which exposure
reduction target should be met
Less than or equal to 8.5 0
2020
More than 8.5 but less than 13 10
13 to less than 18 15
18 to less than 22 20
22 or moreAll appropriate measures
to reach 18µg/m³
1 http://www.legislation.gov.uk/uksi/2010/1001/contents/made

Air quality assessment for Cycle Enfield proposals
7
The short-term objectives, i.e. those measured hourly or over 24 hours, are specified in terms of the number of times during a year that a concentration measured over a short period of time is permitted to exceed a specified value. For example, the concentration of NO2
measured as the average value recorded over a one-hour period is permitted to exceed the concentration of 200 µg/m3 up to 18 times per year. Any more exceedences than this during a one-year period would represent a breach of the objective.
It is convenient to model objectives of this form in terms of the equivalent percentile concentration value. A percentile is the concentration below which lie a specified percentage of concentration measurements. For example, consider the 98th percentile of one-hour concentrations over a year. Taking all of the 8760 one-hour concentration values that occur in a year, the 98th percentile value is the concentration below which 98% of those concentrations lie. Or, in other words, it is the concentration exceeded by 2% (100 – 98) of those hours, that is, 175 hours per year. Taking the NO2 objective considered above, allowing 18 exceedences per year is equivalent to not exceeding for 8742 hours or for 99.79% of the year. This is therefore equivalent to the 99.79th percentile value. It is important to note that modelling exceedences of short term averages is generally not as accurate as modelling annual averages.

Air quality assessment for Cycle Enfield proposals
8
4 Emissions data
Modelling was carried out for four scenarios for 2016: a baseline scenario without the proposed scheme; and three scenarios with the scheme in place representing 2.5%, 5% and 10% reductions
in traffic flows with corresponding changes to traffic queues.
4.1 Traffic emissions
4.1.1 Traffic flows
Traffic data for the roads affected by the scheme were provided by the Council. Data for all other roads in London were taken from the LAEI (London Atmospheric Emissions Inventory) 2010.
Traffic count data for the A1010 North were provided for the junctions of the A1010 with the A1055, Ordnance Road, Carterhatch Lane, and Green Street. The data were am and pm peak total flows; these were converted to AADT flows using the profile described in Section 4.1.4. The split by vehicle type for each road was calculated using the equivalent data for each road in the LAEI. Table 4.1 gives a summary of the baseline traffic data.
The assessment considered reductions in traffic flows of 2.5%, 5% and 10%. It was assumed that these reductions would be brought about through reductions in car trips only. Reductions in car flows were therefore applied to reduce the total flow to the required level, while keeping the flows of all other vehicle categories unchanged. Table 4.2 shows the AADTs for the total traffic and cars only used in the assessment.

Air quality assessment for Cycle Enfield proposals
9
Table 4.1: Baseline A1010 North traffic data
Road DirectionSpeed (km/h)
AADT
Total M’cycle Car Taxi LGV BusRigid HGV
Artic. HGV
Hertford Rd (North of A1055) Northbound 24-25 16922 258 13668 163 1991 454 339 50
Hertford Rd (North of A1055) Southbound 5-25 17946 274 14495 173 2111 481 359 53
Bullsmoor Ln Westbound 27-28 11133 103 8206 129 1436 147 601 406
Bullsmoor Ln Eastbound 5-28 14003 130 10321 162 1806 185 889 511
Mollison Ave Westbound 5-33 13991 191 10893 170 1351 132 829 425
Mollison Ave Eastbound 37-55 15552 213 12109 189 1502 146 921 473
Hertford Rd (South of A1055) Northbound 5-31 8255 126 6667 80 971 221 165 24
Hertford Rd (South of A1055) Southbound 22-31 9235 141 7459 89 1086 248 185 27
Hertford Rd (North of Ordnance Rd) Northbound 20-37 10924 167 8823 105 1285 293 219 32
Hertford Rd (North of Ordnance Rd) Southbound 20-37 12560 191 10144 121 1478 337 251 37
Ordnance Rd Two-way 34 15087 140 12710 199 1385 411 239 2
Hertford Rd (South of Ordnance Rd) Northbound 8-33 13577 207 10966 131 1597 364 272 40
Hertford Rd (South of Ordnance Rd) Southbound 8-33 16087 246 12993 155 1893 432 322 47
Hertford Rd (South of Carterhatch Ln) Northbound 18-41 17991 274 14531 173 2117 482 360 53
Hertford Rd (South of Carterhatch Ln) Southbound 18-41 14431 220 11656 139 1698 387 289 42
Carterhatch Ln Two-way 9 22413 306 19290 381 1913 233 634 35
Hertford Rd (South of Carterhatch Ln) Northbound 17-28 11739 179 9481 113 1381 315 235 35
Hertford Rd (South of Carterhatch Ln) Southbound 17-28 13514 206 10915 130 1590 363 270 40
Hertford Rd (North of Green St) Northbound 15-17 10270 156 8295 99 1208 276 205 30
Hertford Rd (North of Green St) Southbound 15-17 14072 215 11366 136 1656 377 282 41
Green St Two-way 20 9826 0 9108 0 254 464 0 0
Hertford Rd (South of Green St) Northbound 5-35 8688 133 7017 84 1022 233 174 26
Hertford Rd (South of Green St) Southbound 5-35 12766 195 10311 123 1502 342 255 38

Air quality assessment for Cycle Enfield proposals
10
Table 4.2: Traffic reductions due to scheme
Road DirectionBaseline 2.5% reduction in
total traffic5% reduction in
total traffic10% reduction in
total traffic
Total Car Total Car Total Car Total Car
Hertford Rd (North of A1055) Northbound 16922 13668 16499 13245 16076 12822 15230 11976
Hertford Rd (North of A1055) Southbound 17946 14495 17497 14046 17049 13598 16151 12700
Bullsmoor Ln Westbound 11133 8206 10855 7928 10576 7649 10020 7093
Bullsmoor Ln Eastbound 14003 10321 13653 9971 13303 9621 12603 8921
Mollison Ave Westbound 13991 10893 13641 10543 13291 10193 12592 9494
Mollison Ave Eastbound 15552 12109 15163 11720 14774 11331 13997 10554
Hertford Rd (South of A1055) Northbound 8255 6667 8049 6461 7842 6254 7430 5842
Hertford Rd (South of A1055) Southbound 9235 7459 9004 7228 8773 6997 8312 6536
Hertford Rd (North of Ordnance Rd) Northbound 10924 8823 10651 8550 10378 8277 9832 7731
Hertford Rd (North of Ordnance Rd) Southbound 12560 10144 12246 9830 11932 9516 11304 8888
Ordnance Rd Two-way 15087 12710 14710 12333 14333 11956 13578 11201
Hertford Rd (South of Ordnance Rd) Northbound 13577 10966 13238 10627 12898 10287 12219 9608
Hertford Rd (South of Ordnance Rd) Southbound 16087 12993 15685 12591 15283 12189 14478 11384
Hertford Rd (South of Carterhatch Ln) Northbound 17991 14531 17541 14081 17091 13631 16192 12732
Hertford Rd (South of Carterhatch Ln) Southbound 14431 11656 14070 11295 13709 10934 12988 10213
Carterhatch Ln Two-way 22413 19290 21853 18730 21292 18169 20172 17049
Hertford Rd (South of Carterhatch Ln) Northbound 11739 9481 11446 9188 11152 8894 10565 8307
Hertford Rd (South of Carterhatch Ln) Southbound 13514 10915 13176 10577 12838 10239 12163 9564
Hertford Rd (North of Green St) Northbound 10270 8295 10013 8038 9757 7782 9243 7268
Hertford Rd (North of Green St) Southbound 14072 11366 13720 11014 13368 10662 12665 9959
Green St Two-way 9826 9108 9580 8862 9335 8617 8843 8125
Hertford Rd (South of Green St) Northbound 8688 7017 8471 6800 8254 6583 7819 6148
Hertford Rd (South of Green St) Southbound 12766 10311 12447 9992 12128 9673 11489 9034

Air quality assessment for Cycle Enfield proposals
11
4.1.2 Traffic queues
Queuing was modelled at peak hours for a number of junctions along the A1010, based on traffic modelling data for the current and future scenarios provided by the Council. Queuing was assumed to take place from 07:00 to 09:00 and from 17:00 to 19:00 on weekdays.
Mean maximum queue lengths, in Passenger Car Units (PCUs), were provided for four major junctions along the A1010 for the base case scenario. An average queue length of 5.75m per PCU was used2. The average queue length was assumed to be equal to half the mean maximum queue length for each junction for each modelled scenario, assuming that the queue is fully cleared in each cycle.
The total vehicle idling time per peak hour for each queue was calculated from the average delay time using the traffic flow data described in Sections 4.1.1, using the assumption that all traffic on the link joined a queue (i.e. that no traffic was free-flowing).
Idling emission factors were derived from emissions for the lowest available speed in the published emission factors described in Section 4.1.5.
At many modelled junctions, the proposed development is expected to significantly increase queue lengths and delay times, an effect which will counteract the expected reduction in traffic around junctions.
2Transport for London, Traffic Directorate, Model Auditing Process: Traffic Scehemes in London UrbanNetworks, Design Engineer Guide Version 3.0, March 2011

Air quality assessment for Cycle Enfield proposals
12
4.1.3 Bus stops
Each bus stop was modelled as a 30-metre long road source. The total emission rate for each source was calculated based on the daily average bus flow, assuming that each bus waited at each stop for 60 seconds. Emissions from the bus stops were varied according to timetable information, as shown in Figure 4.1.
Figure 4.1: Bus stop emission profile
4.1.4 Time varying profiles
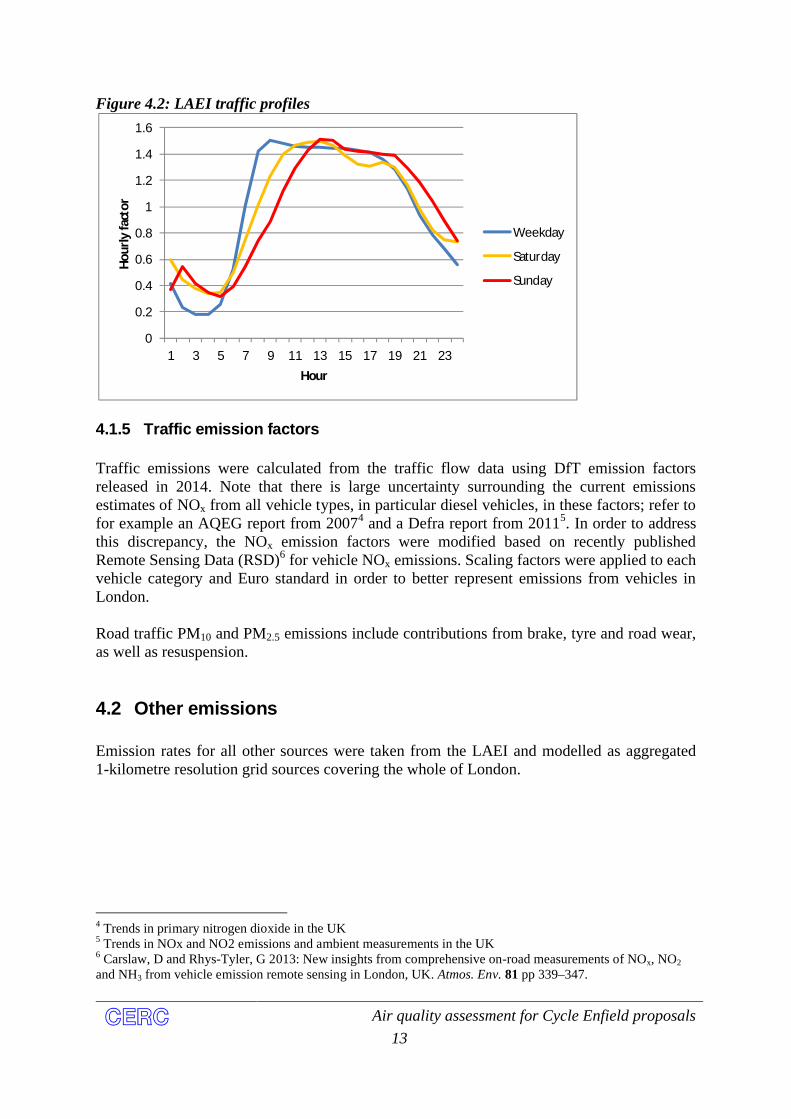
The variation of traffic flow during the day has been taken into account by applying a set of diurnal profiles to the road emissions. These were taken from the report Air pollution and emissions trends in London3 used in the compilation of the LAEI, and are shown in Figure 4.2.
3 Air pollution and emissions trends in London, King’s College London, Environmental Research Group and Leeds University, Institute for Transport studies http://www.airquality.co.uk/reports/cat05/1004010934_MeasurementvsEmissionsTrends.pdf
0.0
0.2
0.4
0.6
0.8
1.0
1.2
1.4
0 4 8 12 16 20 24
Hour
ly fa
ctor
Hour
Weekday
Saturday
Sunday
Air quality assessment for Cycle Enfield proposals
13
Figure 4.2: LAEI traffic profiles
4.1.5 Traffic emission factors
Traffic emissions were calculated from the traffic flow data using DfT emission factors released in 2014. Note that there is large uncertainty surrounding the current emissions estimates of NOx from all vehicle types, in particular diesel vehicles, in these factors; refer to for example an AQEG report from 20074 and a Defra report from 20115. In order to address this discrepancy, the NOx emission factors were modified based on recently published Remote Sensing Data (RSD)6 for vehicle NOx emissions. Scaling factors were applied to each vehicle category and Euro standard in order to better represent emissions from vehicles in London.
Road traffic PM10 and PM2.5 emissions include contributions from brake, tyre and road wear, as well as resuspension.
4.2 Other emissions
Emission rates for all other sources were taken from the LAEI and modelled as aggregated 1-kilometre resolution grid sources covering the whole of London.
4 Trends in primary nitrogen dioxide in the UK5 Trends in NOx and NO2 emissions and ambient measurements in the UK6 Carslaw, D and Rhys-Tyler, G 2013: New insights from comprehensive on-road measurements of NOx, NO2
and NH3 from vehicle emission remote sensing in London, UK. Atmos. Env. 81 pp 339–347.
0
0.2
0.4
0.6
0.8
1
1.2
1.4
1.6
1 3 5 7 9 11 13 15 17 19 21 23
Hou
rly fa
ctor
Hour
Weekday
Saturday
Sunday

Air quality assessment for Cycle Enfield proposals
14
5 Model set-up
Modelling was carried out using the ADMS-Urban7 model (version 3.4.5). The model uses the detailed emissions data described in Section 4 together with a range of other input data to calculate the dispersion of pollutants. This section summarises the data and assumptions used in the modelling.
5.1 Surface roughness
A length scale parameter called the surface roughness length is used in the model to characterise the study area in terms of the effects it will have on wind speed and turbulence, which are key factors in the modelling. A value of 1.0 m was used for the modelled area, representing the built-up nature of the area.
5.2 Street canyons
Tall buildings lining the edges of roads have the effect of trapping and recirculating pollutants emitted by traffic and therefore increasing roadside pollutant concentrations. This street canyon effect has been modelled using the ADMS-Urban Advanced Street Canyon option.
The advanced street canyon modelling option in ADMS-Urban modifies the dispersion of pollutants from a road source according to the presence and properties of canyon walls on one or both sides of the road. It takes into account the following effects:
Pollutants channelled along street canyons; Pollutants dispersed across street canyons by circulating flow at road height; Pollutants trapped in recirculation regions; Pollutants leaving the canyon through gaps between buildings as if there was no
canyon; and Pollutants leaving the canyon from the canyon top.
Building geometry from OpenStreetMap and Ordnance Survey were used to calculate canyon data for each side of each road including:
Whether there is a canyon wall, the minimum height and building length; The average, minimum and maximum height; The distance of the canyon wall from the road; and The canyon wall porosity, i.e. the proportion of canyon wall without buildings
7 http://www.cerc.co.uk/environmental-software/ADMS-Urban-model.html

Air quality assessment for Cycle Enfield proposals
15
5.3 Monin-Obukhov length
In urban and suburban areas a significant amount of heat is emitted by buildings and traffic, which warms the air within and above a city. This is known as the urban heat island and its effect is to prevent the atmosphere from becoming very stable. In general, the larger the urban area the more heat is generated and the stronger the effect becomes.
In the ADMS-Urban model, the stability of the atmosphere is represented by the Monin-Obukhov parameter, which has the dimension of length. In very stable conditions it has a positive value of between 2 metres and 20 metres. In near neutral conditions its magnitude is very large, and it has either a positive or negative value depending on whether the surface is being heated or cooled by the air above it. In very convective conditions it is negative with a magnitude of typically less than 20 metres.
The effect of the urban heat island is that, in stable conditions, the Monin-Obukhov length will never fall below some minimum value; the larger the city, the larger the minimum value. A value of 75 metres was used in the modelling.
5.4 Meteorological data
Meteorological data from Heathrow for the year 2014 were used in the modelling. A summary of the data is given in Table 5.1. Figure 5.1 shows a wind rose giving the frequency of occurrence of wind from different directions for a number of wind speed ranges.
Table 5.1: Summary of meteorological dataMinimum Maximum Mean
Temperature (°C) -3.5 29.7 11.5
Wind speed (m/s) 0 17.5 4.2
Cloud cover (oktas) 0 8.0 3.9
Figure 5.1: Wind rose for Heathrow, 2014
0
0
3
1.5
6
3.1
10
5.1
16
8.2
(knots)
(m/s)
Wind speed
0° 10°20°
30°
40°
50°
60°
70°
80°
90°
100°
110°
120°
130°
140°
150°160°
170°180°190°200°
210°
220°
230°
240°
250°
260°
270°
280°
290°
300°
310°
320°
330°340°
350°
100
200
300
400
500
600

Air quality assessment for Cycle Enfield proposals
16
5.5 Background concentrations
Nitrogen dioxide (NO2) results from direct emissions from combustion sources together with chemical reactions in the atmosphere involving NO2, nitric oxide (NO) and ozone (O3). The combination of NO and NO2 is referred to as nitrogen oxides (NOx).
The chemical reactions taking place in the atmosphere were taken into account in the modelling using the Generic Reaction Set (GRS) of equations. These use hourly average background concentrations of NOx, NO2 and O3, together with meteorological and modelled emissions data to calculate the NO2 concentration at a given point.
Hourly background data for these pollutants and ozone were input to the model to represent the concentrations in the air being blown into the city.
NOx, NO2 and O3 concentrations from Rochester, Harwell, Lullington Heath and Wicken Fen were input to the model, the monitored concentration used for each hour depending upon the wind direction for that hour, as shown in Figure 5.1.
Two sources of PM10, PM2.5, and SO2 background data were used for the modelling. For hours for which the wind direction was from the west, rural data from Harwell were used, and for hours for which the wind direction was from the east, rural measurements from Rochester were used.
Figure 5.2: Wind direction segments used to calculate background concentrations for NOx, NO2 and O3 (left) and PM10, PM2.5 and SO2 (right)
Table 5.2 summarises the annual statistics of the resulting background concentrations used in the modelling for 2014. It was assumed that background concentrations would not change significantly between 2014 and 2016.
Table 5.2: Background concentrations for 2014 (µg/m3)NOx NO2 O3 PM10 PM2.5 SO2
Annual average 9.8 7.5 54.6 15.4 10.7 1.3
99.79th percentile of hourly average 103.8 59.4 112.9 - - -
90.41st percentile of 24-hour average - - - 26.5 25.6 2.2
Air quality assessment for Cycle Enfield proposals
17
6 Model verification
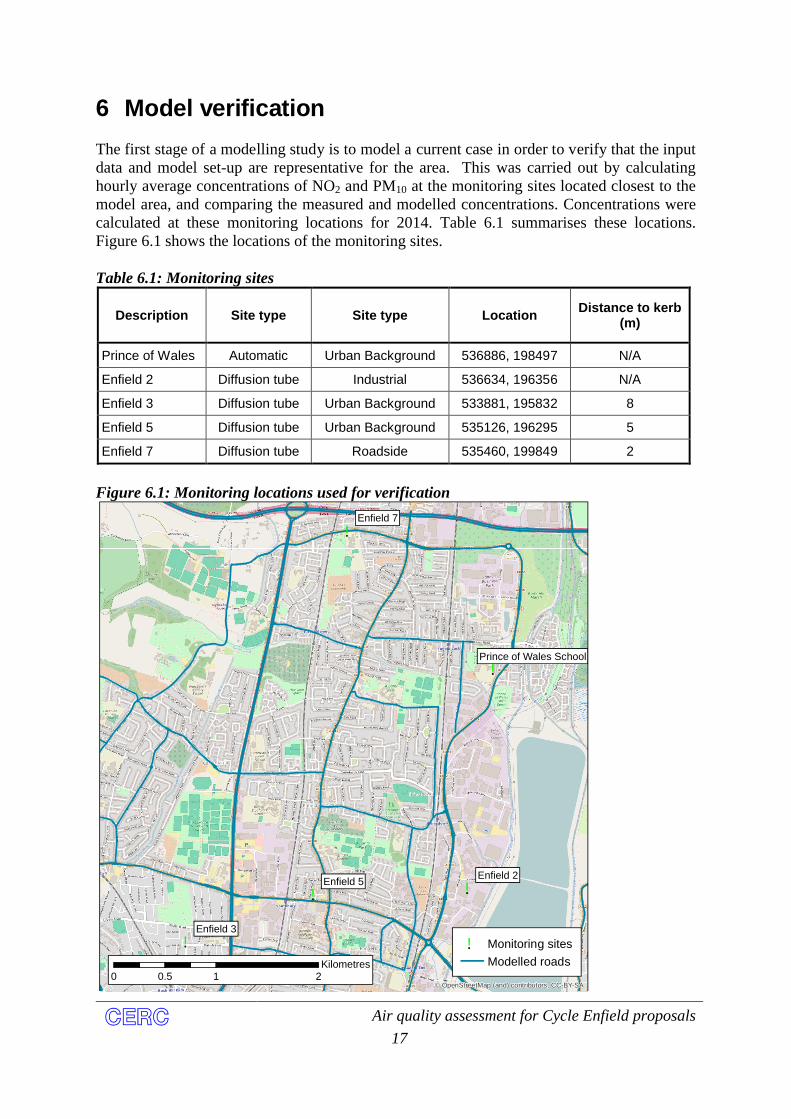
The first stage of a modelling study is to model a current case in order to verify that the input data and model set-up are representative for the area. This was carried out by calculating hourly average concentrations of NO2 and PM10 at the monitoring sites located closest to the model area, and comparing the measured and modelled concentrations. Concentrations were calculated at these monitoring locations for 2014. Table 6.1 summarises these locations. Figure 6.1 shows the locations of the monitoring sites.
Table 6.1: Monitoring sites
Description Site type Site type LocationDistance to kerb
(m)
Prince of Wales Automatic Urban Background 536886, 198497 N/A
Enfield 2 Diffusion tube Industrial 536634, 196356 N/A
Enfield 3 Diffusion tube Urban Background 533881, 195832 8
Enfield 5 Diffusion tube Urban Background 535126, 196295 5
Enfield 7 Diffusion tube Roadside 535460, 199849 2
Figure 6.1: Monitoring locations used for verification
!.
!.
!.
!.
!.Enfield 7
Enfield 5
Enfield 3
Enfield 2
Prince of Wales School
© OpenStreetMap (and) contributors, CC-BY-SA
!. Monitoring sites
Modelled roads0 1 20.5
Kilometres

Air quality assessment for Cycle Enfield proposals
18
Table 6.2 presents the measured and modelled concentrations of NO2 at the monitoring locations for 2014. The modelled annual average NO2 concentrations show generally good agreement. There is no consistent over or underprediction of concentrations with two of the sites showing agreement within 5% and two more showing agreement within 25%.
Table 6.2: Measured and modelled NOx and NO2 concentrations, 2014, µg/m3
Site nameAnnual average NOx Annual average NO2
99.79th percentile of hourly-average NO2
concentrations
Measured Modelled Measured Modelled Measured Modelled
Prince of Wales 50.2 36.1 24.2 25.1 82.8 102.7
Enfield 2 - - 29.9 31.4 - -
Enfield 3 - - 27.9 22.3 - -
Enfield 5 - - 36.7 26.6 - -
Enfield 7 - - 32.4 39.8 - -
There are no PM10 monitors within the modelling area; Table 6.3 presents the monitored and modelled concentrations of PM10 at the nearest site, Bowes Road, for 2014. The predicted annual average PM10 concentration and 90.41st percentile of 24-hourly average PM10
concentrations shows good agreement with the monitored values.
Table 6.3: Modelled and monitored PM10 concentrations, 2014, µg/m3
Site name Site typeAnnual average PM10
90.41st percentile of 24-houraverage PM10 concentrations
Measured Modelled Measured Modelled
Bowes Road Roadside 21.4 20.4 36.8 37.8
These results show that the model setup accurately predicts concentrations at urban background and roadside locations in Enfield, and provides confidence in model results for future scenarios.

Air quality assessment for Cycle Enfield proposals
19
7 2016 scenario modelling
Ground level concentrations of NO2 and PM10 were calculated on a grid of receptor points for the area around the A1010 North and other affected roads, with a resolution of 10m close to the roads, with additional points added along the roads where the concentration gradients are steepest. Concentrations were predicted to allow comparison against the air quality standards presented in Section 3, and presented in the form of coloured contour maps.
7.1 NO2 air quality maps
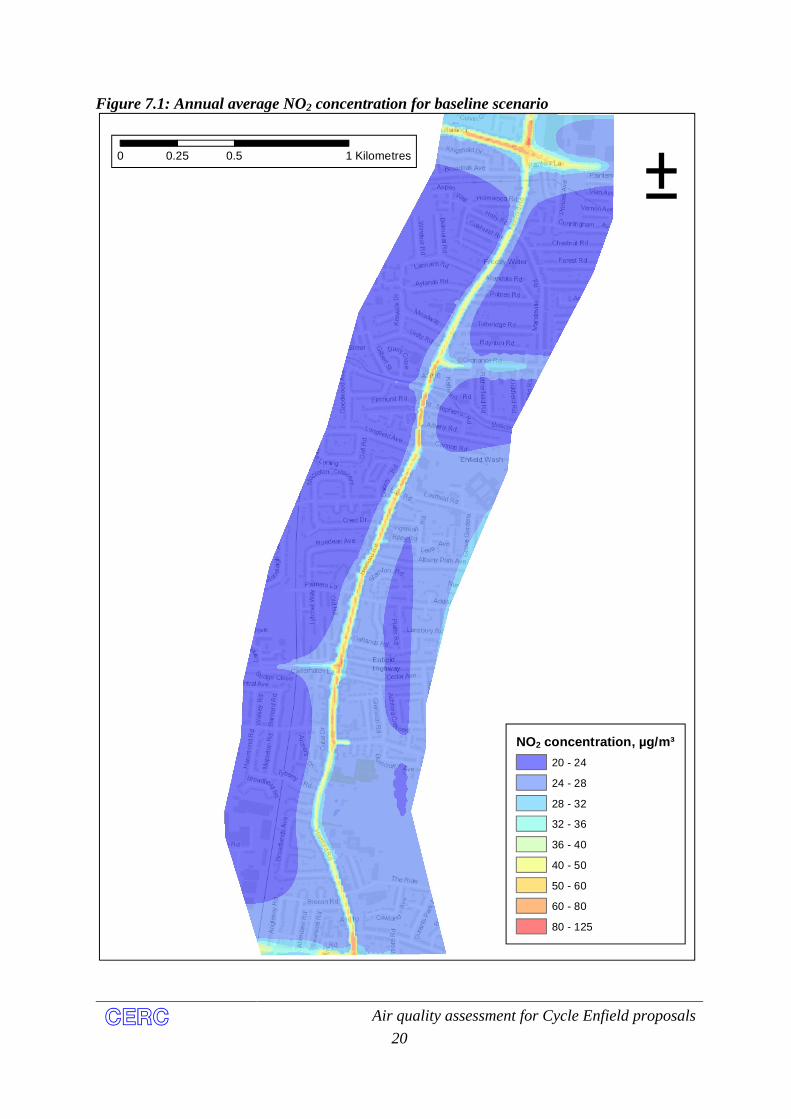
Figure 7.1 and Figure 7.2 show contour plots of the annual average and 99.79th percentile of hourly average NO2 concentrations for 2016 without the Cycle Enfield proposals. The air quality standard for annual average NO2 concentrations is likely to be exceeded along the length of the A1010, although exceedences are likely to be restricted to roadside building facades with the highest concentrations at major junctions. The air quality standard for hourly average NO2 concentrations is only predicted to be exceeded at roadside at the busiest junctions.
Figure 7.3 to Figure 7.5 show the predicted annual average NO2 concentrations for 2016 with the proposed scheme in place, taking into account the traffic reductions of 2.5%, 5% and 10% and the corresponding changes to traffic queues. Also shown are difference plots, showing the change in concentrations relative to the base case.
With the introduction of the proposals and a 2.5% reduction in traffic, annual average NO2
concentrations are predicted to reduce by up to 0.5 µg/m³ at roadside locations. The introduction of the scheme is predicted to result in some increases in queue length and delay time leading to increases in concentrations at junctions.
With greater reductions in traffic flows, the increases in concentrations at queues generally become smaller and the decreases in concentrations along the rest of the road become greater. With a 10% reduction in traffic, annual average NO2 concentrations at roadside locations are predicted to decrease by up to 1.5 µg/m³. None of the scenarios considered is predicted to eliminate exceedences of the air quality objectives in the area.
Air quality assessment for Cycle Enfield proposals
20
Figure 7.1: Annual average NO2 concentration for baseline scenario
NO2 concentration, µg/m³
20 - 24
24 - 28
28 - 32
32 - 36
36 - 40
40 - 50
50 - 60
60 - 80
80 - 125
0 0.5 10.25 Kilometres
±

Air quality assessment for Cycle Enfield proposals
21
Figure 7.2: 99.79th percentile of hourly average NO2 concentrations for baseline scenario
NO2 concentration, µg/m³
< 100
100 - 125
125 - 150
150 - 175
175 - 200
200 - 300
300 - 600
0 0.5 10.25 Kilometres
±

Air quality assessment for Cycle Enfield proposals
22
Figure 7.3: Annual average NO2 concentrations for 2.5% traffic reduction scenario (left) and difference plot (right)
Contains OS data © Crown Copyright anddatabase right 2016
NO2 concentration, µg/m³
20 - 24
24 - 28
28 - 32
32 - 36
36 - 40
40 - 50
50 - 60
60 - 80
80 - 125
0 0.50.25 Kilometres ±
Contains OS data © Crown Copyright anddatabase right 2016
Change, µg/m³
-15 - -5
-5 - -2.5
-2.5 - -1
-1 - -0.5
-0.5 - -0.25
-0.25 - 0.25
0.25 - 0.5
0.5 - 1
1 - 5
5 - 20

Air quality assessment for Cycle Enfield proposals
23
Figure 7.4: Annual average NO2 concentrations for 5% traffic reduction scenario (left) and difference plot (right)
Contains OS data © Crown Copyright anddatabase right 2016
NO2 concentration, µg/m³
20 - 24
24 - 28
28 - 32
32 - 36
36 - 40
40 - 50
50 - 60
60 - 80
80 - 125
0 0.50.25 Kilometres ±
Contains OS data © Crown Copyright anddatabase right 2016
Change, µg/m³
-15 - -5
-5 - -2.5
-2.5 - -1
-1 - -0.5
-0.5 - -0.25
-0.25 - 0.25
0.25 - 0.5
0.5 - 1
1 - 5
5 - 20

Air quality assessment for Cycle Enfield proposals
24
Figure 7.5: Annual average NO2 concentrations for 10% traffic reduction scenario (left) and difference plot (right)
Contains OS data © Crown Copyright anddatabase right 2016
NO2 concentration, µg/m³
20 - 24
24 - 28
28 - 32
32 - 36
36 - 40
40 - 50
50 - 60
60 - 80
80 - 125
0 0.50.25 Kilometres ±
Contains OS data © Crown Copyright anddatabase right 2016
Change, µg/m³
-15 - -5
-5 - -2.5
-2.5 - -1
-1 - -0.5
-0.5 - -0.25
-0.25 - 0.25
0.25 - 0.5
0.5 - 1
1 - 5
5 - 20

Air quality assessment for Cycle Enfield proposals
25
7.2 PM10 air quality maps
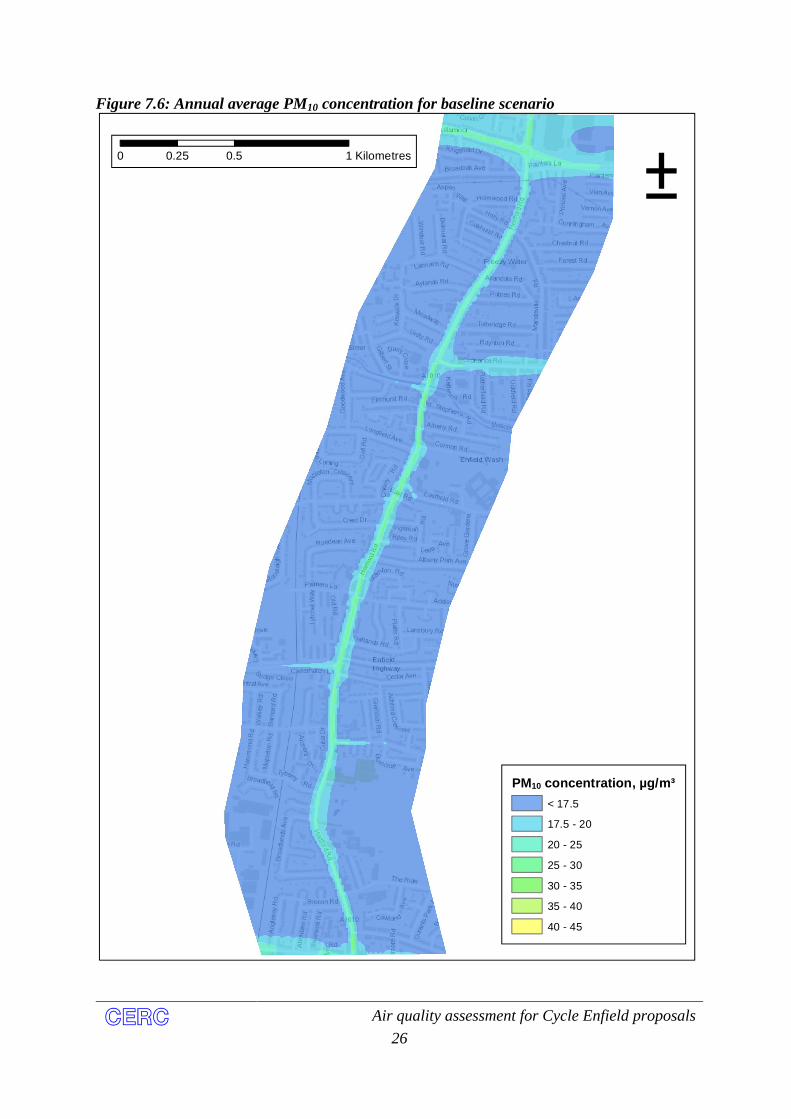
Figure 7.6 and Figure 7.7 show contour plots of the annual average and 90.41st percentile of 24-hour average PM10 concentrations for 2016 without the Cycle Enfield proposals. The plots show that the air quality standard for annual average PM10 concentrations is not likely to be exceeded along the A1010.
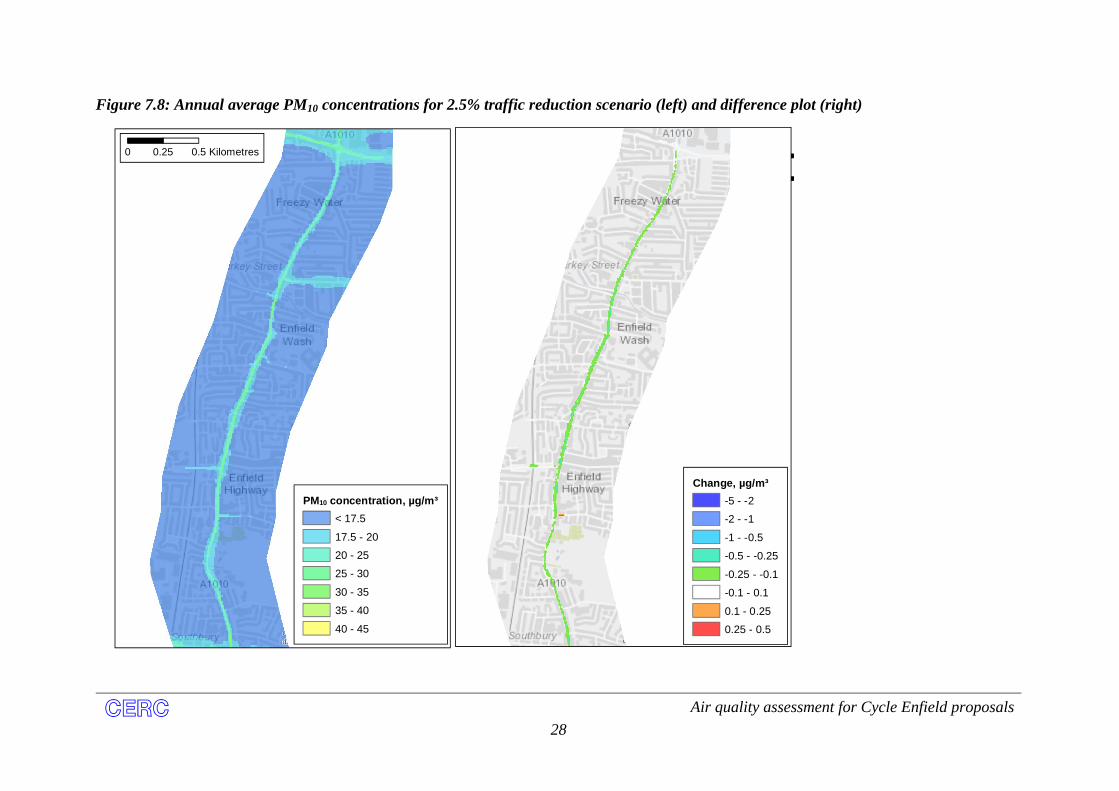
Figure 7.8 to Figure 7.10 show the predicted annual average PM10 concentrations for 2016 taking into account the traffic reductions of 2.5%, 5% and 10% and the corresponding changes to traffic queues. Also shown are difference plots, showing the change in concentrations from the base case.
The air quality objectives for PM10 concentrations are not predicted to be exceeded anywhere along the A1010 North.
The changes to the traffic flows along the A1010 are predicted to bring about only small decreases in PM10 concentrations. The effect of the increased queuing on PM10
concentrations is not as noticeable as for NO2 because there are no emissions from queuing traffic from brake wear, tyre wear, road wear or resuspension.
Air quality assessment for Cycle Enfield proposals
26
Figure 7.6: Annual average PM10 concentration for baseline scenario
PM10 concentration, µg/m³
< 17.5
17.5 - 20
20 - 25
25 - 30
30 - 35
35 - 40
40 - 45
0 0.5 10.25 Kilometres
±

Air quality assessment for Cycle Enfield proposals
27
Figure 7.7: 90.41st percentile of 24-hour average PM10 concentrations for baseline scenario
PM10 concentration, µg/m³
< 30
30 - 35
35 - 40
40 - 45
45 - 50
50 - 55
55 - 65
0 0.5 10.25 Kilometres
±
Air quality assessment for Cycle Enfield proposals
28
Figure 7.8: Annual average PM10 concentrations for 2.5% traffic reduction scenario (left) and difference plot (right)
Contains OS data © Crown Copyright anddatabase right 2016
PM10 concentration, µg/m³
< 17.5
17.5 - 20
20 - 25
25 - 30
30 - 35
35 - 40
40 - 45
0 0.50.25 Kilometres ±
Contains OS data © Crown Copyright anddatabase right 2016
Change, µg/m³
-5 - -2
-2 - -1
-1 - -0.5
-0.5 - -0.25
-0.25 - -0.1
-0.1 - 0.1
0.1 - 0.25
0.25 - 0.5

Air quality assessment for Cycle Enfield proposals
29
Figure 7.9: Annual average PM10 concentrations for 5% traffic reduction scenario (left) and difference plot (right)
Contains OS data © Crown Copyright anddatabase right 2016
PM10 concentration, µg/m³
< 17.5
17.5 - 20
20 - 25
25 - 30
30 - 35
35 - 40
40 - 45
0 0.50.25 Kilometres ±
Contains OS data © Crown Copyright anddatabase right 2016
Change, µg/m³
-5 - -2
-2 - -1
-1 - -0.5
-0.5 - -0.25
-0.25 - -0.1
-0.1 - 0.1
0.1 - 0.25
0.25 - 0.5

Air quality assessment for Cycle Enfield proposals
30
Figure 7.10: Annual average PM10 concentrations for 10% traffic reduction scenario (left) and difference plot (right)
Contains OS data © Crown Copyright anddatabase right 2016
PM10 concentration, µg/m³
< 17.5
17.5 - 20
20 - 25
25 - 30
30 - 35
35 - 40
40 - 45
0 0.50.25 Kilometres ±
Contains OS data © Crown Copyright anddatabase right 2016
Change, µg/m³
-5 - -2
-2 - -1
-1 - -0.5
-0.5 - -0.25
-0.25 - -0.1
-0.1 - 0.1
0.1 - 0.25
0.25 - 0.5

Air quality assessment for Cycle Enfield proposals
31
7.3 PM2.5 concentrations
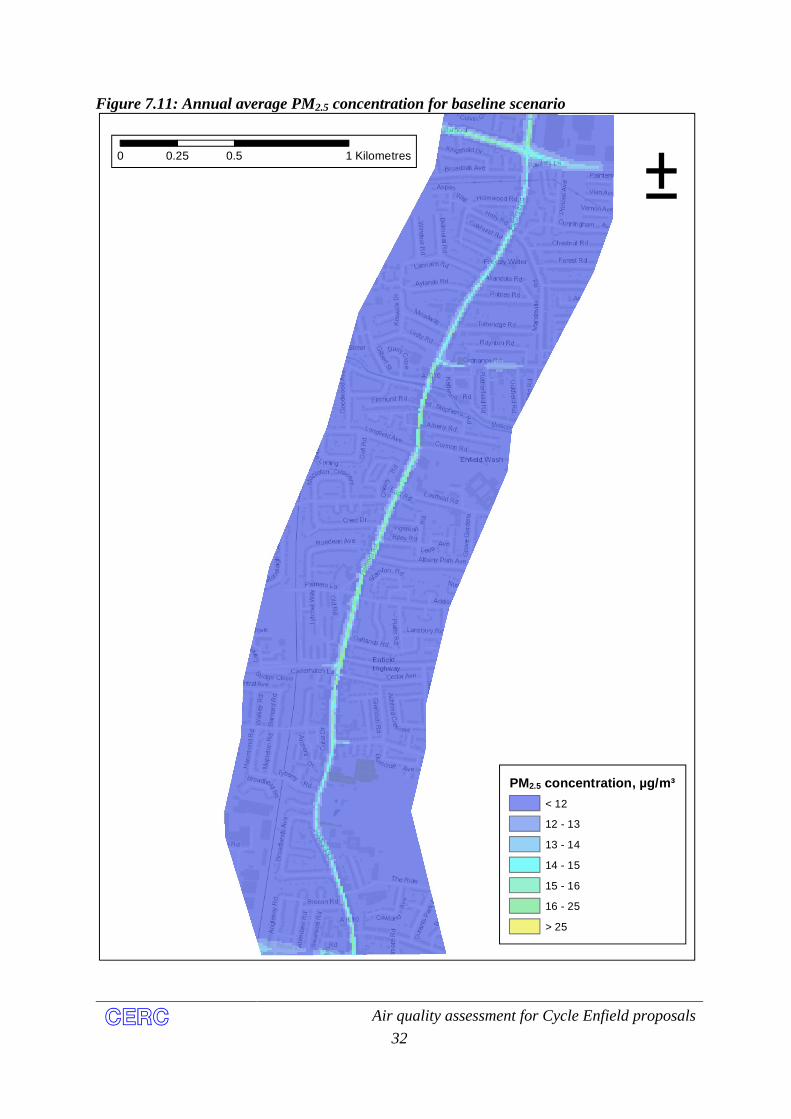
Figure 7.11 shows a contour plot of the annual average PM2.5 concentrations for 2016 without the Cycle Enfield proposals. The plots show that the air quality standard for annual average PM2.5 concentrations is not likely to be exceeded along the A1010.
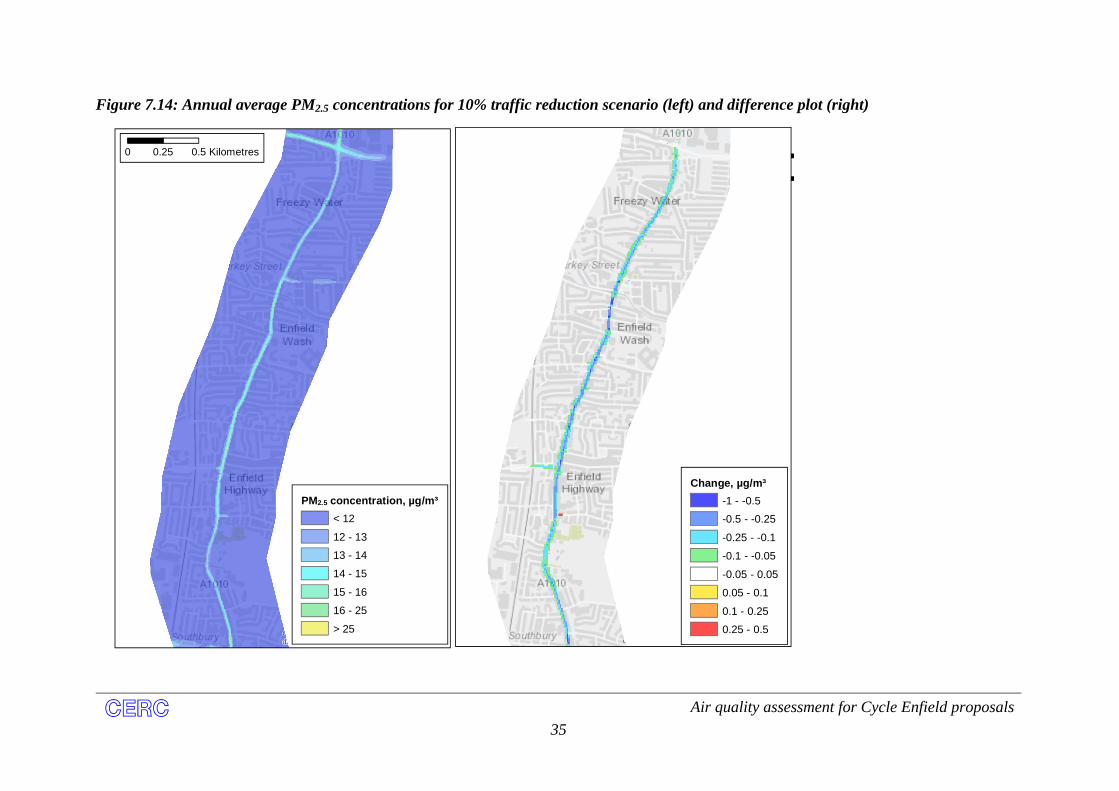
Figure 7.12 to Figure 7.14 show the predicted annual average PM2.5 concentrations for 2016 taking into account the traffic reductions of 2.5%, 5% and 10% and the corresponding changes to traffic queues. Also shown are difference plots, showing the change in concentrations from the base case.
The traffic reductions are only predicted to result in small reductions in PM2.5 concentrations.
Air quality assessment for Cycle Enfield proposals
32
Figure 7.11: Annual average PM2.5 concentration for baseline scenario
PM2.5 concentration, µg/m³
< 12
12 - 13
13 - 14
14 - 15
15 - 16
16 - 25
> 25
0 0.5 10.25 Kilometres
±

Air quality assessment for Cycle Enfield proposals
33
Figure 7.12: Annual average PM2.5 concentrations for 2.5% traffic reduction scenario (left) and difference plot (right)
Contains OS data © Crown Copyright anddatabase right 2016
PM2.5 concentration, µg/m³
< 12
12 - 13
13 - 14
14 - 15
15 - 16
16 - 25
> 25
0 0.50.25 Kilometres ±
Contains OS data © Crown Copyright anddatabase right 2016
Change, µg/m³
-1 - -0.5
-0.5 - -0.25
-0.25 - -0.1
-0.1 - -0.05
-0.05 - 0.05
0.05 - 0.1
0.1 - 0.25
0.25 - 0.5

Air quality assessment for Cycle Enfield proposals
34
Figure 7.13: Annual average PM2.5 concentrations for 5% traffic reduction scenario (left) and difference plot (right)
Contains OS data © Crown Copyright anddatabase right 2016
PM2.5 concentration, µg/m³
< 12
12 - 13
13 - 14
14 - 15
15 - 16
16 - 25
> 25
0 0.50.25 Kilometres ±
Contains OS data © Crown Copyright anddatabase right 2016
Change, µg/m³
-1 - -0.5
-0.5 - -0.25
-0.25 - -0.1
-0.1 - -0.05
-0.05 - 0.05
0.05 - 0.1
0.1 - 0.25
0.25 - 0.5
Air quality assessment for Cycle Enfield proposals
35
Figure 7.14: Annual average PM2.5 concentrations for 10% traffic reduction scenario (left) and difference plot (right)
Contains OS data © Crown Copyright anddatabase right 2016
PM2.5 concentration, µg/m³
< 12
12 - 13
13 - 14
14 - 15
15 - 16
16 - 25
> 25
0 0.50.25 Kilometres ±
Contains OS data © Crown Copyright anddatabase right 2016
Change, µg/m³
-1 - -0.5
-0.5 - -0.25
-0.25 - -0.1
-0.1 - -0.05
-0.05 - 0.05
0.05 - 0.1
0.1 - 0.25
0.25 - 0.5
Air quality assessment for Cycle Enfield proposals
36
8 Discussion
Air quality modelling was carried out using ADMS-Urban to assess the impact of a proposal to introduce a segregated cycle way along the A1010 North, including projected traffic reductions associated with the scheme. Currently 0.7% of journeys in Enfield are by bike. As well as the introduction of safe cycle routes, Cycle Enfield is also providing free cycle training for anyone that lives, works or studies in Enfield, installing more cycle parking and introducing a £10 bike loan scheme. These are expected to increase the modal share to 5% by 2020.
The modelling took into account the effect of emissions from free-flowing traffic, queuing traffic and idling buses using bus timetable data and traffic flow and queue data supplied by the Council. Four scenarios were modelled for 2016:
a baseline scenario without the proposed scheme; and three scenarios with the scheme in place representing 2.5%, 5% and 10% reductions
in traffic flows with corresponding changes to traffic queues.
With the introduction of the proposals and a 2.5% reduction in traffic, annual average NO2
concentrations are predicted to reduce by up to 0.5 µg/m³ at roadside locations. The introduction of the scheme is predicted to result in some increases in queue length and delay time leading to increases in concentrations at junctions. However, the area of these increases will be much smaller than the area of air quality improvements resulting from reduced traffic flows. As a result the majority of residents along this road will experience an improvement in air quality and corresponding health benefits.
With greater reductions in traffic flows, the increases in concentrations at queues generally become smaller and the decreases along the rest of the road become greater. With a traffic reduction of 10%, roadside annual average NO2 concentrations are predicted to decrease by up to 1.5 µg/m³.
The changes to the traffic flows along the A1010 are predicted to bring about only small decreases in PM10 and PM2.5 concentrations. The effect of the increased queuing on PM10
and PM2.5 concentrations is not as noticeable as for NO2 because there are no emissions from queuing traffic from brake wear, tyre wear, road wear or resuspension.
Air quality assessment for Cycle Enfield proposals
37
APPENDIX A: Summary of ADMS-Urban
ADMS-Urban is a practical air pollution modelling tool, which has been developed to provide detailed predictions of pollution concentrations for all sizes of study area. The model can be used to look at concentrations near a single road junction or over a region extending across the whole of a major city. ADMS-Urban has therefore been extensively used for the Review and Assessment of Air Quality carried out by Local Authorities in the UK. The following is a summary of the capabilities and validation of ADMS-Urban. More details can be found on the CERC web site at www.cerc.co.uk.
ADMS-Urban is a development of the Atmospheric Dispersion Modelling System (ADMS), which has been developed to investigate the impacts of emissions from industrial facilities. ADMS-Urban allows full characterisation of the wide variety of emissions in urban areas, including an extensively validated road traffic emissions model. It also boasts a number of other features, which include consideration of:
the effects of vehicle movement on the dispersion of traffic emissions; the behaviour of material released into street-canyons; the chemical reactions occurring between nitrogen oxides, ozone and Volatile Organic
Compounds (VOCs); the pollution entering a study area from beyond its boundaries; the effects of complex terrain on the dispersion of pollutants; and the effects of a building on the dispersion of pollutants emitted nearby.
More details of these features are given below.
Studies of extensive urban areas are necessarily complex, requiring the manipulation of large amounts of data. To allow users to cope effectively with this requirement, ADMS-Urban has been designed to operate in the widely familiar PC environment, under Microsoft Windows 7, Windows Vista or XP. The manipulation of data is further facilitated by the possible integration of ADMS-Urban with a Geographical Information System (GIS) such as MapInfo or ArcGIS, and with the CERC Emissions Inventory Toolkit, EMIT.
Dispersion Modelling
ADMS-Urban uses boundary layer similarity profiles in which the boundary layer structure is characterised by the height of the boundary layer and the Monin-Obukhov length, a length scale dependent on the friction velocity and the heat flux at the ground. This has significant advantages over earlier methods in which the dispersion parameters did not vary with height within the boundary layer.
In stable and neutral conditions, dispersion is represented by a Gaussian distribution. In convective conditions, the vertical distribution takes account of the skewed structure of the vertical component of turbulence. This is necessary to reflect the fact that, under convective conditions, rising air is typically of limited spatial extent but is balanced by descending air extending over a much larger area. This leads to higher ground-level concentrations than would be given by a simple Gaussian representation.
Air quality assessment for Cycle Enfield proposals
38
Emissions
Emissions into the atmosphere across an urban area typically come from a wide variety of sources. There are likely to be industrial emissions from chimneys as well as emissions from road traffic and domestic heating systems. To represent the full range of emissions configurations, the explicit source types available within ADMS-Urban are: Industrial points, for which plume rise and stack downwash are included in the
modelling. Roads, for which emissions are specified in terms of vehicle flows and the additional
initial dispersion caused by moving vehicles is also taken into account. Areas, where a source or sources is best represented as uniformly spread over an area. Volumes, where a source or sources is best represented as uniformly spread
throughout a volume.
In addition, sources can also be modelled as a regular grid of emissions. This allows the contributions of large numbers of minor sources to be efficiently included in a study while the majority of the modelling effort is used for the relatively few significant sources.
ADMS-Urban can be used in conjunction with CERC’s Emissions Inventory Toolkit, EMIT, which facilitates the management and manipulation of large and complex data sets into usable emissions inventories.
Presentation of Results
For most situations ADMS-Urban is used to model the fate of emissions for a large number of different meteorological conditions. Typically, meteorological data are input for every hour during a year or for a set of conditions representing all those occurring at a given location. ADMS-Urban uses these individual results to calculate statistics for the whole data set. These are usually average values, including rolling averages, percentiles and the number of hours for which specified concentration thresholds are exceeded. This allows ADMS-Urban to be used to calculate concentrations for direct comparison with existing air quality limits, guidelines and objectives, in whatever form they are specified.
ADMS-Urban can be integrated with the ArcGIS or MapInfo GIS to facilitate both the compilation and manipulation of the emissions information required as input to the model and the interpretation and presentation of the air quality results provided.
Complex Effects - Street Canyons
The Operational Street Pollution Model (OSPM)8, developed by the Danish National
Environmental Research Institute (NERI), has been incorporated within ADMS-Urban.
8 Hertel, O., Berkowicz, R. and Larssen, S., 1990, ‘The Operational Street Pollution Model (OSPM).’ 18th
International meeting of NATO/CCMS on Air Pollution Modelling and its Applications. Vancouver, Canada, pp741-749.
Air quality assessment for Cycle Enfield proposals
39
The OSPM uses a simplified flow and dispersion model to simulate the effects of the vortex that occurs within street canyons when the wind-flow above the buildings has a component perpendicular to the direction of the street. The model takes account of vehicle-induced turbulence. The model has been validated against Danish and Norwegian data.
Complex Effects - Chemistry
ADMS-Urban includes the Generic Reaction Set (GRS)9 atmospheric chemistry scheme. The original scheme has seven reactions, including those occurring between nitrogen oxides and ozone. The remaining reactions are parameterisations of the large number of reactions involving a wide range of Volatile Organic Compounds (VOCs). In addition, an eighth reaction has been included within ADMS-Urban for the situation when high concentrations of nitric oxide (NO) can convert to nitrogen dioxide (NO2) using molecular oxygen.
In addition to the basic GRS scheme, ADMS-Urban also includes a trajectory model10 for use when modelling large areas. This permits the chemical conversions of the emissions and background concentrations upwind of each location to be properly taken into account.
Complex Effects – Terrain and Roughness
Complex terrain can have a significant impact on wind-flow and consequently on the fate of dispersing material. Primarily, terrain can deflect the wind and therefore change the route taken by dispersing material. Terrain can also increase the levels of turbulence in the atmosphere, resulting in increased dilution of material. This is of particular significance during stable conditions, under which a sharp change with height can exist between flows deflected over hills and those deflected around hills or through valleys. The height of dispersing material is therefore important in determining the route it takes. In addition areas of reverse flow, similar in form and effect to those occurring adjacent to buildings, can occur on the downwind side of a hill.
Changes in the surface roughness can also change the vertical structure of the boundary layer,affecting both the mean wind and levels of turbulence.
9 Venkatram, A., Karamchandani, P., Pai, P. and Goldstein, R., 1994, ‘The Development and Application of a Simplified Ozone Modelling System.’ Atmospheric Environment, Vol 28, No 22, pp3665-3678.10 Singles, R.J., Sutton, M.A. and Weston, K.J., 1997, ‘A multi-layer model to describe the atmospheric transport and deposition of ammonia in Great Britain.’ In: International Conference on Atmospheric Ammonia: Emission, Deposition and Environmental Impacts. Atmospheric Environment, Vol 32, No 3.
Air quality assessment for Cycle Enfield proposals
40
The ADMS-Urban Complex Terrain Module models these effects using the wind-flow model FLOWSTAR11. This model uses linearised analytical solutions of the momentum and continuity equations, and includes the effects of stratification on the flow. Ideally hills should have moderate slopes (up to 1 in 2 on upwind slopes and hill summits, up to 1 in 3 in hill wakes), but the model is useful even when these criteria are not met. The terrain height is specified at up to 16,500 points that are interpolated by the model onto a regular grid of up to 128 by 128 points. The best results are achieved if the specified data points are regularly spaced. FLOWSTAR has been extensively tested with laboratory and field data.
Regions of reverse flow are treated by assuming that any emissions into the region are uniformly mixed within it. Material then disperses away from the region as if it were a virtual point source. Material emitted elsewhere is not able to enter reverse flow regions.
Complex Effects - Buildings
A building or similar large obstruction can affect dispersion in three ways:
1. It deflects the wind flow and therefore the route followed by dispersing material;2. This deflection increases levels of turbulence, possibly enhancing dispersion; and3. Material can become entrained in a highly turbulent, recirculating flow region or cavity on
the downwind side of the building.
The third effect is of particular importance because it can bring relatively concentrated material down to ground-level near to a source. From experience, this occurs to a significant extent in more than 95% of studies for industrial facilities.
The buildings effects module in ADMS-Urban has been developed using extensive published data from scale-model studies in wind-tunnels, CFD modelling and field experiments on the dispersion of pollution from sources near large structures. It operates out to a distance of about 30 building heights from the building and has the following stages:(i) A complex of buildings is reduced to a single rectangular block with the height of the
dominant building and representative streamwise and crosswind lengths.(ii) The disturbed flow field consists of a recirculating flow region in the lee of the
building with a diminishing turbulent wake downwind, as shown in Figure A1.(iii) Concentrations within the well-mixed recirculating flow region are uniform and based
upon the fraction of the release that is entrained.(iv) Concentrations further downwind in the main wake are the sum of those from two
plumes: a ground level plume from the recirculating flow region and an elevated plume from the non-entrained remainder.
11 Carruthers D.J., Hunt J.C.R. and Weng W-S. 1988. ‘A computational model of stratified turbulent airflow over hills – FLOWSTAR I.’ Proceedings of Envirosoft. In: Computer Techniques in Environmental Studies,P. Zanetti (Ed) pp 481-492. Springer-Verlag.

Air quality assessment for Cycle Enfield proposals
41
Data Comparisons – Model Validation
ADMS-Urban is a development of the Atmospheric Dispersion Modelling System (ADMS), which is used throughout the UK by industry and the Environment Agency to model emissions from industrial sources. ADMS has been subject to extensive validation, both of individual components (e.g. point source, street canyon, building effects and meteorological pre-processor) and of its overall performance.
ADMS-Urban has been extensively tested and validated against monitoring data for large urban areas in the UK, including Central London and Birmingham, for which a large scale project was carried out on behalf of the DETR (now DEFRA).
Further details of ADMS-Urban and model validation, including a full list of references, are available from the CERC web site at www.cerc.co.uk.
Figure A3.1: Stages in the modelling of building effects