Embed Size (px)
Citation preview
Linking Good Movement to Economic Prosperity and Environmental QualityUCLA Lake Arrowhead
Dave Souten, Managing PrincipalENVIRON International CorporationNovato, CA 94945
Air Quality and Energy Issues
Trucks, Trains, Ships, and Planes:An Update on Goods
Movement-Related Emissions
October 24-26, 2004
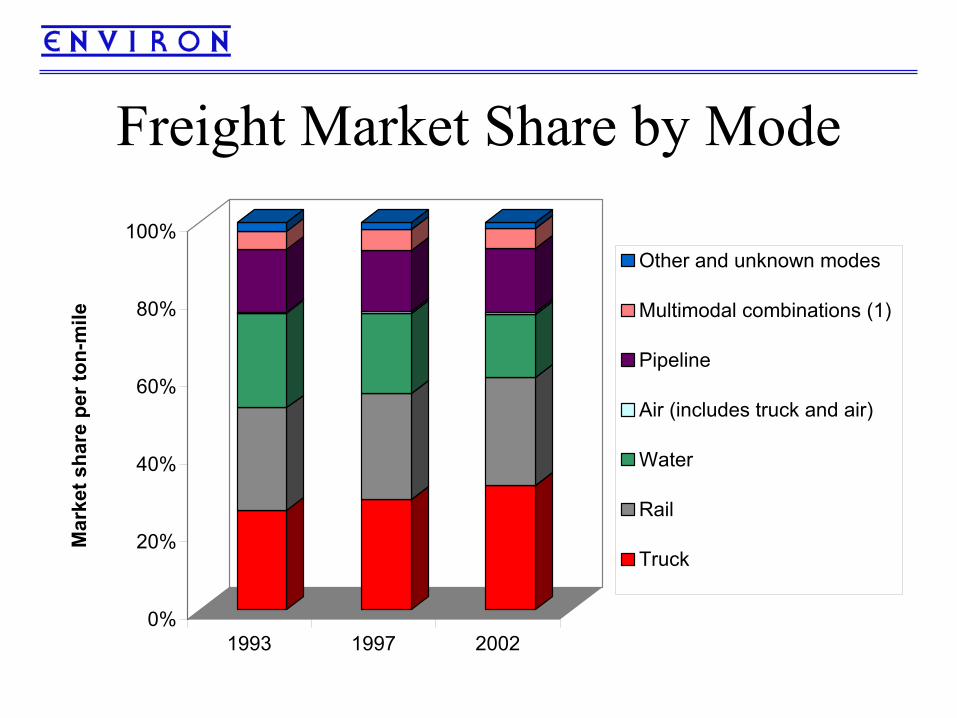
Freight Market Share by Mode
0%
20%
40%
60%
80%
100%
Mar
ket s
hare
per
ton-
mile
1993 1997 2002
Other and unknown modes
Multimodal combinations (1)
Pipeline
Air (includes truck and air)
Water
Rail
Truck
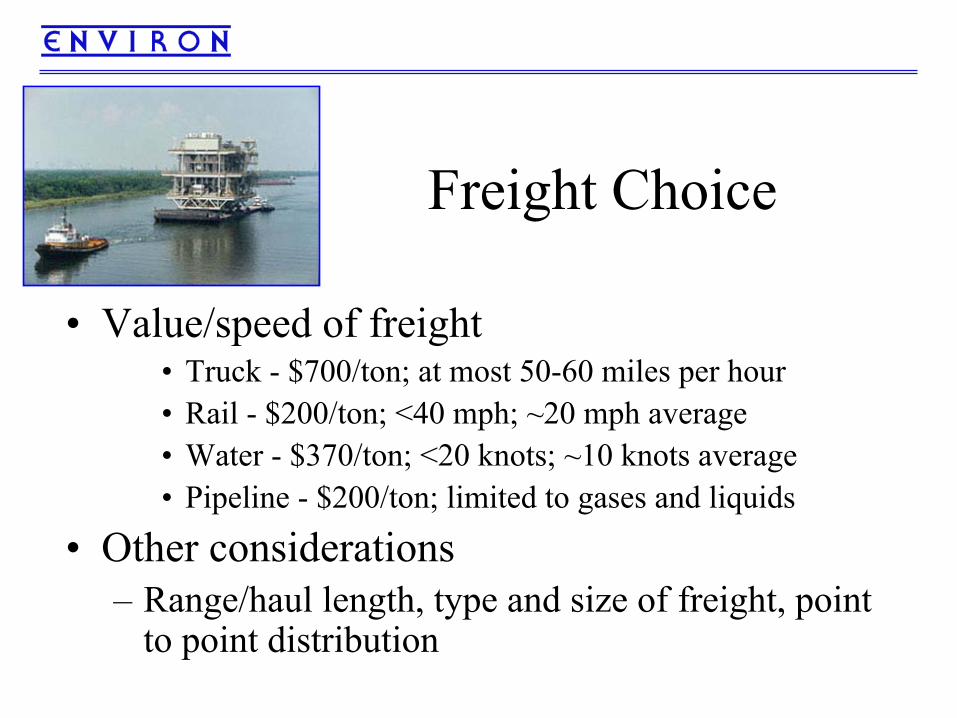
Freight Choice
• Value/speed of freight• Truck - $700/ton; at most 50-60 miles per hour• Rail - $200/ton; <40 mph; ~20 mph average• Water - $370/ton; <20 knots; ~10 knots average • Pipeline - $200/ton; limited to gases and liquids
• Other considerations– Range/haul length, type and size of freight, point
to point distribution
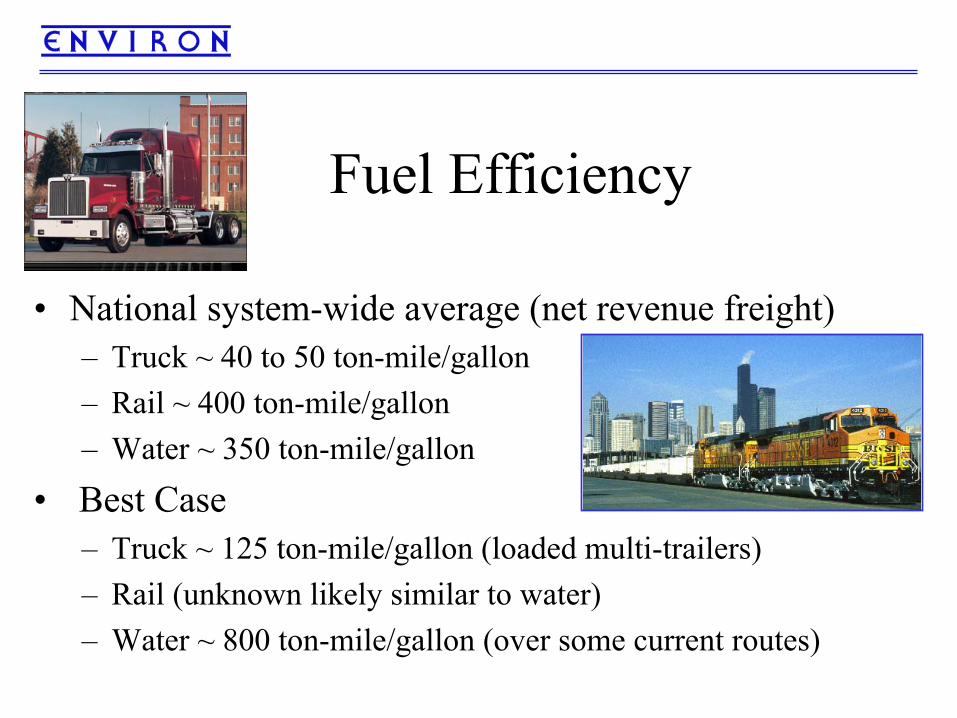
Fuel Efficiency
• National system-wide average (net revenue freight)– Truck ~ 40 to 50 ton-mile/gallon– Rail ~ 400 ton-mile/gallon– Water ~ 350 ton-mile/gallon
• Best Case– Truck ~ 125 ton-mile/gallon (loaded multi-trailers)– Rail (unknown likely similar to water)– Water ~ 800 ton-mile/gallon (over some current routes)
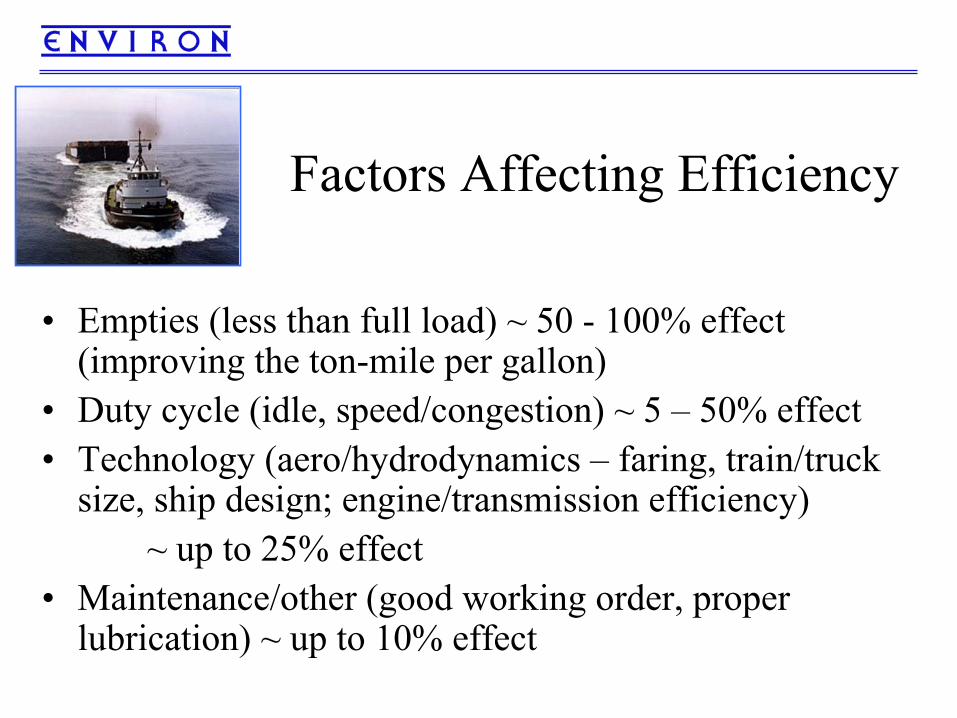
Factors Affecting Efficiency
• Empties (less than full load) ~ 50 - 100% effect (improving the ton-mile per gallon)
• Duty cycle (idle, speed/congestion) ~ 5 – 50% effect• Technology (aero/hydrodynamics – faring, train/truck
size, ship design; engine/transmission efficiency)~ up to 25% effect
• Maintenance/other (good working order, proper lubrication) ~ up to 10% effect
Emissions Rates
• Per engine emissions– Average in-use accounting for fleet turnover– Emission standards; current and future
• Truck engine standards very strict especially after 2007• Locomotive and marine similar to each other
• Per ton-mile– Includes freight efficiency
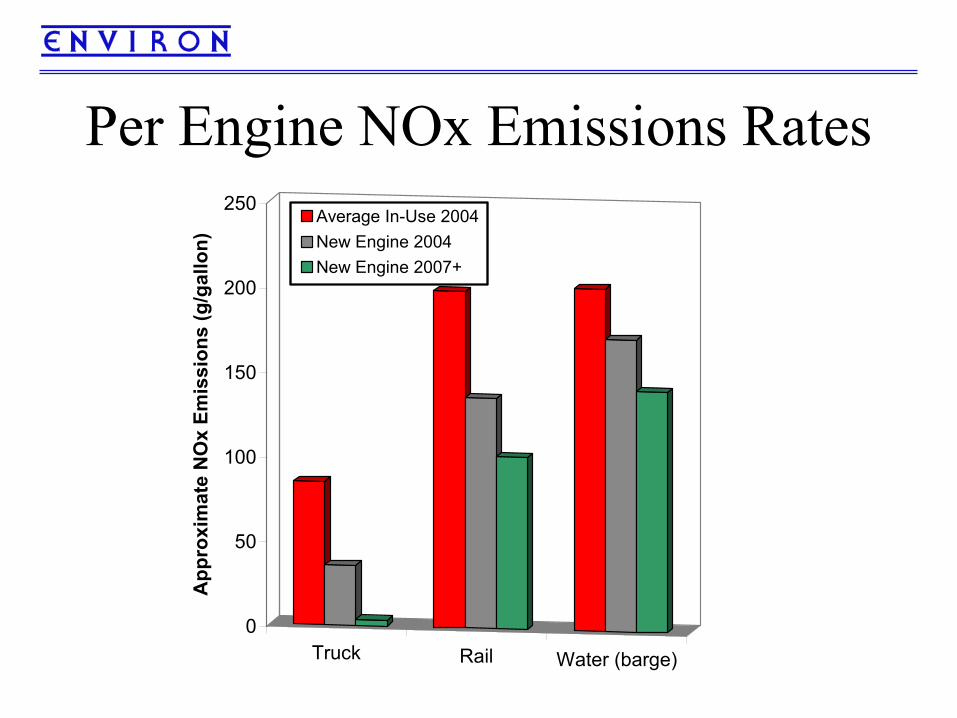
Per Engine NOx Emissions Rates
Truck Rail Water (barge)
0
50
100
150
200
250A
ppro
xim
ate
NO
x Em
issi
ons
(g/g
allo
n)Average In-Use 2004New Engine 2004New Engine 2007+
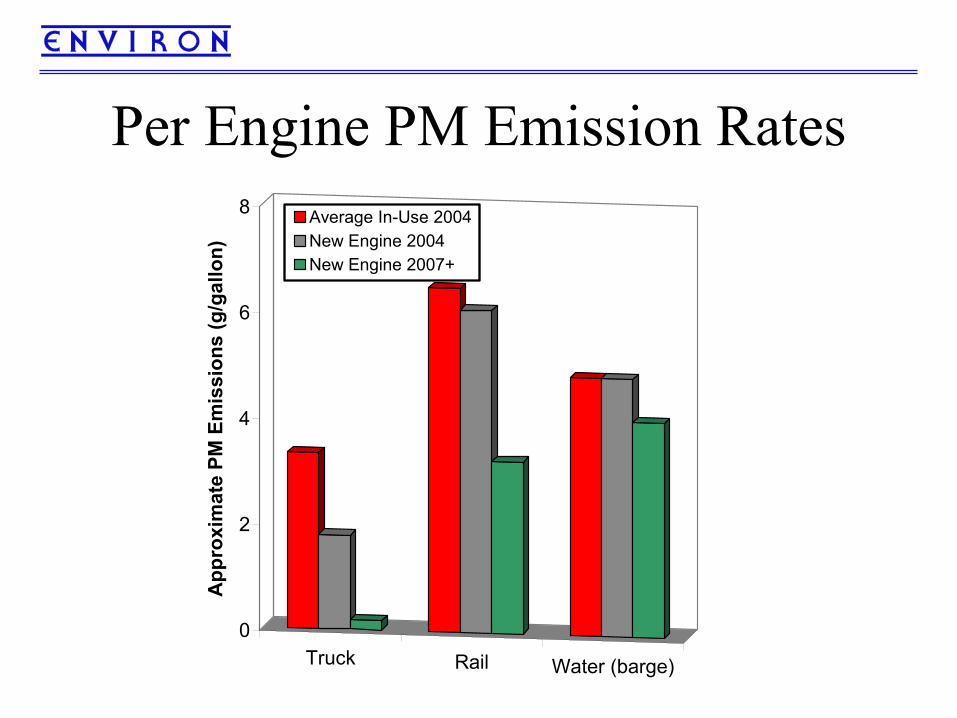
Per Engine PM Emission Rates
Truck Rail Water (barge)
0
2
4
6
8A
ppro
xim
ate
PM E
mis
sion
s (g
/gal
lon)
Average In-Use 2004New Engine 2004New Engine 2007+
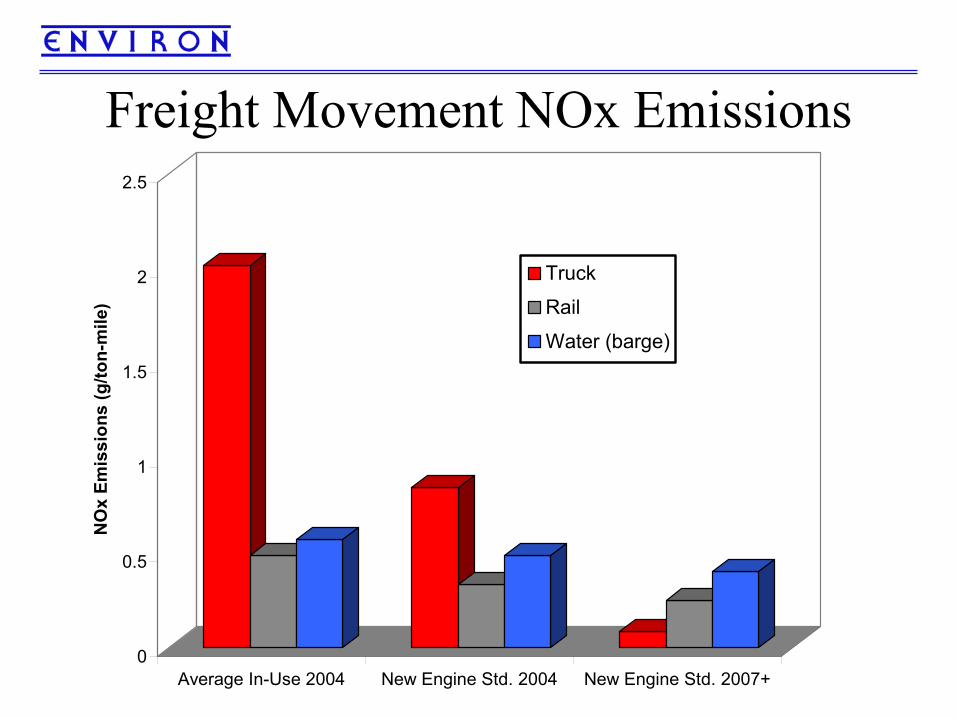
Freight Movement NOx Emissions
0
0.5
1
1.5
2
2.5
NO
x Em
issi
ons
(g/to
n-m
ile)
Average In-Use 2004 New Engine Std. 2004 New Engine Std. 2007+
Truck
Rail
Water (barge)
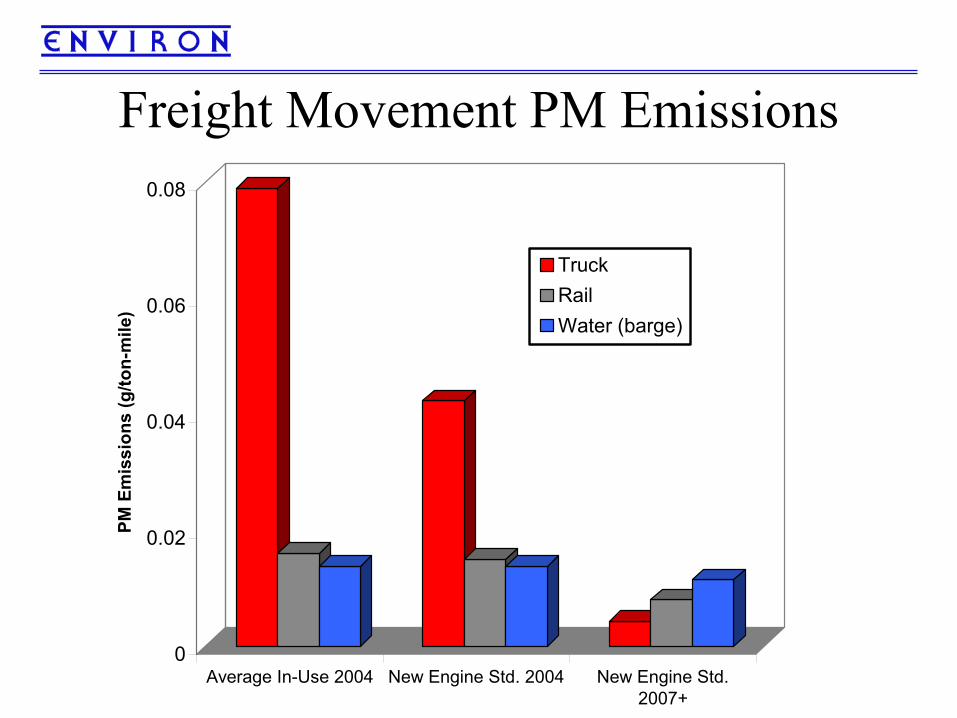
Freight Movement PM Emissions
0
0.02
0.04
0.06
0.08
PM E
mis
sion
s (g
/ton-
mile
)
Average In-Use 2004 New Engine Std. 2004 New Engine Std.2007+
TruckRailWater (barge)
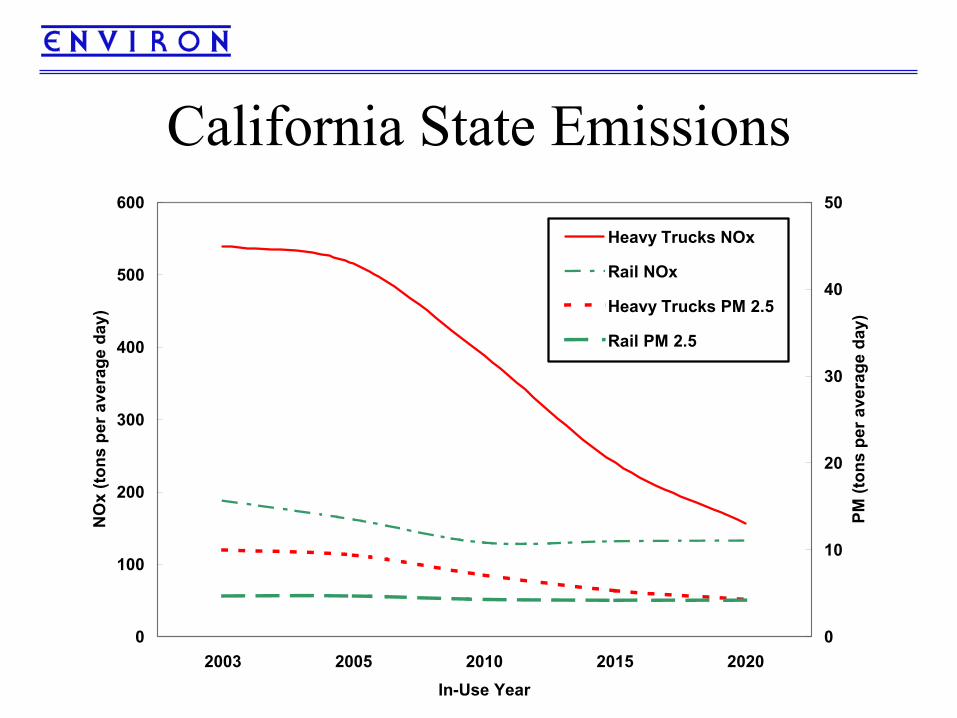
California State Emissions
0
100
200
300
400
500
600
2003 2005 2010 2015 2020In-Use Year
NO
x (to
ns p
er a
vera
ge d
ay)
0
10
20
30
40
50
PM (t
ons
per a
vera
ge d
ay)
Heavy Trucks NOx
Rail NOx
Heavy Trucks PM 2.5
Rail PM 2.5
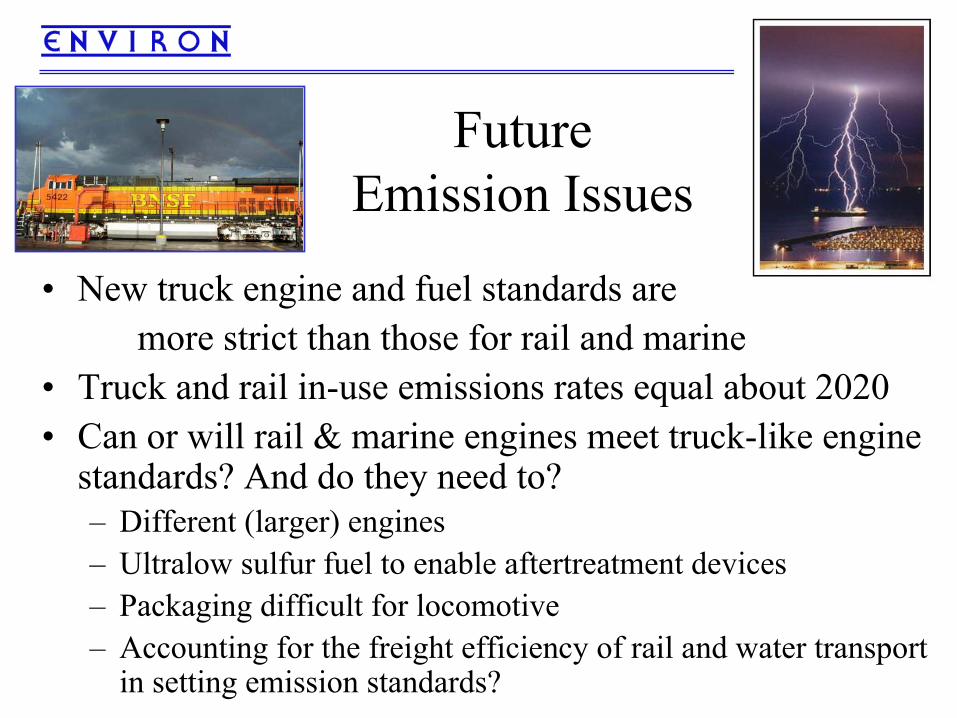
Future Emission Issues
• New truck engine and fuel standards are more strict than those for rail and marine
• Truck and rail in-use emissions rates equal about 2020• Can or will rail & marine engines meet truck-like engine
standards? And do they need to?– Different (larger) engines– Ultralow sulfur fuel to enable aftertreatment devices– Packaging difficult for locomotive– Accounting for the freight efficiency of rail and water transport
in setting emission standards?