Embed Size (px)
Citation preview

Air Quality and Climate Change Technical Report Revision 1 Broad Beach Restoration Project
Prepared for: Elkins Kalt Weintraub Reuben Gartside LLP
Los Angeles, California
Prepared by: Eric C. Lu, Principal
Julia Lester, Principal
ENVIRON International Corporation Irvine, California
Revision Date: June 2014
Project Number: 0531839A

Air Quality and Climate Change Technical Report Revision1 Broad Beach Restoration Project
Contents Page
1 Introduction 1 1.1 Project Description 1 1.2 Report Organization 2
2 Significance Thresholds 2 2.1 Air Quality 2 2.2 Greenhouse Gases 3
3 Emission Estimation Methods 4 3.1 Construction Emission Estimation 5 3.1.1 Off-Road Sources 6 3.1.2 On-Road Sources 6 3.1.3 Vegetation Change 7 3.2 Operational Emission Estimation 7 3.2.1 Off-road Sources 7 3.2.2 On-road Sources 8
4 Mass Emissions Results 8 4.1 Air Quality 8 4.1.1 Construction 8 4.1.2 Operations 10 4.2 Greenhouse Gases 10 4.2.1 Construction 10 4.2.2 Operations 11
5 Health Risk Assessment 11
Contents ii ENVIRON
Air Quality and Climate Change Technical Report Revision1 Broad Beach Restoration Project
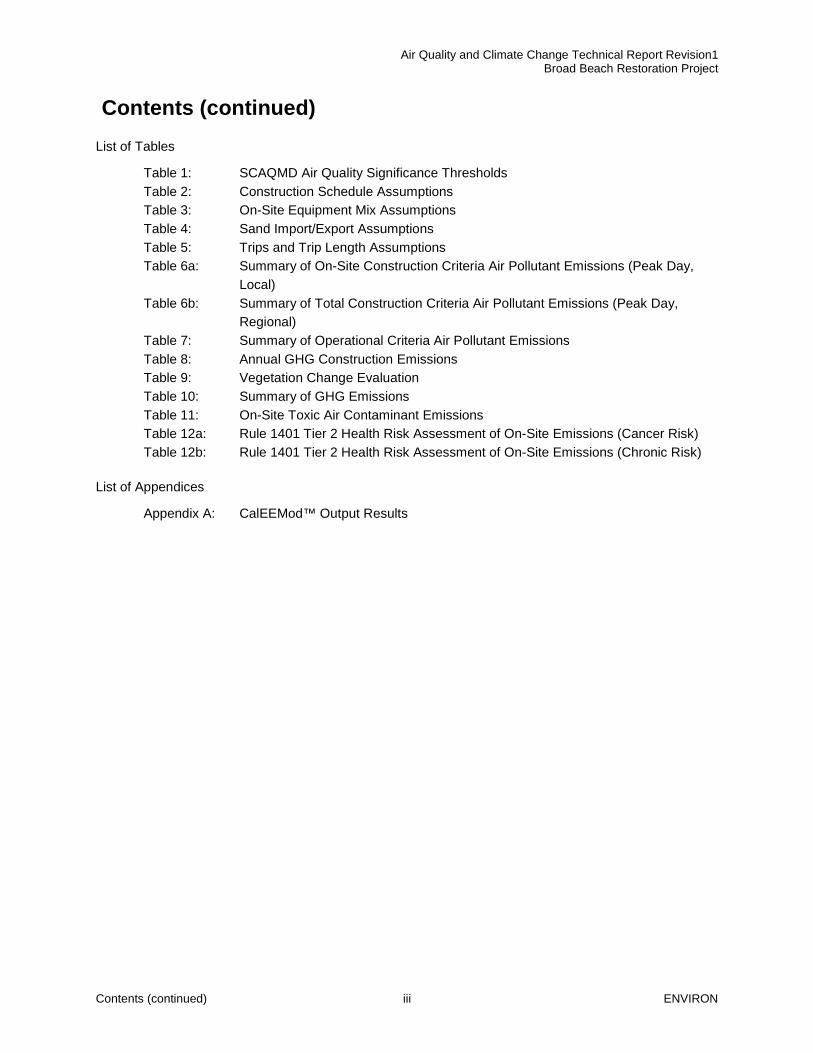
Contents (continued) List of Tables
Table 1: SCAQMD Air Quality Significance Thresholds Table 2: Construction Schedule Assumptions Table 3: On-Site Equipment Mix Assumptions Table 4: Sand Import/Export Assumptions Table 5: Trips and Trip Length Assumptions Table 6a: Summary of On-Site Construction Criteria Air Pollutant Emissions (Peak Day,
Local) Table 6b: Summary of Total Construction Criteria Air Pollutant Emissions (Peak Day,
Regional) Table 7: Summary of Operational Criteria Air Pollutant Emissions Table 8: Annual GHG Construction Emissions Table 9: Vegetation Change Evaluation Table 10: Summary of GHG Emissions Table 11: On-Site Toxic Air Contaminant Emissions Table 12a: Rule 1401 Tier 2 Health Risk Assessment of On-Site Emissions (Cancer Risk) Table 12b: Rule 1401 Tier 2 Health Risk Assessment of On-Site Emissions (Chronic Risk)
List of Appendices
Appendix A: CalEEMod™ Output Results
Contents (continued) iii ENVIRON

Air Quality and Climate Change Technical Report Revision1 Broad Beach Restoration Project
Acronyms and Abbreviations AAQS: ambient air quality standards APTR: Analysis of Impacts to Public Trust Resources and Values BBGHAD: Broad Beach Geologic Hazard Abatement District CalEEMod™: California Emission Estimator Model CARB: California Air Resources Board CCC: California Coastal Commission CDP: Coastal Development Permit CEQA: California Environmental Quality Act CO: Carbon Monoxide CO2: Carbon dioxide DPM: Diesel particulate matter EMFAC: Emission Factor model ENVIRON: ENVIRON International Corporation GHG: greenhouse gas HIC: chronic hazard index HRA: Health risk assessment LST: Localized significance thresholds MICR: Maximum Individual Cancer Risk MTCO2e/yr: Metric tonnes CO2 equivalents NOx: oxides of nitrogen OFFROAD: Offroad Emissions Inventory Program model (OFFROAD) PM10: coarse particulate matter PM2.5: fine particulate matter SCAB: South Coast Air Basin SCAQMD: South Coast Air Quality Management District SLC: State Lands Commission SO2: sulfur dioxide USEPA: United States Environmental Protection Agency VMT: vehicle miles traveled VOCs: volatile organic compounds
p:\b\broad beach\0531839a aq-ghg\report\bb aq ghg tech report 2014-06_rev1.docx
Acronyms and Abbreviations iv ENVIRON

Air Quality and Climate Change Technical Report Revision 1 Broad Beach Restoration Project
1 Introduction This air quality and climate change technical report evaluates the criteria air pollutants and greenhouse gases (GHGs) associated with the dune, beach berm, and beach face restoration of Broad Beach (Project), which would cover up to 42 acres of the coastline in Malibu, California.
This analysis includes the development of criteria air pollutant and GHG emission inventories used to evaluate air quality impacts in support of the State Lands Commission's (SLC) Analysis of Impacts to Public Trust Resources and Values for the Broad Beach Restoration Project (APTR) and the California Coastal Commission's (CCC) Coastal Development Permit (CDP) process. This report documents the methodologies used by ENVIRON International Corporation (ENVIRON) in developing the criteria pollutant and GHG emission inventories, calculating the construction and operational related emissions for the proposed Broad Beach Restoration Project and comparing them to the South Coast Air Quality Management District (SCAQMD) California Environmental Quality Act (CEQA) thresholds as a basis for evaluating the air quality and GHG impacts. This analysis also incorporates direction from the SLC's May 2013 letter and the CCC's July 2013 letter to the project applicant, the Broad Beach Geologic Hazard Abatement District (BBGHAD).
Criteria pollutants are those chemicals that have ambient air quality standards (AAQS), and their precursors, which include carbon monoxide (CO), nitrogen oxides (NOx), volatile organic compounds (VOCs), sulfur dioxide (SO2), coarse particulate matter (PM10), and fine particulate matter (PM2.5). This report documents the methodologies used by ENVIRON to evaluate the Project for the APTR. There are other state and federal criteria pollutants such as lead (state and federal) and hydrogen sulfide (state, only) that are not relevant to this analysis.
1.1 Project Description Development along Broad Beach began in the 1930s, consisting of small beach cottages. Most lots were developed by the late 1980s. During this period, the beach remained considerably wider than it is today, especially through the early 1970s. The width of Broad Beach reached a peak in 1970 at a yearly average of 60 feet landward of the mean high tide line (MHTL); however, the beach has been receding since. Between 1974 and 2009, approximately 600,000 cubic yards of sand were lost at Broad Beach, moving the shoreline inland approximately 65 feet. The majority of the sand moved east to nourish Zuma Beach and other locations down coast. The sand budget turned negative around 1974 and from 2004-2009 the sand loss rate has accelerated to approximately 35,000 cubic yards per year.
The SLC is considering the BBGHAD’s application for the proposed Project, which would include beach nourishment, dune restoration, at least 20 years of annual sand backpassing, and one major future renourishment event in roughly 10 years.
The proposed beach and dune restoration Project site would cover up to 42 acres and is located within the Laguna Point to Latigo Point Area of Special Biological Significance (ASBS), located in both Los Angeles and Ventura counties. It is the largest of the mainland ASBSs in southern California, with 24 miles of coastline.
Introduction 1 ENVIRON

Air Quality and Climate Change Technical Report Revision 1 Broad Beach Restoration Project
The construction phase of the proposed Project includes the deposition of 600,000 cubic yards of sand onto Broad Beach. The analysis assumes a total of 500,000 cubic yards will be used for nourishment of the beach and the remaining 100,000 cubic yards will be used for dune restoration/construction, and that the sand will be imported in the shortest duration possible based on a maximum hauling schedule of 14 hours per day, which corresponds to a maximum of 411 truck trips/day. All of the sand will be sourced from inland private local quarries in the Moorpark/Fillmore area of the Conejo Valley approximately 40 to 56 miles away by truck. The 600,000 cubic yards of sand would be trucked to the Project site and would require approximately 43,000 total truck trips.
The operational phase of the proposed Project comprises of the backpassing and renourishment events. Backpassing is anticipated to widen the west end beach (based on historic erosion patterns) and is anticipated to occur in the fall/winter season on an annual basis for 20 years. The initial sand volume for backpassing is between 25,000 and 50,000 cubic yards and will be moved from the east end of the beach to the west end. Renourishment will be similar to the original event and is anticipated to involve placement of an additional 450,000 cubic yards of sand on the beach in approximately 10 years. The dunes are assumed to not need renourishment. The actual timing for when renourishment will occur is unknown and would be determined by monitoring and be subject to the BBGHAD's assessment stream.
1.2 Report Organization ENVIRON has prepared a criteria pollutant emission inventory and a GHG emission inventory for both construction and operation. The purpose of this evaluation is to calculate emissions and to compare them to the SCAQMD CEQA significance thresholds, including Localized Significance Thresholds (LSTs).
The remaining sections of this report describe the methods used to conduct this analysis. Following this introduction, Section 2 describes the significance thresholds as set forth by SCAQMD. Section 3 describes the emission estimation methods for determining emissions from the construction and operational phase of the proposed Project. Section 4 describes the emission inventory for construction and operational emissions and compares them to the relevant significance thresholds. Section 5 outlines the health risk assessment and results.
2 Significance Thresholds The SCAQMD has established significance thresholds1 to assess the impacts of project-related construction and operational emissions on regional ambient air quality. Although the APTR is not a CEQA document, we have relied upon the CEQA significance thresholds for comparison purposes.
2.1 Air Quality Table 1 shows the mass daily thresholds for construction as well as operations as adopted by SCAQMD for criteria pollutant emissions. The analysis summarized in this report estimates
1 SCAQMD, 2011. Air Quality Significance Thresholds. March. Available at: http://www.aqmd.gov/docs/default-source/ceqa/handbook/scaqmd-air-quality-significance-thresholds.pdf?sfvrsn=2, Accessed: June 2014.
Significance Thresholds 2 ENVIRON

Air Quality and Climate Change Technical Report Revision 1 Broad Beach Restoration Project
Project-related construction (nourishment phase, including dune construction and other related activities such as planting, fencing, etc.) and operational (backpassing and renourishment phases) mass emissions and compares the emissions to these mass daily significance thresholds.
2.2 Greenhouse Gases The SCAQMD has not formally adopted GHG significance thresholds for projects such as that contemplated by the subject APTR and CDP, but has convened a GHG CEQA Significance Threshold Working Group (Working Group) to provide guidance to local lead agencies on determining significance for GHG emissions in its CEQA documents. In its September 28, 2010 meeting, the SCAQMD proposed a tiered approach that could be applied to commercial projects.2 The tiers are as follows:
• Tier 1: Determine if CEQA categorical exemptions are applicable. If not, move to Tier 2;
• Tier 2: Consider whether or not the proposed project is consistent with a locally adopted GHG reduction plan (often called a Climate Action Plan) that has gone through public hearings and CEQA review, that has an approved inventory, includes monitoring, etc. If not, move to Tier 3;
• Tier 3: For residential and commercial projects, if projects are less than 3,000 metric tonnes/year of CO2e, the project is presumed to be less than significant for GHGs. If the project exceeds 3,000 metric tonnes of CO2 equivalent (MTCO2e/yr), move to Tier 4. More specific screening thresholds were also provided, which include 1,400 metric tonnes/year of CO2e for commercial projects. These thresholds were based on a review of the Office of Planning and Research database which included 711 CEQA projects using a 90% capture approach;
• Tier 4: The proposed performance standards include three options:
1. Percent Emission Reduction Target (no further recommendation)
2. Early Implementation of Applicable AB32 Scoping Plan Measures (incorporated into option 3)
3. SCAQMD Efficiency Target
- For option 3, there are targets for 2020 and 2035. The target for 2020 is proposed to be:
o 4.8 MT/year CO2e per service population for project level threshold (land use employment only)
o 6.6 MT/year CO2e per service population for plan level threshold
-The target for 2035 is proposed to be:
o 3.0 MT/year CO2e per service population for project level threshold
2 SCAQMD 2010. CEQA Significance Thresholds Working Group Meeting #15. September 28. Available at: http://www.aqmd.gov/docs/default-source/ceqa/handbook/greenhouse-gases-(ghg)-ceqa-significance-thresholds/year-2008-2009/ghg-meeting-15/ghg-meeting-15-minutes.pdf?sfvrsn=2. Accessed: June 2014.
Significance Thresholds 3 ENVIRON
Air Quality and Climate Change Technical Report Revision 1 Broad Beach Restoration Project
o 4.1 MT/year CO2e per service population for plan level threshold
o Incorporate SB 375 regional targets.
• Tier 5: Off-site mitigation for life of project (30 years), if this threshold is to be used, GHG emissions must be mitigated to less than the Tier 3 screening significance threshold. SCAQMD clarified that offsets should have a 30 year project life, should be Real, Quantifiable, Verifiable, and Surplus and will be considered in the following prioritized manner:
– Project design feature/onsite reduction measures
– Offsite within neighborhood
– Offsite within district
– Offsite within state
– Offsite out of state
– Substitution allowed via enforceable commitment (e.g. when an offset project ends prematurely).
If the proposed Project cannot meet any of the Tiers, it is presumed to be significant for GHG emissions.
In December 2008, SCAQMD adopted interim CEQA GHG significance thresholds for projects on which it is the lead agency. The threshold adopted by the agency for industrial projects was 10,000 MTCO2e/yr. This threshold was based largely on natural gas consumption GHG emissions at industrial facilities. For purposes of this analysis, this report will use the only threshold adopted by SCAQMD, which is the 10,000 MTCO2e/yr since no other proposed threshold would apply.
3 Emission Estimation Methods This section describes the methodology used to develop the Air Quality and GHG emission inventories associated with the proposed Project, which include: construction emissions and operational emissions. GHG emissions include sequestration of carbon dioxide equivalents (CO2e) from vegetation. Legislation and rules regarding climate change, as well as the scientific understanding of the extent to which different activities emit GHGs, continue to evolve. As such, the inventories in this report are a reflection of the guidance and knowledge currently available.
ENVIRON utilized the California Emission Estimator Model version 2013.2.1 (CalEEMod™)3,4 to assist in quantifying the criteria pollutant and GHG emissions in the inventories presented in this report for the proposed Project. CalEEMod™ is a statewide program designed to calculate both criteria and GHG emissions from development projects in California. This model was developed under the auspices of the SCAQMD and received input from other California air districts and is
3 California Emissions Estimator Model. Available at: http://caleemod.com/ Accessed: June 2014. 4 An updated version of CalEEMod™ (version 2013.2.2) has been released since the time the CalEEMod™ run was
executed.
Emission Estimation Methods 4 ENVIRON

Air Quality and Climate Change Technical Report Revision 1 Broad Beach Restoration Project
currently supported by several lead agencies for use in quantifying the emissions associated with development projects undergoing environmental review. CalEEMod™ utilizes widely accepted models for emission estimates combined with appropriate default data that can be used if site specific information is not available. These models and default estimates use sources such as the United States Environmental Protection Agency (USEPA) AP-42 emission factors, California Air Resources Board’s (CARB’s) on-road and off-road equipment emission models such as the EMission FACtor model (EMFAC) and the Offroad Emissions Inventory Program model (OFFROAD), and studies commissioned by California agencies such as the California Energy Commission (CEC) and CalRecycle.
CalEEMod™ is based upon CARB-approved Off-Road and On-Road Mobile-Source Emission Factor models (OFFROAD and EMFAC, respectively), and is designed to estimate construction and operational emissions for land use development projects and allows for the input of project specific information. OFFROAD is an emissions factor model used to calculate emission rates from off-road mobile sources (e.g., construction equipment, agricultural equipment). EMFAC is an emissions factor model used to calculate emissions rates from on-road vehicles (e.g. passenger vehicles, haul trucks). The off-road diesel emission factors used by CalEEMod™ are based on the CARB OFFROAD2011 program.
ENVIRON used CalEEMod™ defaults for a site located in the portion of LA County within the South Coast Air Basin (SCAB) (referred to in CalEEMod™ as LA South Coast County) in the model runs unless otherwise noted in the methodology descriptions below. Details regarding the specific methodologies used by CalEEMod™ can be found in the CalEEMod™ User’s Guide and associated appendices. The CalEEMod™ output files are provided for reference in Appendix A to this report. Because the annual backpassing and one-time renourishment events are more similar to construction activities, the operational emissions are represented in CalEEMod™ as “construction”. Separate CalEEMod™ model runs were performed to adequately represent the different activities that may occur during construction and operations. The CalEEMod™ run for the construction phase conservatively assumes the completion (i.e., buildout) in 2013-2014. The CalEEMod™ run for the annual backpassing events of the operational phase conservatively assumes the year of 2014 and the CalEEMod™ run for the one-time renourishment event of the operational phase assumes the buildout years of 2023-2024. Since emission factors are expected to decrease over time as technology improves, assuming 2014 for the backpassing events will conservatively estimate the potential emissions.
3.1 Construction Emission Estimation Construction-related emissions of VOCs, NOx, CO, SO2, particulate matter (PM) of aerodynamic radius less than 10 micrometers (PM10) or less than 2.5 micrometers (PM2 5), and GHGs for the construction phase were modeled and assessed using CalEEMod™. The CalEEMod™ output can be found in Appendix A. Project specific onsite equipment lists were assumed for the various construction phases: nourishment, dune construction, and planting, fencing, signage, and irrigation. The approximate construction schedule and the amount of material imported were based on Project specific estimates. The construction schedule, equipment lists, and material hauling data used to estimate construction-related emissions are shown in Tables 2 through 4, respectively. On-road vehicle criteria pollutant and GHG emissions were calculated
Emission Estimation Methods 5 ENVIRON
Air Quality and Climate Change Technical Report Revision 1 Broad Beach Restoration Project
based on the number of worker, vendor, and hauling trips and associated trip lengths (used to calculate vehicle miles traveled [VMT]) and are presented in Table 5.
3.1.1 Off-Road Sources Sources for off-road construction emissions include off-road equipment and fugitive dust. Since the majority of the off-road construction equipment used for construction projects are diesel fueled, CalEEMod™ assumes all of the equipment operates on diesel fuel. Table 3 lists the assumed off-road equipment types for this Project. The off-road diesel emission factors used by CalEEMod™ are based on the CARB OFFROAD2011 program. Since the operating hours for grizzlies and bulldozers used in the nourishment phase (see Table 2) may be 14 hours/day, the CalEEMod™ output was modified since the model run assumed 11 hours/day operation. The emissions are a linear function of hours of operation, thus, the off-road construction emissions from CalEEMod™ for the nourishment phase were scaled by multiplying by a factor of 14/11, which is a conservative assumption because this scales all of the off-road equipment when only the grizzlies and the bulldozers are anticipated to operate this longer period of time on a given day. Table 6a summarizes the maximum daily construction criteria pollutant emissions from off-road sources in pounds per day based on the estimated emissions from nourishment, dune construction, and planting, fencing, signage, and irrigation. Table 8 shows the off-road construction GHG emissions.
3.1.2 On-Road Sources Sources for on-road construction emissions include on-road equipment and fugitive dust from worker, vendor, and hauling trips. The number of one-way worker trips was assumed to be twice the number of construction workers. The number of one-way vendor trips was assumed to be twice the numbers of fuel trucks, service trucks, delivery trucks, and pick-up trucks that were assumed for each phase of construction.5 Hauling trips were calculated based on the amount of sand imported during each phase and assuming 14-cubic yard hauling trucks are used to haul the sand. The average worker trip length is estimated as the farthest distance measured from the Project site to outside the city of Malibu boundary. The vendor trip length is the default value from CalEEMod™. Based on the October 2013 traffic memorandum, the maximum hauling trip length is 56 miles each way.6 The hauling truck trip length was revised to 56 miles after the CalEEMod™ runs had been executed using the original hauling distance of 45 miles (as specified in the September 2013 project description7). Because emissions are a linear function of vehicle miles traveled, hauling emissions from the CalEEMod™ output files were scaled by multiplying by a factor of 56/45. In addition, to account for a maximum number of hauling trips that may occur in any given day, the CalEEMod™ output files were scaled to account for hauling trucks that may operate 14 hours/day, or up to 411 truck trips/day. Since the estimated emissions are linearly related to the number of trips, the emissions were scaled by multiplying
5 The number of one-way vendor trips is assumed to be twice the number of fuel trucks, service trucks, delivery trucks, and pick-up trucks. For nourishment, there are 1 fuel truck, 1 service truck, 20 delivery trucks, and 2 pick-up trucks. There may be vendor trips during dune construction; however, on average, it is expected to be minimal. For planting, fencing, signage, and irrigation, there are 20 delivery trucks used in the analysis.
6 Linscott, Law & Greenspan, Engineers, Traffic and Parking Assessment for the Broad Beach Restoration Project. October 10, 2013.
7 Broad Beach Restoration Project: Project Description. September 2013.
Emission Estimation Methods 6 ENVIRON

Air Quality and Climate Change Technical Report Revision 1 Broad Beach Restoration Project
by a factor of 822/550 (ratio of the maximum daily one-way haul trips to that assumed in the CalEEMod™ runs).
Table 6b summarizes the total construction criteria pollutant emissions by year and Table 8 shows the on-road and off-road construction GHG emissions. The construction air quality results are discussed in more detail in Section 4.1 and the GHG results are discussed in more detail in Section 4.2.
3.1.3 Vegetation Change The amount of GHGs sequestered as a result of changes in the amount of vegetation at the Project site is summarized in Table 9. Criteria pollutant emissions are not affected by the vegetation change. Based on information estimated for the Project, approximately one acre of non-native vegetation will be removed and 3.7 acres of native plant species will be added to the Project site. The native species will include sand verbena, beach bur, beach saltbrush, beach morning glory, beach evening primrose, salt grass, beach strawberry, California sagebrush, California croton, beach spectacle pod, California goldenbrush, coast buckwheat, and chamisso bush lupine, which are approximated as “Grassland” vegetation type in CalEEMod™.
3.2 Operational Emission Estimation The operation phase of the Project consists of backpassing and renourishment events. Backpassing will occur on an annual basis over 20 years while renourishment is a one-time event. Therefore, the two activities have separate CalEEMod™ runs. The criteria air pollutant operational mass emissions of VOCs, NOx, CO, SO2, PM10, PM2.5, and GHGs were modeled and assessed using CalEEMod™. The CalEEMod™ outputs can be found in Appendix A. The source categories considered include off-road and on-road sources. Because there will be no buildings or paving activities expected as part of this proposed Project, typical operational sources such as energy use, architectural coatings, and paving are not included. For the GHG analysis, there is also no estimate for waste generation and disposal or water use and disposal since there are no operations expected to lead to such activities.8 The assumptions and calculation methodologies for each of these source categories are presented in the following sections.
3.2.1 Off-road Sources Similar to the construction activities, off-road operational emissions come from the off-road equipment. Since the majority of the off-road operational equipment used for these operational activities are diesel fueled, CalEEMod™ assumes all of the equipment operates on diesel fuel. The off-road diesel emission factors used by CalEEMod™ are based on the CARB OFFROAD2011 program. Table 7 summarizes the criteria pollutant emissions and Table 8 summarizes the annual GHG construction emissions due to off-road and on-road sources.
8 The model can be changed and reevaluated if initial assumptions change in final project configuration, such as water use for dust suppression, etc.
Emission Estimation Methods 7 ENVIRON
Air Quality and Climate Change Technical Report Revision 1 Broad Beach Restoration Project
3.2.2 On-road Sources Sources for on-road operational emissions include on-road equipment and fugitive dust from worker, vendor, and hauling trips. The number of worker, vendor and hauling trips and associated vehicle trip lengths as shown in Table 5 were used to determine the emissions associated with on-road vehicle use during operations. The number of one-way worker trips was assumed to be twice the number of construction workers. The number of one-way vendor trips was assumed to be twice the number of fuel trucks, service trucks, delivery trucks, pick-up trucks, and supervisor vehicles that were assumed for each phase of operation.9 Hauling trips were calculated based on the amount of sand imported during each phase and assuming 14-cubic yard hauling trucks are used to haul the sand. The average worker trip length is estimated to be the farthest distance measured from the Project site to outside the city of Malibu boundary. The vendor trip length is the default value from CalEEMod™. Based on the October 2013 traffic memorandum, the maximum hauling trip length is 56 miles each way.10 The hauling truck trip length was revised to 56 miles after the CalEEMod™ runs had been executed using the original hauling distance of 45 miles (as specified in the September 2013 project description11). Because emissions are a linear function of vehicle miles travelled, hauling emissions from the CalEEMod™ output files were scaled by multiplying by a factor of 56/45.
Table 7 summarizes the total operational criteria pollutant emissions and Table 10 summarizes the annual operational GHG emissions for each phase.
4 Mass Emissions Results 4.1 Air Quality 4.1.1 Construction The maximum daily criteria pollutant emissions estimated due to construction of the proposed Project are summarized in Tables 6a and 6b. These emissions were estimated using the methodology as described in Section 3 above. The emissions reported are for on-site (Table 6a) and total construction emissions (Table 6b), including on-road and off-road mobile sources. For on-site emissions, the estimated emissions include sources such as fugitive dust and off-road equipment. The estimated emissions show that the maximum on-site daily emissions for construction are less than the SCAQMD localized significance thresholds (LSTs) for CO and PM10. The daily emissions of the proposed Project for NOx and PM2.5 are greater than the LST. There are no LSTs for VOC or SO2. The analysis conservatively assumes that the CalEEMod™ default equipment mix will be used. If higher Tier equipment is available and it is determined it is feasible to use as mitigation measures, the emissions will likely be lower than that estimated here. Furthermore, the current emissions estimate is a conservative estimate since the
9 The number of one-way vendor trips is assumed to be twice the number of fuel trucks, service trucks, delivery trucks, pick-up trucks, and supervisor vehicles. For renourishment, there are 1 fuel truck, 1 service truck, 20 delivery trucks, and 2 pick-up trucks. For backpassing, there is 1 supervisor vehicle.
10 Linscott, Law & Greenspan, Engineers, Traffic and Parking Assessment for the Broad Beach Restoration Project. October 10, 2013.
11 Broad Beach Restoration Project: Project Description. September 2013.
Mass Emissions Results 8 ENVIRON

Air Quality and Climate Change Technical Report Revision 1 Broad Beach Restoration Project
operation of most off-road construction equipment will operate fewer hours than what is currently estimated.
The maximum total daily criteria pollutant emissions estimated due to construction of the proposed Project are summarized in Table 6b. The emission sources include on-road trucks, off-road construction equipment, and fugitive dust from on-site and offsite activities. The estimated emissions are less than the SCAQMD regional mass daily significance thresholds for SO2, PM10, and PM2.5 but above the significance thresholds for VOC, NOx, and CO.
The following mitigation measures will be implemented in order to minimize the criteria pollutant emissions to the maximum extent feasible.
• AMM AQ-1a: Fugitive Dust Control. The Applicant shall submit and implement a Fugitive Dust Control Plan that includes SCAQMD mitigations for fugitive dust mitigation, according to Rule 403. The Plan shall also address fugitive dust measure impacts to native habitats. To the extent required by Rule 403, fugitive dust mitigation measures in the plan should include the following:
– Require minimum soil moisture of 12 percent for earthmoving (i.e., sand distribution during nourishment, dune restoration, sand backpassing, and/or renourishment), by using a moveable sprinkler system or water truck. Moisture content can be verified by lab sample or moisture probe.
– To the extent required by law or applicable regulations, limit on-site vehicle speeds on unpaved roads to 15 miles per hour (mph) with driver notification of speed limits.
– To the extent required by law or applicable regulations, all trucks hauling sand and other loose materials are to be tarped with a fabric cover and maintain a freeboard height of 12 inches.
– Water storage piles by hand or apply cover when wind events are declared, according to SCAQMD Rule 403 when instantaneous wind speeds exceed 25 mph.
– Appoint a construction relations officer to act as a community liaison concerning on-site construction issues, such as dust generation.
• AMM AQ-1b: NOx/PM Control. The Applicant shall implement a NOx reduction program including the following, or equivalent, measures:
– All off-road construction equipment shall be tuned and maintained according to manufacturers’ specifications.
– Any temporary electric power shall be obtained from the electrical grid, rather than portable diesel or gasoline generators.
– All off-road diesel construction equipment with greater than 100-horsepower engines shall meet Tier 4 requirements. If the Lead Agency determines that a Tier 4 fleet or portion thereof cannot be obtained, the Lead Agency shall require the use of construction equipment that meets Tier 3 emissions requirements or utilize other CARB-verified emission control technologies to achieve the same level of emission reduction.
– Limit on-site truck idling to less than 5 minutes.
Mass Emissions Results 9 ENVIRON

Air Quality and Climate Change Technical Report Revision 1 Broad Beach Restoration Project
– A copy of the certified tier specification, best available control technology documentation, or the CARB or SCAQMD operating permit for each piece of equipment shall be provided when each piece of equipment is mobilized.
• AMM AQ-3a: Diesel Particulate Emission Controls. The Applicant shall install CARB-verified Level 3 diesel catalysts on all diesel-powered off-road equipment or utilize diesel engines that have an equivalent PM emission rate (Tier 4 engines). The current list of CARB-verified Level 3 diesel catalysts is available from http://www.arb.ca.gov/diesel/verdev/vt/cvt.htm. Catalysts or engine certifications shall demonstrate achieving 85 percent reduction for diesel PM.
Of the mitigation measures described above, the following measures were quantified in the analysis:
• Require minimum soil moisture of 12 percent for earthmoving (i.e., sand distribution during nourishment, dune restoration, sand backpassing, and/or renourishment), by using a moveable sprinkler system or water truck. Moisture content can be verified by lab sample or moisture probe. (AMM AQ-1a)
• Limit on-site vehicle speeds on unpaved roads to 15 miles per hour (mph) and posting of speed limits. (AMM AQ-1a)
• Install CARB-verified Level 3 diesel catalysts on all diesel-powered off-road equipment. (AMM AQ-3a)
The other mitigation measures described above were not quantified in this analysis. If such mitigation measures had been quantified, the emissions would be lower than those reported in the tables.
4.1.2 Operations The maximum daily criteria pollutant emissions estimated due to operation of the proposed Project are summarized in Table 7. These emissions were estimated using the methodology as described in Section 3 above. The estimated emissions include on-site emissions from off-road equipment and fugitive dust, and offsite emissions from on-road sources. The estimated emissions show that the maximum daily emissions for operations are greater than the SCAQMD mass daily significance threshold for NOx. Estimated emissions for the other pollutants are below the significance thresholds.
The mitigation measures listed above that were quantified for construction were also quantified for the operational emissions. If the other mitigation measures in AMM AQ-1a and AMM AQ-1b had been quantified, the emissions would be lower than those reported in the tables. As mentioned in Section 4.1.1 above, no additional mitigation measures were identified as being feasible or applicable to the proposed Project.
4.2 Greenhouse Gases 4.2.1 Construction Table 8 shows the total one-time GHG emissions for construction, including off-road equipment, worker commuting, vendor trips, and hauling for the proposed Project. The total estimated
Mass Emissions Results 10 ENVIRON
Air Quality and Climate Change Technical Report Revision 1 Broad Beach Restoration Project
one-time construction emissions are 4,004 metric tonnes (MT) of CO2e, which is equal to 133 MT/year amortized over 30 years.
The native vegetation that will be planted in the construction phase will result in 0.4 MT/year of sequestered carbon dioxide (CO2) amortized over 30 years.
4.2.2 Operations Table 10 shows the total GHG emissions from all source categories for the proposed Project. Annual backpassing emissions total 60 MT CO2e/year while renourishment GHG emissions were estimated to be 96 MT/yr CO2e when amortized over 30 years. Added with the 30-year amortized construction and vegetation emissions results in total GHG emissions of 290 MT/yr CO2e for both construction and operations. The estimated GHG emissions are less than the SCAQMD adopted GHG threshold of 10,000 MTCO2e/yr.
5 Health Risk Assessment A health risk assessment (HRA) in accordance with SCAQMD Rule 1401 procedures was performed to analyze the risk of the estimated diesel particulate matter (DPM) emissions from on-site construction activities. DPM has carcinogenic and chronic health risks, but no acute health effects. As shown in Table 11, the total DPM emissions from on-site construction activities are 346 pounds per year (lbs/yr). Because the analysis for calculating cancer risk assumes exposure over 70 years, the total DPM emissions used in the cancer risk calculation are amortized over 70 years, which is equal to 4.95 lbs/yr. The maximum individual cancer risk (MICR) and chronic health index (HIC) were calculated using parameters found in the tables in Rule 1401 Attachment L.12 Because construction activities are expected to cover up to 5 acres (approximately 217,800 square feet) at any given time, the dispersion factor (X/Q) for an area greater than 30,000 square feet was used for the risk calculations. To be conservative, the MICR and HIC were calculated for a nearest receptor distance of 50 meters (estimated distance from the center of the hypothetical volume source13). As shown in Table 12a, the calculated MICR is below the SCAQMD CEQA significance threshold of 10 in a million. The only target organ for chronic health effects from DPM is the respiratory system. As shown in Table 12b, the calculated HIC is below the SCAQMD CEQA threshold of 1.0. If the higher Tier equipment is used, the estimated emissions and associated health risk would be lower than that estimated here.
12 South Coast Air Quality Management District, Permit Application Package “L”: For Use in Conjunction with the Risk Assessment Procedures for Rules 1401 and 212, Version 7.0. Revised December 7, 2012. Available online at: http://www.aqmd.gov/docs/default-source/planning/risk-assessment/attachment-l.pdf?sfvrsn=4 [accessed June 2014].
13 South Coast Air Quality Management District, Risk Assessment Procedures for Rules 1401 and 212, Version 7.0, p. 13. July 1, 2005. Available online at: http://www.aqmd.gov/docs/default-source/planning/risk-assessment/risk-assessment-procedures-v-7.pdf?sfvrsn=4 [accessed June 2014].
Health Risk Assessment 11 ENVIRON

Tables
ENVIRON

Pollutant Construction OperationNOx 100 55VOC 75 55PM10 150 150
PM2.5 55 55
SOx 150 150CO 550 550
Lead 3 3
TACs
NO2
1-hour AverageAnnual Arithmentic Mean
PM10
24-hour AverageAnnual Average
PM2.5
24-hour AverageSO2
1-hour Average24-hour Average
Sulfate 24-hour AverageCO
1-hour Average8-hour Average
Lead30-day Average
Rolling 3-month AverageQuarterly Average
µg/m3 - micrograms per cubic meterCO - carbon monoxidelbs - poundsMT - metric tonnesNOx - nitrogen oxides
PM10 - particulate matter of 10 microns in diameter or smaller
PM2.5 - particulate matter of 2.5 microns in diameter or smaller
ppm - parts per millionSCAQMD - South Coast Air Quality Management DistrictSO2 - sulfur dioxideVOC - volatile organic compound
Ambient Air Quality Standards for Criteria PollutantsSCAQMD is in attainment; project is significant if it causes or contributes
to an exceedance of the following attainment standards:0.18 ppm (state)
0.03 ppm (state) and 0.0534 ppm (federal)
10.4 µg/m3 (construction); 2.5 µg/m3 (operation)
1.0 µg/m3
10.4 µg/m3 (construction); 2.5 µg/m3 (operation)
0.25 ppm (state); 0.075 ppm (federal – 99th percentile)0.04 ppm (state)
Table 1. SCAQMD Air Quality Significance Thresholds1
Mass Daily Thresholds (lbs/day)
Toxic Air Contaminant (TAC) ThresholdsMaximum Incremental Cancer Risk ≥ 10 in 1 million
Reference:1 SCAQMD Significance Thresholds Revision March 2011. Available at: http://www.aqmd.gov/docs/default-source/ceqa/handbook/scaqmd-air-quality-significance-thresholds.pdf?sfvrsn=2. Accessed: June 2014.
Abbreviations:
25 µg/m3 (state)SCAQMD is in attainment; project is significant if it causes or contributes
to an exceedance of the following attainment standards:20 ppm (state) and 35 ppm (federal)
9.0 ppm (state/federal)
1.5 µg/m3 (state)
0.15 µg/m3 (federal)
1.5 µg/m3 (federal)

Source Type Phase Construction PhaseNumber of Work
Days2 Start Date End Date
Nourishment Grading 130 9/15/2013 3/15/2014Dune Construction Grading 22 3/15/2014 4/15/2014Planting, Fencing, Signage, Irrigation
Site Preparation 23 4/15/2014 5/15/2014
Backpassing3 Grading 15 9/15/2014 10/3/2014
Renourishment4 Grading 125 9/15/2023 3/7/2024
Notes:
2 Construction activity is assumed to occur 5 days/week.3 Backpassing will occur on an annual basis for 20 years.
Operation
1 The construction schedule is based on the September 2013 Broad Beach Restoration Project: Project Description.
Table 2. Construction Schedule Assumptions1
Construction
4 Renourishment is expected to occur once approximately 10 years after the initial nourishment event. The actual timing for when renourishment would occur is unknown and would be determined via monitoring.

Source Type Phase1 Construction Phase Equipment Type2 # Unit
Equipment Horsepower3 Load Factor3 Usage Hours4
(per day)Generators 2 84 0.74 11Lighting 2 87 0.34 11Grizzly (hopper/conveyor) 3 167 0.40 14
Excavator 1 162 0.38 11
D-9 Bulldozer 2 255 0.40 14
Front-end loader 2 97 0.37 11
Scraper 2 361 0.48 11
Off-road 40-ton dump truck 7 400 0.38 11
Backhoe 2 97 0.37 11
Bobcat 4 64 0.37 11Bulldozer 1 255 0.40 12
Scraper 3 361 0.48 12
Generators 2 84 0.74 11
Lighting 2 87 0.34 11
Grizzly (hopper/conveyor) 3 167 0.40 11
Excavator 1 162 0.38 11
D-9 Bulldozer 2 255 0.40 11
Front-end loader 2 97 0.37 11
Scraper 2 361 0.48 11Off-road 40-ton dump truck 7 400 0.38 11
Notes:1 There is no on-site equipment for planting, fencing, signage, and irrigation because those activities are expected to be done by hand.2 The equipment mix is based on the September 2013 Broad Beach Restoration Project: Project Description.3 Equipment ratings and load factors are CalEEMod defaults.
5 The renourishment equipment mix is assumed to be the same as the nourishment equipment mix.
Abbreviations:CalEEMod - CALifornia Emissions Estimator MODel
4 Daytime construction hours are 7AM - 6PM except for backpassing events, where the equipment would typically operate on a 12-hour basis between 7AM – 7PM. Note that the grizzlies and bulldozers would operate for 14 hours per day, corresponding to the number of hours that sand hauling would occur. Note that the CalEEMod runs were postprocessed to account for the 14 hours per day assumption.
Operation
Backpassing Grading
Renourishment5 Grading
Table 3. On-Site Equipment Mix Assumptions
GradingNourishment
Construction
Dune Construction Grading

Grading - Sand Import1
Grading - Sand Export
(cubic yards) (cubic yards)Nourishment Grading 500,000 0Dune Construction Grading 100,000 0Planting, Fencing, Signage, Irrigation
Site Preparation 0 0
Backpassing Grading 0 0Renourishment Grading 450,000 0
Notes:
2 The sand import/export assumptions are based on the September 2013 Broad Beach Restoration Project: Project Description.
1 The primary sand sources for initial construction and renourishment are inland quarries. Sand for backpassing would come from the wide reach of Broad Beach.
Table 4. Sand Import/Export Assumptions
Source Type Phase
Operation
Construction
Construction Phase

Trip Length Worker4
Trip Length Vendor5
Trip Length Hauling6
(miles) (miles) (miles)Nourishment Grading 24 48 71,500 16.9 6.9 56Dune Construction Grading 24 0 14,300 16.9 6.9 56Planting, Fencing, Signage, Irrigation
Site Preparation 24 40 0 16.9 6.9 --
Backpassing Grading 10 2 0 16.9 6.9 --Renourishment Grading 24 48 64,300 16.9 6.9 56
Notes:1 The number of one-way worker trips is assumed to be twice the number of workers.
5 The vendor trip length is the CalEEMod default value.
Table 5. Trips and Trip Length Assumptions
Source Type Phase Construction Phase
Construction
6 The inland local quarries in the Moorpark/Simi area of Simi Valley are 40 to 56 miles from the site by truck, per the October 2013 traffic study.
3 The volume of sand imported for each phase (from Table 4) is divided by the volume of the 14 cubic yard hauling trucks and multiplied by 2 to get the total number of one-way hauling trips for each phase.
2 The number of one-way vendor trips is assumed to be twice the number of fuel trucks, service trucks, delivery trucks, pick-up trucks, and supervisor vehicles.For nourishment and renourishment, there is 1 fuel truck, 1 service truck, 20 delivery trucks, and 2 pick-up trucks.There may be vendor trips during dune construction; however, on average, it is expected to be minimal.For planting, fencing, signage, and irrigation, there are 20 delivery trucks.For backpassing, there is 1 supervisor vehicle.
# Trips Worker1
(per day)
# Trips Vendor2
(per day)
Total # Trips
Hauling3
Operation
4 The worker trip length is the distance measured from the project site to the Malibu city boundary, which is assumed to be the average trip length for a worker.

VOC1 NOx CO SO2 PM10 Total PM2.5 Total
2013 33.9 383.1 212.7 0.3 10.6 6.22014 32.0 360.4 205.4 0.3 10.4 6.1
Dune Construction 2014 1.7 18.9 14.3 0.0 0.4 0.2Planting, Fencing, Signage, Irrigation
2014 -- -- -- -- -- --
34 383 213 0.3 11 6
-- 221 1,531 -- 13 6
No Yes No No No Yes
Notes:1 ROG as defined by CalEEMod is assumed to be equal to VOC as defined by SCAQMD.
Abbreviations:CEQA - California Environmental Quality ActCO - carbon monoxidelbs - poundsNOx - nitrogen oxides
PM10 - particulate matter of 10 microns in diameter or smaller
PM2.5 - particulate matter of 2.5 microns in diameter or smaller
ROG - reactive organic gasSCAQMD - South Coast Air Quality Management DistrictSO2 - sulfur dioxide
VOC - volatile organic compound
Reference:
Table 6a. Summary of On-Site Construction Criteria Air Pollutant Emissions (Peak Day, Local)
Maximum Daily EmissionsSCAQMD Localized Significance
Threshold3
Above Threshold?
1 SCAQMD air quality CEQA localized significance thresholds. Available at: http://www.aqmd.gov/docs/default-source/ceqa/handbook/localized-significance-thresholds/appendix-c-mass-rate-lst-look-up-tables.pdf?sfvrsn=2. Accessed: June 2014.
YearMaximum (lbs/day)
Construction Phase
Nourishment2
3 SCAQMD CEQA localized significance thresholds (LSTs) for a 5 acre site in Northwest Coastal LA County at a 25 m receptor distance. It is assumed that no more than 5 acres of Broad Beach would be worked on at any given time.
2 The daily emissions for offroad construction equipment for the nourishment phase have been estimated by CalEEMod based on the original 11 hr/day operating schedule. To account for operation of the grizzlies and bulldozers at 14 hr/day, the daily emissions for these equipment as calculated by CalEEMod have been conservatively scaled up assuming all construction equipment in the nourishment phase operates for 14 hr/day.

VOC1 NOx CO SO2 PM10 Total PM2.5 Total
2013 115.6 460.4 481.4 0.9 69.3 22.62014 167.1 502.1 652.0 1.3 122.0 36.4
Maximum Daily Emissions2,3 167 502 652 1.3 122 36
SCAQMD Threshold4 75 100 550 150 150 55Above Threshold? Yes Yes Yes No No No
Notes:1 ROG as defined by CalEEMod is assumed to be equal to VOC as defined by SCAQMD.
4 SCAQMD CEQA significance thresholds.
Abbreviations:CEQA - California Environmental Quality ActCO - carbon monoxidelbs - poundsNOx - nitrogen oxides
PM10 - particulate matter of 10 microns in diameter or smaller
PM2.5 - particulate matter of 2.5 microns in diameter or smaller
ROG - reactive organic gasSCAQMD - South Coast Air Quality Management DistrictSO2 - sulfur dioxide
VOC - volatile organic compound
Reference:
Table 6b. Summary of Total Construction Criteria Air Pollutant Emissions (Peak Day, Regional)
YearMaximum (lbs/day)
1 SCAQMD air quality CEQA significance thresholds. Available at: http://www.aqmd.gov/docs/default-source/ceqa/handbook/scaqmd-air-quality-significance-thresholds.pdf?sfvrsn=2. Accessed: June 2014.
2 The hauling truck trip length was changed to 56 miles after the CalEEMod runs had been executed using the original hauling distance of 45 miles. Thus, hauling emissions from the CalEEMod output files were scaled by multiplying by a factor of 56/45. In addition, the maximum number of truck loads/day is assumed to be 411 truck loads/day, and thus the hauling emissions for the maximum day were estimated by multiplying by a factor of 411/275 (nourishment) and 411/325 (dune construction). The maximum daily emissions for offroad construction equipment for the nourishment phase as calculated by CalEEMod have been scaled assuming all construction equipment in the nourishment phase operates for 14 hr/day.
3 Note that the emissions in 2014 conservatively assume that nourishment and dune construction could occur on the same day. If this overlap of construction activities does not occur, then the emissions would be less than that presented here.

VOC1 NOx CO SO2 2 PM10 PM2.5
Backpassing3 2014 8.8 108.0 71.5 0.1 5.1 2.42023 42.2 125.5 190.5 0.6 42.5 13.22024 40.9 117.6 185.6 0.6 59.7 17.4
Maximum 42 126 190 1 60 17
42 126 190 1 60 1755 55 550 150 150 55
No Yes No No No No
Notes:1 ROG as defined by CalEEMod is assumed to be equal to VOC as defined by SCAQMD. 2 CalEEMod reported SO2 emissions are assumed to represent SOx emissions. 3 Backpassing occurs each year for 15 days.4 Renourishment is a one-time event that is anticipated to occur 10 years after the initial nourishment.
6 SCAQMD CEQA significance thresholds.
Abbreviations:CalEEMod - CALifornia Emissions Estimator MODelCO - carbon monoxidelbs - poundsNOx - nitrogen oxides
PM10 - particulate matter of 10 microns in diameter or smaller
PM2.5 - particulate matter of 2.5 microns in diameter or smaller
ROG - reactive organic gasSCAQMD - South Coast Air Quality Management DistrictSO2 - sulfur dioxide
VOC - volatile organic compound
Reference:5 SCAQMD air quality CEQA significance thresholds. Available at: http://www.aqmd.gov/docs/default-source/ceqa/handbook/scaqmd-air-quality-significance-thresholds.pdf?sfvrsn=2. Accessed: June 2014.
Table 7. Summary of Operational Criteria Air Pollutant Emissions
YearPhase
SCAQMD Threshold6
Above Threshold?
(lbs/day)
Maximum Daily Emissions5
Renourishment4
5 The hauling truck trip length was changed to 56 miles after the CalEEMod runs had been executed using the original hauling distance of 45 miles. Because emissions are a linear function of vehicle miles traveled, hauling emissions from the CalEEMod output files were scaled by multiplying by a factor of 56/45.

Off-road Equipment On-road Vehicles Total
2013 954.4 1,174.1 2,128.52014 653.8 805.9 1,459.7
Dune Construction 2014 21.1 378.9 400.0Planting, Fencing,
Signage, Irrigation1 2014 -- 16.0 16.0
4,004.1133.5
Notes:1 No off-road equipment is used for the planting, fencing, signage, and irrigation phase.
Abbreviations:CO2e - carbon dioxide equivalent
GHG - greenhouse gasMT - metric tonnes
2 The hauling truck trip length was changed to 56 miles after the CalEEMod runs had been executed using the original hauling distance of 45 miles. Because emissions are a linear function of vehicle miles traveled, hauling emissions from the CalEEMod output files were scaled by multiplying by a factor of 56/45.
Total for All Activity2 (MT CO2e)30-year Amortized (MT/year CO2e)
Table 8. Annual GHG Construction Emissions
Construction Activity Year CO2e Emissions (MT/year)
Nourishment

Initial (acres) Final (acres)Grassland 1 3.7 -11.6
-11.6-0.4
Notes:
Abbreviations:CalEEMod - CALifornia Emissions Estimator MODelCO2 - carbon dioxide
CO2e - carbon dioxide equivalent
MT - metric tonnes
1 Approximately 1 acre of ice plants will be removed. 159,567 square feet (3.7 acres) of native species including sand verbena, beach bur, beach saltbrush, beach morning glory, beach evening primrose, salt grass, beach strawberry, California sagebrush, California croton, beach spectacle pod, California goldenbrush, coast buckwheat, and chamisso bush lupine will be planted. The CalEEMod "Grassland" category was used to estimate the CO2 accumulation.
Table 9. Vegetation Change Evaluation
Type of Vegetation Change Land Use Change Annual CO2 Accumulation(MT)
Total CO2e Accumulated / Sequestered (MT)30-year Amortized (MT/year)
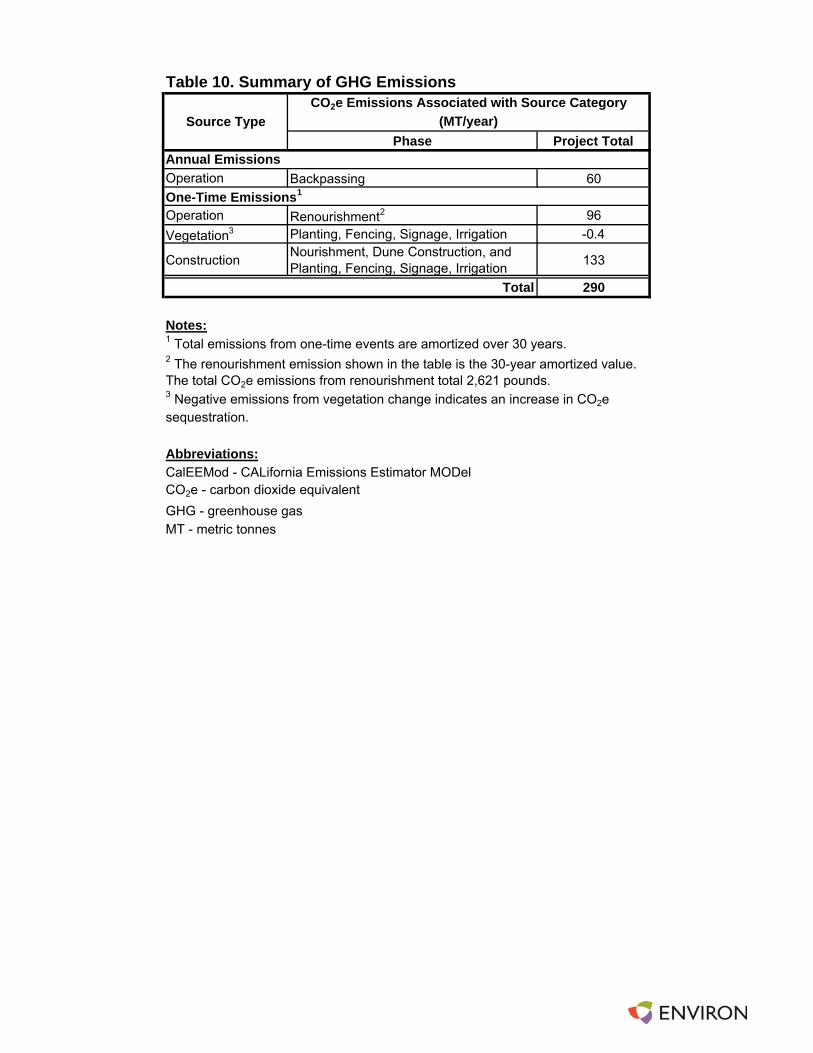
Table 10. Summary of GHG Emissions
Phase Project Total
Operation Backpassing 60
Operation Renourishment2 96
Vegetation3 Planting, Fencing, Signage, Irrigation -0.4
ConstructionNourishment, Dune Construction, and Planting, Fencing, Signage, Irrigation
133
290
Notes:
Abbreviations:CalEEMod - CALifornia Emissions Estimator MODelCO2e - carbon dioxide equivalent
GHG - greenhouse gasMT - metric tonnes
2 The renourishment emission shown in the table is the 30-year amortized value. The total CO2e emissions from renourishment total 2,621 pounds.3 Negative emissions from vegetation change indicates an increase in CO2e sequestration.
Source TypeCO2e Emissions Associated with Source Category
(MT/year)
Total
Annual Emissions
One-Time Emissions1
1 Total emissions from one-time events are amortized over 30 years.

Table 11. On-Site Toxic Air Contaminant Emissions
(tons/year) (lbs/year)2013 0.10 2082014 0.07 134
Dune Construction 2014 0.002 4Planting, Fencing, Signage, Irrigation 2014 -- --
0.173 3462.47E-03 4.95
Notes:
1 The emissions for offroad construction equipment for the nourishment phase were estimated using CalEEMod based on an 11 hr/day operating schedule. To account for the increase in operation of the grizzlies and bulldozers at 14 hr/day, the offroad emissions as estimated by CalEEMod have been conservatively scaled assuming an operation time of 14 hr/day.
Total for All Activity70-year Amortized2
2 The diesel exhaust PM10 emissions from on-site off-road construction equipment are amortized over 70 years because the analysis for calculating cancer risk assumes exposure occurs over 70 years.
Construction Activity Year
Nourishment1
Off-Road Equipment Diesel PM10

Table 12a. Rule 1401 Tier 2 Health Risk Assessment of On-Site Emissions (Cancer Risk)CP1 Qyr
2 X/Q3 DBR6
(mg/kg-day)-1 (ton/yr) (µg/m3)/
(ton/yr)L/kg-day
Diesel PM10 1.10E+00 2.47E-03 8.19 1.0 0.88 302 0.96 1E-06 1.00 5.68E-06
5.68E-061.00E-05
NO
Notes:
6 The daily breathing rate (DBR) for residential receptors is from Table 9A of the SCAQMD Rule 1401 Attachment L, revised December 7, 2012.
7 The exposure value factor (EVF) for residential receptors is from Table 9B of the SCAQMD Rule 1401 Attachment L, revised December 7, 2012.8 The Maximum Individual Cancer Risk (MICR) is calculated using MICR = CP x Qyr x X/Q x AFann x MET x DBR x EVF x 10-6 x MP
Conversion Factor
1 The inhalation cancer potency (CP) and multipathway adjustment factor (MP) are from Table 8A of the SCAQMD Rule 1401 Attachment L, revised December 7, 2012.2 The 70-year amortized diesel exhaust particulate emissions (Qyr) from construction equipment as calculated in Table 11. The annual emissions were amortized over 70 years because the analysis for calculating cancer risk assumes exposure occurs over 70 years.3 This X/Q is for a volume source with the following dimensions: Area >30,000 ft2 and Height >20 ft, and a downwind distance of 50 m. The X/Q is from Table 4A of the SCAQMD Rule 1401 Attachment L, revised December 7, 2012.4 The annual concentration adjustment factor (AFann) for residential receptors is from Table 2C of the SCAQMD Rule 1401 Attachment L, revised December 7, 2012.
MP1 MICR8
Total Maximum Individual Cancer Risk (MICR)SCAQMD CEQA Significance Threshold
Above Threshold?
TAC AFann4 MET5 EVF7
5 The meteorological correction factor (MET) for volume source equipment operating 12 hours per day or less is from Table 4B of the SCAQMD Rule 1401 Attachment L, revised December 7, 2012.
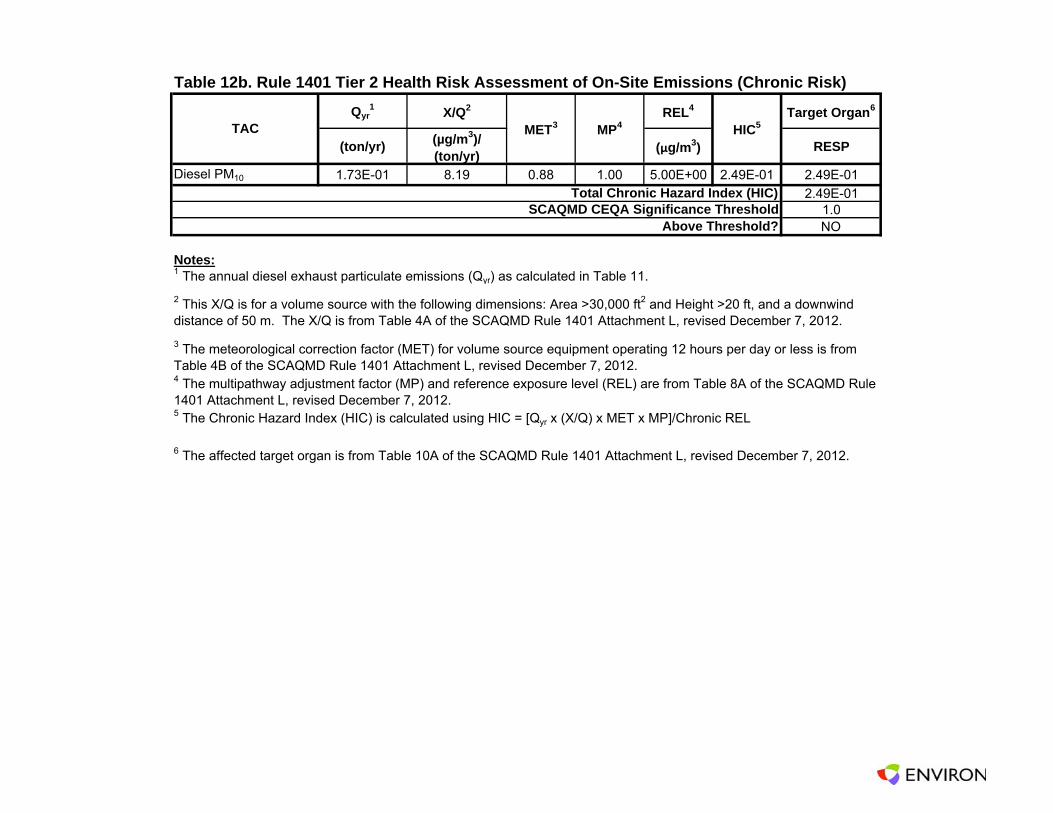
Table 12b. Rule 1401 Tier 2 Health Risk Assessment of On-Site Emissions (Chronic Risk)
Qyr1 X/Q2 REL4 Target Organ6
(ton/yr) (µg/m3)/ (ton/yr) (µg/m3) RESP
Diesel PM10 1.73E-01 8.19 0.88 1.00 5.00E+00 2.49E-01 2.49E-01
2.49E-011.0NO
Notes:
5 The Chronic Hazard Index (HIC) is calculated using HIC = [Qyr x (X/Q) x MET x MP]/Chronic REL
6 The affected target organ is from Table 10A of the SCAQMD Rule 1401 Attachment L, revised December 7, 2012.
SCAQMD CEQA Significance Threshold
TAC MET3 MP4 HIC5
Total Chronic Hazard Index (HIC)
Above Threshold?
1 The annual diesel exhaust particulate emissions (Qyr) as calculated in Table 11.
2 This X/Q is for a volume source with the following dimensions: Area >30,000 ft2 and Height >20 ft, and a downwind distance of 50 m. The X/Q is from Table 4A of the SCAQMD Rule 1401 Attachment L, revised December 7, 2012.
3 The meteorological correction factor (MET) for volume source equipment operating 12 hours per day or less is from Table 4B of the SCAQMD Rule 1401 Attachment L, revised December 7, 2012.4 The multipathway adjustment factor (MP) and reference exposure level (REL) are from Table 8A of the SCAQMD Rule 1401 Attachment L, revised December 7, 2012.

Appendix A
CalEEMod™ Output Results
ENVIRON

Land Use Change -
Construction Off-road Equipment Mitigation - project specific information
Off-road Equipment - project specific information
Off-road Equipment - nourishment equipment list
Off-road Equipment - project specific information
Off-road Equipment - project specific information
Trips and VMT - 12 workers (pg 42 of PD)14-ton hauling trucks40-45 miles to quarry (pg 14 of PD)
Grading -
N2O Intensity (lb/MWhr)
0
1.3 User Entered Comments & Non-Default Data
Project Characteristics -
Land Use -
Construction Phase - project specific information
Utility Company
CO2 Intensity (lb/MWhr)
0 CH4 Intensity (lb/MWhr)
0
Precipitation Freq (Days) 33
Climate Zone 8 Operational Year 2013
1.1 Land Usage
1.2 Other Project Characteristics
Urbanization Urban Wind Speed (m/s) 2.2
CalEEMod Version: CalEEMod.2013.2.1 Page 1 of 1 Date: 9/30/2013 5:12 PM
Broad Beach - ConstructionLos Angeles-South Coast County, Annual
1.0 Project Characteristics

tblGrading MaterialImported 0.00 100,000.00
tblOffRoadEquipment OffRoadEquipmentUnitAmount 1.00 2.00
tblConstructionPhase PhaseStartDate 4/16/2014 4/15/2014
tblGrading MaterialImported 0.00 500,000.00
tblConstructionPhase PhaseEndDate 5/16/2014 5/15/2014
tblConstructionPhase PhaseStartDate 3/16/2014 3/15/2014
tblConstructionPhase NumDays 0.00 23.00
tblConstructionPhase PhaseEndDate 3/14/2014 3/15/2014
tblConstructionPhase NumDays 0.00 130.00
tblConstructionPhase NumDays 0.00 22.00
tblConstEquipMitigation NumberOfEquipmentMitigated 0.00 4.00
tblConstEquipMitigation NumberOfEquipmentMitigated 0.00 4.00
tblConstEquipMitigation NumberOfEquipmentMitigated 0.00 2.00
tblConstEquipMitigation NumberOfEquipmentMitigated 0.00 2.00
tblConstEquipMitigation NumberOfEquipmentMitigated 0.00 2.00
tblConstEquipMitigation NumberOfEquipmentMitigated 0.00 3.00
tblConstEquipMitigation NumberOfEquipmentMitigated 0.00 2.00
tblConstEquipMitigation NumberOfEquipmentMitigated 0.00 7.00
tblConstEquipMitigation DPF No Change Level 3
tblConstEquipMitigation NumberOfEquipmentMitigated 0.00 1.00
tblConstEquipMitigation DPF No Change Level 3
tblConstEquipMitigation DPF No Change Level 3
tblConstEquipMitigation DPF No Change Level 3
tblConstEquipMitigation DPF No Change Level 3
tblConstEquipMitigation DPF No Change Level 3
tblConstEquipMitigation DPF No Change Level 3
tblConstEquipMitigation DPF No Change Level 3
tblConstEquipMitigation DPF No Change Level 3
Table Name Column Name Default Value New Value

2.0 Emissions Summary
2.1 Overall ConstructionUnmitigated Construction
tblTripsAndVMT WorkerVehicleClass EMFAC_Mix
tblTripsAndVMT WorkerVehicleClass EMFAC_Mix
tblTripsAndVMT WorkerTripNumber 15.00 24.00
tblTripsAndVMT WorkerVehicleClass EMFAC_Mix
tblTripsAndVMT WorkerTripLength 14.70 16.90
tblTripsAndVMT WorkerTripNumber 53.00 24.00
tblTripsAndVMT WorkerTripLength 14.70 16.90
tblTripsAndVMT WorkerTripLength 14.70 16.90
tblTripsAndVMT VendorVehicleClass HHDT
tblTripsAndVMT VendorVehicleClass HHDT
tblTripsAndVMT HaulingVehicleClass EMFAC_Mix
tblTripsAndVMT VendorVehicleClass HHDT
tblTripsAndVMT HaulingVehicleClass EMFAC_Mix
tblTripsAndVMT HaulingVehicleClass EMFAC_Mix
tblTripsAndVMT HaulingTripNumber 62,500.00 71,500.00
tblTripsAndVMT HaulingTripNumber 0.00 14,300.00
tblOffRoadEquipment UsageHours 6.00 11.00
tblProjectCharacteristics OperationalYear 2014 2013
tblOffRoadEquipment UsageHours 1.00 11.00
tblOffRoadEquipment UsageHours 6.00 11.00
tblOffRoadEquipment OffRoadEquipmentUnitAmount 0.00 4.00
tblOffRoadEquipment PhaseName Dune Construction

Total CO2 CH4 N2O CO2ePM10 Total
Fugitive PM2.5
Exhaust PM2.5
PM2.5 Total
Bio- CO2 NBio- CO2
2.2 Overall OperationalUnmitigated Operational
ROG NOx CO SO2 Fugitive PM10
Exhaust PM10
0.00 0.00 0.00 0.00 0.00 0.0034.80 79.35 41.89 44.96 79.40 56.08
NBio-CO2 Total CO2 CH4 N20 CO2e
Percent Reduction
0.00 0.00 0.00 0.00
Exhaust PM10
PM10 Total
Fugitive PM2.5
Exhaust PM2.5
PM2.5 Total
Bio- CO2ROG NOx CO SO2 Fugitive PM10
0.0000 3,562.5478
3,562.5478 0.5486 0.0000 3,574.06753.3541 0.2012 3.5553 1.0422 0.1860 1.2282Total 4.7023 22.7520 21.6536 0.0396
0.0000 1,647.0969
1,647.0969 0.2339 0.0000 1,652.00811.7846 0.0815 1.8662 0.5477 0.0753 0.62302014 2.1281 9.3753 9.6167 0.0185
0.0000 1,915.4509
1,915.4509 0.3147 0.0000 1,922.05941.5695 0.1197 1.6892 0.4945 0.1106 0.60522013 2.5743 13.3767 12.0370 0.0211
Total CO2 CH4 N2O CO2e
Year tons/yr MT/yr
PM10 Total
Fugitive PM2.5
Exhaust PM2.5
PM2.5 Total
Bio- CO2 NBio- CO2
Mitigated Construction
ROG NOx CO SO2 Fugitive PM10
Exhaust PM10
0.0000 3,562.5497
3,562.5497 0.5486 0.0000 3,574.06955.1441 0.9744 6.1185 1.8935 0.9027 2.7963Total 4.7023 22.7521 21.6536 0.0396
0.0000 1,647.0977
1,647.0977 0.2339 0.0000 1,652.00892.6816 0.3913 3.0729 0.9736 0.3624 1.33612014 2.1281 9.3753 9.6167 0.0185
0.0000 1,915.4520
1,915.4520 0.3147 0.0000 1,922.06062.4625 0.5831 3.0456 0.9199 0.5403 1.46022013 2.5743 13.3768 12.0370 0.0211
NBio- CO2 Total CO2 CH4 N2O CO2e
Year tons/yr MT/yr
Exhaust PM10
PM10 Total
Fugitive PM2.5
Exhaust PM2.5
PM2.5 Total
Bio- CO2ROG NOx CO SO2 Fugitive PM10
2.3 VegetationVegetation
CO2e
Category MT
0.00 0.00 0.00 0.00 0.00 0.000.00 0.00 0.00 0.00 0.00 0.00
NBio-CO2 Total CO2 CH4 N20 CO2e
Percent Reduction
0.00 0.00 0.00 0.00
Exhaust PM10
PM10 Total
Fugitive PM2.5
Exhaust PM2.5
PM2.5 Total
Bio- CO2ROG NOx CO SO2 Fugitive PM10
0.0000 0.0000 0.0000 0.0000 0.0000 0.00000.0000 0.0000 0.0000 0.0000Total 0.0000
0.0000 0.0000 0.0000 0.0000 0.0000 0.00000.0000 0.0000 0.0000 0 0000Area 0.0000
Total CO2 CH4 N2O CO2e
Category tons/yr MT/yr
PM10 Total
Fugitive PM2.5
Exhaust PM2.5
PM2.5 Total
Bio- CO2 NBio- CO2
Mitigated Operational
ROG NOx CO SO2 Fugitive PM10
Exhaust PM10
0.0000 0.0000 0.0000 0.0000 0.0000 0.00000.0000 0.0000 0.0000 0.0000Total 0.0000
0.0000 0.0000 0.0000 0.0000 0.0000 0.00000.0000 0.0000 0.0000 0 0000Area 0.0000
Category tons/yr MT/yr

Dune Construction Skid Steer Loaders 4 11.00 64 0.37
Nourishment Tractors/Loaders/Backhoes 2 11.00 97 0.37
Nourishment Scrapers 2 11.00 361 0.48
Nourishment Rubber Tired Dozers 2 11.00 255 0.40
Nourishment Other Material Handling Equipment 3 11.00 167 0.40
Nourishment Other General Industrial Equipment 2 11.00 87 0.34
Nourishment Off-Highway Trucks 7 11.00 400 0.38
Nourishment Generator Sets 2 11.00 84 0.74
Load Factor
Nourishment Excavators 1 11.00 162 0.38
OffRoad Equipment
Phase Name Offroad Equipment Type Amount Usage Hours Horse Power
23
Acres of Grading (Site Preparation Phase): 0
Acres of Grading (Grading Phase): 0
Acres of Paving: 0
Residential Indoor: 0; Residential Outdoor: 0; Non-Residential Indoor: 0; Non-Residential Outdoor: 0 (Architectural Coating – sqft)
3 Planting, Fencing, Signage, Irrigation
Site Preparation 4/15/2014 5/15/2014 5
130
2 Dune Construction Grading 3/15/2014 4/15/2014 5 22
End Date Num Days Week
Num Days Phase Description
1 Nourishment Grading 9/15/2013 3/15/2014 5
3.0 Construction Detail
Construction Phase
Phase Number
Phase Name Phase Type Start Date
Vegetation Land Change
11.6370
Total 11.6370

0.2688 0.0000 954.3773
Unmitigated Construction Off-Site
0.6165 0.5055 1.1220 0.0000 948.7320 948.7320
954.3773
Total 1.0264 11.5880 6.4338 9.8900e-003
1.2943 0.5452 1.8395
0.5055 0.0000 948.7320 948.7320 0.2688 0.00009 8900e-003
0.5452 0.5452 0.5055
0.0000 0.0000 0.0000 0.0000 0.0000
Off-Road 1.0264 11.5880 6.4338
0.0000 1.2943 0.6165 0.0000 0.6165 0.0000
Category tons/yr MT/yr
Fugitive Dust 1.2943
Bio- CO2 NBio- CO2 Total CO2 CH4 N2O CO2eFugitive PM10
Exhaust PM10
PM10 Total
Fugi ive PM2.5
Exhaust PM2.5
PM2.5 Total
ROG NOx CO SO2
Use DPF for Construction Equipment
Water Exposed Area
Reduce Vehicle Speed on Unpaved Roads
Clean Paved Roads
3.2 Nourishment - 2013Unmitigated Construction On-Site
6.90 0.00 EMFAC_Mix HHDT EMFAC_Mix
3.1 Mitigation Measures Construction
Planting, Fencing, Signage Irrigation
0 24.00 40.00 0.00 16.90
16.90 6.90 45.00 EMFAC_Mix HHDT EMFAC_Mix
6.90 45.00 EMFAC_Mix HHDT EMFAC_Mix
Dune Construction 6 24.00 0.00 14,300.00
Nourishment 21 24.00 48.00 71,500.00 16.90
Worker Trip Length
Vendor Trip Length
Hauling Trip Length
Worker Vehicle Class
Vendor Vehicle Class
Hauling Vehicle Class
Trips and VMT
Phase Name Offroad Equ pment Count
Worker Tr p Number
Vendor Trip Number
Hauling Trip Number
Dune Construction Tractors/Loaders/Backhoes 2 11.00 97 0.37

Total CO2 CH4 N2O CO2ePM10 Total
Fugi ive PM2.5
Exhaust PM2.5
PM2.5 Total
Bio- CO2 NBio- CO2
Mitigated Construction Off-Site
ROG NOx CO SO2 Fugitive PM10
Exhaust PM10
0.0000 948.7309 948.7309 0.2688 0.0000 954.37620.4012 0.0818 0.4830 0.1911 0.0758 0.2669Total 1.0264 11.5880 6.4337 9.8900e-003
0.0000 948.7309 948.7309 0.2688 0.0000 954.37620.0818 0.0818 0.0758 0.0758Off-Road 1.0264 11.5880 6.4337 9 8900e-003
0.0000 0.0000 0.0000 0.0000 0.0000 0.00000.4012 0.0000 0.4012 0.1911 0.0000 0.1911Fugitive Dust
Total CO2 CH4 N2O CO2e
Category tons/yr MT/yr
PM10 Total
Fugi ive PM2.5
Exhaust PM2.5
PM2.5 Total
Bio- CO2 NBio- CO2
Mitigated Construction On-Site
ROG NOx CO SO2 Fugitive PM10
Exhaust PM10
0.0000 966.7200 966.7200 0.0459 0.0000 967.68321.1683 0.0379 1.2062 0.3034 0.0348 0.3383Total 1.5479 1.7887 5.6032 0.0112
0.0000 15.0096 15.0096 7.6000e-004
0.0000 15.02550.0118 5.0000e-004
0.0123 3.1700e-003
4.5000e-004
3.6200e-003
Worker 0.0251 0 0250 0.0924 1.7000e-004
0.0000 46.6456 46.6456 6.0000e-004
0.0000 46.65810.0109 7.7500e-003
0.0187 3.0000e-003
7.1200e-003
0.0101Vendor 0.0592 0 3058 0.4057 5 0000e-004
0.0000 905.0648 905.0648 0.0445 0.0000 905.99961.1455 0.0297 1.1752 0.2973 0.0272 0.3245
CO2e
Category tons/yr MT/yr
Hauling 1.4636 1.4579 5.1052 0.0105
PM2.5 Total
Bio- CO2 NBio- CO2 Total CO2 CH4 N2OSO2 Fugitive PM10
Exhaust PM10
PM10 Total
Fugi ive PM2.5
Exhaust PM2.5
ROG NOx CO
0.0000 31.9877 31.9877 3.2000e-004
0.0000 31.99437.5300e-003
3.0500e-003
0.0106 2.0700e-003
2.8100e-003
4.8700e-003
Vendor 0.0308 0.1862 0.2502 3 5000e-004
0.0000 613.1243 613.1243 0.0280 0.0000 613.71301.1126 0.0149 1.1275 0.2842 0.0137 0.2979Hauling 0.9203 0 9260 3.1770 7 2600e-003
Total CO2 CH4 N2O CO2e
Category tons/yr MT/yr
PM10 Total
Fugi ive PM2.5
Exhaust PM2.5
PM2.5 Total
Bio- CO2 NBio- CO2
Unmitigated Construction Off-Site
ROG NOx CO SO2 Fugitive PM10
Exhaust PM10
0.0000 649.8997 649.8997 0.1846 0.0000 653.77611.2943 0.3502 1.6444 0.6165 0.3246 0.9411Total 0.6663 7.5038 4.2762 6.8000e-003
0.0000 649.8997 649.8997 0.1846 0.0000 653.77610.3502 0.3502 0.3246 0.3246Off-Road 0.6663 7 5038 4.2762 6 8000e-003
0.0000 0.0000 0.0000 0.0000 0.0000 0.00001.2943 0.0000 1.2943 0.6165 0.0000 0.6165Fugitive Dust
Total CO2 CH4 N2O CO2e
Category tons/yr MT/yr
PM10 Total
Fugi ive PM2.5
Exhaust PM2.5
PM2.5 Total
Bio- CO2 NBio- CO2
3.2 Nourishment - 2014Unmitigated Construction On-Site
ROG NOx CO SO2 Fugitive PM10
Exhaust PM10
0.0000 966.7200 966.7200 0.0459 0.0000 967.68321.1683 0.0379 1.2062 0.3034 0.0348 0.3383Total 1.5479 1.7887 5.6032 0.0112
0.0000 15.0096 15.0096 7.6000e-004
0.0000 15.02550.0118 5.0000e-004
0.0123 3.1700e-003
4.5000e-004
3.6200e-003
Worker 0.0251 0 0250 0.0924 1.7000e-004
0.0000 46.6456 46.6456 6.0000e-004
0.0000 46.65810.0109 7.7500e-003
0.0187 3.0000e-003
7.1200e-003
0.0101Vendor 0.0592 0 3058 0.4057 5 0000e-004
0.0000 905.0648 905.0648 0.0445 0.0000 905.99961.1455 0.0297 1.1752 0.2973 0.0272 0.3245Hauling 1.4636 1.4579 5.1052 0.0105
Category tons/yr MT/yr
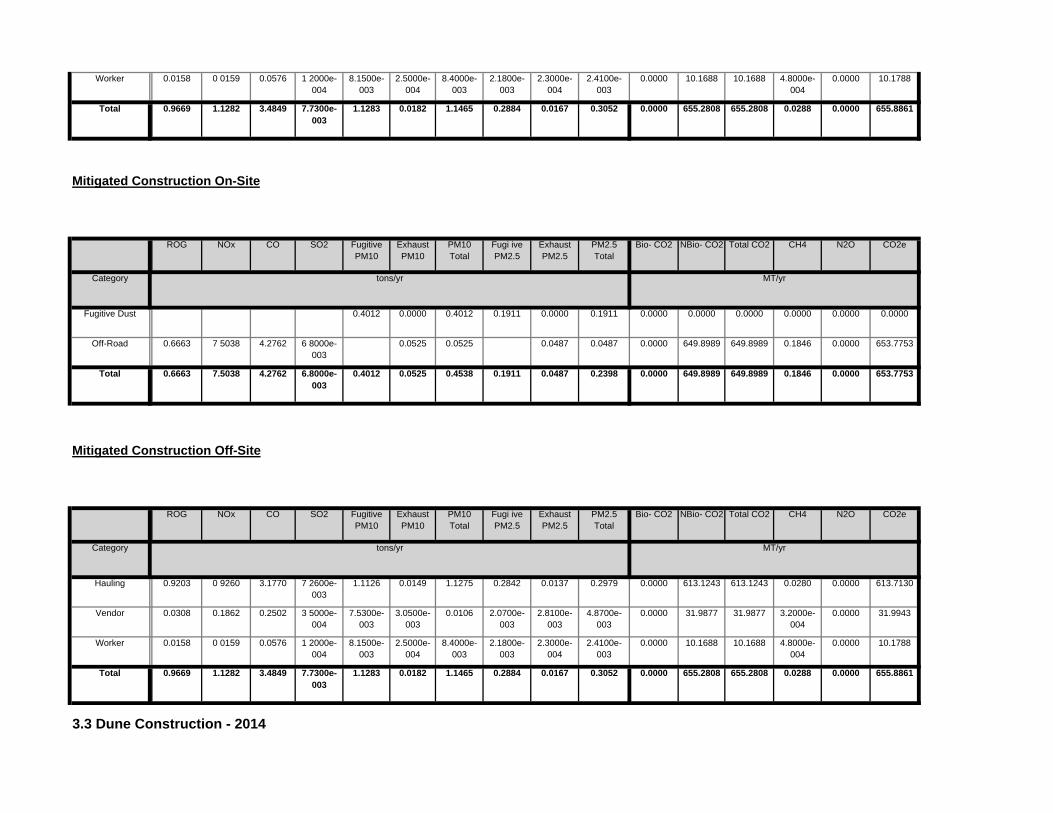
3.3 Dune Construction - 2014
0.0000 655.2808 655.2808 0.0288 0.0000 655.88611.1283 0.0182 1.1465 0.2884 0.0167 0.3052Total 0.9669 1.1282 3.4849 7.7300e-003
0.0000 10.1688 10.1688 4.8000e-004
0.0000 10.17888.1500e-003
2.5000e-004
8.4000e-003
2.1800e-003
2.3000e-004
2.4100e-003
Worker 0.0158 0 0159 0.0576 1 2000e-004
0.0000 31.9877 31.9877 3.2000e-004
0.0000 31.99437.5300e-003
3.0500e-003
0.0106 2.0700e-003
2.8100e-003
4.8700e-003
Vendor 0.0308 0.1862 0.2502 3 5000e-004
0.0000 613.1243 613.1243 0.0280 0.0000 613.71301.1126 0.0149 1.1275 0.2842 0.0137 0.2979Hauling 0.9203 0 9260 3.1770 7 2600e-003
Total CO2 CH4 N2O CO2e
Category tons/yr MT/yr
PM10 Total
Fugi ive PM2.5
Exhaust PM2.5
PM2.5 Total
Bio- CO2 NBio- CO2
Mitigated Construction Off-Site
ROG NOx CO SO2 Fugitive PM10
Exhaust PM10
0.0000 649.8989 649.8989 0.1846 0.0000 653.77530.4012 0.0525 0.4538 0.1911 0.0487 0.2398Total 0.6663 7.5038 4.2762 6.8000e-003
0.0000 649.8989 649.8989 0.1846 0.0000 653.77530.0525 0.0525 0.0487 0.0487Off-Road 0.6663 7 5038 4.2762 6 8000e-003
0.0000 0.0000 0.0000 0.0000 0.0000 0.00000.4012 0.0000 0.4012 0.1911 0.0000 0.1911Fugitive Dust
Total CO2 CH4 N2O CO2e
Category tons/yr MT/yr
PM10 Total
Fugi ive PM2.5
Exhaust PM2.5
PM2.5 Total
Bio- CO2 NBio- CO2
Mitigated Construction On-Site
ROG NOx CO SO2 Fugitive PM10
Exhaust PM10
0.0000 655.2808 655.2808 0.0288 0.0000 655.88611.1283 0.0182 1.1465 0.2884 0.0167 0.3052Total 0.9669 1.1282 3.4849 7.7300e-003
0.0000 10.1688 10.1688 4.8000e-004
0.0000 10.17888.1500e-003
2.5000e-004
8.4000e-003
2.1800e-003
2.3000e-004
2.4100e-003
Worker 0.0158 0 0159 0.0576 1 2000e-004

Total CO2 CH4 N2O CO2ePM10 Total
Fugi ive PM2.5
Exhaust PM2.5
PM2.5 Total
Bio- CO2 NBio- CO2
Mitigated Construction On-Site
ROG NOx CO SO2 Fugitive PM10
Exhaust PM10
0.0000 304.9990 304.9990 0.0140 0.0000 305.29190.2472 7.4100e-003
0.2546 0.0662 6.8100e-003
0.0730Total 0.4580 0.4609 1.5825 3.6100e-003
0.0000 4.2210 4.2210 2.0000e-004
0.0000 4.22523.3800e-003
1.0000e-004
3.4900e-003
9.1000e-004
1.0000e-004
1.0000e-003
Worker 6 5600e-003
6.6100e-003
0.0239 5 0000e-005
0.0000 0.0000 0.0000 0.0000 0.0000 0.00000.0000 0.0000 0.0000 0.0000 0.0000 0.0000Vendor 0.0000 0 0000 0.0000 0.0000
0.0000 300.7780 300.7780 0.0138 0.0000 301.06670.2438 7.3100e-003
0.2511 0.0653 6.7100e-003
0.0720Hauling 0.4515 0.4543 1.5585 3 5600e-003
Total CO2 CH4 N2O CO2e
Category tons/yr MT/yr
PM10 Total
Fugi ive PM2.5
Exhaust PM2.5
PM2.5 Total
Bio- CO2 NBio- CO2
Unmitigated Construction Off-Site
ROG NOx CO SO2 Fugitive PM10
Exhaust PM10
0.0000 20.9374 20.9374 6.1900e-003
0.0000 21.06745.6500e-003
0.0143 0.0200 8.6000e-004
0.0132 0.0140Total 0.0188 0.2083 0.1576 2.2000e-004
0.0000 20.9374 20.9374 6.1900e-003
0.0000 21.06740.0143 0.0143 0.0132 0.0132Off-Road 0.0188 0 2083 0.1576 2 2000e-004
0.0000 0.0000 0.0000 0.0000 0.0000 0.00005.6500e-003
0.0000 5.6500e-003
8.6000e-004
0.0000 8.6000e-004
Fugitive Dust
Total CO2 CH4 N2O CO2e
Category tons/yr MT/yr
PM10 Total
Fugi ive PM2.5
Exhaust PM2.5
PM2.5 Total
Bio- CO2 NBio- CO2
Unmitigated Construction On-Site
ROG NOx CO SO2 Fugitive PM10
Exhaust PM10

0.0000 0.0000 0.0000 0.0000 0.0000 0.00000.0000 0.0000 0.0000 0.0000 0.0000 0.0000Total
0.0000 0.0000 0.0000 0.0000 0.0000 0.00000.0000 0.0000 0.0000 0.0000 0.0000 0.0000Fugitive Dust
Total CO2 CH4 N2O CO2e
Category tons/yr MT/yr
PM10 Total
Fugi ive PM2.5
Exhaust PM2.5
PM2.5 Total
Bio- CO2 NBio- CO2
3.4 Planting, Fencing, Signage, Irrigation - 2014Unmitigated Construction On-Site
ROG NOx CO SO2 Fugitive PM10
Exhaust PM10
0.0000 304.9990 304.9990 0.0140 0.0000 305.29190.2472 7.4100e-003
0.2546 0.0662 6.8100e-003
0.0730Total 0.4580 0.4609 1.5825 3.6100e-003
0.0000 4.2210 4.2210 2.0000e-004
0.0000 4.22523.3800e-003
1.0000e-004
3.4900e-003
9.1000e-004
1.0000e-004
1.0000e-003
Worker 6 5600e-003
6.6100e-003
0.0239 5 0000e-005
0.0000 0.0000 0.0000 0.0000 0.0000 0.00000.0000 0.0000 0.0000 0.0000 0.0000 0.0000Vendor 0.0000 0 0000 0.0000 0.0000
0.0000 300.7780 300.7780 0.0138 0.0000 301.06670.2438 7.3100e-003
0.2511 0.0653 6.7100e-003
0.0720Hauling 0.4515 0.4543 1.5585 3 5600e-003
Total CO2 CH4 N2O CO2e
Category tons/yr MT/yr
PM10 Total
Fugi ive PM2.5
Exhaust PM2.5
PM2.5 Total
Bio- CO2 NBio- CO2
Mitigated Construction Off-Site
ROG NOx CO SO2 Fugitive PM10
Exhaust PM10
0.0000 20.9374 20.9374 6.1900e-003
0.0000 21.06731.7500e-003
2.1500e-003
3.9000e-003
2.7000e-004
1.9800e-003
2.2500e-003
Total 0.0188 0.2083 0.1576 2.2000e-004
0.0000 20.9374 20.9374 6.1900e-003
0.0000 21.06732.1500e-003
2.1500e-003
1.9800e-003
1.9800e-003
Off-Road 0.0188 0 2083 0.1576 2 2000e-004
0.0000 0.0000 0.0000 0.0000 0.0000 0.00001.7500e-003
0.0000 1.7500e-003
2.7000e-004
0.0000 2.7000e-004
Fugitive Dust
Category tons/yr MT/yr

Mitigated Construction Off-Site
0.0000 0.0000 0.0000 0.0000 0.0000 0.00000.0000 0.0000 0.0000 0.0000 0.0000 0.0000Total
0.0000 0.0000 0.0000 0.0000 0.0000 0.00000.0000 0.0000 0.0000 0.0000 0.0000 0.0000Fugitive Dust
Total CO2 CH4 N2O CO2e
Category tons/yr MT/yr
PM10 Total
Fugi ive PM2.5
Exhaust PM2.5
PM2.5 Total
Bio- CO2 NBio- CO2
Mitigated Construction On-Site
ROG NOx CO SO2 Fugitive PM10
Exhaust PM10
0.0000 15.9808 15.9808 3.2000e-004
0.0000 15.98756.2600e-003
1.2100e-003
7.4700e-003
1.7000e-003
1.1200e-003
2.8100e-003
Total 0.0180 0.0743 0.1155 1.7000e-004
0.0000 4.4129 4.4129 2.1000e-004
0.0000 4.41723.5400e-003
1.1000e-004
3.6400e-003
9.5000e-004
1.0000e-004
1.0500e-003
Worker 6 8600e-003
6 9100e-003
0.0250 5 0000e-005
0.0000 11.5679 11.5679 1.1000e-004
0.0000 11.57032.7200e-003
1.1000e-003
3.8300e-003
7.5000e-004
1.0200e-003
1.7600e-003
Vendor 0.0111 0 0674 0.0905 1 2000e-004
0.0000 0.0000 0.0000 0.0000 0.0000 0.00000.0000 0.0000 0.0000 0.0000 0.0000 0.0000Hauling 0.0000 0 0000 0.0000 0.0000
Total CO2 CH4 N2O CO2e
Category tons/yr MT/yr
PM10 Total
Fugi ive PM2.5
Exhaust PM2.5
PM2.5 Total
Bio- CO2 NBio- CO2
Unmitigated Construction Off-Site
ROG NOx CO SO2 Fugitive PM10
Exhaust PM10

0.002429 0.003187 0.003695 0.000550 0.001645
5.0 Energy Detail
SBUS MH
0.535364 0.058953 0.178683 0.128422 0.038588 0.006258 0.015164 0.027061
LHD2 MHD HHD OBUS UBUS MCY
H-S or C-C H-O or C-NW Primary Diverted Pass-by
LDA LDT1 LDT2 MDV LHD1
4.3 Trip Type Information
Miles Trip % Trip Purpose %
Land Use H-W or C-W H-S or C-C H-O or C-NW H-W or C-W
Total
MitigatedLand Use Weekday Saturday Sunday Annual VMT Annual VMT
4.0 Operational Detail - Mobile
4.1 Mitigation Measures Mobile
4.2 Trip Summary Information
Average Daily Trip Rate Unmitigated
0.0000 15.9808 15.9808 3.2000e-004
0.0000 15.98756.2600e-003
1.2100e-003
7.4700e-003
1.7000e-003
1.1200e-003
2.8100e-003
Total 0.0180 0.0743 0.1155 1.7000e-004
0.0000 4.4129 4.4129 2.1000e-004
0.0000 4.41723.5400e-003
1.1000e-004
3.6400e-003
9.5000e-004
1.0000e-004
1.0500e-003
Worker 6 8600e-003
6 9100e-003
0.0250 5 0000e-005
0.0000 11.5679 11.5679 1.1000e-004
0.0000 11.57032.7200e-003
1.1000e-003
3.8300e-003
7.5000e-004
1.0200e-003
1.7600e-003
Vendor 0.0111 0 0674 0.0905 1 2000e-004
0.0000 0.0000 0.0000 0.0000 0.0000 0.00000.0000 0.0000 0.0000 0.0000 0.0000 0.0000Hauling 0.0000 0 0000 0.0000 0.0000
Total CO2 CH4 N2O CO2e
Category tons/yr MT/yr
PM10 Total
Fugi ive PM2.5
Exhaust PM2.5
PM2.5 Total
Bio- CO2 NBio- CO2ROG NOx CO SO2 Fugitive PM10
Exhaust PM10

0.0000 0.0000 0.0000 0.0000 0.0000 0.00000.0000 0.0000 0.0000 0 0000Consumer Products
0.0000
Total CO2 CH4 N2O CO2e
SubCategory tons/yr MT/yr
PM10 Total
Fugitive PM2.5
Exhaust PM2.5
PM2.5 Total
Bio- CO2 NBio- CO2
6.2 Area by SubCategoryUnmitigated
ROG NOx CO SO2 Fugitive PM10
Exhaust PM10
0.0000 0.0000 0.0000 0.0000 0.0000 0.00000.0000 0.0000 0.0000 0 0000Unmitigated 0.0000
0.0000 0.0000 0.0000 0.0000 0.0000 0.00000.0000 0.0000 0.0000 0 0000
CO2e
Category tons/yr MT/yr
Mitigated 0.0000
PM2.5 Total
Bio- CO2 NBio- CO2 Total CO2 CH4 N2OSO2 Fugitive PM10
Exhaust PM10
PM10 Total
Fugitive PM2.5
Exhaust PM2.5
4.4 Fleet MixHistorical Energy Use: N
5.1 Mitigation Measures Energy
6.0 Area Detail
6.1 Mitigation Measures Area
ROG NOx CO
Hours/Day Days/Year Horse Power Load Factor Fuel Type
10.0 Vegetation
7.0 Water Detail
7.1 Mitigation Measures Water
8.0 Waste Detail
8.1 Mitigation Measures Waste
9.0 Operational Offroad
Equipment Type Number
0.0000 0.0000 0.0000 0.0000 0.0000 0.00000.0000 0.0000 0.0000 0.0000Total 0.0000
0.0000 0.0000 0.0000 0.0000 0.0000 0.00000.0000 0.0000 0.0000 0 0000Consumer Products
0.0000
0.0000 0.0000 0.0000 0.0000 0.0000 0.00000.0000 0.0000 0.0000 0 0000Architectural Coating
0.0000
Total CO2 CH4 N2O CO2e
SubCategory tons/yr MT/yr
PM10 Total
Fugitive PM2.5
Exhaust PM2.5
PM2.5 Total
Bio- CO2 NBio- CO2
Mitigated
ROG NOx CO SO2 Fugitive PM10
Exhaust PM10
0.0000 0.0000 0.0000 0.0000 0.0000 0.00000.0000 0.0000 0.0000 0.0000Total 0.0000
0.0000 0.0000 0.0000 0.0000 0.0000 0.00000.0000 0.0000 0.0000 0 0000Architectural Coating
0.0000

Total 11.6370 0.0000 0.0000 11.6370
Acres MT
Grassland 1 / 3.7 11.6370 0.0000 0.0000 11.6370
10.1 Vegetation Land ChangeVegetation Type
Initial/Final Total CO2 CH4 N2O CO2e
Category MT
Unmitigated 11.6370 0 0000 0.0000 11.6370
Total CO2 CH4 N2O CO2e

0.00000E+000 4.56387E+001 4.56387E+001 1.34500E-002 0.00000E+000 4.59211E+001
CO2eUnmitigated tons/yr Unmi igated mt/yr
Excavators 3 97700E-002 4.76790E-001 3.06970E-001 4.70000E-004 2.36200E-002 2.17300E-002
Exhaust PM2.5 Bio- CO2 NBio- CO2 Total CO2 CH4 N2OEquipment Type ROG NOx CO SO2 Exhaust PM10
0.00
Tractors/Loaders/Backhoes Diesel No Change 4 4 Level 3 0.00
Skid Steer Loaders Diesel No Change 4 4 Level 3
0.00
Scrapers Diesel No Change 2 2 Level 3 0.00
Rubber Tired Dozers Diesel No Change 2 2 Level 3
0.00
Other Material Handling Equipment
Diesel No Change 3 3 Level 3 0.00
Other General Industrial Equipment
Diesel No Change 2 2 Level 3
0.00
Off-Highway Trucks Diesel No Change 7 7 Level 3 0.00
Generator Sets Diesel No Change 2 2 Level 3
Oxidation Catalyst
Excavators Diesel No Change 1 1 Level 3 0.00
Equipment Type Fuel Type Tier Number Mitigated Total Number of Equipment DPF
0.00 0.00 0 00 0.00 0.00
OFFROAD Equipment Mitigation
0.00 0.00
Planting, Fencing, Signage, Irriga ion 0 00 0.00 0 00 0 00 0.00 0 00 0 00
0.82 0 82 0 00 0.00 0.00 0 00
0.00 0.00 0 00 0.00 0.00
Nourishment 0 00 0.00 0 00 0 00
CO2ePercent Reduction
Dune Construc ion 0 00 0.00 0 00 0 00 0.69 0.69 0 00
Exhaust PM2.5 Bio- CO2
NBio- CO2 Total CO2 CH4 N2OPhase ROG NOx CO SO2
Exhaust PM10
CalEEMod Version: CalEEMod.2013.2.1Page 1 of 1
Date: 9/30/2013 5:37 PM
Broad Beach - ConstructionLos Angeles-South Coast County, Mitigation Report
Construction Mitigation Summary
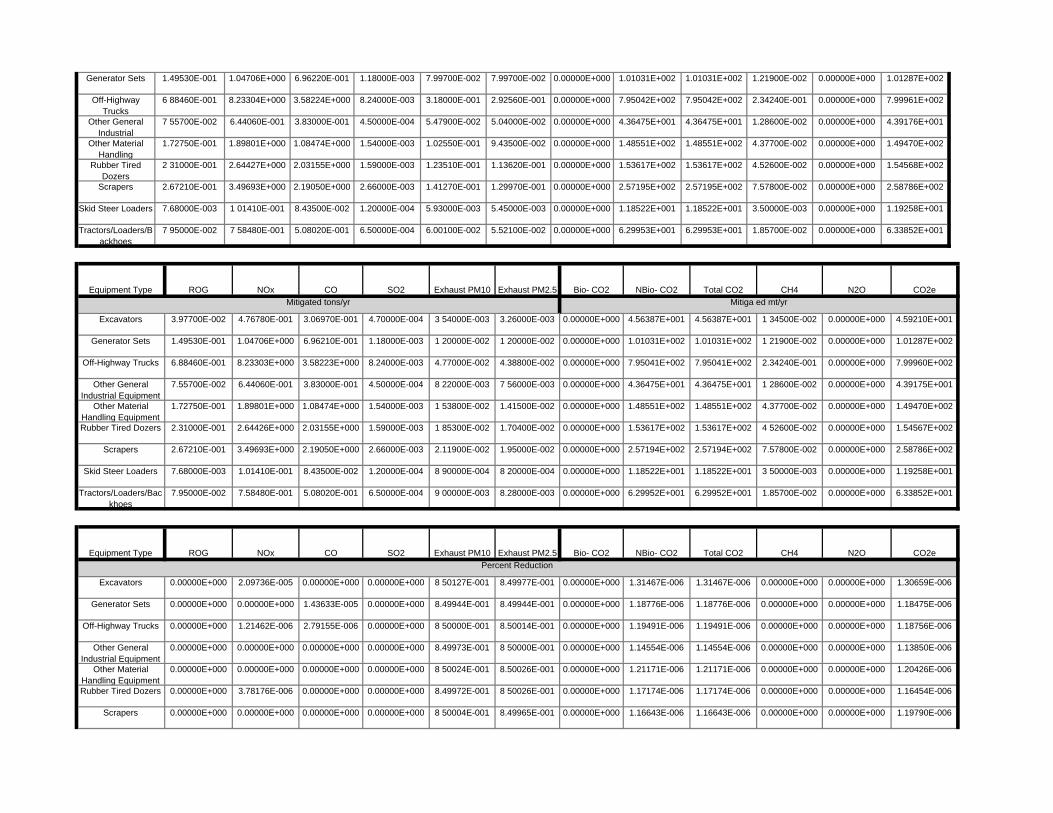
1.16643E-006 1.16643E-006 0.00000E+000 0.00000E+000 1.19790E-006
0.00000E+000 1.16454E-006
Scrapers 0.00000E+000 0.00000E+000 0.00000E+000 0.00000E+000 8 50004E-001 8.49965E-001 0.00000E+000
8.49972E-001 8 50026E-001 0.00000E+000 1.17174E-006 1.17174E-006 0.00000E+000
1.21171E-006 1.21171E-006 0.00000E+000 0.00000E+000 1.20426E-006
Rubber Tired Dozers 0.00000E+000 3.78176E-006 0.00000E+000 0.00000E+000
0.00000E+000 1.13850E-006
Other Material Handling Equipment
0.00000E+000 0.00000E+000 0.00000E+000 0.00000E+000 8 50024E-001 8.50026E-001 0.00000E+000
8.49973E-001 8 50000E-001 0.00000E+000 1.14554E-006 1.14554E-006 0.00000E+000
1.19491E-006 1.19491E-006 0.00000E+000 0.00000E+000 1.18756E-006
Other General Industrial Equipment
0.00000E+000 0.00000E+000 0.00000E+000 0.00000E+000
0.00000E+000 1.18475E-006
Off-Highway Trucks 0.00000E+000 1.21462E-006 2.79155E-006 0.00000E+000 8 50000E-001 8.50014E-001 0.00000E+000
8.49944E-001 8.49944E-001 0.00000E+000 1.18776E-006 1.18776E-006 0.00000E+000
1.31467E-006 1.31467E-006 0.00000E+000 0.00000E+000 1.30659E-006
Generator Sets 0.00000E+000 0.00000E+000 1.43633E-005 0.00000E+000
CO2ePercent Reduction
Excavators 0.00000E+000 2.09736E-005 0.00000E+000 0.00000E+000 8 50127E-001 8.49977E-001 0.00000E+000
Exhaust PM2.5 Bio- CO2 NBio- CO2 Total CO2 CH4 N2O
6.29952E+001 1.85700E-002 0.00000E+000 6.33852E+001
Equipment Type ROG NOx CO SO2 Exhaust PM10
1.19258E+001
Tractors/Loaders/Backhoes
7.95000E-002 7.58480E-001 5.08020E-001 6.50000E-004 9 00000E-003 8.28000E-003 0.00000E+000 6.29952E+001
8 20000E-004 0.00000E+000 1.18522E+001 1.18522E+001 3 50000E-003 0.00000E+000
2.57194E+002 7.57800E-002 0.00000E+000 2.58786E+002
Skid Steer Loaders 7.68000E-003 1.01410E-001 8.43500E-002 1.20000E-004 8 90000E-004
1.54567E+002
Scrapers 2.67210E-001 3.49693E+000 2.19050E+000 2.66000E-003 2.11900E-002 1.95000E-002 0.00000E+000 2.57194E+002
1.70400E-002 0.00000E+000 1.53617E+002 1.53617E+002 4 52600E-002 0.00000E+000
1.48551E+002 4.37700E-002 0.00000E+000 1.49470E+002
Rubber Tired Dozers 2.31000E-001 2.64426E+000 2.03155E+000 1.59000E-003 1 85300E-002
4.39175E+001
Other Material Handling Equipment
1.72750E-001 1.89801E+000 1.08474E+000 1.54000E-003 1 53800E-002 1.41500E-002 0.00000E+000 1.48551E+002
7 56000E-003 0.00000E+000 4.36475E+001 4.36475E+001 1 28600E-002 0.00000E+000
7.95041E+002 2.34240E-001 0.00000E+000 7.99960E+002
Other General Industrial Equipment
7.55700E-002 6.44060E-001 3.83000E-001 4.50000E-004 8 22000E-003
1.01287E+002
Off-Highway Trucks 6.88460E-001 8.23303E+000 3.58223E+000 8.24000E-003 4.77000E-002 4.38800E-002 0.00000E+000 7.95041E+002
1 20000E-002 0.00000E+000 1.01031E+002 1.01031E+002 1 21900E-002 0.00000E+000Generator Sets 1.49530E-001 1.04706E+000 6.96210E-001 1.18000E-003 1 20000E-002
0.00000E+000 4.56387E+001 4.56387E+001 1 34500E-002 0.00000E+000 4.59210E+001
CO2eMitigated tons/yr Mitiga ed mt/yr
Excavators 3.97700E-002 4.76780E-001 3.06970E-001 4.70000E-004 3 54000E-003 3.26000E-003
Exhaust PM2.5 Bio- CO2 NBio- CO2 Total CO2 CH4 N2O
6.29953E+001 1.85700E-002 0.00000E+000 6.33852E+001
Equipment Type ROG NOx CO SO2 Exhaust PM10
1.19258E+001
Tractors/Loaders/Backhoes
7 95000E-002 7 58480E-001 5.08020E-001 6.50000E-004 6.00100E-002 5.52100E-002 0.00000E+000 6.29953E+001
5.45000E-003 0.00000E+000 1.18522E+001 1.18522E+001 3.50000E-003 0.00000E+000
2.57195E+002 7.57800E-002 0.00000E+000 2.58786E+002
Skid Steer Loaders 7.68000E-003 1 01410E-001 8.43500E-002 1.20000E-004 5.93000E-003
1.54568E+002
Scrapers 2.67210E-001 3.49693E+000 2.19050E+000 2.66000E-003 1.41270E-001 1.29970E-001 0.00000E+000 2.57195E+002
1.13620E-001 0.00000E+000 1.53617E+002 1.53617E+002 4.52600E-002 0.00000E+000
1.48551E+002 4.37700E-002 0.00000E+000 1.49470E+002
Rubber Tired Dozers
2 31000E-001 2.64427E+000 2.03155E+000 1.59000E-003 1.23510E-001
4.39176E+001
Other Material Handling
1.72750E-001 1.89801E+000 1.08474E+000 1.54000E-003 1.02550E-001 9.43500E-002 0.00000E+000 1.48551E+002
5.04000E-002 0.00000E+000 4.36475E+001 4.36475E+001 1.28600E-002 0.00000E+000
7.95042E+002 2.34240E-001 0.00000E+000 7.99961E+002
Other General Industrial
7 55700E-002 6.44060E-001 3.83000E-001 4.50000E-004 5.47900E-002
1.01287E+002
Off-Highway Trucks
6 88460E-001 8.23304E+000 3.58224E+000 8.24000E-003 3.18000E-001 2.92560E-001 0.00000E+000 7.95042E+002
7.99700E-002 0.00000E+000 1.01031E+002 1.01031E+002 1.21900E-002 0.00000E+000Generator Sets 1.49530E-001 1.04706E+000 6.96220E-001 1.18000E-003 7.99700E-002

0.000.00 0.00 0.00 0.00 0.00 0.00
0.00 0.00 0.00 0.00
Hearth 0.00 0.00 0.00 0.00 0 00
0.00
Electricity 0.00 0.00 0.00 0.00 0 00 0.00 0 00 0.00
0.00 0.00 0.00 0.00 0.00 0.00Consumer Products 0.00 0.00 0.00 0.00 0 00
0.00 0.00 0.00 0.00 0.00 0.00
N2O CO2ePercent Reduction
Architectural Coating 0.00 0.00 0.00 0.00 0 00 0.00
Exhaust PM10
Exhaust PM2.5 Bio- CO2 NBio- CO2
Total CO2 CH4
Operational Percent Reduction Summary
Category ROG NOx CO SO2
0.00 0 00
Plan ing, Fencing, Signage, Irrigation Roads 0.01 0.00 0.01 0.00 0.00 0.00
Plan ing, Fencing, Signage, Irrigation Fugi ive Dust 0.00 0.00 0.00 0.00
0.69 0.69
Nourishment Roads 1.04 0.27 1.04 0.27 0.00 0.00
Nourishment Fugi ive Dust 2.59 1.23 0.80 0.38
0.69
Dune Construction Roads 0.11 0.03 0.11 0.03 0.00 0.00
PM2.5 PM10 PM2.5Dune Construction Fugi ive Dust 0.01 0.00 0.00 0.00 0.69
Unmitigated Mi igated Percent Reduction
Phase Source PM10 PM2.5 PM10
No Clean Paved Road % PM Reduction 0.00
No Unpaved Road Mitigation Moisture Content %
0.00 Vehicle Speed (mph)
15.00
Yes Water Exposed Area PM10 Reduction 69.00 PM2.5 Reduction
69.00 Frequency (per day)
0.00
No Replace Ground Cover of Area Disturbed
PM10 Reduction 0.00 PM2.5 Reduction
0.00
Mitigation InputYes/No Mitigation Measure Mitigation Input Mitigation Input
No Soil Stabilizer for unpaved Roads
PM10 Reduction 0.00 PM2.5 Reduction
1.11119E-006 1.11119E-006 0.00000E+000 0.00000E+000 1.26212E-006
Fugitive Dust Mitigation
0.00000E+000 8.38520E-007
Tractors/Loaders/Backhoes
0.00000E+000 0.00000E+000 0.00000E+000 0.00000E+000 8 50025E-001 8.50027E-001 0.00000E+000
8.49916E-001 8.49541E-001 0.00000E+000 8.43724E-007 8.43724E-007 0.00000E+000Skid Steer Loaders 0.00000E+000 0.00000E+000 0.00000E+000 0.00000E+000
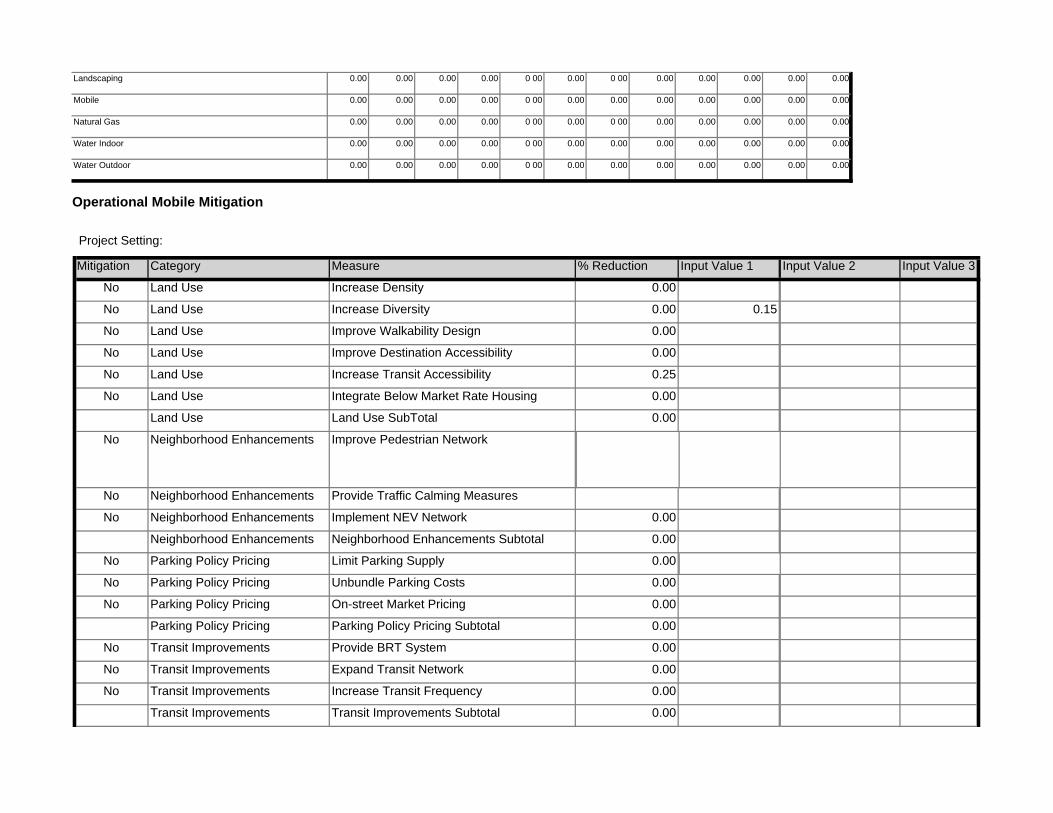
Transit Improvements Transit Improvements Subtotal 0.00
No Transit Improvements Increase Transit Frequency 0.00
No Transit Improvements Expand Transit Network 0.00
No Transit Improvements Provide BRT System 0.00
Parking Policy Pricing Parking Policy Pricing Subtotal 0.00
No Parking Policy Pricing On-street Market Pricing 0.00
No Parking Policy Pricing Unbundle Parking Costs 0.00
No Parking Policy Pricing Limit Parking Supply 0.00
Neighborhood Enhancements Neighborhood Enhancements Subtotal 0.00
No Neighborhood Enhancements Implement NEV Network 0.00
No Neighborhood Enhancements Provide Traffic Calming Measures
No Neighborhood Enhancements Improve Pedestrian Network
Land Use Land Use SubTotal 0.00
No Land Use Integrate Below Market Rate Housing 0.00
No Land Use Increase Transit Accessibility 0.25
No Land Use Improve Destination Accessibility 0.00
No Land Use Improve Walkability Design 0.00
No Land Use Increase Diversity 0.00 0.15
Input Value 3
No Land Use Increase Density 0.00
Mitigation c e
Category Measure % Reduction Input Value 1 Input Value 2
0.00 0.00 0.00 0.00
Operational Mobile Mitigation
Project Setting:
0.00
Water Outdoor 0.00 0.00 0.00 0.00 0 00 0.00 0.00 0.00
0.00 0.00 0.00 0.00 0.00 0.00
0.00 0.00 0.00 0.00
Water Indoor 0.00 0.00 0.00 0.00 0 00
0.00
Natural Gas 0.00 0.00 0.00 0.00 0 00 0.00 0 00 0.00
0.00 0.00 0.00 0.00 0.00 0.00
0.00 0.00 0.00 0.00
Mobile 0.00 0.00 0.00 0.00 0 00
Landscaping 0.00 0.00 0.00 0.00 0 00 0.00 0 00 0.00

No Exceed Title 24
No % Electric Chainsaw
Energy Mitigation Measures
Measure Implemented Mitigation Measure Input Value 1 Input Value 2
No % Electric Lawnmower
No % Electric Leafblower
No Use Low VOC Paint (Non-residential Interior) 250.00
No Use Low VOC Paint (Non-residential Exterior) 250.00
No Use Low VOC Paint (Residential Interior) 50.00
No Use Low VOC Paint (Residential Exterior) 100.00
No No Hearth
No Use Low VOC Cleaning Supplies
Area Mitigation
Measure Implemented Mitigation Measure Input Value
No Only Natural Gas Hearth
Total VMT Reduction 0.00
No School Trip Implement School Bus Program 0.00
Commute Commute Subtotal 0.00
No Commute Provide Ride Sharing Program
No Commute Employee Vanpool/Shuttle 0.00 2.00
No Commute Market Commute Trip Reduction Option 0.00
No Commute Encourage Telecommuting and Alternative Work Schedules
0.00
No Commute Workplace Parking Charge
No Commute Implement Employee Parking "Cash Out"
No Commute Transit Subsidy
No Commute Implement Trip Reduction Program
Land Use and Site Enhancement Subtotal 0.00

Institute Recycling and Composting ServicesPercent Reduction in Waste Disposed
No Water Efficient Landscape
Solid Waste Mitigation
Mitigation Measures Input Value
No Turf Reduction
No Use Water Efficient Irrigation Systems 6.10
No Install low-flow Toilet 20.00
No Install low-flow Shower 20.00
No Install low-flow bathroom faucet 32.00
No Install low-flow Kitchen faucet 18.00
No Use Reclaimed Water
No Use Grey Water
Water Mitigation Measures
Measure Implemented Mitigation Measure Input Value 1 Input Value 2
No Apply Water Conservation on Strategy
Fan 50.00
Refrigerator 15.00
ClothWasher 30.00
DishWasher 15.00
No On-site Renewable
Appliance Type Land Use Subtype % Improvement
No Install High Efficiency Lighting

Land Use Change -
Construction Off-road Equipment Mitigation - project specific information
Off-road Equipment - project specific information
Off-road Equipment - nourishment equipment list
Off-road Equipment - project specific information
Off-road Equipment - project specific information
Trips and VMT - 12 workers (pg 42 of PD)14-ton hauling trucks40-45 miles to quarry (pg 14 of PD)Grading -
N2O Intensity (lb/MWhr)
0
1.3 User Entered Comments & Non-Default Data
Project Characteristics -
Land Use -
Construction Phase - project specific information
Utility Company
CO2 Intensity (lb/MWhr)
0 CH4 Intensity (lb/MWhr)
0
Precipitation Freq (Days) 33
Climate Zone 8 Operational Year 2013
1.1 Land Usage
1.2 Other Project Characteristics
Urbanization Urban Wind Speed (m/s) 2.2
CalEEMod Version: CalEEMod.2013.2.1 Page 1 of 1 Date: 9/30/2013 5:13 PM
Broad Beach - ConstructionLos Angeles-South Coast County, Summer
1.0 Project Characteristics

tblGrading MaterialImported 0.00 100,000.00
tblOffRoadEquipment OffRoadEquipmentUnitAmount 1.00 2.00
tblConstructionPhase PhaseStartDate 4/16/2014 4/15/2014
tblGrading MaterialImported 0.00 500,000.00
tblConstructionPhase PhaseEndDate 5/16/2014 5/15/2014
tblConstructionPhase PhaseStartDate 3/16/2014 3/15/2014
tblConstructionPhase NumDays 0.00 23.00
tblConstructionPhase PhaseEndDate 3/14/2014 3/15/2014
tblConstructionPhase NumDays 0.00 130.00
tblConstructionPhase NumDays 0.00 22.00
tblConstEquipMitigation NumberOfEquipmentMitigated 0.00 4.00
tblConstEquipMitigation NumberOfEquipmentMitigated 0.00 4.00
tblConstEquipMitigation NumberOfEquipmentMitigated 0.00 2.00
tblConstEquipMitigation NumberOfEquipmentMitigated 0.00 2.00
tblConstEquipMitigation NumberOfEquipmentMitigated 0.00 2.00
tblConstEquipMitigation NumberOfEquipmentMitigated 0.00 3.00
tblConstEquipMitigation NumberOfEquipmentMitigated 0.00 2.00
tblConstEquipMitigation NumberOfEquipmentMitigated 0.00 7.00
tblConstEquipMitigation DPF No Change Level 3
tblConstEquipMitigation NumberOfEquipmentMitigated 0.00 1.00
tblConstEquipMitigation DPF No Change Level 3
tblConstEquipMitigation DPF No Change Level 3
tblConstEquipMitigation DPF No Change Level 3
tblConstEquipMitigation DPF No Change Level 3
tblConstEquipMitigation DPF No Change Level 3
tblConstEquipMitigation DPF No Change Level 3
tblConstEquipMitigation DPF No Change Level 3
tblConstEquipMitigation DPF No Change Level 3
Table Name Column Name Default Value New Value
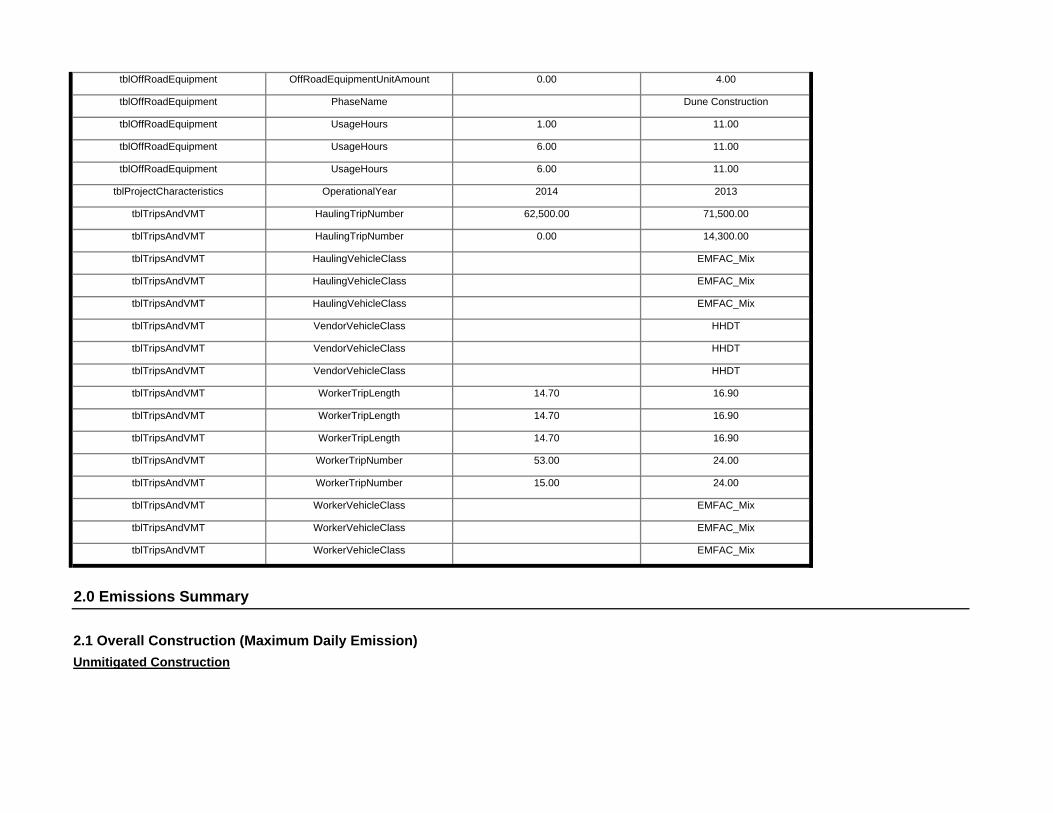
2.0 Emissions Summary
2.1 Overall Construction (Maximum Daily Emission)Unmitigated Construction
tblTripsAndVMT WorkerVehicleClass EMFAC_Mix
tblTripsAndVMT WorkerVehicleClass EMFAC_Mix
tblTripsAndVMT WorkerTripNumber 15.00 24.00
tblTripsAndVMT WorkerVehicleClass EMFAC_Mix
tblTripsAndVMT WorkerTripLength 14.70 16.90
tblTripsAndVMT WorkerTripNumber 53.00 24.00
tblTripsAndVMT WorkerTripLength 14.70 16.90
tblTripsAndVMT WorkerTripLength 14.70 16.90
tblTripsAndVMT VendorVehicleClass HHDT
tblTripsAndVMT VendorVehicleClass HHDT
tblTripsAndVMT HaulingVehicleClass EMFAC_Mix
tblTripsAndVMT VendorVehicleClass HHDT
tblTripsAndVMT HaulingVehicleClass EMFAC_Mix
tblTripsAndVMT HaulingVehicleClass EMFAC_Mix
tblTripsAndVMT HaulingTripNumber 62,500.00 71,500.00
tblTripsAndVMT HaulingTripNumber 0.00 14,300.00
tblOffRoadEquipment UsageHours 6.00 11.00
tblProjectCharacteristics OperationalYear 2014 2013
tblOffRoadEquipment UsageHours 1.00 11.00
tblOffRoadEquipment UsageHours 6.00 11.00
tblOffRoadEquipment OffRoadEquipmentUnitAmount 0.00 4.00
tblOffRoadEquipment PhaseName Dune Construction
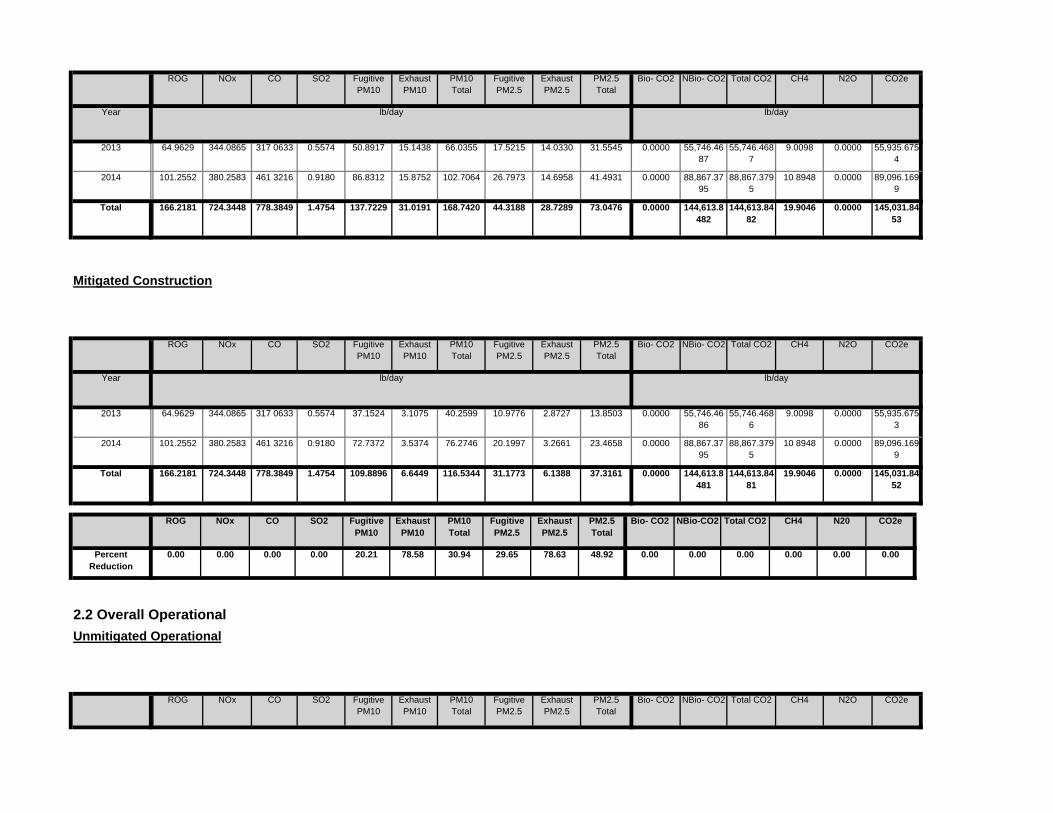
Total CO2 CH4 N2O CO2ePM10 Total
Fugitive PM2.5
Exhaust PM2.5
PM2.5 Total
Bio- CO2 NBio- CO2
2.2 Overall OperationalUnmitigated Operational
ROG NOx CO SO2 Fugitive PM10
Exhaust PM10
0.00 0.00 0.00 0.00 0.00 0.0020.21 78.58 30.94 29.65 78.63 48.92
NBio-CO2 Total CO2 CH4 N20 CO2e
Percent Reduction
0.00 0.00 0.00 0.00
Exhaust PM10
PM10 Total
Fugitive PM2.5
Exhaust PM2.5
PM2.5 Total
Bio- CO2ROG NOx CO SO2 Fugitive PM10
0.0000 144,613.8481
144,613.8481
19.9046 0.0000 145,031.8452
109.8896 6.6449 116.5344 31.1773 6.1388 37.3161Total 166.2181 724.3448 778.3849 1.4754
0.0000 88,867.3795
88,867.3795
10 8948 0.0000 89,096.1699
72.7372 3.5374 76.2746 20.1997 3.2661 23.46582014 101.2552 380.2583 461 3216 0.9180
0.0000 55,746.4686
55,746.4686
9.0098 0.0000 55,935.6753
37.1524 3.1075 40.2599 10.9776 2.8727 13.85032013 64.9629 344.0865 317 0633 0.5574
Total CO2 CH4 N2O CO2e
Year lb/day lb/day
PM10 Total
Fugitive PM2.5
Exhaust PM2.5
PM2.5 Total
Bio- CO2 NBio- CO2
Mitigated Construction
ROG NOx CO SO2 Fugitive PM10
Exhaust PM10
0.0000 144,613.8482
144,613.8482
19.9046 0.0000 145,031.8453
137.7229 31.0191 168.7420 44.3188 28.7289 73.0476Total 166.2181 724.3448 778.3849 1.4754
0.0000 88,867.3795
88,867.3795
10 8948 0.0000 89,096.1699
86.8312 15.8752 102.7064 26.7973 14.6958 41.49312014 101.2552 380.2583 461 3216 0.9180
0.0000 55,746.4687
55,746.4687
9.0098 0.0000 55,935.6754
50.8917 15.1438 66.0355 17.5215 14.0330 31.55452013 64.9629 344.0865 317 0633 0.5574
NBio- CO2 Total CO2 CH4 N2O CO2e
Year lb/day lb/day
Exhaust PM10
PM10 Total
Fugitive PM2.5
Exhaust PM2.5
PM2.5 Total
Bio- CO2ROG NOx CO SO2 Fugitive PM10

130
2 Dune Construction Grading 3/15/2014 4/15/2014 5 22
End Date Num Days Week
Num Days Phase Description
1 Nourishment Grading 9/15/2013 3/15/2014 5
3.0 Construction Detail
Construction Phase
Phase Number
Phase Name Phase Type Start Date
0.00 0.00 0.00 0.00 0.00 0.000.00 0.00 0.00 0.00 0.00 0.00
NBio-CO2 Total CO2 CH4 N20 CO2e
Percent Reduction
0.00 0.00 0.00 0.00
Exhaust PM10
PM10 Total
Fugitive PM2.5
Exhaust PM2.5
PM2.5 Total
Bio- CO2ROG NOx CO SO2 Fugitive PM10
0.0000 0.00000.0000 0.0000 0.0000 0.0000Total 0.0000
0.0000 0.00000.0000 0.0000 0.0000 0.0000Area 0.0000
Total CO2 CH4 N2O CO2e
Category lb/day lb/day
PM10 Total
Fugitive PM2.5
Exhaust PM2.5
PM2.5 Total
Bio- CO2 NBio- CO2
Mitigated Operational
ROG NOx CO SO2 Fugitive PM10
Exhaust PM10
0.0000 0.00000.0000 0.0000 0.0000 0.0000Total 0.0000
0.0000 0.00000.0000 0.0000 0.0000 0.0000Area 0.0000
Category lb/day lb/day
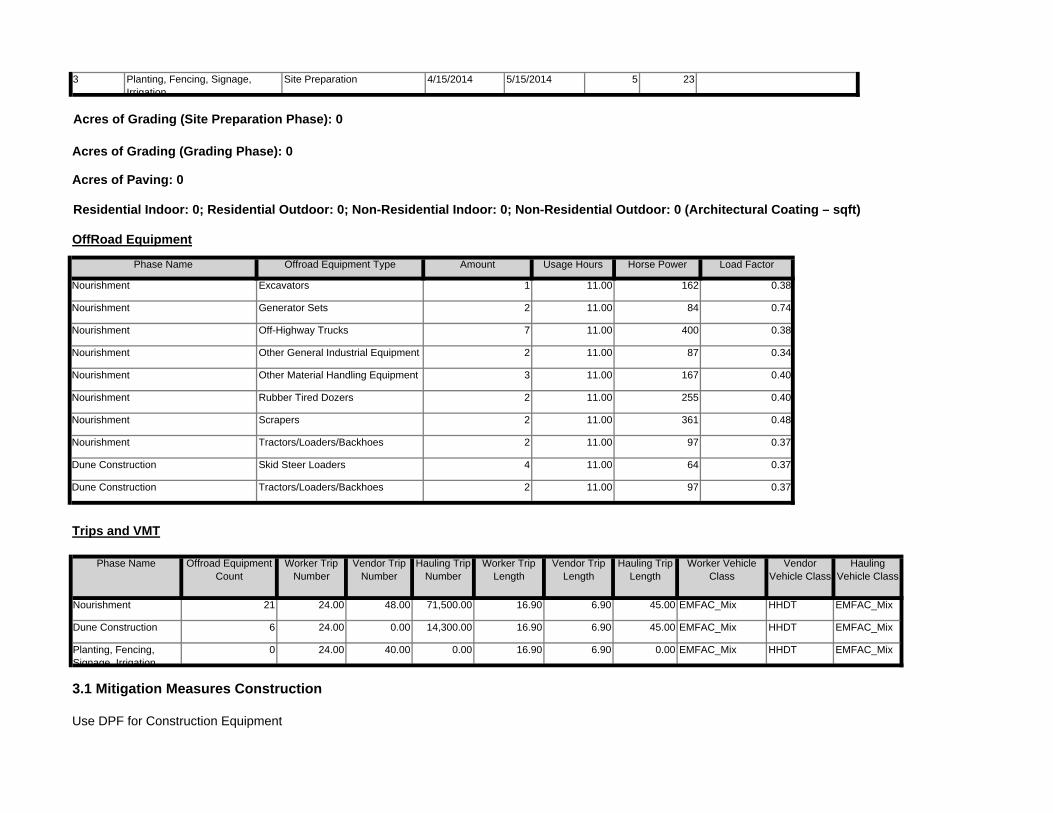
Use DPF for Construction Equipment
6.90 0.00 EMFAC_Mix HHDT EMFAC_Mix
3.1 Mitigation Measures Construction
Planting, Fencing, Signage Irrigation
0 24.00 40.00 0.00 16.90
16.90 6.90 45.00 EMFAC_Mix HHDT EMFAC_Mix
6.90 45.00 EMFAC_Mix HHDT EMFAC_Mix
Dune Construction 6 24.00 0.00 14,300.00
Nourishment 21 24.00 48.00 71,500.00 16.90
Worker Trip Length
Vendor Trip Length
Hauling Trip Length
Worker Vehicle Class
Vendor Vehicle Class
Hauling Vehicle Class
Trips and VMT
Phase Name Offroad Equipment Count
Worker Trip Number
Vendor Trip Number
Hauling Trip Number
Dune Construction Tractors/Loaders/Backhoes 2 11.00 97 0.37
Dune Construction Skid Steer Loaders 4 11.00 64 0.37
Nourishment Tractors/Loaders/Backhoes 2 11.00 97 0.37
Nourishment Scrapers 2 11.00 361 0.48
Nourishment Rubber Tired Dozers 2 11.00 255 0.40
Nourishment Other Material Handling Equipment 3 11.00 167 0.40
Nourishment Other General Industrial Equipment 2 11.00 87 0.34
Nourishment Off-Highway Trucks 7 11.00 400 0.38
Nourishment Generator Sets 2 11.00 84 0.74
Load Factor
Nourishment Excavators 1 11.00 162 0.38
OffRoad Equipment
Phase Name Offroad Equipment Type Amount Usage Hours Horse Power
23
Acres of Grading (Site Preparation Phase): 0
Acres of Grading (Grading Phase): 0
Acres of Paving: 0
Residential Indoor: 0; Residential Outdoor: 0; Non-Residential Indoor: 0; Non-Residential Outdoor: 0 (Architectural Coating – sqft)
3 Planting, Fencing, Signage, Irrigation
Site Preparation 4/15/2014 5/15/2014 5

28,582.8844
28,582.8844
1.3130 28,610.4564
30.9796 0.9835 31.9631 8.0376 0.9032 8.9408Total 38.3041 43.0989 149.9529 0.3006
444 3729 444.3729 0.0216 444 82690.3134 0 0129 0 3263 0.0838 0.0118 0.0956Worker 0.6240 0.6012 2.4516 4.6900e-003
1,339.1624
1,339.1624 0.0170 1,339.51860.2889 0 2005 0.4894 0.0792 0.1843 0.2635Vendor 1.4642 7 5760 9.3463 0.0130
26,799.3491
26,799.3491
1.2744 26,826.1109
30.3773 0.7701 31.1474 7.8746 0.7071 8.5817
CO2e
Category lb/day lb/day
Hauling 36.2160 34.9217 138.1550 0.2829
PM2.5 Total
Bio- CO2 NBio- CO2 Total CO2 CH4 N2OSO2 Fugitive PM10
Exhaust PM10
PM10 Total
Fugitive PM2.5
Exhaust PM2.5
7.6969 27,325.2190
Unmitigated Construction Off-Site
ROG NOx CO
9.4839 13.1298 22.6137 27,163.5842
27,163.5842
27,325.2190
Total 26.6588 300.9876 167.1104 0.2568 19.9121 14.1604 34.0724
13.1298 27,163.5842
27,163.5842
7.69690.2568 14.1604 14.1604 13.1298
0.0000 0.0000
Off-Road 26.6588 300.9876 167.1104
0 0000 19.9121 9.4839 0.0000 9.4839
Category lb/day lb/day
Fugitive Dust 19.9121
Bio- CO2 NBio- CO2 Total CO2 CH4 N2O CO2eFugitive PM10
Exhaust PM10
PM10 Total
Fugitive PM2.5
Exhaust PM2.5
PM2.5 Total
ROG NOx CO SO2
Water Exposed Area
Reduce Vehicle Speed on Unpaved Roads
Clean Paved Roads
3.2 Nourishment - 2013Unmitigated Construction On-Site

3.2 Nourishment - 2014Unmitigated Construction On-Site
28,582.8844
28,582.8844
1.3130 28,610.4564
30.9796 0.9835 31.9631 8.0376 0.9032 8.9408Total 38.3041 43.0989 149.9529 0.3006
444 3729 444.3729 0.0216 444 82690.3134 0 0129 0 3263 0.0838 0.0118 0.0956Worker 0.6240 0.6012 2.4516 4.6900e-003
1,339.1624
1,339.1624 0.0170 1,339.51860.2889 0 2005 0.4894 0.0792 0.1843 0.2635Vendor 1.4642 7 5760 9.3463 0.0130
26,799.3491
26,799.3491
1.2744 26,826.1109
30.3773 0.7701 31.1474 7.8746 0.7071 8.5817Hauling 36.2160 34.9217 138.1550 0.2829
Total CO2 CH4 N2O CO2e
Category lb/day lb/day
PM10 Total
Fugitive PM2.5
Exhaust PM2.5
PM2.5 Total
Bio- CO2 NBio- CO2
Mitigated Construction Off-Site
ROG NOx CO SO2 Fugitive PM10
Exhaust PM10
0.0000 27,163.5842
27,163.5842
7.6969 27,325.2190
6.1727 2.1241 8.2968 2.9400 1.9695 4.9095Total 26.6588 300.9876 167.1104 0.2568
0.0000 27,163.5842
27,163.5842
7.6969 27,325.2190
2.1241 2.1241 1.9695 1.9695Off-Road 26.6588 300.9876 167.1104 0.2568
0.0000 0.00006.1727 0 0000 6.1727 2.9400 0.0000 2.9400Fugitive Dust
Total CO2 CH4 N2O CO2e
Category lb/day lb/day
PM10 Total
Fugitive PM2.5
Exhaust PM2.5
PM2.5 Total
Bio- CO2 NBio- CO2
Mitigated Construction On-Site
ROG NOx CO SO2 Fugitive PM10
Exhaust PM10

0.0000 0.00006.1727 0 0000 6.1727 2.9400 0.0000 2.9400Fugitive Dust
Total CO2 CH4 N2O CO2e
Category lb/day lb/day
PM10 Total
Fugitive PM2.5
Exhaust PM2.5
PM2.5 Total
Bio- CO2 NBio- CO2
Mitigated Construction On-Site
ROG NOx CO SO2 Fugitive PM10
Exhaust PM10
28,137.9411
28,137.9411
1.1987 28,163.1132
43.4937 0.6863 44.1800 11.1098 0.6304 11.7402Total 34.7458 39.5035 135.5641 0.3015
437 2315 437.2315 0.0198 437.64660.3135 9.4000e-003
0 3229 0.0839 8.6300e-003
0.0925Worker 0.5700 0 5559 2.2233 4.7100e-003
1,334.2058
1,334.2058 0.0130 1,334.47810.2889 0.1148 0.4037 0.0792 0.1055 0.1847Vendor 1.1038 6.7052 8.2472 0.0131
26,366.5038
26,366.5038
1.1659 26,390.9885
42.8912 0 5622 43.4534 10.9468 0.5162 11.4630Hauling 33.0720 32.2425 125.0935 0.2837
Total CO2 CH4 N2O CO2e
Category lb/day lb/day
PM10 Total
Fugitive PM2.5
Exhaust PM2.5
PM2.5 Total
Bio- CO2 NBio- CO2
Unmitigated Construction Off-Site
ROG NOx CO SO2 Fugitive PM10
Exhaust PM10
27,033.6518
27,033.6518
7.6784 27,194.8981
19.9121 13.2133 33.1253 9.4839 12.2491 21.7330Total 25.1424 283.1608 161.3661 0.2568
27,033.6518
27,033.6518
7.6784 27,194.8981
13.2133 13.2133 12.2491 12.2491Off-Road 25.1424 283.1608 161.3661 0.2568
0.0000 0.000019.9121 0 0000 19.9121 9.4839 0.0000 9.4839Fugitive Dust
Total CO2 CH4 N2O CO2e
Category lb/day lb/day
PM10 Total
Fugitive PM2.5
Exhaust PM2.5
PM2.5 Total
Bio- CO2 NBio- CO2ROG NOx CO SO2 Fugitive PM10
Exhaust PM10

2,098.1415
2,098.1415 0.6200 2,111.16200.5140 1.3019 1.8159 0.0778 1.1977 1.2755Total 1.7118 18.9334 14.3304 0.0198
2,098.1415
2,098.1415 0.6200 2,111.16201 3019 1 3019 1.1977 1.1977Off-Road 1.7118 18.9334 14.3304 0.0198
0.0000 0.00000.5140 0 0000 0 5140 0.0778 0.0000 0.0778Fugitive Dust
Total CO2 CH4 N2O CO2e
Category lb/day lb/day
PM10 Total
Fugitive PM2.5
Exhaust PM2.5
PM2.5 Total
Bio- CO2 NBio- CO2
3.3 Dune Construction - 2014Unmitigated Construction On-Site
ROG NOx CO SO2 Fugitive PM10
Exhaust PM10
28,137.9411
28,137.9411
1.1987 28,163.1132
43.4937 0.6863 44.1800 11.1098 0.6304 11.7402Total 34.7458 39.5035 135.5641 0.3015
437 2315 437.2315 0.0198 437.64660.3135 9.4000e-003
0 3229 0.0839 8.6300e-003
0.0925Worker 0.5700 0 5559 2.2233 4.7100e-003
1,334.2058
1,334.2058 0.0130 1,334.47810.2889 0.1148 0.4037 0.0792 0.1055 0.1847Vendor 1.1038 6.7052 8.2472 0.0131
26,366.5038
26,366.5038
1.1659 26,390.9885
42.8912 0 5622 43.4534 10.9468 0.5162 11.4630Hauling 33.0720 32.2425 125.0935 0.2837
Total CO2 CH4 N2O CO2e
Category lb/day lb/day
PM10 Total
Fugitive PM2.5
Exhaust PM2.5
PM2.5 Total
Bio- CO2 NBio- CO2
Mitigated Construction Off-Site
ROG NOx CO SO2 Fugitive PM10
Exhaust PM10
0.0000 27,033.6518
27,033.6518
7.6784 27,194.8981
6.1727 1.9820 8.1547 2.9400 1.8374 4.7774Total 25.1424 283.1608 161.3661 0.2568
0.0000 27,033.6518
27,033.6518
7.6784 27,194.8981
1 9820 1 9820 1.8374 1.8374Off-Road 25.1424 283.1608 161.3661 0.2568

Total CO2 CH4 N2O CO2ePM10 Total
Fugitive PM2.5
Exhaust PM2.5
PM2.5 Total
Bio- CO2 NBio- CO2
Mitigated Construction Off-Site
ROG NOx CO SO2 Fugitive PM10
Exhaust PM10
0.0000 2,098.1415
2,098.1415 0.6200 2,111.16200.1594 0.1953 0.3546 0.0241 0.1797 0.2038Total 1.7118 18.9334 14.3304 0.0198
0.0000 2,098.1415
2,098.1415 0.6200 2,111.16200.1953 0.1953 0.1797 0.1797Off-Road 1.7118 18.9334 14.3304 0.0198
0.0000 0.00000.1594 0 0000 0.1594 0.0241 0.0000 0.0241Fugitive Dust
Total CO2 CH4 N2O CO2e
Category lb/day lb/day
PM10 Total
Fugitive PM2.5
Exhaust PM2.5
PM2.5 Total
Bio- CO2 NBio- CO2
Mitigated Construction On-Site
ROG NOx CO SO2 Fugitive PM10
Exhaust PM10
31,597.6451
31,597.6451
1.3977 31,626.9967
22.9114 0.6738 23.5852 6.1258 0.6187 6.7445Total 39.6551 38.6606 150.0611 0.3400
437 2315 437.2315 0.0198 437.64660.3135 9.4000e-003
0 3229 0.0839 8.6300e-003
0.0925Worker 0.5700 0 5559 2.2233 4.7100e-003
0.0000 0.0000 0.0000 0.00000.0000 0 0000 0 0000 0.0000 0.0000 0.0000Vendor 0.0000 0 0000 0.0000 0.0000
31,160.4135
31,160.4135
1.3779 31,189.3501
22.5979 0.6644 23.2622 6.0419 0.6101 6.6520Hauling 39.0851 38.1048 147.8378 0.3353
Total CO2 CH4 N2O CO2e
Category lb/day lb/day
PM10 Total
Fugitive PM2.5
Exhaust PM2.5
PM2.5 Total
Bio- CO2 NBio- CO2
Unmitigated Construction Off-Site
ROG NOx CO SO2 Fugitive PM10
Exhaust PM10

1,111.8382
1,111.8382 0.0108 1,112.06510.2408 0 0957 0 3364 0.0660 0.0879 0.1539Vendor 0.9199 5 5876 6.8727 0.0109
0.0000 0.0000 0.0000 0.00000.0000 0 0000 0 0000 0.0000 0.0000 0.0000Hauling 0.0000 0 0000 0.0000 0.0000
Total CO2 CH4 N2O CO2e
Category lb/day lb/day
PM10 Total
Fugitive PM2.5
Exhaust PM2.5
PM2.5 Total
Bio- CO2 NBio- CO2
Unmitigated Construction Off-Site
ROG NOx CO SO2 Fugitive PM10
Exhaust PM10
0.0000 0.00000.0000 0.0000 0.0000 0.0000 0.0000 0.0000Total
0.0000 0.00000.0000 0 0000 0 0000 0.0000 0.0000 0.0000Fugitive Dust
Total CO2 CH4 N2O CO2e
Category lb/day lb/day
PM10 Total
Fugitive PM2.5
Exhaust PM2.5
PM2.5 Total
Bio- CO2 NBio- CO2
3.4 Planting, Fencing, Signage, Irrigation - 2014Unmitigated Construction On-Site
ROG NOx CO SO2 Fugitive PM10
Exhaust PM10
31,597.6451
31,597.6451
1.3977 31,626.9967
22.9114 0.6738 23.5852 6.1258 0.6187 6.7445Total 39.6551 38.6606 150.0611 0.3400
437 2315 437.2315 0.0198 437.64660.3135 9.4000e-003
0 3229 0.0839 8.6300e-003
0.0925Worker 0.5700 0 5559 2.2233 4.7100e-003
0.0000 0.0000 0.0000 0.00000.0000 0 0000 0 0000 0.0000 0.0000 0.0000Vendor 0.0000 0 0000 0.0000 0.0000
31,160.4135
31,160.4135
1.3779 31,189.3501
22.5979 0.6644 23.2622 6.0419 0.6101 6.6520Hauling 39.0851 38.1048 147.8378 0.3353
Category lb/day lb/day
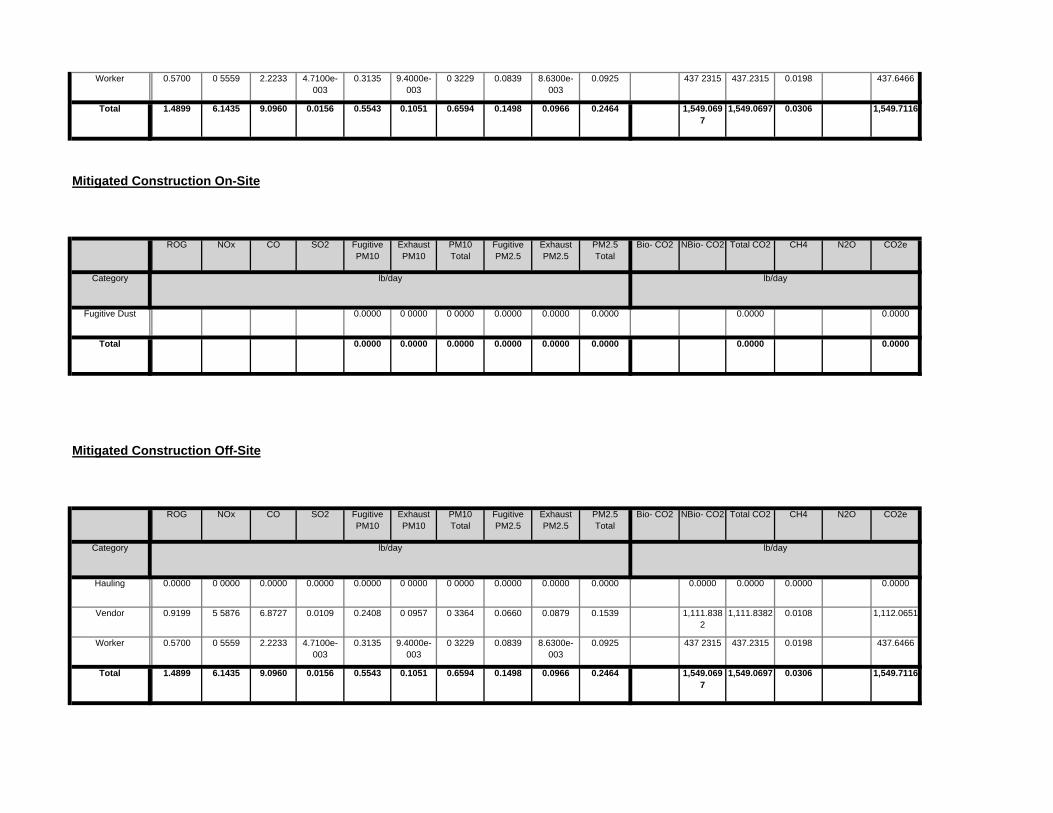
1,549.0697
1,549.0697 0.0306 1,549.71160.5543 0.1051 0.6594 0.1498 0.0966 0.2464Total 1.4899 6.1435 9.0960 0.0156
437 2315 437.2315 0.0198 437.64660.3135 9.4000e-003
0 3229 0.0839 8.6300e-003
0.0925Worker 0.5700 0 5559 2.2233 4.7100e-003
1,111.8382
1,111.8382 0.0108 1,112.06510.2408 0 0957 0 3364 0.0660 0.0879 0.1539Vendor 0.9199 5 5876 6.8727 0.0109
0.0000 0.0000 0.0000 0.00000.0000 0 0000 0 0000 0.0000 0.0000 0.0000Hauling 0.0000 0 0000 0.0000 0.0000
Total CO2 CH4 N2O CO2e
Category lb/day lb/day
PM10 Total
Fugitive PM2.5
Exhaust PM2.5
PM2.5 Total
Bio- CO2 NBio- CO2
Mitigated Construction Off-Site
ROG NOx CO SO2 Fugitive PM10
Exhaust PM10
0.0000 0.00000.0000 0.0000 0.0000 0.0000 0.0000 0.0000Total
0.0000 0.00000.0000 0 0000 0 0000 0.0000 0.0000 0.0000Fugitive Dust
Total CO2 CH4 N2O CO2e
Category lb/day lb/day
PM10 Total
Fugitive PM2.5
Exhaust PM2.5
PM2.5 Total
Bio- CO2 NBio- CO2
Mitigated Construction On-Site
ROG NOx CO SO2 Fugitive PM10
Exhaust PM10
1,549.0697
1,549.0697 0.0306 1,549.71160.5543 0.1051 0.6594 0.1498 0.0966 0.2464Total 1.4899 6.1435 9.0960 0.0156
437 2315 437.2315 0.0198 437.64660.3135 9.4000e-003
0 3229 0.0839 8.6300e-003
0.0925Worker 0.5700 0 5559 2.2233 4.7100e-003

4.4 Fleet MixHistorical Energy Use: N
5.1 Mitigation Measures Energy
6.0 Area Detail
6.1 Mitigation Measures Area
0.002429 0.003187 0.003695 0.000550 0.001645
5.0 Energy Detail
SBUS MH
0.535364 0.058953 0.178683 0.128422 0.038588 0.006258 0.015164 0.027061
LHD2 MHD HHD OBUS UBUS MCY
H-S or C-C H-O or C-NW Pr mary Diverted Pass-by
LDA LDT1 LDT2 MDV LHD1
4.3 Trip Type Information
Miles Trip % Trip Purpose %
Land Use H-W or C-W H-S or C-C H-O or C-NW H-W or C-W
Total
MitigatedLand Use Weekday Saturday Sunday Annual VMT Annual VMT
4.0 Operational Detail - Mobile
4.1 Mitigation Measures Mobile
4.2 Trip Summary Information
Average Daily Trip Rate Unmitigated

0.0000 0.00000.0000 0.0000 0.0000 0.0000Consumer Products
0.0000
0.0000 0.00000.0000 0.0000 0.0000 0.0000Architectural Coating
0.0000
Total CO2 CH4 N2O CO2e
SubCategory lb/day lb/day
PM10 Total
Fugitive PM2.5
Exhaust PM2.5
PM2.5 Total
Bio- CO2 NBio- CO2
Mitigated
ROG NOx CO SO2 Fugitive PM10
Exhaust PM10
0.0000 0.00000.0000 0.0000 0.0000 0.0000Total 0.0000
0.0000 0.00000.0000 0.0000 0.0000 0.0000Consumer Products
0.0000
0.0000 0.00000.0000 0.0000 0.0000 0.0000Architectural Coating
0.0000
Total CO2 CH4 N2O CO2e
SubCategory lb/day lb/day
PM10 Total
Fugitive PM2.5
Exhaust PM2.5
PM2.5 Total
Bio- CO2 NBio- CO2
6.2 Area by SubCategoryUnmitigated
ROG NOx CO SO2 Fugitive PM10
Exhaust PM10
0.0000 0.00000.0000 0.0000 0.0000 0.0000Unmitigated 0.0000
0.0000 0.00000.0000 0.0000 0.0000 0.0000
CO2e
Category lb/day lb/day
Mitigated 0.0000
PM2.5 Total
Bio- CO2 NBio- CO2 Total CO2 CH4 N2OSO2 Fugitive PM10
Exhaust PM10
PM10 Total
Fugitive PM2.5
Exhaust PM2.5
ROG NOx CO
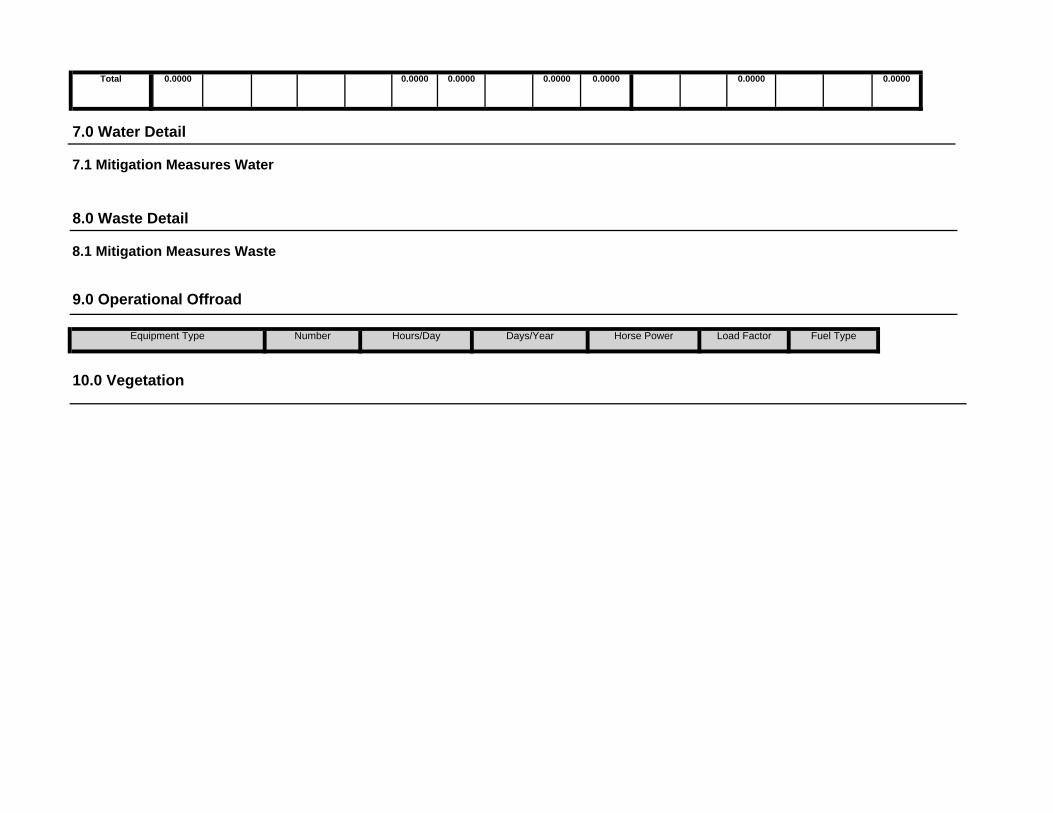
Hours/Day Days/Year Horse Power Load Factor Fuel Type
10.0 Vegetation
7.0 Water Detail
7.1 Mitigation Measures Water
8.0 Waste Detail
8.1 Mitigation Measures Waste
9.0 Operational Offroad
Equipment Type Number
0.0000 0.00000.0000 0.0000 0.0000 0.0000Total 0.0000
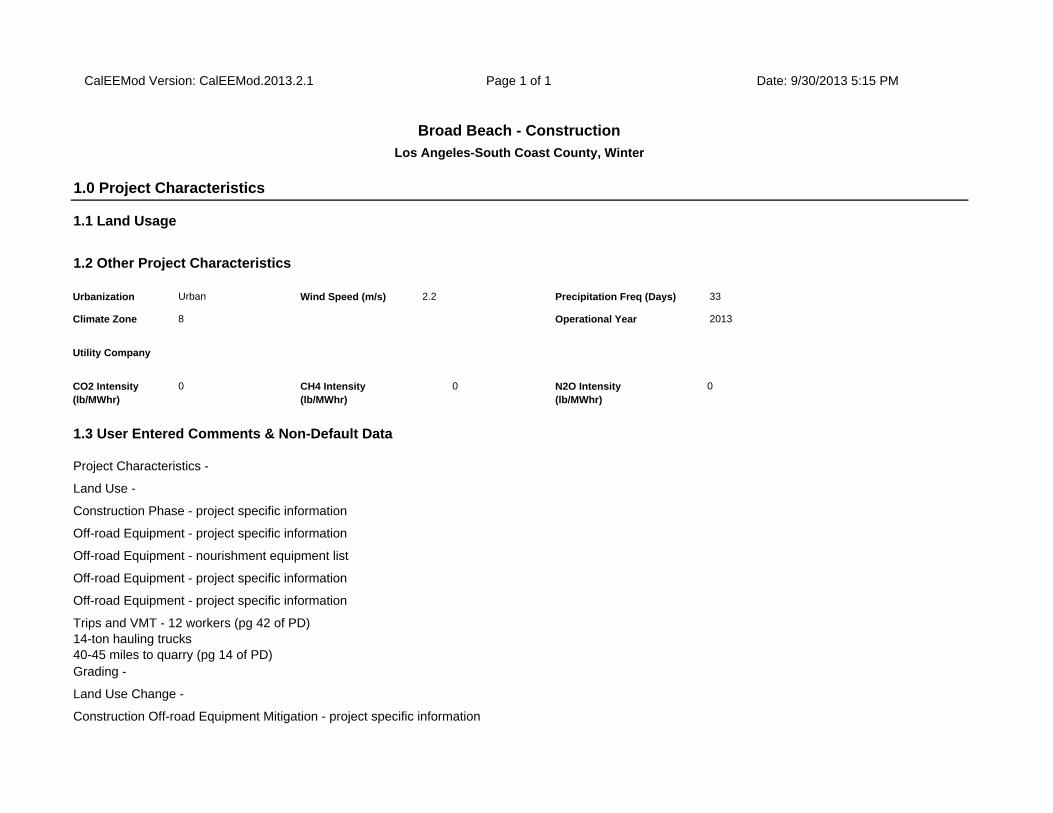
Land Use Change -
Construction Off-road Equipment Mitigation - project specific information
Off-road Equipment - project specific information
Off-road Equipment - nourishment equipment list
Off-road Equipment - project specific information
Off-road Equipment - project specific information
Trips and VMT - 12 workers (pg 42 of PD)14-ton hauling trucks40-45 miles to quarry (pg 14 of PD)Grading -
N2O Intensity (lb/MWhr)
0
1.3 User Entered Comments & Non-Default Data
Project Characteristics -
Land Use -
Construction Phase - project specific information
Utility Company
CO2 Intensity (lb/MWhr)
0 CH4 Intensity (lb/MWhr)
0
Precipitation Freq (Days) 33
Climate Zone 8 Operational Year 2013
1.1 Land Usage
1.2 Other Project Characteristics
Urbanization Urban Wind Speed (m/s) 2.2
CalEEMod Version: CalEEMod.2013.2.1 Page 1 of 1 Date: 9/30/2013 5:15 PM
Broad Beach - ConstructionLos Angeles-South Coast County, Winter
1.0 Project Characteristics
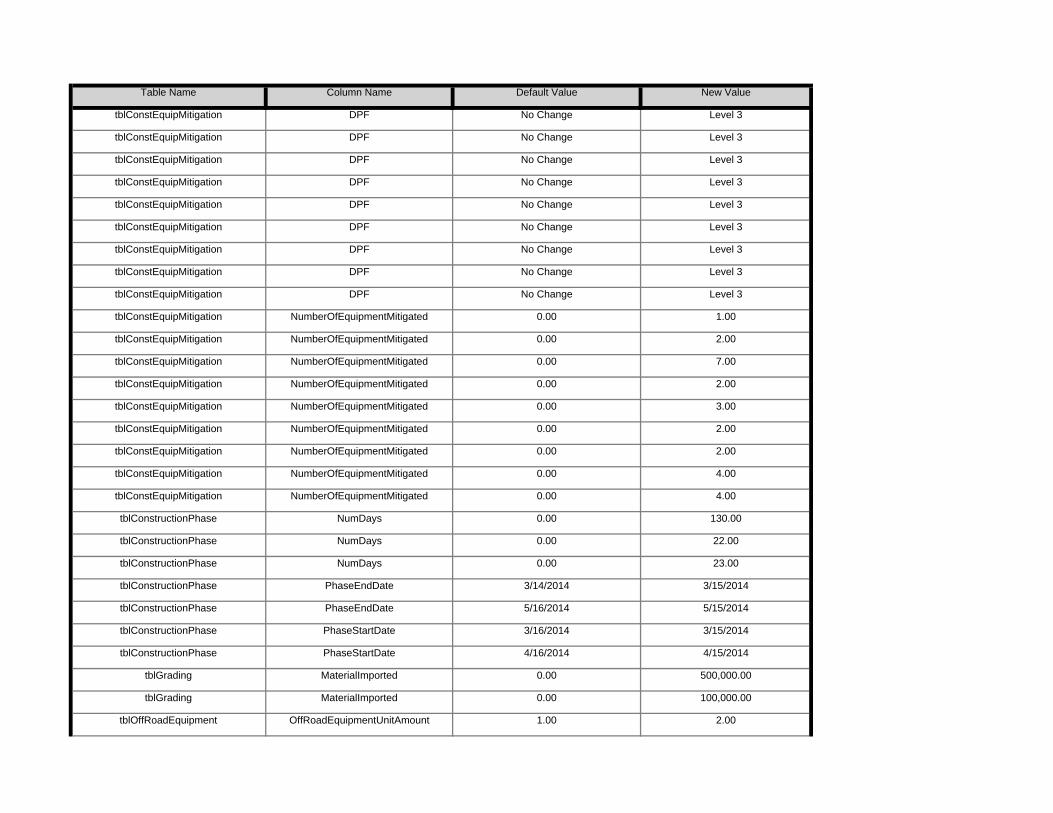
tblGrading MaterialImported 0.00 100,000.00
tblOffRoadEquipment OffRoadEquipmentUnitAmount 1.00 2.00
tblConstructionPhase PhaseStartDate 4/16/2014 4/15/2014
tblGrading MaterialImported 0.00 500,000.00
tblConstructionPhase PhaseEndDate 5/16/2014 5/15/2014
tblConstructionPhase PhaseStartDate 3/16/2014 3/15/2014
tblConstructionPhase NumDays 0.00 23.00
tblConstructionPhase PhaseEndDate 3/14/2014 3/15/2014
tblConstructionPhase NumDays 0.00 130.00
tblConstructionPhase NumDays 0.00 22.00
tblConstEquipMitigation NumberOfEquipmentMitigated 0.00 4.00
tblConstEquipMitigation NumberOfEquipmentMitigated 0.00 4.00
tblConstEquipMitigation NumberOfEquipmentMitigated 0.00 2.00
tblConstEquipMitigation NumberOfEquipmentMitigated 0.00 2.00
tblConstEquipMitigation NumberOfEquipmentMitigated 0.00 2.00
tblConstEquipMitigation NumberOfEquipmentMitigated 0.00 3.00
tblConstEquipMitigation NumberOfEquipmentMitigated 0.00 2.00
tblConstEquipMitigation NumberOfEquipmentMitigated 0.00 7.00
tblConstEquipMitigation DPF No Change Level 3
tblConstEquipMitigation NumberOfEquipmentMitigated 0.00 1.00
tblConstEquipMitigation DPF No Change Level 3
tblConstEquipMitigation DPF No Change Level 3
tblConstEquipMitigation DPF No Change Level 3
tblConstEquipMitigation DPF No Change Level 3
tblConstEquipMitigation DPF No Change Level 3
tblConstEquipMitigation DPF No Change Level 3
tblConstEquipMitigation DPF No Change Level 3
tblConstEquipMitigation DPF No Change Level 3
Table Name Column Name Default Value New Value

2.0 Emissions Summary
2.1 Overall Construction (Maximum Daily Emission)Unmitigated Construction
tblTripsAndVMT WorkerVehicleClass EMFAC_Mix
tblTripsAndVMT WorkerVehicleClass EMFAC_Mix
tblTripsAndVMT WorkerTripNumber 15.00 24.00
tblTripsAndVMT WorkerVehicleClass EMFAC_Mix
tblTripsAndVMT WorkerTripLength 14.70 16.90
tblTripsAndVMT WorkerTripNumber 53.00 24.00
tblTripsAndVMT WorkerTripLength 14.70 16.90
tblTripsAndVMT WorkerTripLength 14.70 16.90
tblTripsAndVMT VendorVehicleClass HHDT
tblTripsAndVMT VendorVehicleClass HHDT
tblTripsAndVMT HaulingVehicleClass EMFAC_Mix
tblTripsAndVMT VendorVehicleClass HHDT
tblTripsAndVMT HaulingVehicleClass EMFAC_Mix
tblTripsAndVMT HaulingVehicleClass EMFAC_Mix
tblTripsAndVMT HaulingTripNumber 62,500.00 71,500.00
tblTripsAndVMT HaulingTripNumber 0.00 14,300.00
tblOffRoadEquipment UsageHours 6.00 11.00
tblProjectCharacteristics OperationalYear 2014 2013
tblOffRoadEquipment UsageHours 1.00 11.00
tblOffRoadEquipment UsageHours 6.00 11.00
tblOffRoadEquipment OffRoadEquipmentUnitAmount 0.00 4.00
tblOffRoadEquipment PhaseName Dune Construction

Total CO2 CH4 N2O CO2ePM10 Total
Fugitive PM2.5
Exhaust PM2.5
PM2.5 Total
Bio- CO2 NBio- CO2
2.2 Overall OperationalUnmitigated Operational
ROG NOx CO SO2 Fugitive PM10
Exhaust PM10
0.00 0.00 0.00 0.00 0.00 0.0020.21 78.56 30.94 29.65 78.62 48.91
NBio-CO2 Total CO2 CH4 N20 CO2e
Percent Reduction
0.00 0.00 0.00 0.00
Exhaust PM10
PM10 Total
Fugitive PM2.5
Exhaust PM2.5
PM2.5 Total
Bio- CO2ROG NOx CO SO2 Fugitive PM10
0.0000 140,737.7894
140,737.7894
19.9059 0.0000 141,155.8130
109.8896 6.6505 116.5401 31.1773 6.1440 37.3212Total 186.1753 731.2669 756.6189 1.4328
0.0000 86,236.1700
86,236.1700
10 8955 0.0000 86,464.9749
72.7372 3.5402 76.2773 20.1997 3.2686 23.46842014 114.5329 384.7855 446 2010 0.8889
0.0000 54,501.6194
54,501.6194
9.0104 0.0000 54,690.8381
37.1524 3.1104 40.2627 10.9776 2.8753 13.85292013 71.6424 346.4814 310.4178 0.5439
Total CO2 CH4 N2O CO2e
Year lb/day lb/day
PM10 Total
Fugitive PM2.5
Exhaust PM2.5
PM2.5 Total
Bio- CO2 NBio- CO2
Mitigated Construction
ROG NOx CO SO2 Fugitive PM10
Exhaust PM10
0.0000 140,737.7894
140,737.7894
19.9059 0.0000 141,155.8131
137.7229 31.0247 168.7476 44.3188 28.7340 73.0528Total 186.1753 731.2669 756.6189 1.4328
0.0000 86,236.1701
86,236.1701
10 8955 0.0000 86,464.9749
86.8312 15.8780 102.7092 26.7973 14.6984 41.49572014 114.5329 384.7855 446 2010 0.8889
0.0000 54,501.6194
54,501.6194
9.0104 0.0000 54,690.8381
50.8917 15.1467 66.0384 17.5215 14.0356 31.55712013 71.6424 346.4814 310.4178 0.5439
NBio- CO2 Total CO2 CH4 N2O CO2e
Year lb/day lb/day
Exhaust PM10
PM10 Total
Fugitive PM2.5
Exhaust PM2.5
PM2.5 Total
Bio- CO2ROG NOx CO SO2 Fugitive PM10
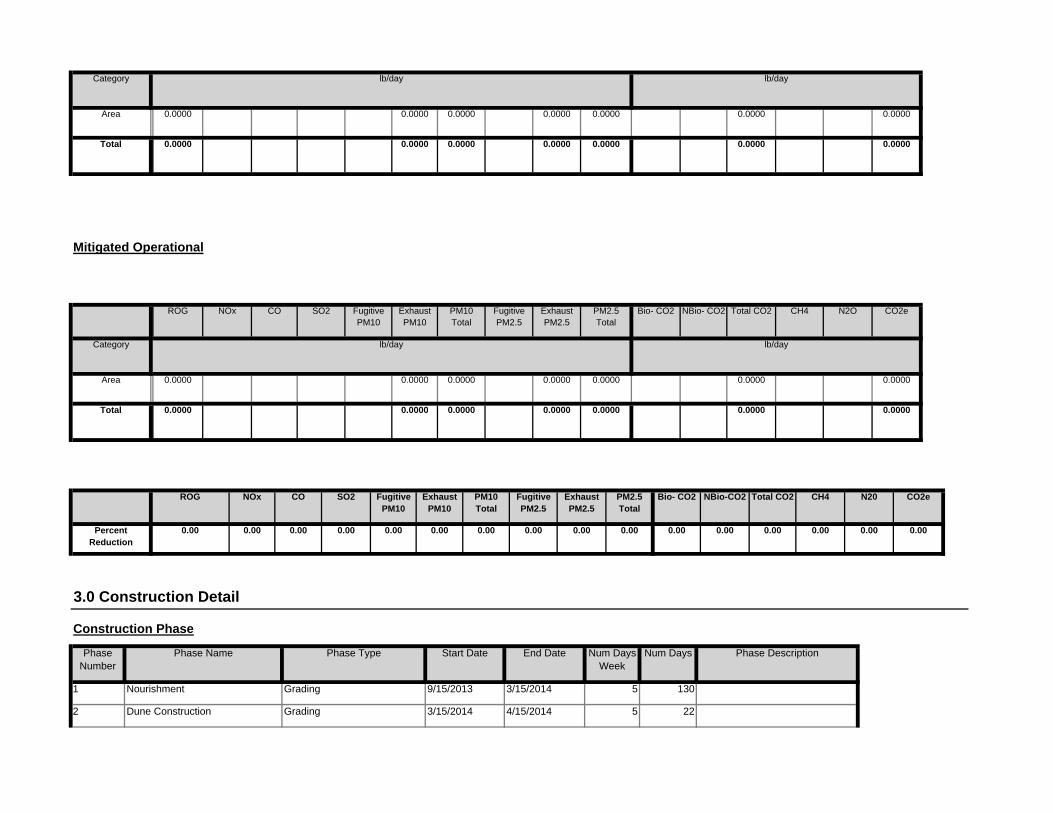
130
2 Dune Construction Grading 3/15/2014 4/15/2014 5 22
End Date Num Days Week
Num Days Phase Description
1 Nourishment Grading 9/15/2013 3/15/2014 5
3.0 Construction Detail
Construction Phase
Phase Number
Phase Name Phase Type Start Date
0.00 0.00 0.00 0.00 0.00 0.000.00 0.00 0.00 0.00 0.00 0.00
NBio-CO2 Total CO2 CH4 N20 CO2e
Percent Reduction
0.00 0.00 0.00 0.00
Exhaust PM10
PM10 Total
Fugitive PM2.5
Exhaust PM2.5
PM2.5 Total
Bio- CO2ROG NOx CO SO2 Fugitive PM10
0.0000 0.00000.0000 0.0000 0.0000 0.0000Total 0.0000
0.0000 0.00000.0000 0.0000 0.0000 0.0000Area 0.0000
Total CO2 CH4 N2O CO2e
Category lb/day lb/day
PM10 Total
Fugitive PM2.5
Exhaust PM2.5
PM2.5 Total
Bio- CO2 NBio- CO2
Mitigated Operational
ROG NOx CO SO2 Fugitive PM10
Exhaust PM10
0.0000 0.00000.0000 0.0000 0.0000 0.0000Total 0.0000
0.0000 0.00000.0000 0.0000 0.0000 0.0000Area 0.0000
Category lb/day lb/day

Use DPF for Construction Equipment
6.90 0.00 EMFAC_Mix HHDT EMFAC_Mix
3.1 Mitigation Measures Construction
Planting, Fencing, Signage Irrigation
0 24.00 40.00 0.00 16.90
16.90 6.90 45.00 EMFAC_Mix HHDT EMFAC_Mix
6.90 45.00 EMFAC_Mix HHDT EMFAC_Mix
Dune Construction 6 24.00 0.00 14,300.00
Nourishment 21 24.00 48.00 71,500.00 16.90
Worker Trip Length
Vendor Trip Length
Hauling Trip Length
Worker Vehicle Class
Vendor Vehicle Class
Hauling Vehicle Class
Trips and VMT
Phase Name Offroad Equipment Count
Worker Trip Number
Vendor Trip Number
Hauling Trip Number
Dune Construction Tractors/Loaders/Backhoes 2 11.00 97 0.37
Dune Construction Skid Steer Loaders 4 11.00 64 0.37
Nourishment Tractors/Loaders/Backhoes 2 11.00 97 0.37
Nourishment Scrapers 2 11.00 361 0.48
Nourishment Rubber Tired Dozers 2 11.00 255 0.40
Nourishment Other Material Handling Equipment 3 11.00 167 0.40
Nourishment Other General Industrial Equipment 2 11.00 87 0.34
Nourishment Off-Highway Trucks 7 11.00 400 0.38
Nourishment Generator Sets 2 11.00 84 0.74
Load Factor
Nourishment Excavators 1 11.00 162 0.38
OffRoad Equipment
Phase Name Offroad Equipment Type Amount Usage Hours Horse Power
23
Acres of Grading (Site Preparation Phase): 0
Acres of Grading (Grading Phase): 0
Acres of Paving: 0
Residential Indoor: 0; Residential Outdoor: 0; Non-Residential Indoor: 0; Non-Residential Outdoor: 0 (Architectural Coating – sqft)
3 Planting, Fencing, Signage, Irrigation
Site Preparation 4/15/2014 5/15/2014 5

27,338.0352
27,338.0352
1.3135 27,365.6191
30.9796 0.9863 31.9660 8.0376 0.9059 8.9434Total 44.9836 45.4938 143.3074 0.2872
424 2469 424.2469 0.0216 424.70100.3134 0 0129 0 3263 0.0838 0.0118 0.0957Worker 0.7305 0.6367 2.3675 4.4800e-003
1,330.5167
1,330.5167 0.0174 1,330.88130.2889 0 2022 0.4911 0.0792 0.1860 0.2651Vendor 1.6111 7.7993 10.8671 0.0130
25,583.2716
25,583.2716
1.2745 25,610.0368
30.3773 0.7712 31.1485 7.8746 0.7081 8.5827
CO2e
Category lb/day lb/day
Hauling 42.6420 37.0578 130.0728 0.2697
PM2.5 Total
Bio- CO2 NBio- CO2 Total CO2 CH4 N2OSO2 Fugitive PM10
Exhaust PM10
PM10 Total
Fugitive PM2.5
Exhaust PM2.5
7.6969 27,325.2190
Unmitigated Construction Off-Site
ROG NOx CO
9.4839 13.1298 22.6137 27,163.5842
27,163.5842
27,325.2190
Total 26.6588 300.9876 167.1104 0.2568 19.9121 14.1604 34.0724
13.1298 27,163.5842
27,163.5842
7.69690.2568 14.1604 14.1604 13.1298
0.0000 0.0000
Off-Road 26.6588 300.9876 167.1104
0 0000 19.9121 9.4839 0.0000 9.4839
Category lb/day lb/day
Fugitive Dust 19.9121
Bio- CO2 NBio- CO2 Total CO2 CH4 N2O CO2eFugitive PM10
Exhaust PM10
PM10 Total
Fugitive PM2.5
Exhaust PM2.5
PM2.5 Total
ROG NOx CO SO2
Water Exposed Area
Reduce Vehicle Speed on Unpaved Roads
Clean Paved Roads
3.2 Nourishment - 2013Unmitigated Construction On-Site
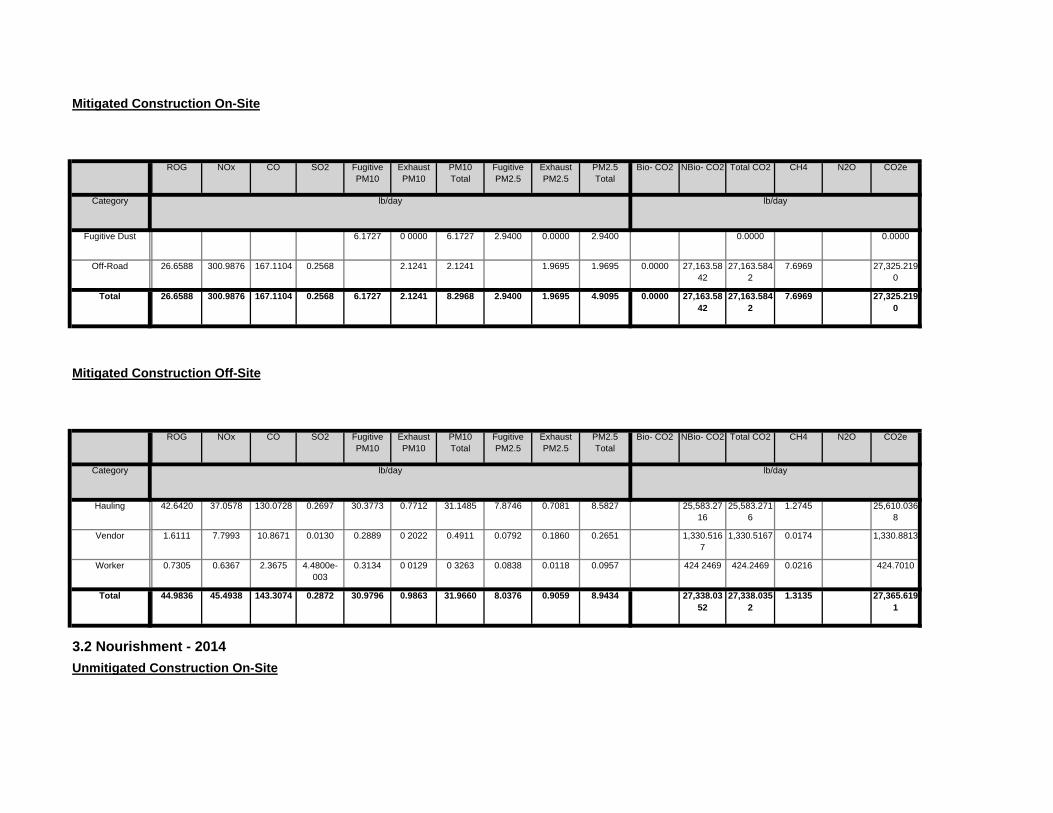
3.2 Nourishment - 2014Unmitigated Construction On-Site
27,338.0352
27,338.0352
1.3135 27,365.6191
30.9796 0.9863 31.9660 8.0376 0.9059 8.9434Total 44.9836 45.4938 143.3074 0.2872
424 2469 424.2469 0.0216 424.70100.3134 0 0129 0 3263 0.0838 0.0118 0.0957Worker 0.7305 0.6367 2.3675 4.4800e-003
1,330.5167
1,330.5167 0.0174 1,330.88130.2889 0 2022 0.4911 0.0792 0.1860 0.2651Vendor 1.6111 7.7993 10.8671 0.0130
25,583.2716
25,583.2716
1.2745 25,610.0368
30.3773 0.7712 31.1485 7.8746 0.7081 8.5827Hauling 42.6420 37.0578 130.0728 0.2697
Total CO2 CH4 N2O CO2e
Category lb/day lb/day
PM10 Total
Fugitive PM2.5
Exhaust PM2.5
PM2.5 Total
Bio- CO2 NBio- CO2
Mitigated Construction Off-Site
ROG NOx CO SO2 Fugitive PM10
Exhaust PM10
0.0000 27,163.5842
27,163.5842
7.6969 27,325.2190
6.1727 2.1241 8.2968 2.9400 1.9695 4.9095Total 26.6588 300.9876 167.1104 0.2568
0.0000 27,163.5842
27,163.5842
7.6969 27,325.2190
2.1241 2.1241 1.9695 1.9695Off-Road 26.6588 300.9876 167.1104 0.2568
0.0000 0.00006.1727 0 0000 6.1727 2.9400 0.0000 2.9400Fugitive Dust
Total CO2 CH4 N2O CO2e
Category lb/day lb/day
PM10 Total
Fugitive PM2.5
Exhaust PM2.5
PM2.5 Total
Bio- CO2 NBio- CO2
Mitigated Construction On-Site
ROG NOx CO SO2 Fugitive PM10
Exhaust PM10
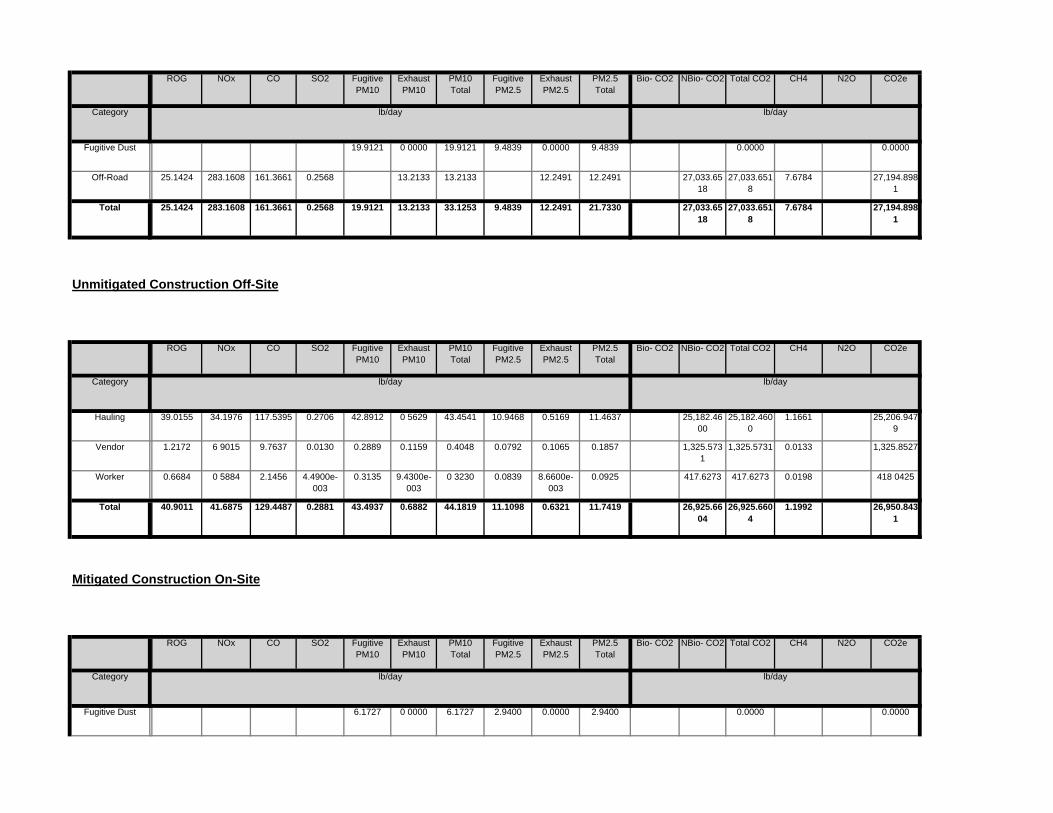
0.0000 0.00006.1727 0 0000 6.1727 2.9400 0.0000 2.9400Fugitive Dust
Total CO2 CH4 N2O CO2e
Category lb/day lb/day
PM10 Total
Fugitive PM2.5
Exhaust PM2.5
PM2.5 Total
Bio- CO2 NBio- CO2
Mitigated Construction On-Site
ROG NOx CO SO2 Fugitive PM10
Exhaust PM10
26,925.6604
26,925.6604
1.1992 26,950.8431
43.4937 0.6882 44.1819 11.1098 0.6321 11.7419Total 40.9011 41.6875 129.4487 0.2881
417.6273 417.6273 0.0198 418 04250.3135 9.4300e-003
0 3230 0.0839 8.6600e-003
0.0925Worker 0.6684 0 5884 2.1456 4.4900e-003
1,325.5731
1,325.5731 0.0133 1,325.85270.2889 0.1159 0.4048 0.0792 0.1065 0.1857Vendor 1.2172 6 9015 9.7637 0.0130
25,182.4600
25,182.4600
1.1661 25,206.9479
42.8912 0 5629 43.4541 10.9468 0.5169 11.4637Hauling 39.0155 34.1976 117.5395 0.2706
Total CO2 CH4 N2O CO2e
Category lb/day lb/day
PM10 Total
Fugitive PM2.5
Exhaust PM2.5
PM2.5 Total
Bio- CO2 NBio- CO2
Unmitigated Construction Off-Site
ROG NOx CO SO2 Fugitive PM10
Exhaust PM10
27,033.6518
27,033.6518
7.6784 27,194.8981
19.9121 13.2133 33.1253 9.4839 12.2491 21.7330Total 25.1424 283.1608 161.3661 0.2568
27,033.6518
27,033.6518
7.6784 27,194.8981
13.2133 13.2133 12.2491 12.2491Off-Road 25.1424 283.1608 161.3661 0.2568
0.0000 0.000019.9121 0 0000 19.9121 9.4839 0.0000 9.4839Fugitive Dust
Total CO2 CH4 N2O CO2e
Category lb/day lb/day
PM10 Total
Fugitive PM2.5
Exhaust PM2.5
PM2.5 Total
Bio- CO2 NBio- CO2ROG NOx CO SO2 Fugitive PM10
Exhaust PM10

2,098.1415
2,098.1415 0.6200 2,111.16200.5140 1.3019 1.8159 0.0778 1.1977 1.2755Total 1.7118 18.9334 14.3304 0.0198
2,098.1415
2,098.1415 0.6200 2,111.16201 3019 1 3019 1.1977 1.1977Off-Road 1.7118 18.9334 14.3304 0.0198
0.0000 0.00000.5140 0 0000 0 5140 0.0778 0.0000 0.0778Fugitive Dust
Total CO2 CH4 N2O CO2e
Category lb/day lb/day
PM10 Total
Fugitive PM2.5
Exhaust PM2.5
PM2.5 Total
Bio- CO2 NBio- CO2
3.3 Dune Construction - 2014Unmitigated Construction On-Site
ROG NOx CO SO2 Fugitive PM10
Exhaust PM10
26,925.6604
26,925.6604
1.1992 26,950.8431
43.4937 0.6882 44.1819 11.1098 0.6321 11.7419Total 40.9011 41.6875 129.4487 0.2881
417.6273 417.6273 0.0198 418 04250.3135 9.4300e-003
0 3230 0.0839 8.6600e-003
0.0925Worker 0.6684 0 5884 2.1456 4.4900e-003
1,325.5731
1,325.5731 0.0133 1,325.85270.2889 0.1159 0.4048 0.0792 0.1065 0.1857Vendor 1.2172 6 9015 9.7637 0.0130
25,182.4600
25,182.4600
1.1661 25,206.9479
42.8912 0 5629 43.4541 10.9468 0.5169 11.4637Hauling 39.0155 34.1976 117.5395 0.2706
Total CO2 CH4 N2O CO2e
Category lb/day lb/day
PM10 Total
Fugitive PM2.5
Exhaust PM2.5
PM2.5 Total
Bio- CO2 NBio- CO2
Mitigated Construction Off-Site
ROG NOx CO SO2 Fugitive PM10
Exhaust PM10
0.0000 27,033.6518
27,033.6518
7.6784 27,194.8981
6.1727 1.9820 8.1547 2.9400 1.8374 4.7774Total 25.1424 283.1608 161.3661 0.2568
0.0000 27,033.6518
27,033.6518
7.6784 27,194.8981
1 9820 1 9820 1.8374 1.8374Off-Road 25.1424 283.1608 161.3661 0.2568
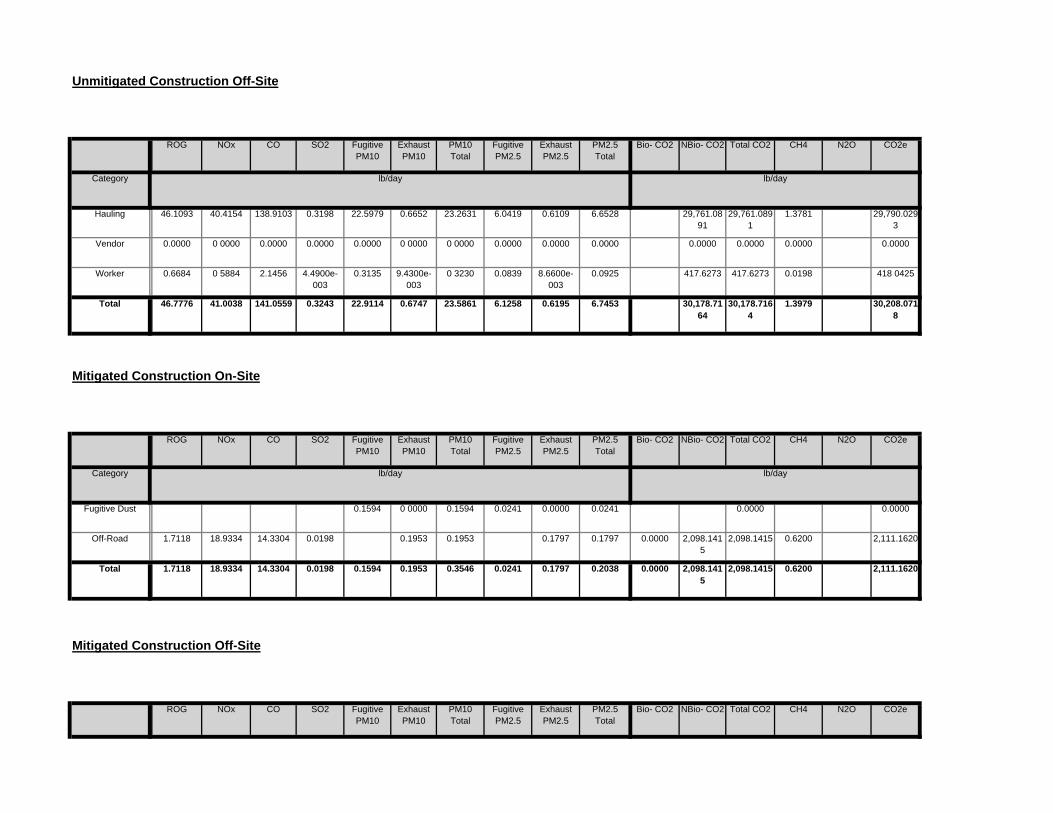
Total CO2 CH4 N2O CO2ePM10 Total
Fugitive PM2.5
Exhaust PM2.5
PM2.5 Total
Bio- CO2 NBio- CO2
Mitigated Construction Off-Site
ROG NOx CO SO2 Fugitive PM10
Exhaust PM10
0.0000 2,098.1415
2,098.1415 0.6200 2,111.16200.1594 0.1953 0.3546 0.0241 0.1797 0.2038Total 1.7118 18.9334 14.3304 0.0198
0.0000 2,098.1415
2,098.1415 0.6200 2,111.16200.1953 0.1953 0.1797 0.1797Off-Road 1.7118 18.9334 14.3304 0.0198
0.0000 0.00000.1594 0 0000 0.1594 0.0241 0.0000 0.0241Fugitive Dust
Total CO2 CH4 N2O CO2e
Category lb/day lb/day
PM10 Total
Fugitive PM2.5
Exhaust PM2.5
PM2.5 Total
Bio- CO2 NBio- CO2
Mitigated Construction On-Site
ROG NOx CO SO2 Fugitive PM10
Exhaust PM10
30,178.7164
30,178.7164
1.3979 30,208.0718
22.9114 0.6747 23.5861 6.1258 0.6195 6.7453Total 46.7776 41.0038 141.0559 0.3243
417.6273 417.6273 0.0198 418 04250.3135 9.4300e-003
0 3230 0.0839 8.6600e-003
0.0925Worker 0.6684 0 5884 2.1456 4.4900e-003
0.0000 0.0000 0.0000 0.00000.0000 0 0000 0 0000 0.0000 0.0000 0.0000Vendor 0.0000 0 0000 0.0000 0.0000
29,761.0891
29,761.0891
1.3781 29,790.0293
22.5979 0.6652 23.2631 6.0419 0.6109 6.6528Hauling 46.1093 40.4154 138.9103 0.3198
Total CO2 CH4 N2O CO2e
Category lb/day lb/day
PM10 Total
Fugitive PM2.5
Exhaust PM2.5
PM2.5 Total
Bio- CO2 NBio- CO2
Unmitigated Construction Off-Site
ROG NOx CO SO2 Fugitive PM10
Exhaust PM10

1,104.6442
1,104.6442 0.0111 1,104.87730.2408 0 0966 0 3374 0.0660 0.0888 0.1548Vendor 1.0143 5.7513 8.1364 0.0108
0.0000 0.0000 0.0000 0.00000.0000 0 0000 0 0000 0.0000 0.0000 0.0000Hauling 0.0000 0 0000 0.0000 0.0000
Total CO2 CH4 N2O CO2e
Category lb/day lb/day
PM10 Total
Fugitive PM2.5
Exhaust PM2.5
PM2.5 Total
Bio- CO2 NBio- CO2
Unmitigated Construction Off-Site
ROG NOx CO SO2 Fugitive PM10
Exhaust PM10
0.0000 0.00000.0000 0.0000 0.0000 0.0000 0.0000 0.0000Total
0.0000 0.00000.0000 0 0000 0 0000 0.0000 0.0000 0.0000Fugitive Dust
Total CO2 CH4 N2O CO2e
Category lb/day lb/day
PM10 Total
Fugitive PM2.5
Exhaust PM2.5
PM2.5 Total
Bio- CO2 NBio- CO2
3.4 Planting, Fencing, Signage, Irrigation - 2014Unmitigated Construction On-Site
ROG NOx CO SO2 Fugitive PM10
Exhaust PM10
30,178.7164
30,178.7164
1.3979 30,208.0718
22.9114 0.6747 23.5861 6.1258 0.6195 6.7453Total 46.7776 41.0038 141.0559 0.3243
417.6273 417.6273 0.0198 418 04250.3135 9.4300e-003
0 3230 0.0839 8.6600e-003
0.0925Worker 0.6684 0 5884 2.1456 4.4900e-003
0.0000 0.0000 0.0000 0.00000.0000 0 0000 0 0000 0.0000 0.0000 0.0000Vendor 0.0000 0 0000 0.0000 0.0000
29,761.0891
29,761.0891
1.3781 29,790.0293
22.5979 0.6652 23.2631 6.0419 0.6109 6.6528Hauling 46.1093 40.4154 138.9103 0.3198
Category lb/day lb/day
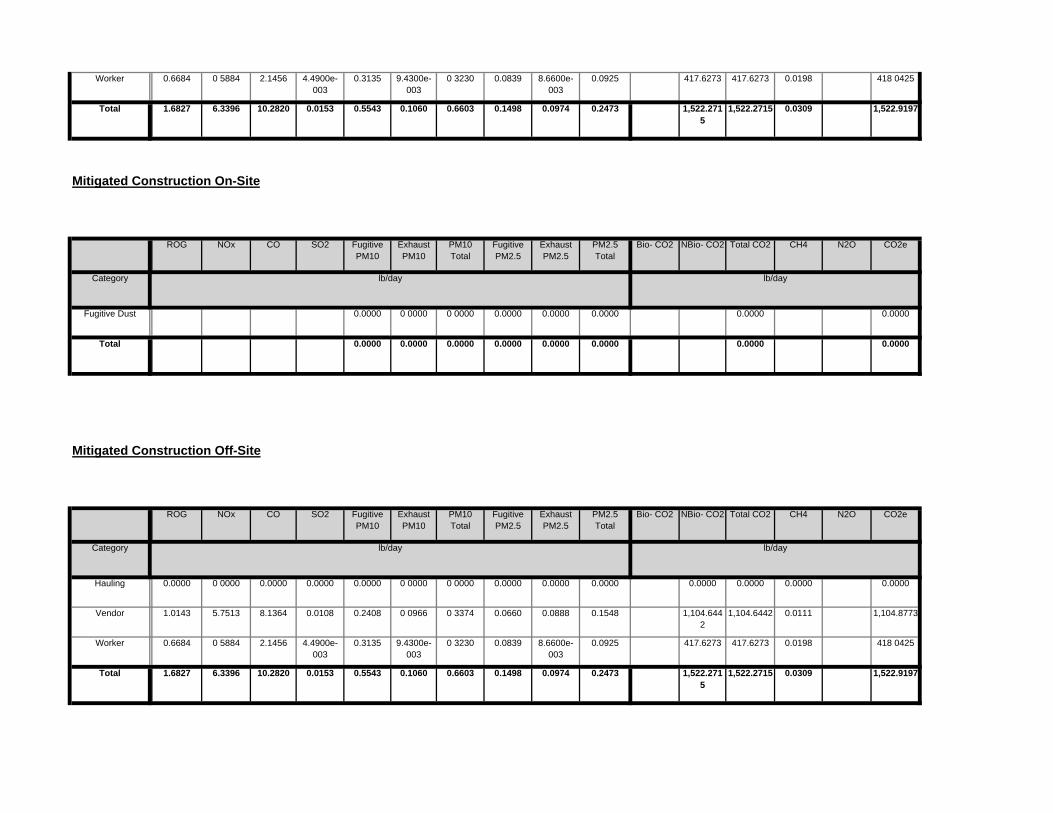
1,522.2715
1,522.2715 0.0309 1,522.91970.5543 0.1060 0.6603 0.1498 0.0974 0.2473Total 1.6827 6.3396 10.2820 0.0153
417.6273 417.6273 0.0198 418 04250.3135 9.4300e-003
0 3230 0.0839 8.6600e-003
0.0925Worker 0.6684 0 5884 2.1456 4.4900e-003
1,104.6442
1,104.6442 0.0111 1,104.87730.2408 0 0966 0 3374 0.0660 0.0888 0.1548Vendor 1.0143 5.7513 8.1364 0.0108
0.0000 0.0000 0.0000 0.00000.0000 0 0000 0 0000 0.0000 0.0000 0.0000Hauling 0.0000 0 0000 0.0000 0.0000
Total CO2 CH4 N2O CO2e
Category lb/day lb/day
PM10 Total
Fugitive PM2.5
Exhaust PM2.5
PM2.5 Total
Bio- CO2 NBio- CO2
Mitigated Construction Off-Site
ROG NOx CO SO2 Fugitive PM10
Exhaust PM10
0.0000 0.00000.0000 0.0000 0.0000 0.0000 0.0000 0.0000Total
0.0000 0.00000.0000 0 0000 0 0000 0.0000 0.0000 0.0000Fugitive Dust
Total CO2 CH4 N2O CO2e
Category lb/day lb/day
PM10 Total
Fugitive PM2.5
Exhaust PM2.5
PM2.5 Total
Bio- CO2 NBio- CO2
Mitigated Construction On-Site
ROG NOx CO SO2 Fugitive PM10
Exhaust PM10
1,522.2715
1,522.2715 0.0309 1,522.91970.5543 0.1060 0.6603 0.1498 0.0974 0.2473Total 1.6827 6.3396 10.2820 0.0153
417.6273 417.6273 0.0198 418 04250.3135 9.4300e-003
0 3230 0.0839 8.6600e-003
0.0925Worker 0.6684 0 5884 2.1456 4.4900e-003
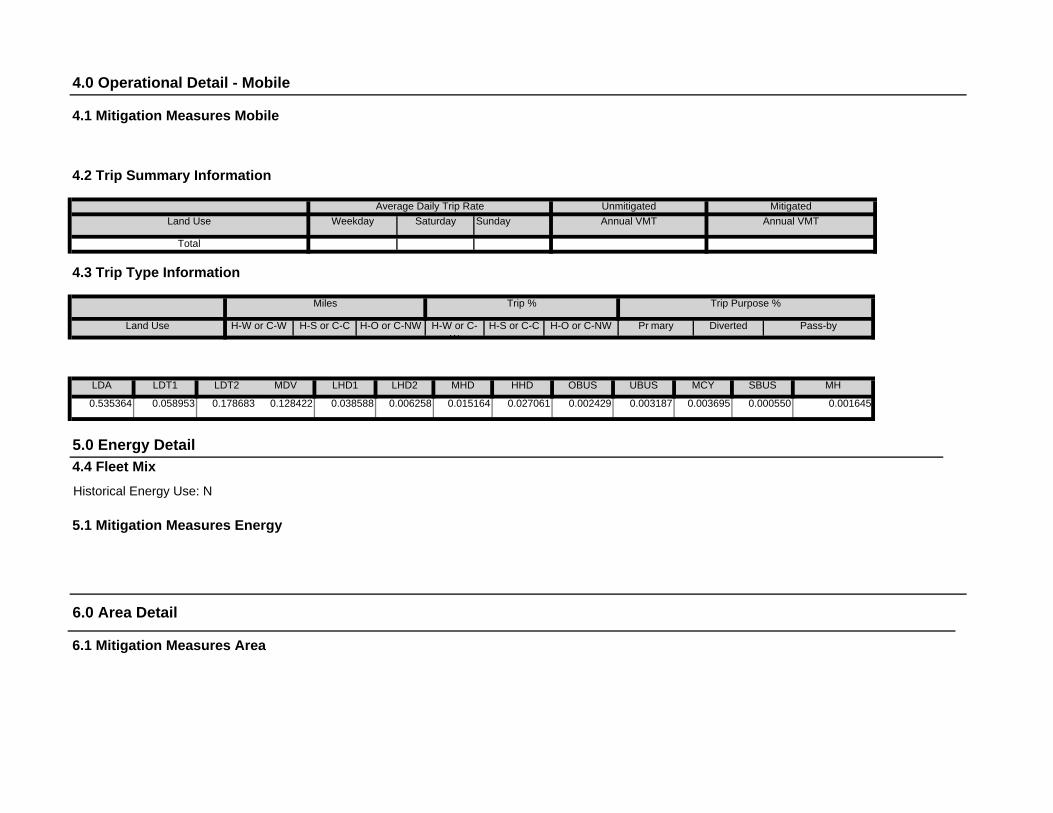
4.4 Fleet MixHistorical Energy Use: N
5.1 Mitigation Measures Energy
6.0 Area Detail
6.1 Mitigation Measures Area
0.002429 0.003187 0.003695 0.000550 0.001645
5.0 Energy Detail
SBUS MH
0.535364 0.058953 0.178683 0.128422 0.038588 0.006258 0.015164 0.027061
LHD2 MHD HHD OBUS UBUS MCY
H-S or C-C H-O or C-NW Pr mary Diverted Pass-by
LDA LDT1 LDT2 MDV LHD1
4.3 Trip Type Information
Miles Trip % Trip Purpose %
Land Use H-W or C-W H-S or C-C H-O or C-NW H-W or C-W
Total
MitigatedLand Use Weekday Saturday Sunday Annual VMT Annual VMT
4.0 Operational Detail - Mobile
4.1 Mitigation Measures Mobile
4.2 Trip Summary Information
Average Daily Trip Rate Unmitigated
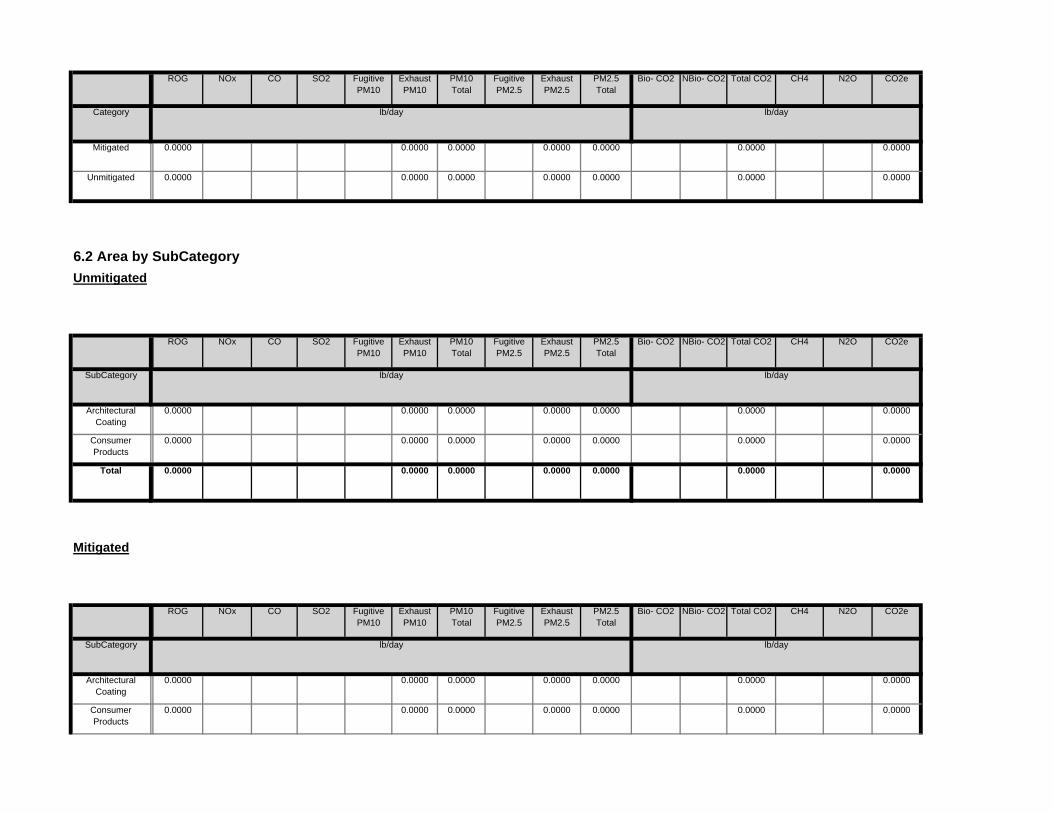
0.0000 0.00000.0000 0.0000 0.0000 0.0000Consumer Products
0.0000
0.0000 0.00000.0000 0.0000 0.0000 0.0000Architectural Coating
0.0000
Total CO2 CH4 N2O CO2e
SubCategory lb/day lb/day
PM10 Total
Fugitive PM2.5
Exhaust PM2.5
PM2.5 Total
Bio- CO2 NBio- CO2
Mitigated
ROG NOx CO SO2 Fugitive PM10
Exhaust PM10
0.0000 0.00000.0000 0.0000 0.0000 0.0000Total 0.0000
0.0000 0.00000.0000 0.0000 0.0000 0.0000Consumer Products
0.0000
0.0000 0.00000.0000 0.0000 0.0000 0.0000Architectural Coating
0.0000
Total CO2 CH4 N2O CO2e
SubCategory lb/day lb/day
PM10 Total
Fugitive PM2.5
Exhaust PM2.5
PM2.5 Total
Bio- CO2 NBio- CO2
6.2 Area by SubCategoryUnmitigated
ROG NOx CO SO2 Fugitive PM10
Exhaust PM10
0.0000 0.00000.0000 0.0000 0.0000 0.0000Unmitigated 0.0000
0.0000 0.00000.0000 0.0000 0.0000 0.0000
CO2e
Category lb/day lb/day
Mitigated 0.0000
PM2.5 Total
Bio- CO2 NBio- CO2 Total CO2 CH4 N2OSO2 Fugitive PM10
Exhaust PM10
PM10 Total
Fugitive PM2.5
Exhaust PM2.5
ROG NOx CO

Hours/Day Days/Year Horse Power Load Factor Fuel Type
10.0 Vegetation
7.0 Water Detail
7.1 Mitigation Measures Water
8.0 Waste Detail
8.1 Mitigation Measures Waste
9.0 Operational Offroad
Equipment Type Number
0.0000 0.00000.0000 0.0000 0.0000 0.0000Total 0.0000
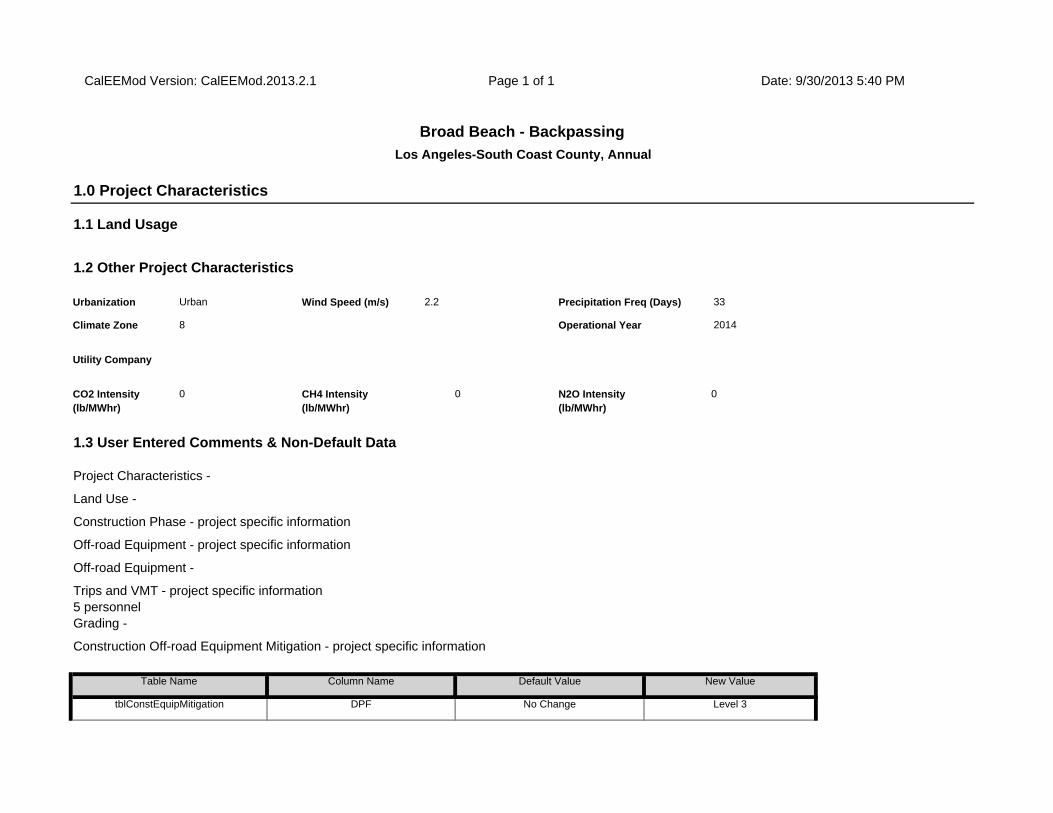
tblConstEquipMitigation DPF No Change Level 3
Off-road Equipment - project specific information
Off-road Equipment -
Trips and VMT - project specific information5 personnelGrading -
Construction Off-road Equipment Mitigation - project specific information
Table Name Column Name Default Value New Value
N2O Intensity (lb/MWhr)
0
1.3 User Entered Comments & Non-Default Data
Project Characteristics -
Land Use -
Construction Phase - project specific information
Utility Company
CO2 Intensity (lb/MWhr)
0 CH4 Intensity (lb/MWhr)
0
Precipitation Freq (Days) 33
Climate Zone 8 Operational Year 2014
1.1 Land Usage
1.2 Other Project Characteristics
Urbanization Urban Wind Speed (m/s) 2.2
CalEEMod Version: CalEEMod.2013.2.1 Page 1 of 1 Date: 9/30/2013 5:40 PM
Broad Beach - BackpassingLos Angeles-South Coast County, Annual
1.0 Project Characteristics
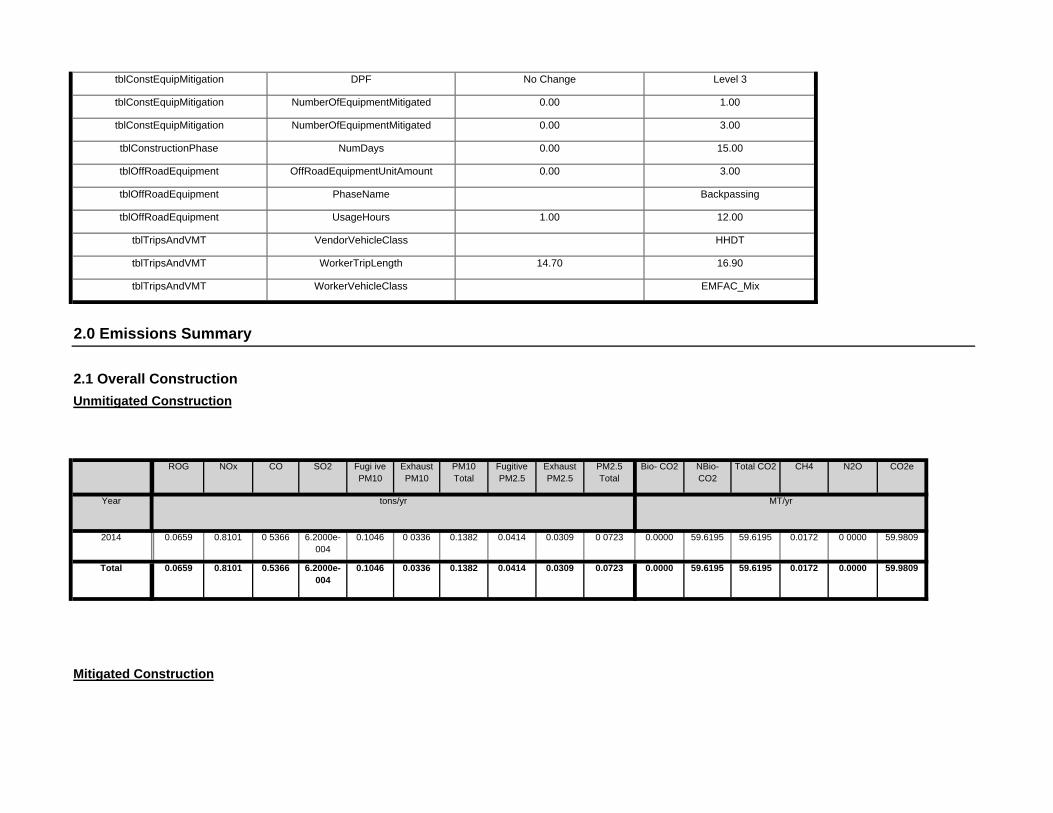
Mitigated Construction
0.0000 59.6195 59.6195 0.0172 0.0000 59.98090.1046 0.0336 0.1382 0.0414 0.0309 0.0723Total 0.0659 0.8101 0.5366 6.2000e-004
0.0000 59.6195 59.6195 0.0172 0 0000 59.98090.1046 0 0336 0.1382 0.0414 0.0309 0 07232014 0.0659 0.8101 0 5366 6.2000e-004
CH4 N2O CO2e
Year tons/yr MT/yr
Fugitive PM2.5
Exhaust PM2.5
PM2.5 Total
Bio- CO2 NBio- CO2
Total CO2
Unmitigated Construction
ROG NOx CO SO2 Fugi ive PM10
Exhaust PM10
PM10 Total
tblTripsAndVMT WorkerVehicleClass EMFAC_Mix
2.0 Emissions Summary
2.1 Overall Construction
tblTripsAndVMT VendorVehicleClass HHDT
tblTripsAndVMT WorkerTripLength 14.70 16.90
tblOffRoadEquipment PhaseName Backpassing
tblOffRoadEquipment UsageHours 1.00 12.00
tblConstructionPhase NumDays 0.00 15.00
tblOffRoadEquipment OffRoadEquipmentUnitAmount 0.00 3.00
tblConstEquipMitigation NumberOfEquipmentMitigated 0.00 1.00
tblConstEquipMitigation NumberOfEquipmentMitigated 0.00 3.00
tblConstEquipMitigation DPF No Change Level 3

Mitigated Operational
0.0000 0.0000 0.0000 0.0000 0.0000 0.00000.0000 0.0000 0.0000 0.0000Total 0.0000
0.0000 0.0000 0.0000 0.0000 0 0000 0.00000 0000 0.0000 0.0000 0 0000Area 0.0000
Total CO2 CH4 N2O CO2e
Category tons/yr MT/yr
PM10 Total
Fugitive PM2.5
Exhaust PM2.5
PM2.5 Total
Bio- CO2 NBio- CO2
2.2 Overall OperationalUnmitigated Operational
ROG NOx CO SO2 Fugi ive PM10
Exhaust PM10
0.00 0.00 0.00 0.00 0.00 0.0068.30 84.82 72.33 68.54 84.83 75.50
NBio-CO2 Total CO2 CH4 N20 CO2e
Percent Reduction
0.00 0.00 0.00 0.00
Exhaust PM10
PM10 Total
Fugitive PM2.5
Exhaust PM2.5
PM2.5 Total
Bio- CO2ROG NOx CO SO2 Fugitive PM10
0.0000 59.6194 59.6194 0.0172 0.0000 59.98090.0332 5.1000e-003
0.0382 0.0130 4.6900e-003
0.0177Total 0.0659 0.8101 0.5366 6.2000e-004
0.0000 59.6194 59.6194 0.0172 0 0000 59.98090.0332 5.1000e-003
0.0382 0.0130 4.6900e-003
0 01772014 0.0659 0.8101 0 5366 6.2000e-004
Total CO2 CH4 N2O CO2e
Year tons/yr MT/yr
PM10 Total
Fugitive PM2.5
Exhaust PM2.5
PM2.5 Total
Bio- CO2 NBio- CO2
ROG NOx CO SO2 Fugi ive PM10
Exhaust PM10

Backpassing Scrapers 3 12.00 361 0.48
Load Factor
Backpassing Rubber Tired Dozers 1 12.00 255 0.40
OffRoad Equipment
Phase Name Offroad Equipment Type Amount Usage Hours Horse Power
15
Acres of Grading (Site Preparation Phase): 0
Acres of Grading (Grading Phase): 0
Acres of Paving: 0
Residential Indoor: 0; Residential Outdoor: 0; Non-Residential Indoor: 0; Non-Residential Outdoor: 0 (Architectural Coating – sqft)
End Date Num Days Week
Num Days Phase Description
1 Backpassing Grading 9/15/2014 10/3/2014 5
3.0 Construction Detail
Construction Phase
Phase Number
Phase Name Phase Type Start Date
0.00 0.00 0.00 0.00 0.00 0.000.00 0.00 0.00 0.00 0.00 0.00
NBio-CO2 Total CO2 CH4 N20 CO2e
Percent Reduction
0.00 0.00 0.00 0.00
Exhaust PM10
PM10 Total
Fugitive PM2.5
Exhaust PM2.5
PM2.5 Total
Bio- CO2ROG NOx CO SO2 Fugitive PM10
0.0000 0.0000 0.0000 0.0000 0.0000 0.00000.0000 0.0000 0.0000 0.0000Total 0.0000
0.0000 0.0000 0.0000 0.0000 0 0000 0.00000 0000 0.0000 0.0000 0 0000Area 0.0000
Total CO2 CH4 N2O CO2e
Category tons/yr MT/yr
PM10 Total
Fugitive PM2.5
Exhaust PM2.5
PM2.5 Total
Bio- CO2 NBio- CO2
ROG NOx CO SO2 Fugi ive PM10
Exhaust PM10

CO2ePM2.5 Total
Bio- CO2 NBio- CO2
Total CO2 CH4 N2OSO2 Fugitive PM10
Exhaust PM10
PM10 Total
Fugitive PM2.5
Exhaust PM2.5
0.0172 0.0000 58.4033
Unmitigated Construction Off-Site
ROG NOx CO
0.0411 0.0309 0.0720 0.0000 58.0431 58.0431
58.4033
Total 0.0637 0.8060 0.5269 6.0000e-004
0.1035 0.0335 0.1371
0.0309 0.0000 58.0431 58.0431 0.0172 0.00006.0000e-004
0.0335 0.0335 0 0309
0.0000 0.0000 0.0000 0.0000 0.0000
Off-Road 0.0637 0.8060 0.5269
0.0000 0.1035 0.0411 0 0000 0.0411 0.0000
Category tons/yr MT/yr
Fugitive Dust 0.1035
Bio- CO2 NBio- CO2
Total CO2 CH4 N2O CO2eFugitive PM10
Exhaust PM10
PM10 Total
Fugitive PM2.5
Exhaust PM2.5
PM2.5 Total
ROG NOx CO SO2
Use DPF for Construction Equipment
Water Exposed Area
Reduce Vehicle Speed on Unpaved Roads
Clean Paved Roads
3.2 Backpassing - 2014Unmitigated Construction On-Site
6.90 EMFAC_Mix HHDT
3.1 Mitigation Measures Construction
Backpassing 4 10.00 2.00 0.00 16.90
Worker Trip Length
Vendor Trip Length
Hauling Trip Length
Worker Vehicle Class
Vendor Vehicle Class
Hauling Vehicle Class
Trips and VMT
Phase Name Offroad Equipment Count
Worker Trip Number
Vendor Trip Number
Hauling Trip Number

0.0000 0.0000 0 0000 0.0000 0.0000 0.00000.0000 0.0000 0.0000 0.0000 0 0000 0.0000Hauling
Total CO2 CH4 N2O CO2e
Category tons/yr MT/yr
PM10 Total
Fugitive PM2.5
Exhaust PM2.5
PM2.5 Total
Bio- CO2 NBio- CO2
Mitigated Construction Off-Site
ROG NOx CO SO2 Fugitive PM10
Exhaust PM10
0.0000 58.0431 58.0431 0.0172 0.0000 58.40330.0321 5.0300e-003
0.0371 0.0127 4.6300e-003
0.0174Total 0.0637 0.8060 0.5269 6.0000e-004
0.0000 58.0431 58.0431 0.0172 0.0000 58.40335.0300e-003
5.0300e-003
4.6300e-003
4.6300e-003
Off-Road 0.0637 0.8060 0.5269 6.0000e-004
0.0000 0.0000 0 0000 0.0000 0.0000 0.00000.0321 0.0000 0.0321 0.0127 0 0000 0.0127Fugitive Dust
Total CO2 CH4 N2O CO2e
Category tons/yr MT/yr
PM10 Total
Fugitive PM2.5
Exhaust PM2.5
PM2.5 Total
Bio- CO2 NBio- CO2
Mitigated Construction On-Site
ROG NOx CO SO2 Fugitive PM10
Exhaust PM10
0.0000 1.5764 1.5764 6.0000e-005
0.0000 1.57761.0500e-003
7.0000e-005
1.1100e-003
2.8000e-004
6.0000e-005
3.4000e-004
Total 2.2200e-003
4.0800e-003
9.7500e-003
1.0000e-005
0.0000 1.1992 1.1992 6.0000e-005
0.0000 1.20039.6000e-004
3.0000e-005
9.9000e-004
2.6000e-004
3.0000e-005
2.8000e-004
Worker 1.8600e-003
1.8800e-003
6.8000e-003
1.0000e-005
0.0000 0.3772 0 3772 0.0000 0.0000 0.37739.0000e-005
4.0000e-005
1.2000e-004
2.0000e-005
3.0000e-005
6.0000e-005
Vendor 3.6000e-004
2.2000e-003
2.9500e-003
0.0000
0.0000 0.0000 0 0000 0.0000 0.0000 0.00000.0000 0.0000 0.0000 0.0000 0 0000 0.0000
Category tons/yr MT/yr
Hauling

4.4 Fleet MixHistorical Energy Use: N
5.1 Mitigation Measures Energy
0.002426 0.003171 0.003696 0.000547 0.001645
5.0 Energy Detail
SBUS MH
0.535275 0.058759 0.178478 0.127034 0.038632 0.006246 0.015618 0.028471
LHD2 MHD HHD OBUS UBUS MCY
H-S or C-C H-O or C-NW Primary Diverted Pass-by
LDA LDT1 LDT2 MDV LHD1
4.3 Trip Type Information
Miles Trip % Trip Purpose %
Land Use H-W or C-W H-S or C-C H-O or C-NW H-W or C-W
Total
MitigatedLand Use Weekday Saturday Sunday Annual VMT Annual VMT
4.0 Operational Detail - Mobile
4.1 Mitigation Measures Mobile
4.2 Trip Summary Information
Average Daily Trip Rate Unmitigated
0.0000 1.5764 1.5764 6.0000e-005
0.0000 1.57761.0500e-003
7.0000e-005
1.1100e-003
2.8000e-004
6.0000e-005
3.4000e-004
Total 2.2200e-003
4.0800e-003
9.7500e-003
1.0000e-005
0.0000 1.1992 1.1992 6.0000e-005
0.0000 1.20039.6000e-004
3.0000e-005
9.9000e-004
2.6000e-004
3.0000e-005
2.8000e-004
Worker 1.8600e-003
1.8800e-003
6.8000e-003
1.0000e-005
0.0000 0.3772 0 3772 0.0000 0.0000 0.37739.0000e-005
4.0000e-005
1.2000e-004
2.0000e-005
3.0000e-005
6.0000e-005
Vendor 3.6000e-004
2.2000e-003
2.9500e-003
0.0000

Mitigated
0.0000 0.0000 0.0000 0.0000 0.0000 0.00000.0000 0.0000 0.0000 0.0000Total 0.0000
0.0000 0.0000 0.0000 0.0000 0 0000 0.00000 0000 0.0000 0.0000 0 0000Architectural Coating
0.0000
0.0000 0.0000 0.0000 0.0000 0 0000 0.00000 0000 0.0000 0.0000 0 0000Consumer Products
0.0000
Total CO2 CH4 N2O CO2e
SubCategory tons/yr MT/yr
PM10 Total
Fugitive PM2.5
Exhaust PM2.5
PM2.5 Total
Bio- CO2 NBio- CO2
6.2 Area by SubCategoryUnmitigated
ROG NOx CO SO2 Fugi ive PM10
Exhaust PM10
0.0000 0.0000 0.0000 0.0000 0 0000 0.00000 0000 0.0000 0.0000 0 0000Unmitigated 0.0000
0.0000 0.0000 0.0000 0.0000 0 0000 0.00000 0000 0.0000 0.0000 0 0000
CO2e
Category tons/yr MT/yr
Mitigated 0.0000
PM2.5 Total
Bio- CO2 NBio- CO2
Total CO2 CH4 N2OSO2 Fugi ive PM10
Exhaust PM10
PM10 Total
Fugitive PM2.5
Exhaust PM2.5
6.0 Area Detail
6.1 Mitigation Measures Area
ROG NOx CO
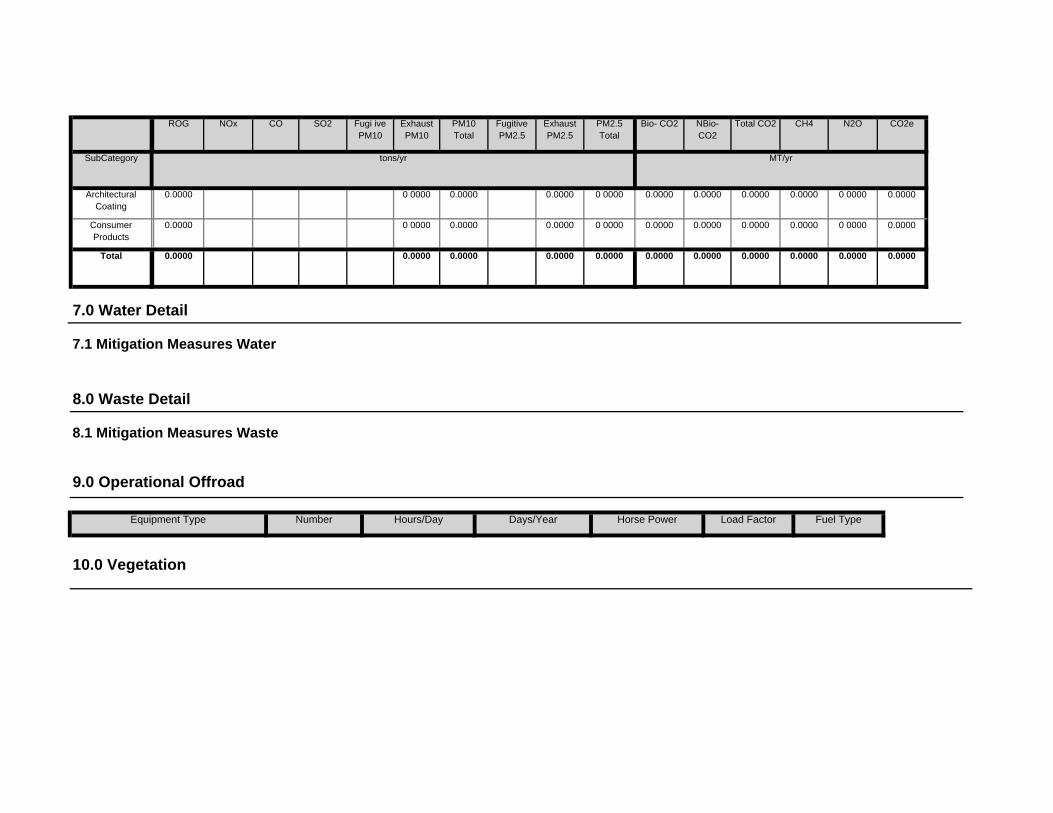
Hours/Day Days/Year Horse Power Load Factor Fuel Type
10.0 Vegetation
7.0 Water Detail
7.1 Mitigation Measures Water
8.0 Waste Detail
8.1 Mitigation Measures Waste
9.0 Operational Offroad
Equipment Type Number
0.0000 0.0000 0.0000 0.0000 0.0000 0.00000.0000 0.0000 0.0000 0.0000Total 0.0000
0.0000 0.0000 0.0000 0.0000 0 0000 0.00000 0000 0.0000 0.0000 0 0000Consumer Products
0.0000
0.0000 0.0000 0.0000 0.0000 0 0000 0.00000 0000 0.0000 0.0000 0 0000Architectural Coating
0.0000
Total CO2 CH4 N2O CO2e
SubCategory tons/yr MT/yr
PM10 Total
Fugitive PM2.5
Exhaust PM2.5
PM2.5 Total
Bio- CO2 NBio- CO2
ROG NOx CO SO2 Fugi ive PM10
Exhaust PM10

Total CO2 CH4 N2O CO2ePercent Reduction
4.87104E+001
Equipment Type ROG NOx CO SO2 Exhaust PM10 Exhaust PM2 5 Bio- CO2 NBio- CO2
3 58000E-003 0.00000E+000 4.84100E+001 4.84100E+001 1.43100E-002 0.00000E+000Scrapers 4.93800E-002 6.42900E-001 4.02080E-001 5.00000E-004 3.89000E-003
0.00000E+000 9.63304E+000 9.63304E+000 2.85000E-003 0.00000E+000 9.69282E+000
CO2eMi igated tons/yr Mitigated mt/yr
Rubber Tired Dozers 1.43100E-002 1.63080E-001 1.24760E-001 1.00000E-004 1.14000E-003 1 05000E-003
Exhaust PM2 5 Bio- CO2 NBio- CO2 Total CO2 CH4 N2O
4.84101E+001 1.43100E-002 0 00000E+000 4.87105E+001
Equipment Type ROG NOx CO SO2 Exhaust PM10
9.69283E+000
Scrapers 4.93800E-002 6.42900E-001 4.02080E-001 5.00000E-004 2.59300E-002 2.38600E-002 0.00000E+000 4.84101E+001
7.00000E-003 0.00000E+000 9.63305E+000 9.63305E+000 2.85000E-003 0 00000E+000Rubber Tired Dozers
1.43100E-002 1.63090E-001 1.24760E-001 1.00000E-004 7.60000E-003
Total CO2 CH4 N2O CO2eUnmitigated tons/yr Unmitigated mt/yr
0.00
Equipment Type ROG NOx CO SO2 Exhaust PM10 Exhaust PM2.5 Bio- CO2 NBio- CO2
Scrapers Diesel No Change 3 3 Level 3
Oxidation Catalyst
Rubber Tired Dozers Diesel No Change 1 1 Level 3 0.00
Equipment Type Fuel Type Tier Number Mitigated Total Number of Equipment DPF
0.00 0.00 0 00 0.00 0.00
OFFROAD Equipment Mitigation
CO2ePercent Reduction
Backpassing 0.00 0.00 0 00 0.00 0.85 0 85 0.00
Exhaust PM2 5 Bio- CO2
NBio- CO2 Total CO2 CH4 N2OPhase ROG NOx CO SO2
Exhaust PM10
CalEEMod Version: CalEEMod.2013.2.1Page 1 of 1
Date: 9/30/2013 5:44 PM
Broad Beach - BackpassingLos Angeles-South Coast County, Mitigation Report
Construction Mitigation Summary

0.000.00 0.00 0.00 0.00 0.00 0.00
0.00 0.00 0.00 0.00
Water Indoor 0.00 0.00 0.00 0 00 0.00
0.00
Natural Gas 0.00 0.00 0.00 0 00 0.00 0.00 0.00 0.00
0.00 0.00 0.00 0.00 0.00 0.00
0.00 0.00 0.00 0.00
Mobile 0.00 0.00 0.00 0 00 0.00
0.00
Landscaping 0.00 0.00 0.00 0 00 0.00 0.00 0.00 0.00
0.00 0.00 0.00 0.00 0.00 0.00
0.00 0.00 0.00 0.00
Hearth 0.00 0.00 0.00 0 00 0.00
0.00
Electricity 0.00 0.00 0.00 0 00 0.00 0.00 0.00 0.00
0.00 0.00 0.00 0.00 0.00 0.00Consumer Products 0.00 0.00 0.00 0 00 0.00
0.00 0.00 0.00 0.00 0.00 0.00
N2O CO2ePercent Reduction
Architectural Coa ing 0.00 0.00 0.00 0 00 0.00 0.00
Exhaust PM10
Exhaust PM2.5 Bio- CO2 NBio- CO2
Total CO2 CH4
Operational Percent Reduction Summary
Category ROG NOx CO SO2
0.69
Backpassing Roads 0.00 0.00 0.00 0.00 0 00 0.00
PM2.5 PM10 PM2.5Backpassing Fugitive Dust 0.10 0.04 0.03 0.01 0.69
Unmitigated Mitigated Percent Reduction
Phase Source PM10 PM2.5 PM10
Yes Clean Paved Road % PM Reduction 0.00
No Unpaved Road Mitigation Moisture Content %
0.00 Vehicle Speed (mph)
15.00
Yes Water Exposed Area PM10 Reduction 69.00 PM2.5 Reduction
69.00 Frequency (per day)
0.00
No Replace Ground Cover of Area Disturbed
PM10 Reduction 0.00 PM2.5 Reduction
0.00
Mitigation InputYes/No Mitigation Measure Mitigation Input Mitigation Input
No Soil Stabilizer for unpaved Roads
PM10 Reduction 0.00 PM2.5 Reduction
1 23941E-006 1 23941E-006 0.00000E+000 0.00000E+000 1.23177E-006
Fugitive Dust Mitigation
0.00000E+000 1 03169E-006
Scrapers 0 00000E+000 0.00000E+000 0.00000E+000 0.00000E+000 8.49981E-001 8.49958E-001 0.00000E+000
8.50000E-001 8 50000E-001 0.00000E+000 1 03809E-006 1 03809E-006 0.00000E+000Rubber Tired Dozers 0 00000E+000 6.13158E-005 0.00000E+000 0.00000E+000

No Commute Implement Employee Parking "Cash Out"
No Commute Transit Subsidy
No Commute Implement Trip Reduction Program
Land Use and Site Enhancement Subtotal 0.00
Transit Improvements Transit Improvements Subtotal 0.00
No Transit Improvements Increase Transit Frequency 0.00
No Transit Improvements Expand Transit Network 0.00
No Transit Improvements Provide BRT System 0.00
Parking Policy Pricing Parking Policy Pricing Subtotal 0.00
No Parking Policy Pricing On-street Market Pricing 0.00
No Parking Policy Pricing Unbundle Parking Costs 0.00
No Parking Policy Pricing Limit Parking Supply 0.00
Neighborhood Enhancements Neighborhood Enhancements Subtotal 0.00
No Neighborhood Enhancements Implement NEV Network 0.00
No Neighborhood Enhancements Provide Traffic Calming Measures
No Neighborhood Enhancements Improve Pedestrian Network
Land Use Land Use SubTotal 0.00
No Land Use Integrate Below Market Rate Housing 0.00
No Land Use Increase Transit Accessibility 0.25
No Land Use Improve Destination Accessibility 0.00
No Land Use Improve Walkability Design 0.00
No Land Use Increase Diversity 0.00 0.15
Input Value 3
No Land Use Increase Density 0.00
Mitigation S l ct
Category Measure % Reduction Input Value 1 Input Value 2
0.00 0.00 0.00 0.00
Operational Mobile Mitigation
Project Setting:
Water Outdoor 0.00 0.00 0.00 0 00 0.00 0.00 0.00 0.00

No On-site Renewable
No Exceed Title 24
No Install High Efficiency Lighting
No % Electric Chainsaw
Energy Mitigation Measures
Measure Implemented Mitigation Measure Input Value 1 Input Value 2
No % Electric Lawnmower
No % Electric Leafblower
No Use Low VOC Paint (Non-residential Interior) 250.00
No Use Low VOC Paint (Non-residential Exterior) 250.00
No Use Low VOC Paint (Residential Interior) 50.00
No Use Low VOC Paint (Residential Exterior) 100.00
No No Hearth
No Use Low VOC Cleaning Supplies
Area Mitigation
Measure Implemented Mitigation Measure Input Value
No Only Natural Gas Hearth
Total VMT Reduction 0.00
No School Trip Implement School Bus Program 0.00
Commute Commute Subtotal 0.00
No Commute Provide Ride Sharing Program
No Commute Employee Vanpool/Shuttle 0.00 2.00
No Commute Market Commute Trip Reduction Option 0.00
No Commute Encourage Telecommuting and Alternative Work Schedules
0.00
No Commute Workplace Parking Charge
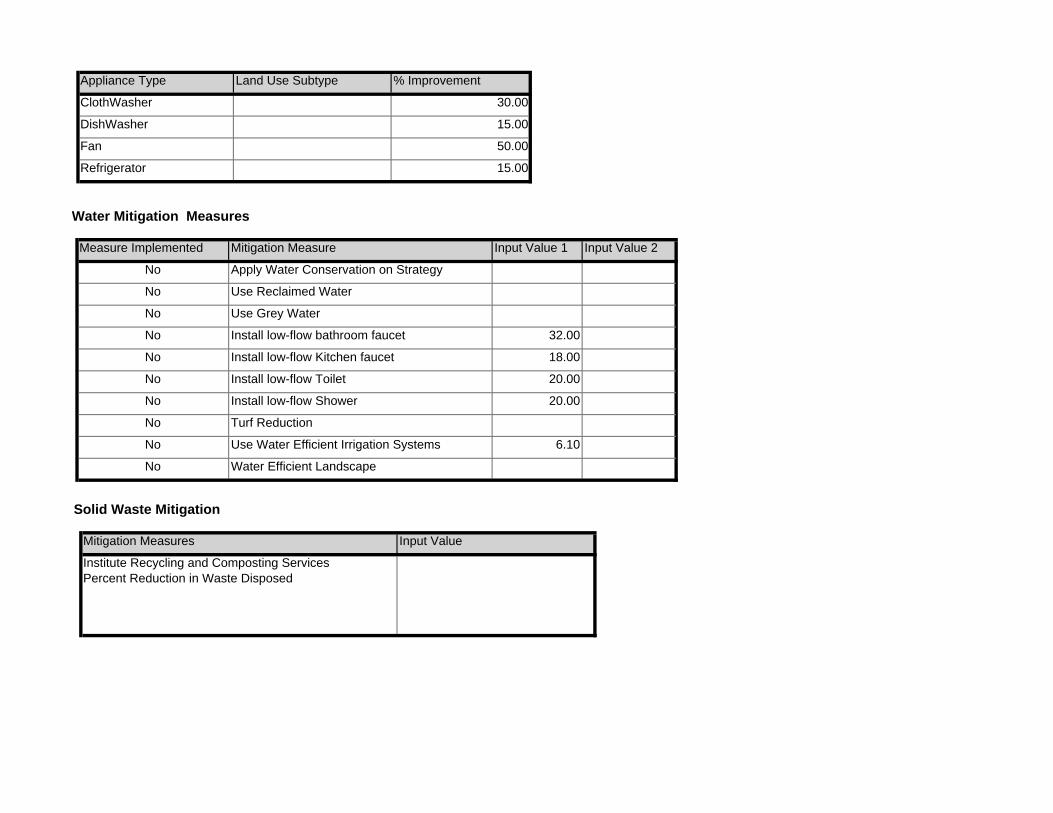
Institute Recycling and Composting ServicesPercent Reduction in Waste Disposed
No Water Efficient Landscape
Solid Waste Mitigation
Mitigation Measures Input Value
No Turf Reduction
No Use Water Efficient Irrigation Systems 6.10
No Install low-flow Toilet 20.00
No Install low-flow Shower 20.00
No Install low-flow bathroom faucet 32.00
No Install low-flow Kitchen faucet 18.00
No Use Reclaimed Water
No Use Grey Water
Water Mitigation Measures
Measure Implemented Mitigation Measure Input Value 1 Input Value 2
No Apply Water Conservation on Strategy
Fan 50.00
Refrigerator 15.00
ClothWasher 30.00
DishWasher 15.00
Appliance Type Land Use Subtype % Improvement

tblConstEquipMitigation DPF No Change Level 3
Off-road Equipment - project specific information
Off-road Equipment -
Trips and VMT - project specific information5 personnelGrading -
Construction Off-road Equipment Mitigation - project specific information
Table Name Column Name Default Value New Value
N2O Intensity (lb/MWhr)
0
1.3 User Entered Comments & Non-Default Data
Project Characteristics -
Land Use -
Construction Phase - project specific information
Utility Company
CO2 Intensity (lb/MWhr)
0 CH4 Intensity (lb/MWhr)
0
Precipitation Freq (Days) 33
Climate Zone 8 Operational Year 2014
1.1 Land Usage
1.2 Other Project Characteristics
Urbanization Urban Wind Speed (m/s) 2.2
CalEEMod Version: CalEEMod.2013.2.1 Page 1 of 1 Date: 9/30/2013 5:40 PM
Broad Beach - BackpassingLos Angeles-South Coast County, Summer
1.0 Project Characteristics
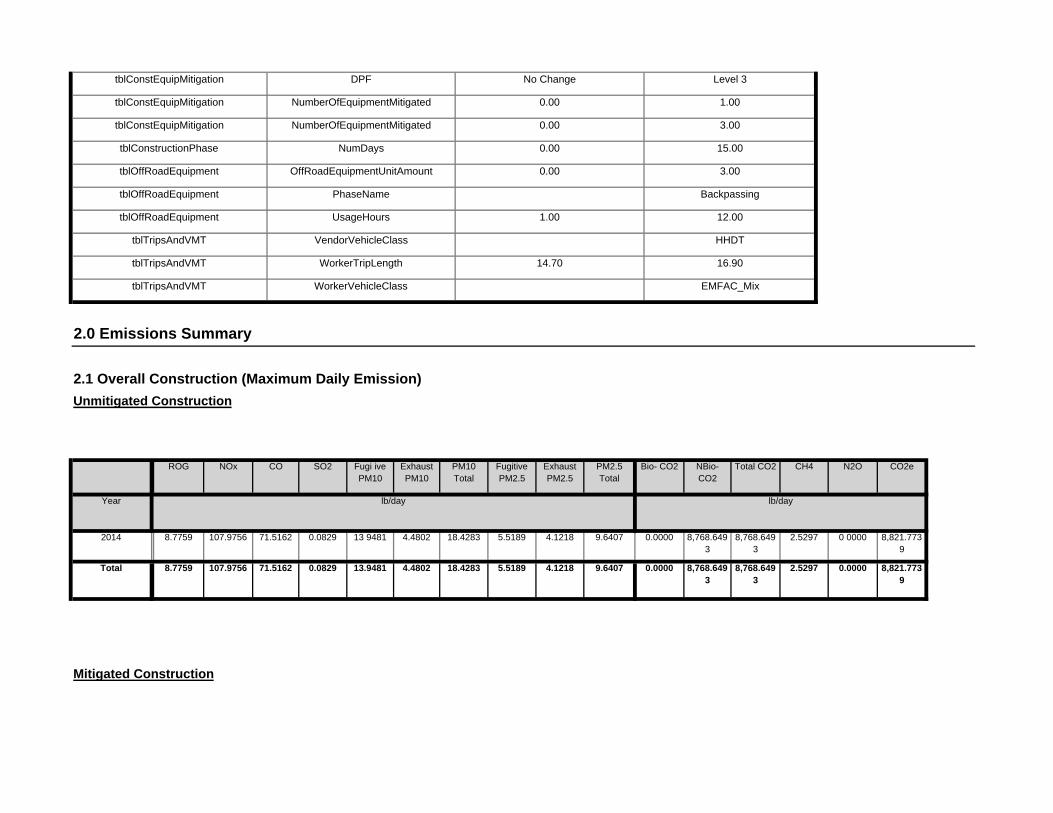
Mitigated Construction
0.0000 8,768.6493
8,768.6493
2.5297 0.0000 8,821.7739
13.9481 4.4802 18.4283 5.5189 4.1218 9.6407Total 8.7759 107.9756 71.5162 0.0829
0.0000 8,768.6493
8,768.6493
2.5297 0 0000 8,821.7739
13 9481 4.4802 18.4283 5.5189 4.1218 9.64072014 8.7759 107.9756 71.5162 0.0829
CH4 N2O CO2e
Year lb/day lb/day
Fugitive PM2.5
Exhaust PM2.5
PM2.5 Total
Bio- CO2 NBio- CO2
Total CO2
Unmitigated Construction
ROG NOx CO SO2 Fugi ive PM10
Exhaust PM10
PM10 Total
tblTripsAndVMT WorkerVehicleClass EMFAC_Mix
2.0 Emissions Summary
2.1 Overall Construction (Maximum Daily Emission)
tblTripsAndVMT VendorVehicleClass HHDT
tblTripsAndVMT WorkerTripLength 14.70 16.90
tblOffRoadEquipment PhaseName Backpassing
tblOffRoadEquipment UsageHours 1.00 12.00
tblConstructionPhase NumDays 0.00 15.00
tblOffRoadEquipment OffRoadEquipmentUnitAmount 0.00 3.00
tblConstEquipMitigation NumberOfEquipmentMitigated 0.00 1.00
tblConstEquipMitigation NumberOfEquipmentMitigated 0.00 3.00
tblConstEquipMitigation DPF No Change Level 3
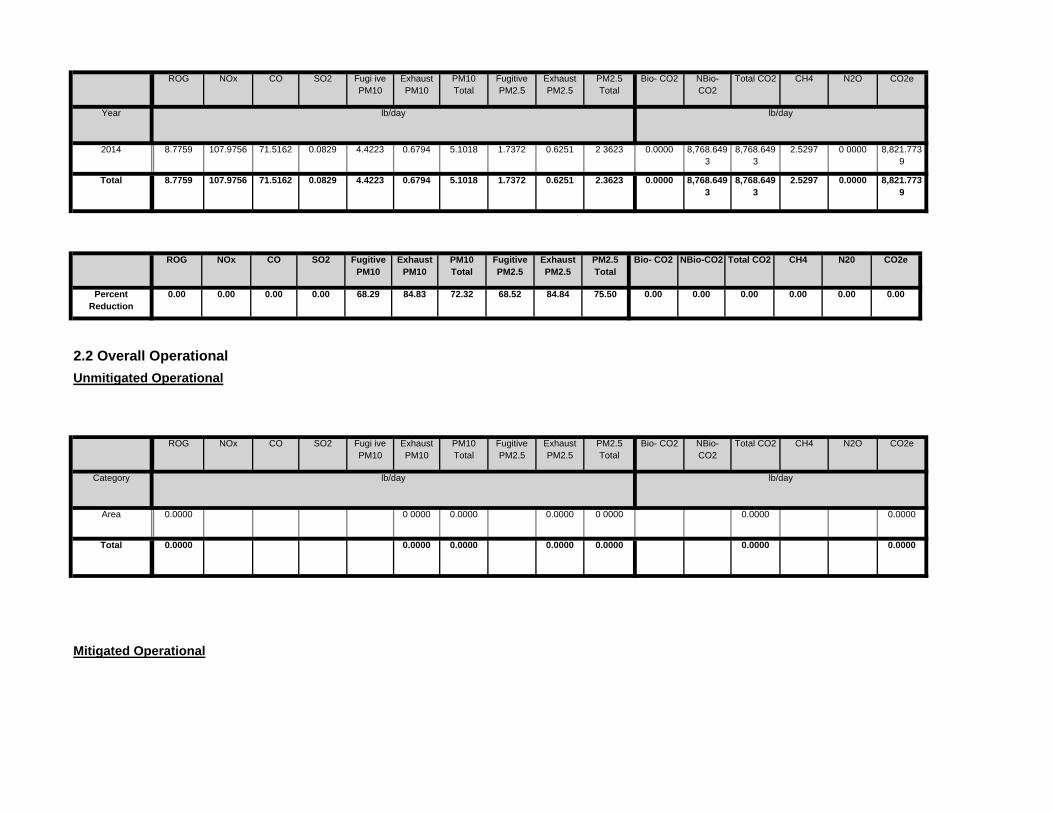
Mitigated Operational
0.0000 0.00000.0000 0.0000 0.0000 0.0000Total 0.0000
0.0000 0.00000 0000 0.0000 0.0000 0 0000Area 0.0000
Total CO2 CH4 N2O CO2e
Category lb/day lb/day
PM10 Total
Fugitive PM2.5
Exhaust PM2.5
PM2.5 Total
Bio- CO2 NBio- CO2
2.2 Overall OperationalUnmitigated Operational
ROG NOx CO SO2 Fugi ive PM10
Exhaust PM10
0.00 0.00 0.00 0.00 0.00 0.0068.29 84.83 72.32 68.52 84.84 75.50
NBio-CO2 Total CO2 CH4 N20 CO2e
Percent Reduction
0.00 0.00 0.00 0.00
Exhaust PM10
PM10 Total
Fugitive PM2.5
Exhaust PM2.5
PM2.5 Total
Bio- CO2ROG NOx CO SO2 Fugitive PM10
0.0000 8,768.6493
8,768.6493
2.5297 0.0000 8,821.7739
4.4223 0.6794 5.1018 1.7372 0.6251 2.3623Total 8.7759 107.9756 71.5162 0.0829
0.0000 8,768.6493
8,768.6493
2.5297 0 0000 8,821.7739
4.4223 0.6794 5.1018 1.7372 0.6251 2 36232014 8.7759 107.9756 71.5162 0.0829
Total CO2 CH4 N2O CO2e
Year lb/day lb/day
PM10 Total
Fugitive PM2.5
Exhaust PM2.5
PM2.5 Total
Bio- CO2 NBio- CO2
ROG NOx CO SO2 Fugi ive PM10
Exhaust PM10

Backpassing Scrapers 3 12.00 361 0.48
Load Factor
Backpassing Rubber Tired Dozers 1 12.00 255 0.40
OffRoad Equipment
Phase Name Offroad Equipment Type Amount Usage Hours Horse Power
15
Acres of Grading (Site Preparation Phase): 0
Acres of Grading (Grading Phase): 0
Acres of Paving: 0
Residential Indoor: 0; Residential Outdoor: 0; Non-Residential Indoor: 0; Non-Residential Outdoor: 0 (Architectural Coating – sqft)
End Date Num Days Week
Num Days Phase Description
1 Backpassing Grading 9/15/2014 10/3/2014 5
3.0 Construction Detail
Construction Phase
Phase Number
Phase Name Phase Type Start Date
0.00 0.00 0.00 0.00 0.00 0.000.00 0.00 0.00 0.00 0.00 0.00
NBio-CO2 Total CO2 CH4 N20 CO2e
Percent Reduction
0.00 0.00 0.00 0.00
Exhaust PM10
PM10 Total
Fugitive PM2.5
Exhaust PM2.5
PM2.5 Total
Bio- CO2ROG NOx CO SO2 Fugitive PM10
0.0000 0.00000.0000 0.0000 0.0000 0.0000Total 0.0000
0.0000 0.00000 0000 0.0000 0.0000 0 0000Area 0.0000
Total CO2 CH4 N2O CO2e
Category lb/day lb/day
PM10 Total
Fugitive PM2.5
Exhaust PM2.5
PM2.5 Total
Bio- CO2 NBio- CO2
ROG NOx CO SO2 Fugi ive PM10
Exhaust PM10

CO2ePM2.5 Total
Bio- CO2 NBio- CO2
Total CO2 CH4 N2OSO2 Fugitive PM10
Exhaust PM10
PM10 Total
Fugitive PM2.5
Exhaust PM2.5
2.5210 8,583.8179
Unmitigated Construction Off-Site
ROG NOx CO
5.4806 4.1138 9.5944 8,530.8776
8,530.8776
8,583.8179
Total 8.4924 107.4646 70.2462 0.0804 13.8054 4.4715 18.2769
4.1138 8,530.8776
8,530.8776
2.52100.0804 4.4715 4.4715 4.1138
0.0000 0.0000
Off-Road 8.4924 107.4646 70.2462
0.0000 13.8054 5.4806 0 0000 5.4806
Category lb/day lb/day
Fugitive Dust 13.8054
Bio- CO2 NBio- CO2
Total CO2 CH4 N2O CO2eFugitive PM10
Exhaust PM10
PM10 Total
Fugitive PM2.5
Exhaust PM2.5
PM2.5 Total
ROG NOx CO SO2
Use DPF for Construction Equipment
Water Exposed Area
Reduce Vehicle Speed on Unpaved Roads
Clean Paved Roads
3.2 Backpassing - 2014Unmitigated Construction On-Site
6.90 EMFAC_Mix HHDT
3.1 Mitigation Measures Construction
Backpassing 4 10.00 2.00 0.00 16.90
Worker Trip Length
Vendor Trip Length
Hauling Trip Length
Worker Vehicle Class
Vendor Vehicle Class
Hauling Vehicle Class
Trips and VMT
Phase Name Offroad Equipment Count
Worker Trip Number
Vendor Trip Number
Hauling Trip Number

0.0000 0.00000.0000 0.0000 0.0000 0.0000 0 0000 0.0000Hauling
Total CO2 CH4 N2O CO2e
Category lb/day lb/day
PM10 Total
Fugitive PM2.5
Exhaust PM2.5
PM2.5 Total
Bio- CO2 NBio- CO2
Mitigated Construction Off-Site
ROG NOx CO SO2 Fugitive PM10
Exhaust PM10
0.0000 8,530.8776
8,530.8776
2.5210 8,583.8179
4.2797 0.6707 4.9504 1.6990 0.6171 2.3161Total 8.4924 107.4646 70.2462 0.0804
0.0000 8,530.8776
8,530.8776
2.5210 8,583.8179
0.6707 0.6707 0.6171 0.6171Off-Road 8.4924 107.4646 70.2462 0.0804
0.0000 0.00004.2797 0.0000 4.2797 1.6990 0 0000 1.6990Fugitive Dust
Total CO2 CH4 N2O CO2e
Category lb/day lb/day
PM10 Total
Fugitive PM2.5
Exhaust PM2.5
PM2.5 Total
Bio- CO2 NBio- CO2
Mitigated Construction On-Site
ROG NOx CO SO2 Fugitive PM10
Exhaust PM10
237.7717 237.7717 8.7800e-003
237.95600.1427 8.7000e-003
0.1514 0.0382 8.0000e-003
0.0462Total 0.2835 0.5110 1.2700 2.5000e-003
182.1798 182.1798 8.2400e-003
182.35270.1306 3.9200e-003
0.1346 0.0349 3.6000e-003
0.0385Worker 0.2375 0.2316 0.9264 1.9600e-003
55.5919 55.5919 5.4000e-004
55.60330.0120 4.7800e-003
0.0168 3.3000e-003
4.4000e-003
7.7000e-003
Vendor 0.0460 0.2794 0.3436 5.4000e-004
0.0000 0.00000.0000 0.0000 0.0000 0.0000 0 0000 0.0000
Category lb/day lb/day
Hauling
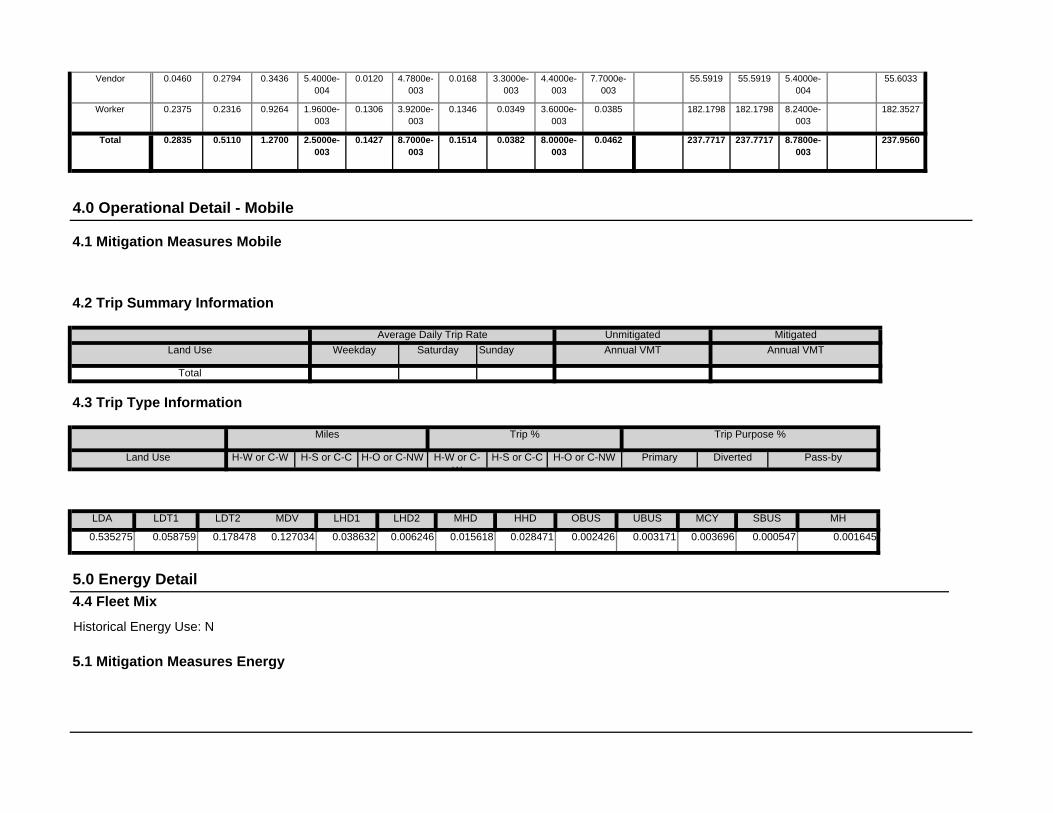
4.4 Fleet MixHistorical Energy Use: N
5.1 Mitigation Measures Energy
0.002426 0.003171 0.003696 0.000547 0.001645
5.0 Energy Detail
SBUS MH
0.535275 0.058759 0.178478 0.127034 0.038632 0.006246 0.015618 0.028471
LHD2 MHD HHD OBUS UBUS MCY
H-S or C-C H-O or C-NW Primary Diverted Pass-by
LDA LDT1 LDT2 MDV LHD1
4.3 Trip Type Information
Miles Trip % Trip Purpose %
Land Use H-W or C-W H-S or C-C H-O or C-NW H-W or C-W
Total
MitigatedLand Use Weekday Saturday Sunday Annual VMT Annual VMT
4.0 Operational Detail - Mobile
4.1 Mitigation Measures Mobile
4.2 Trip Summary Information
Average Daily Trip Rate Unmitigated
237.7717 237.7717 8.7800e-003
237.95600.1427 8.7000e-003
0.1514 0.0382 8.0000e-003
0.0462Total 0.2835 0.5110 1.2700 2.5000e-003
182.1798 182.1798 8.2400e-003
182.35270.1306 3.9200e-003
0.1346 0.0349 3.6000e-003
0.0385Worker 0.2375 0.2316 0.9264 1.9600e-003
55.5919 55.5919 5.4000e-004
55.60330.0120 4.7800e-003
0.0168 3.3000e-003
4.4000e-003
7.7000e-003
Vendor 0.0460 0.2794 0.3436 5.4000e-004

Mitigated
0.0000 0.00000.0000 0.0000 0.0000 0.0000Total 0.0000
0.0000 0.00000 0000 0.0000 0.0000 0 0000Architectural Coating
0.0000
0.0000 0.00000 0000 0.0000 0.0000 0 0000Consumer Products
0.0000
Total CO2 CH4 N2O CO2e
SubCategory lb/day lb/day
PM10 Total
Fugitive PM2.5
Exhaust PM2.5
PM2.5 Total
Bio- CO2 NBio- CO2
6.2 Area by SubCategoryUnmitigated
ROG NOx CO SO2 Fugi ive PM10
Exhaust PM10
0.0000 0.00000 0000 0.0000 0.0000 0 0000Unmitigated 0.0000
0.0000 0.00000 0000 0.0000 0.0000 0 0000
CO2e
Category lb/day lb/day
Mitigated 0.0000
PM2.5 Total
Bio- CO2 NBio- CO2
Total CO2 CH4 N2OSO2 Fugi ive PM10
Exhaust PM10
PM10 Total
Fugitive PM2.5
Exhaust PM2.5
6.0 Area Detail
6.1 Mitigation Measures Area
ROG NOx CO
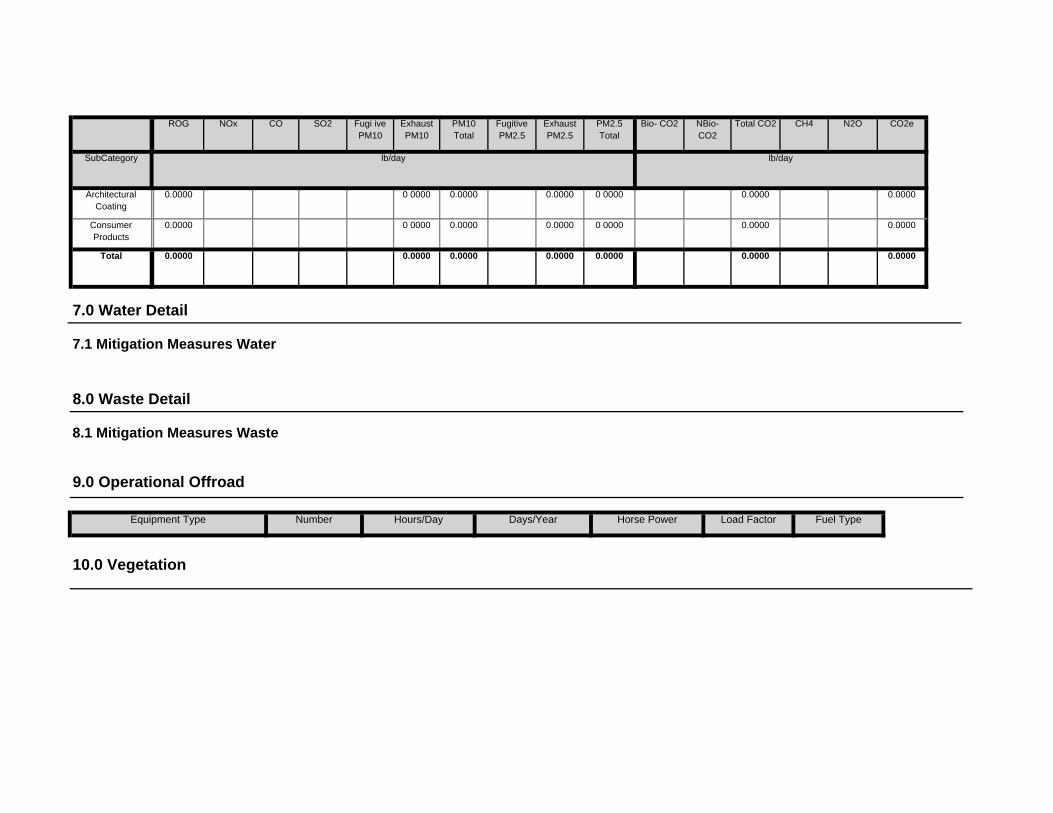
Hours/Day Days/Year Horse Power Load Factor Fuel Type
10.0 Vegetation
7.0 Water Detail
7.1 Mitigation Measures Water
8.0 Waste Detail
8.1 Mitigation Measures Waste
9.0 Operational Offroad
Equipment Type Number
0.0000 0.00000.0000 0.0000 0.0000 0.0000Total 0.0000
0.0000 0.00000 0000 0.0000 0.0000 0 0000Consumer Products
0.0000
0.0000 0.00000 0000 0.0000 0.0000 0 0000Architectural Coating
0.0000
Total CO2 CH4 N2O CO2e
SubCategory lb/day lb/day
PM10 Total
Fugitive PM2.5
Exhaust PM2.5
PM2.5 Total
Bio- CO2 NBio- CO2
ROG NOx CO SO2 Fugi ive PM10
Exhaust PM10

tblConstEquipMitigation DPF No Change Level 3
tblConstEquipMitigation DPF No Change Level 3
Off-road Equipment - project specific information
Off-road Equipment -
Trips and VMT - project specific information5 personnelGrading -
Construction Off-road Equipment Mitigation - project specific information
Table Name Column Name Default Value New Value
N2O Intensity (lb/MWhr)
0
1.3 User Entered Comments & Non-Default Data
Project Characteristics -
Land Use -
Construction Phase - project specific information
Utility Company
CO2 Intensity (lb/MWhr)
0 CH4 Intensity (lb/MWhr)
0
Precipitation Freq (Days) 33
Climate Zone 8 Operational Year 2014
1.1 Land Usage
1.2 Other Project Characteristics
Urbanization Urban Wind Speed (m/s) 2.2
CalEEMod Version: CalEEMod.2013.2.1 Page 1 of 1 Date: 9/30/2013 5:42 PM
Broad Beach - BackpassingLos Angeles-South Coast County, Winter
1.0 Project Characteristics
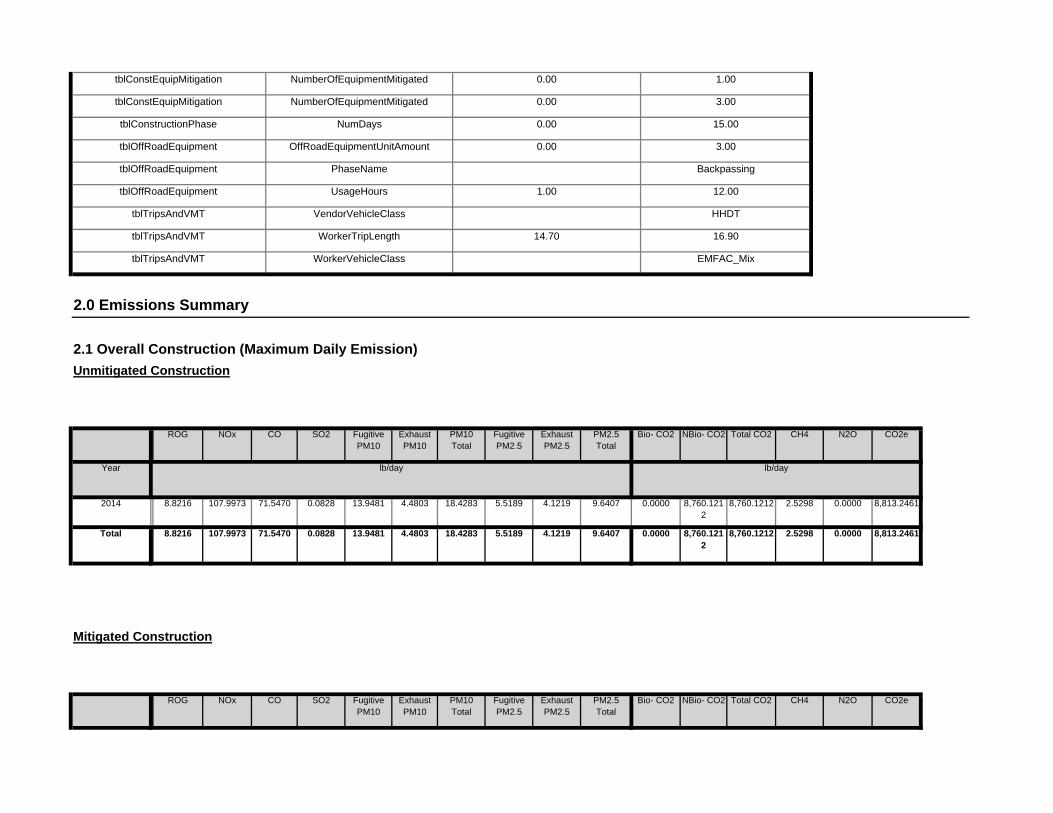
Total CO2 CH4 N2O CO2ePM10 Total
Fugitive PM2.5
Exhaust PM2.5
PM2.5 Total
Bio- CO2 NBio- CO2
Mitigated Construction
ROG NOx CO SO2 Fugitive PM10
Exhaust PM10
0.0000 8,760.1212
8,760.1212 2.5298 0.0000 8,813.246113.9481 4.4803 18.4283 5.5189 4.1219 9.6407Total 8.8216 107.9973 71.5470 0.0828
0.0000 8,760.1212
8,760.1212 2.5298 0.0000 8,813.246113.9481 4.4803 18.4283 5.5189 4.1219 9.64072014 8.8216 107.9973 71.5470 0.0828
CH4 N2O CO2e
Year lb/day lb/day
Fugitive PM2.5
Exhaust PM2.5
PM2.5 Total
Bio- CO2 NBio- CO2 Total CO2
Unmitigated Construction
ROG NOx CO SO2 Fugitive PM10
Exhaust PM10
PM10 Total
tblTripsAndVMT WorkerVehicleClass EMFAC_Mix
2.0 Emissions Summary
2.1 Overall Construction (Maximum Daily Emission)
tblTripsAndVMT VendorVehicleClass HHDT
tblTripsAndVMT WorkerTripLength 14.70 16.90
tblOffRoadEquipment PhaseName Backpassing
tblOffRoadEquipment UsageHours 1.00 12.00
tblConstructionPhase NumDays 0.00 15.00
tblOffRoadEquipment OffRoadEquipmentUnitAmount 0.00 3.00
tblConstEquipMitigation NumberOfEquipmentMitigated 0.00 1.00
tblConstEquipMitigation NumberOfEquipmentMitigated 0.00 3.00
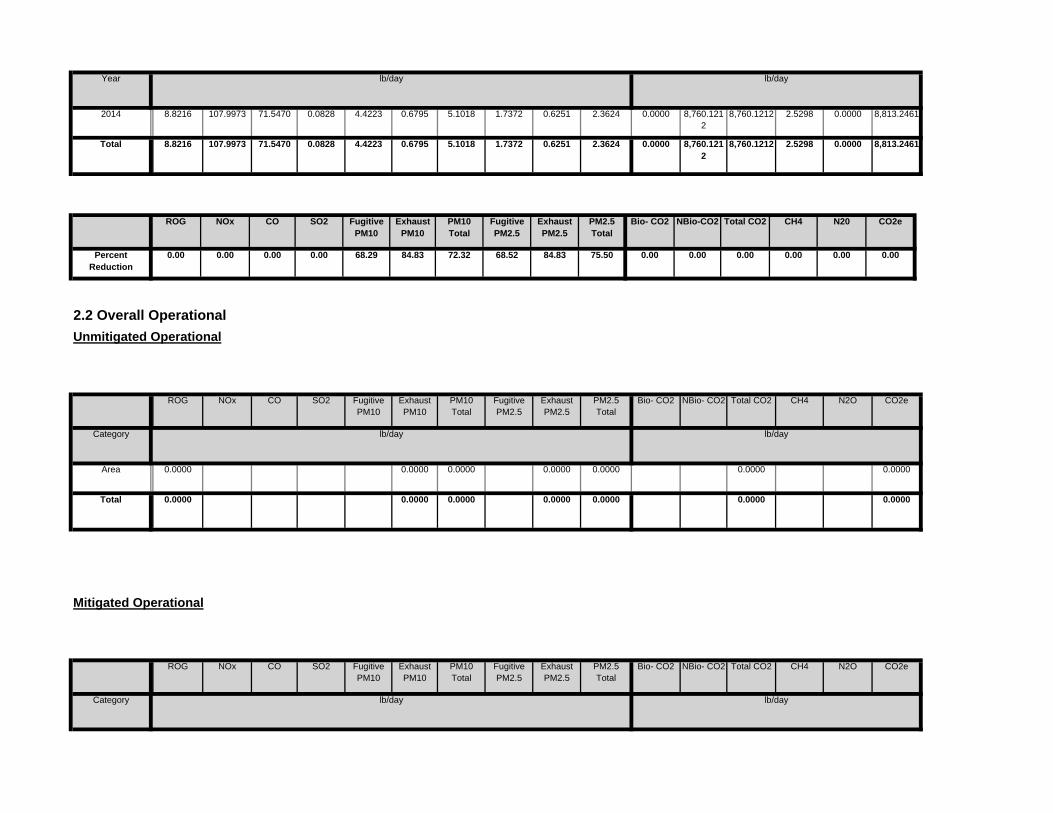
Total CO2 CH4 N2O CO2e
Category lb/day lb/day
PM10 Total
Fugitive PM2.5
Exhaust PM2.5
PM2.5 Total
Bio- CO2 NBio- CO2
Mitigated Operational
ROG NOx CO SO2 Fugitive PM10
Exhaust PM10
0.0000 0.00000.0000 0.0000 0.0000 0.0000Total 0.0000
0.0000 0.00000.0000 0.0000 0.0000 0.0000Area 0.0000
Total CO2 CH4 N2O CO2e
Category lb/day lb/day
PM10 Total
Fugitive PM2.5
Exhaust PM2.5
PM2.5 Total
Bio- CO2 NBio- CO2
2.2 Overall OperationalUnmitigated Operational
ROG NOx CO SO2 Fugitive PM10
Exhaust PM10
0.00 0.00 0.00 0.00 0.00 0.0068.29 84.83 72.32 68.52 84.83 75.50
NBio-CO2 Total CO2 CH4 N20 CO2e
Percent Reduction
0.00 0.00 0.00 0.00
Exhaust PM10
PM10 Total
Fugitive PM2.5
Exhaust PM2.5
PM2.5 Total
Bio- CO2ROG NOx CO SO2 Fugitive PM10
0.0000 8,760.1212
8,760.1212 2.5298 0.0000 8,813.24614.4223 0.6795 5.1018 1.7372 0.6251 2.3624Total 8.8216 107.9973 71.5470 0.0828
0.0000 8,760.1212
8,760.1212 2.5298 0.0000 8,813.24614.4223 0.6795 5.1018 1.7372 0.6251 2.36242014 8.8216 107.9973 71.5470 0.0828
Year lb/day lb/day

Worker Trip Length
Vendor Trip Length
Hauling Trip Length
Worker Vehicle Class
Vendor Vehicle Class
Hauling Vehicle Class
Trips and VMT
Phase Name Offroad Equipment Count
Worker Trip Number
Vendor Trip Number
Hauling Trip Number
Backpassing Scrapers 3 12.00 361 0.48
Load Factor
Backpassing Rubber Tired Dozers 1 12.00 255 0.40
OffRoad Equipment
Phase Name Offroad Equipment Type Amount Usage Hours Horse Power
15
Acres of Grading (Site Preparation Phase): 0
Acres of Grading (Grading Phase): 0
Acres of Paving: 0
Residential Indoor: 0; Residential Outdoor: 0; Non-Residential Indoor: 0; Non-Residential Outdoor: 0 (Architectural Coating – sqft)
End Date Num Days Week
Num Days Phase Description
1 Backpassing Grading 9/15/2014 10/3/2014 5
3.0 Construction Detail
Construction Phase
Phase Number
Phase Name Phase Type Start Date
0.00 0.00 0.00 0.00 0.00 0.000.00 0.00 0.00 0.00 0.00 0.00
NBio-CO2 Total CO2 CH4 N20 CO2e
Percent Reduction
0.00 0.00 0.00 0.00
Exhaust PM10
PM10 Total
Fugitive PM2.5
Exhaust PM2.5
PM2.5 Total
Bio- CO2ROG NOx CO SO2 Fugitive PM10
0.0000 0.00000.0000 0.0000 0.0000 0.0000Total 0.0000
0.0000 0.00000.0000 0.0000 0.0000 0.0000Area 0.0000
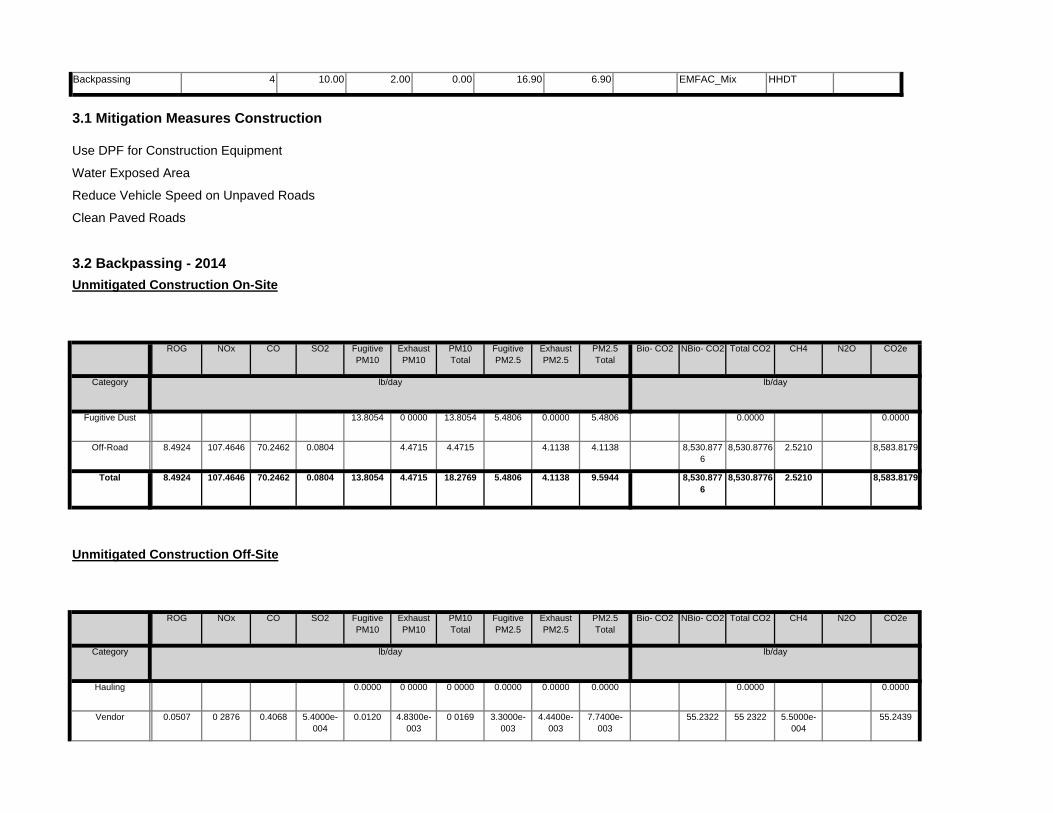
55.2322 55 2322 5.5000e-004
55.24390.0120 4.8300e-003
0 0169 3.3000e-003
4.4400e-003
7.7400e-003
Vendor 0.0507 0 2876 0.4068 5.4000e-004
0.0000 0.00000.0000 0 0000 0 0000 0.0000 0.0000 0.0000
CO2e
Category lb/day lb/day
Hauling
PM2.5 Total
Bio- CO2 NBio- CO2 Total CO2 CH4 N2OSO2 Fugitive PM10
Exhaust PM10
PM10 Total
Fugitive PM2.5
Exhaust PM2.5
2.5210 8,583.8179
Unmitigated Construction Off-Site
ROG NOx CO
5.4806 4.1138 9.5944 8,530.8776
8,530.8776
8,583.8179
Total 8.4924 107.4646 70.2462 0.0804 13.8054 4.4715 18.2769
4.1138 8,530.8776
8,530.8776 2.52100.0804 4.4715 4.4715 4.1138
0.0000 0.0000
Off-Road 8.4924 107.4646 70.2462
0 0000 13.8054 5.4806 0.0000 5.4806
Category lb/day lb/day
Fugitive Dust 13.8054
Bio- CO2 NBio- CO2 Total CO2 CH4 N2O CO2eFugitive PM10
Exhaust PM10
PM10 Total
Fugitive PM2.5
Exhaust PM2.5
PM2.5 Total
ROG NOx CO SO2
Use DPF for Construction Equipment
Water Exposed Area
Reduce Vehicle Speed on Unpaved Roads
Clean Paved Roads
3.2 Backpassing - 2014Unmitigated Construction On-Site
6.90 EMFAC_Mix HHDT
3.1 Mitigation Measures Construction
Backpassing 4 10.00 2.00 0.00 16.90

229.2436 229.2436 8.7900e-003
229.42820.1427 8.7600e-003
0.1514 0.0382 8.0500e-003
0.0463Total 0.3292 0.5327 1.3008 2.4100e-003
174 0114 174.0114 8.2400e-003
174.18440.1306 3.9300e-003
0.1346 0.0349 3.6100e-003
0.0385Worker 0.2785 0 2452 0.8940 1.8700e-003
55.2322 55 2322 5.5000e-004
55.24390.0120 4.8300e-003
0 0169 3.3000e-003
4.4400e-003
7.7400e-003
Vendor 0.0507 0 2876 0.4068 5.4000e-004
0.0000 0.00000.0000 0 0000 0 0000 0.0000 0.0000 0.0000Hauling
Total CO2 CH4 N2O CO2e
Category lb/day lb/day
PM10 Total
Fugitive PM2.5
Exhaust PM2.5
PM2.5 Total
Bio- CO2 NBio- CO2
Mitigated Construction Off-Site
ROG NOx CO SO2 Fugitive PM10
Exhaust PM10
0.0000 8,530.8776
8,530.8776 2.5210 8,583.81794.2797 0.6707 4.9504 1.6990 0.6171 2.3161Total 8.4924 107.4646 70.2462 0.0804
0.0000 8,530.8776
8,530.8776 2.5210 8,583.81790.6707 0.6707 0.6171 0.6171Off-Road 8.4924 107.4646 70.2462 0.0804
0.0000 0.00004.2797 0 0000 4 2797 1.6990 0.0000 1.6990Fugitive Dust
Total CO2 CH4 N2O CO2e
Category lb/day lb/day
PM10 Total
Fugitive PM2.5
Exhaust PM2.5
PM2.5 Total
Bio- CO2 NBio- CO2
Mitigated Construction On-Site
ROG NOx CO SO2 Fugitive PM10
Exhaust PM10
229.2436 229.2436 8.7900e-003
229.42820.1427 8.7600e-003
0.1514 0.0382 8.0500e-003
0.0463Total 0.3292 0.5327 1.3008 2.4100e-003
174 0114 174.0114 8.2400e-003
174.18440.1306 3 9300e-003
0.1346 0.0349 3.6100e-003
0.0385Worker 0.2785 0 2452 0.8940 1.8700e-003

4.4 Fleet MixHistorical Energy Use: N
5.1 Mitigation Measures Energy
6.0 Area Detail
6.1 Mitigation Measures Area
0.002426 0.003171 0.003696 0.000547 0.001645
5.0 Energy Detail
SBUS MH
0.535275 0.058759 0.178478 0.127034 0.038632 0.006246 0.015618 0.028471
LHD2 MHD HHD OBUS UBUS MCY
H-S or C-C H-O or C-NW Pr mary Diverted Pass-by
LDA LDT1 LDT2 MDV LHD1
4.3 Trip Type Information
Miles Trip % Trip Purpose %
Land Use H-W or C-W H-S or C-C H-O or C-NW H-W or C-W
Total
MitigatedLand Use Weekday Saturday Sunday Annual VMT Annual VMT
4.0 Operational Detail - Mobile
4.1 Mitigation Measures Mobile
4.2 Trip Summary Information
Average Daily Trip Rate Unmitigated

0.0000 0.00000.0000 0.0000 0.0000 0.0000Consumer Products
0.0000
0.0000 0.00000.0000 0.0000 0.0000 0.0000Architectural Coating
0.0000
Total CO2 CH4 N2O CO2e
SubCategory lb/day lb/day
PM10 Total
Fugitive PM2.5
Exhaust PM2.5
PM2.5 Total
Bio- CO2 NBio- CO2
Mitigated
ROG NOx CO SO2 Fugitive PM10
Exhaust PM10
0.0000 0.00000.0000 0.0000 0.0000 0.0000Total 0.0000
0.0000 0.00000.0000 0.0000 0.0000 0.0000Architectural Coating
0.0000
0.0000 0.00000.0000 0.0000 0.0000 0.0000Consumer Products
0.0000
Total CO2 CH4 N2O CO2e
SubCategory lb/day lb/day
PM10 Total
Fugitive PM2.5
Exhaust PM2.5
PM2.5 Total
Bio- CO2 NBio- CO2
6.2 Area by SubCategoryUnmitigated
ROG NOx CO SO2 Fugitive PM10
Exhaust PM10
0.0000 0.00000.0000 0.0000 0.0000 0.0000Unmitigated 0.0000
0.0000 0.00000.0000 0.0000 0.0000 0.0000
CO2e
Category lb/day lb/day
Mitigated 0.0000
PM2.5 Total
Bio- CO2 NBio- CO2 Total CO2 CH4 N2OSO2 Fugitive PM10
Exhaust PM10
PM10 Total
Fugitive PM2.5
Exhaust PM2.5
ROG NOx CO

Hours/Day Days/Year Horse Power Load Factor Fuel Type
10.0 Vegetation
7.0 Water Detail
7.1 Mitigation Measures Water
8.0 Waste Detail
8.1 Mitigation Measures Waste
9.0 Operational Offroad
Equipment Type Number
0.0000 0.00000.0000 0.0000 0.0000 0.0000Total 0.0000

tblConstEquipMitigation DPF No Change Level 3
tblConstEquipMitigation DPF No Change Level 3
tblConstEquipMitigation DPF No Change Level 3
tblConstEquipMitigation DPF No Change Level 3
Off-road Equipment -
Off-road Equipment - project specific information
Trips and VMT - project specific information
Grading -
Construction Off-road Equipment Mitigation - project specific information
Table Name Column Name Default Value New Value
N2O Intensity (lb/MWhr)
0
1.3 User Entered Comments & Non-Default Data
Project Characteristics -
Land Use -
Construction Phase - project specific information
Utility Company
CO2 Intensity (lb/MWhr)
0 CH4 Intensity (lb/MWhr)
0
Precipitation Freq (Days) 33
Climate Zone 8 Operational Year 2023
1.1 Land Usage
1.2 Other Project Characteristics
Urbanization Urban Wind Speed (m/s) 2.2
CalEEMod Version: CalEEMod.2013.2.1 Page 1 of 1 Date: 9/30/2013 5:51 PM
Broad Beach - RenourishmentLos Angeles-South Coast County, Annual
1.0 Project Characteristics
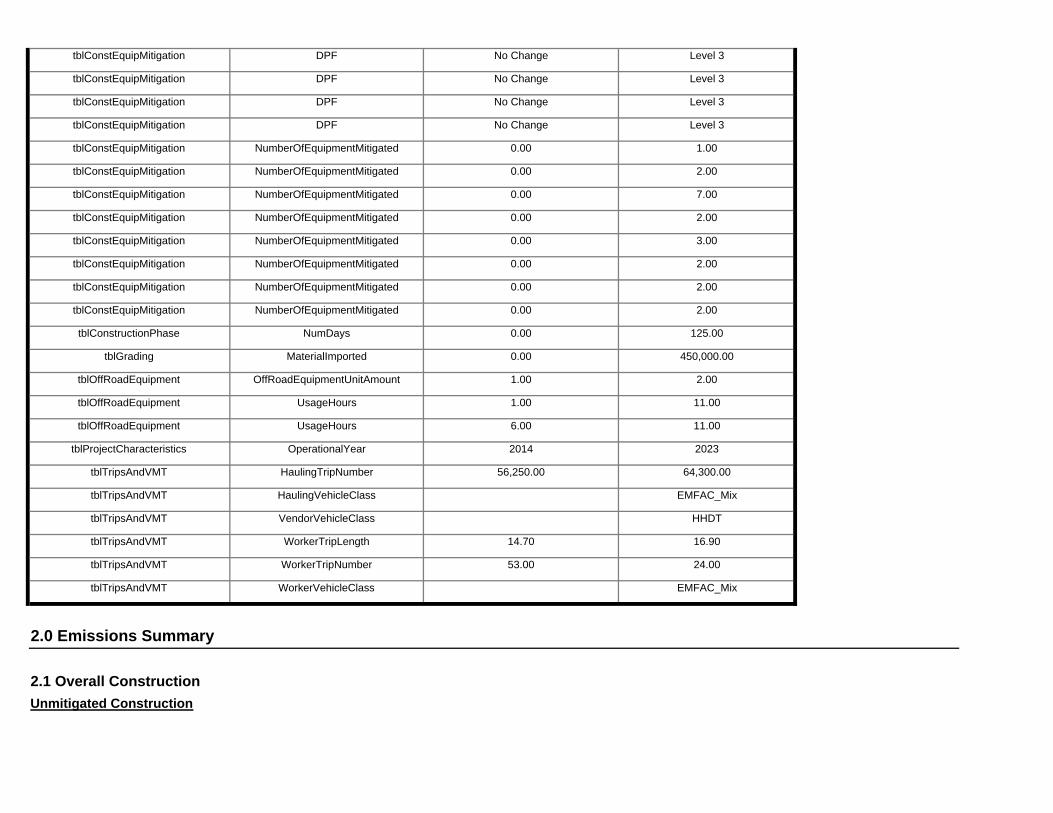
2.0 Emissions Summary
2.1 Overall ConstructionUnmitigated Construction
tblTripsAndVMT WorkerTripNumber 53.00 24.00
tblTripsAndVMT WorkerVehicleClass EMFAC_Mix
tblTripsAndVMT VendorVehicleClass HHDT
tblTripsAndVMT WorkerTripLength 14.70 16.90
tblTripsAndVMT HaulingTripNumber 56,250.00 64,300.00
tblTripsAndVMT HaulingVehicleClass EMFAC_Mix
tblOffRoadEquipment UsageHours 6.00 11.00
tblProjectCharacteristics OperationalYear 2014 2023
tblOffRoadEquipment OffRoadEquipmentUnitAmount 1.00 2.00
tblOffRoadEquipment UsageHours 1.00 11.00
tblConstructionPhase NumDays 0.00 125.00
tblGrading MaterialImported 0.00 450,000.00
tblConstEquipMitigation NumberOfEquipmentMitigated 0.00 2.00
tblConstEquipMitigation NumberOfEquipmentMitigated 0.00 2.00
tblConstEquipMitigation NumberOfEquipmentMitigated 0.00 3.00
tblConstEquipMitigation NumberOfEquipmentMitigated 0.00 2.00
tblConstEquipMitigation NumberOfEquipmentMitigated 0.00 7.00
tblConstEquipMitigation NumberOfEquipmentMitigated 0.00 2.00
tblConstEquipMitigation NumberOfEquipmentMitigated 0.00 1.00
tblConstEquipMitigation NumberOfEquipmentMitigated 0.00 2.00
tblConstEquipMitigation DPF No Change Level 3
tblConstEquipMitigation DPF No Change Level 3
tblConstEquipMitigation DPF No Change Level 3
tblConstEquipMitigation DPF No Change Level 3
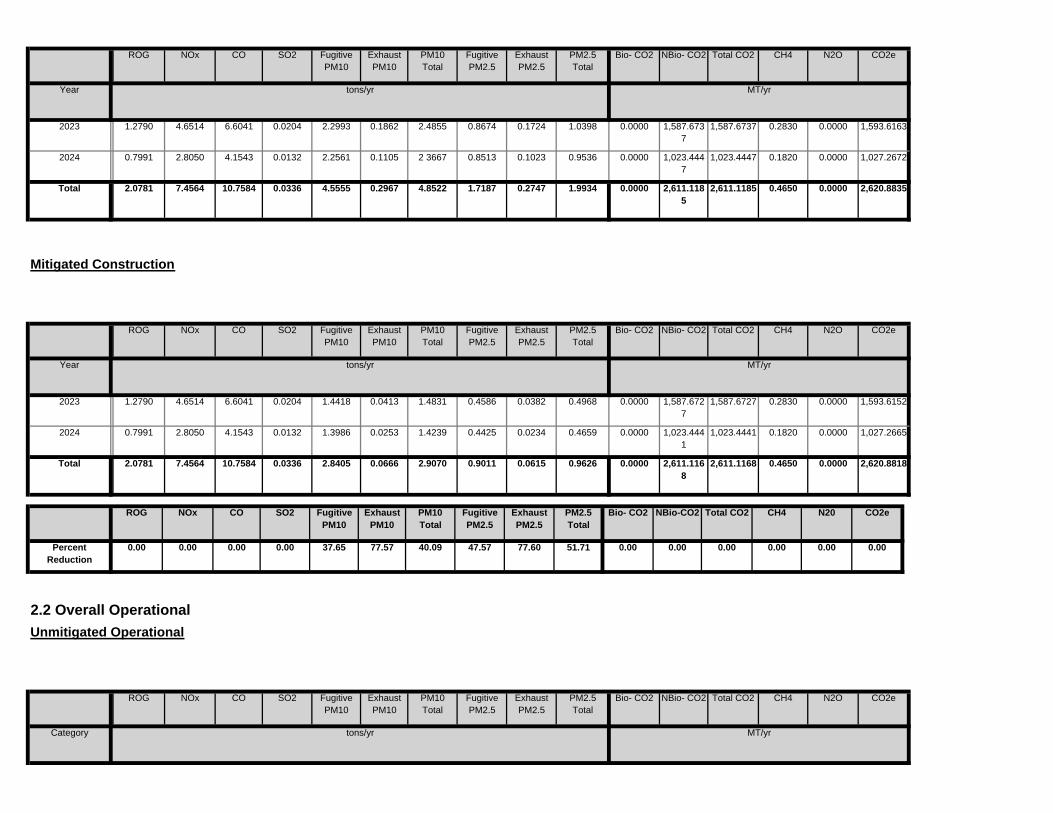
Total CO2 CH4 N2O CO2e
Category tons/yr MT/yr
PM10 Total
Fugitive PM2.5
Exhaust PM2.5
PM2.5 Total
Bio- CO2 NBio- CO2
2.2 Overall OperationalUnmitigated Operational
ROG NOx CO SO2 Fugitive PM10
Exhaust PM10
0.00 0.00 0.00 0.00 0.00 0.0037.65 77.57 40.09 47.57 77.60 51.71
NBio-CO2 Total CO2 CH4 N20 CO2e
Percent Reduction
0.00 0.00 0.00 0.00
Exhaust PM10
PM10 Total
Fugitive PM2.5
Exhaust PM2.5
PM2.5 Total
Bio- CO2ROG NOx CO SO2 Fugitive PM10
0.0000 2,611.1168
2,611.1168 0.4650 0.0000 2,620.88182.8405 0.0666 2.9070 0.9011 0.0615 0.9626Total 2.0781 7.4564 10.7584 0.0336
0.0000 1,023.4441
1,023.4441 0.1820 0.0000 1,027.26651.3986 0.0253 1.4239 0.4425 0.0234 0.46592024 0.7991 2.8050 4.1543 0.0132
0.0000 1,587.6727
1,587.6727 0.2830 0.0000 1,593.61521.4418 0.0413 1.4831 0.4586 0.0382 0.49682023 1.2790 4.6514 6.6041 0.0204
Total CO2 CH4 N2O CO2e
Year tons/yr MT/yr
PM10 Total
Fugitive PM2.5
Exhaust PM2.5
PM2.5 Total
Bio- CO2 NBio- CO2
Mitigated Construction
ROG NOx CO SO2 Fugitive PM10
Exhaust PM10
0.0000 2,611.1185
2,611.1185 0.4650 0.0000 2,620.88354.5555 0.2967 4.8522 1.7187 0.2747 1.9934Total 2.0781 7.4564 10.7584 0.0336
0.0000 1,023.4447
1,023.4447 0.1820 0.0000 1,027.26722.2561 0.1105 2 3667 0.8513 0.1023 0.95362024 0.7991 2.8050 4.1543 0.0132
0.0000 1,587.6737
1,587.6737 0.2830 0.0000 1,593.61632.2993 0.1862 2.4855 0.8674 0.1724 1.03982023 1.2790 4.6514 6.6041 0.0204
NBio- CO2 Total CO2 CH4 N2O CO2e
Year tons/yr MT/yr
Exhaust PM10
PM10 Total
Fugitive PM2.5
Exhaust PM2.5
PM2.5 Total
Bio- CO2ROG NOx CO SO2 Fugitive PM10

125
Acres of Grading (Site Preparation Phase): 0
Acres of Grading (Grading Phase): 0
Acres of Paving: 0
End Date Num Days Week
Num Days Phase Description
1 Renourishment Grading 9/15/2023 3/7/2024 5
3.0 Construction Detail
Construction Phase
Phase Number
Phase Name Phase Type Start Date
0.00 0.00 0.00 0.00 0.00 0.000.00 0.00 0.00 0.00 0.00 0.00
NBio-CO2 Total CO2 CH4 N20 CO2e
Percent Reduction
0.00 0.00 0.00 0.00
Exhaust PM10
PM10 Total
Fugitive PM2.5
Exhaust PM2.5
PM2.5 Total
Bio- CO2ROG NOx CO SO2 Fugitive PM10
0.0000 0.0000 0.0000 0.0000 0.0000 0.00000.0000 0.0000 0.0000 0.0000Total 0.0000
0.0000 0.0000 0.0000 0.0000 0.0000 0.00000.0000 0 0000 0.0000 0.0000Area 0.0000
Total CO2 CH4 N2O CO2e
Category tons/yr MT/yr
PM10 Total
Fugitive PM2.5
Exhaust PM2.5
PM2.5 Total
Bio- CO2 NBio- CO2
Mitigated Operational
ROG NOx CO SO2 Fugitive PM10
Exhaust PM10
0.0000 0.0000 0.0000 0.0000 0.0000 0.00000.0000 0.0000 0.0000 0.0000Total 0.0000
0.0000 0.0000 0.0000 0.0000 0.0000 0.00000.0000 0 0000 0.0000 0.0000Area 0.0000
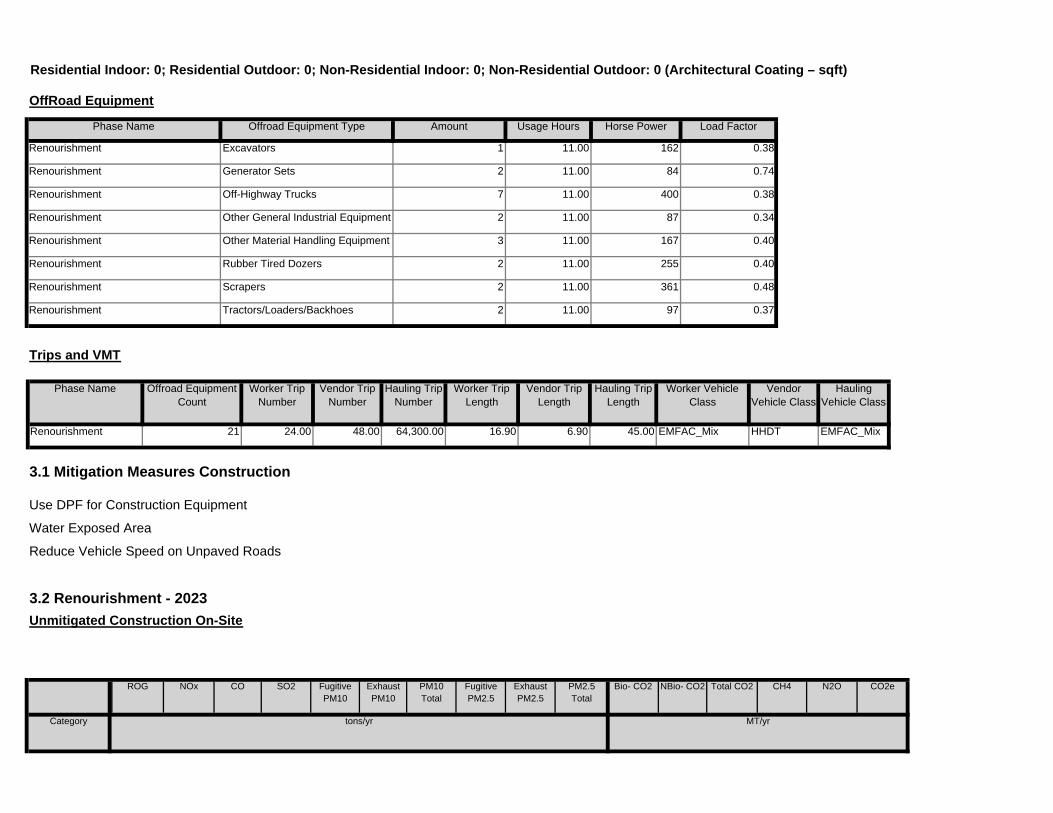
CO2e
Category tons/yr MT/yr
PM2.5 Total
Bio- CO2 NBio- CO2 Total CO2 CH4 N2OSO2 Fugitive PM10
Exhaust PM10
PM10 Total
Fugitive PM2.5
Exhaust PM2.5
Use DPF for Construction Equipment
Water Exposed Area
Reduce Vehicle Speed on Unpaved Roads
3.2 Renourishment - 2023Unmitigated Construction On-Site
ROG NOx CO
6.90 45.00 EMFAC_Mix HHDT EMFAC_Mix
3.1 Mitigation Measures Construction
Renourishment 21 24.00 48.00 64,300.00 16.90
Worker Trip Length
Vendor Trip Length
Hauling Trip Length
Worker Vehicle Class
Vendor Vehicle Class
Hauling Vehicle Class
Trips and VMT
Phase Name Offroad Equipment Count
Worker Trip Number
Vendor Trip Number
Hauling Trip Number
Renourishment Tractors/Loaders/Backhoes 2 11.00 97 0.37
Renourishment Scrapers 2 11.00 361 0.48
Renourishment Rubber Tired Dozers 2 11.00 255 0.40
Renourishment Other Material Handling Equipment 3 11.00 167 0.40
Renourishment Other General Industrial Equipment 2 11.00 87 0.34
Renourishment Off-Highway Trucks 7 11.00 400 0.38
Renourishment Generator Sets 2 11.00 84 0.74
Load Factor
Renourishment Excavators 1 11.00 162 0.38
OffRoad Equipment
Phase Name Offroad Equipment Type Amount Usage Hours Horse Power
Residential Indoor: 0; Residential Outdoor: 0; Non-Residential Indoor: 0; Non-Residential Outdoor: 0 (Architectural Coating – sqft)

0.0000 855.7354 855.7354 0.2603 0.0000 861.20080.3853 0.0256 0.4108 0.1837 0.0237 0.2074Total 0.4629 3.9920 4.0961 9.7600e-003
0.0000 855.7354 855.7354 0.2603 0.0000 861.20080.0256 0.0256 0.0237 0.0237Off-Road 0.4629 3.9920 4.0961 9.7600e-003
0.0000 0 0000 0.0000 0.0000 0.0000 0.00000.3853 0.0000 0.3853 0.1837 0.0000 0.1837Fugitive Dust
Total CO2 CH4 N2O CO2e
Category tons/yr MT/yr
PM10 Total
Fugitive PM2.5
Exhaust PM2.5
PM2.5 Total
Bio- CO2 NBio- CO2
Mitigated Construction On-Site
ROG NOx CO SO2 Fugitive PM10
Exhaust PM10
0.0000 731.9374 731.9374 0.0227 0.0000 732.41451.0566 0.0157 1.0723 0.2750 0.0145 0.2894Total 0.8160 0.6594 2.5080 0.0106
0.0000 12.0406 12.0406 4.0000e-004
0.0000 12.04890.0117 2.4000e-004
0.0119 3.1400e-003
2.2000e-004
3.3500e-003
Worker 0.0143 0.0104 0.0437 1.8000e-004
0.0000 41.2031 41.2031 3.5000e-004
0.0000 41.21050.0108 2.3600e-003
0.0132 2.9700e-003
2.1700e-003
5.1400e-003
Vendor 0.0209 0.0940 0.2670 4.9000e-004
0.0000 678.6937 678.6937 0.0220 0.0000 679.15511.0341 0.0131 1.0472 0.2688 0.0121 0.2809Hauling 0.7809 0.5550 2.1973 9.9400e-003
Total CO2 CH4 N2O CO2e
Category tons/yr MT/yr
PM10 Total
Fugitive PM2.5
Exhaust PM2.5
PM2.5 Total
Bio- CO2 NBio- CO2
Unmitigated Construction Off-Site
ROG NOx CO SO2 Fugitive PM10
Exhaust PM10
0.0000 855.7364 855.7364 0.2603 0.0000 861.20181.2428 0.1705 1.4133 0.5925 0.1579 0.7504Total 0.4629 3.9920 4.0961 9.7600e-003
0.0000 855.7364 855.7364 0.2603 0.0000 861.20180.1705 0.1705 0.1579 0.1579Off-Road 0.4629 3.9920 4.0961 9.7600e-003
0.0000 0 0000 0.0000 0.0000 0.0000 0.00001.2428 0.0000 1.2428 0.5925 0.0000 0.5925Fugitive Dust

Total CO2 CH4 N2O CO2ePM10 Total
Fugitive PM2.5
Exhaust PM2.5
PM2.5 Total
Bio- CO2 NBio- CO2
Unmitigated Construction Off-Site
ROG NOx CO SO2 Fugitive PM10
Exhaust PM10
0.0000 551.7696 551.7696 0.1677 0.0000 555.29091.2428 0.1003 1.3431 0.5925 0.0929 0.6854Total 0.2875 2.3871 2.5941 6.2900e-003
0.0000 551.7696 551.7696 0.1677 0.0000 555.29090.1003 0.1003 0.0929 0.0929Off-Road 0.2875 2.3871 2.5941 6.2900e-003
0.0000 0 0000 0.0000 0.0000 0.0000 0.00001.2428 0.0000 1.2428 0.5925 0.0000 0.5925Fugitive Dust
Total CO2 CH4 N2O CO2e
Category tons/yr MT/yr
PM10 Total
Fugitive PM2.5
Exhaust PM2.5
PM2.5 Total
Bio- CO2 NBio- CO2
3.2 Renourishment - 2024Unmitigated Construction On-Site
ROG NOx CO SO2 Fugitive PM10
Exhaust PM10
0.0000 731.9374 731.9374 0.0227 0.0000 732.41451.0566 0.0157 1.0723 0.2750 0.0145 0.2894Total 0.8160 0.6594 2.5080 0.0106
0.0000 12.0406 12.0406 4.0000e-004
0.0000 12.04890.0117 2.4000e-004
0.0119 3.1400e-003
2.2000e-004
3.3500e-003
Worker 0.0143 0.0104 0.0437 1.8000e-004
0.0000 41.2031 41.2031 3.5000e-004
0.0000 41.21050.0108 2.3600e-003
0.0132 2.9700e-003
2.1700e-003
5.1400e-003
Vendor 0.0209 0.0940 0.2670 4.9000e-004
0.0000 678.6937 678.6937 0.0220 0.0000 679.15511.0341 0.0131 1.0472 0.2688 0.0121 0.2809Hauling 0.7809 0.5550 2.1973 9.9400e-003
Total CO2 CH4 N2O CO2e
Category tons/yr MT/yr
PM10 Total
Fugitive PM2.5
Exhaust PM2.5
PM2.5 Total
Bio- CO2 NBio- CO2
Mitigated Construction Off-Site
ROG NOx CO SO2 Fugitive PM10
Exhaust PM10
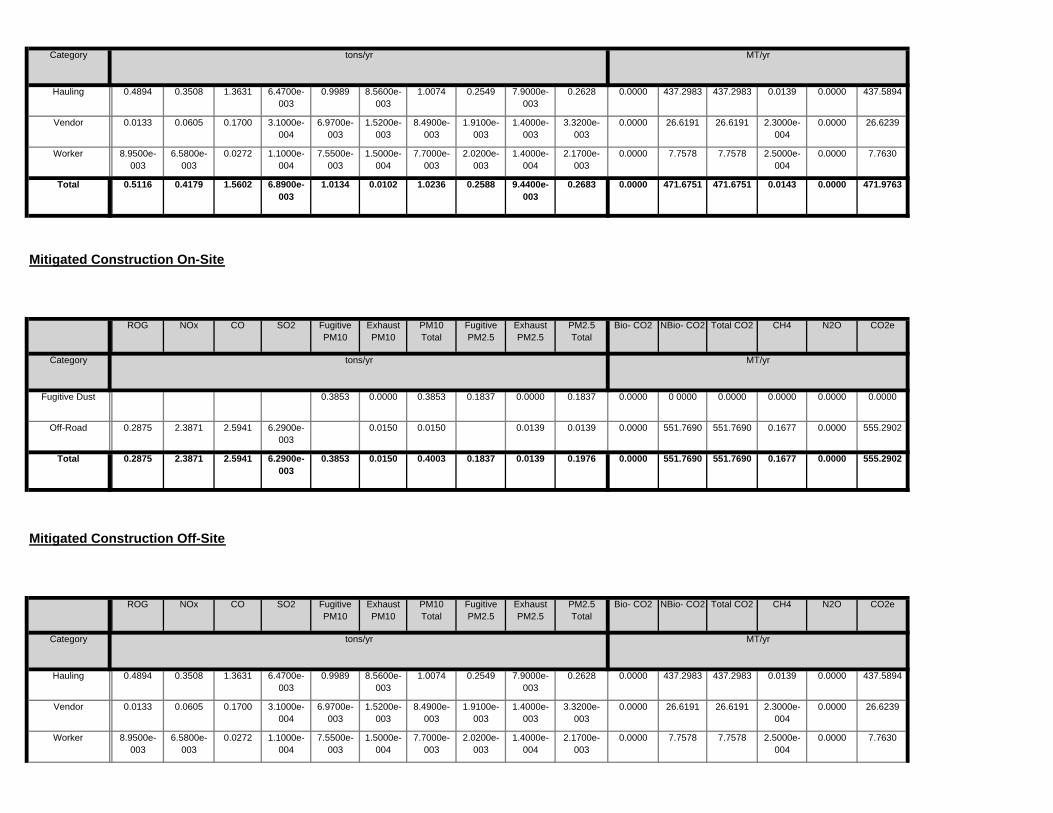
0.0000 7.7578 7.7578 2.5000e-004
0.0000 7.76307.5500e-003
1.5000e-004
7.7000e-003
2.0200e-003
1.4000e-004
2.1700e-003
Worker 8.9500e-003
6.5800e-003
0.0272 1.1000e-004
0.0000 26.6191 26.6191 2.3000e-004
0.0000 26.62396.9700e-003
1.5200e-003
8.4900e-003
1.9100e-003
1.4000e-003
3.3200e-003
Vendor 0.0133 0.0605 0.1700 3.1000e-004
0.0000 437.2983 437.2983 0.0139 0.0000 437.58940.9989 8.5600e-003
1.0074 0.2549 7.9000e-003
0.2628Hauling 0.4894 0.3508 1.3631 6.4700e-003
Total CO2 CH4 N2O CO2e
Category tons/yr MT/yr
PM10 Total
Fugitive PM2.5
Exhaust PM2.5
PM2.5 Total
Bio- CO2 NBio- CO2
Mitigated Construction Off-Site
ROG NOx CO SO2 Fugitive PM10
Exhaust PM10
0.0000 551.7690 551.7690 0.1677 0.0000 555.29020.3853 0.0150 0.4003 0.1837 0.0139 0.1976Total 0.2875 2.3871 2.5941 6.2900e-003
0.0000 551.7690 551.7690 0.1677 0.0000 555.29020.0150 0.0150 0.0139 0.0139Off-Road 0.2875 2.3871 2.5941 6.2900e-003
0.0000 0 0000 0.0000 0.0000 0.0000 0.00000.3853 0.0000 0.3853 0.1837 0.0000 0.1837Fugitive Dust
Total CO2 CH4 N2O CO2e
Category tons/yr MT/yr
PM10 Total
Fugitive PM2.5
Exhaust PM2.5
PM2.5 Total
Bio- CO2 NBio- CO2
Mitigated Construction On-Site
ROG NOx CO SO2 Fugitive PM10
Exhaust PM10
0.0000 471.6751 471.6751 0.0143 0.0000 471.97631.0134 0.0102 1.0236 0.2588 9.4400e-003
0.2683Total 0.5116 0.4179 1.5602 6.8900e-003
0.0000 7.7578 7.7578 2.5000e-004
0.0000 7.76307.5500e-003
1.5000e-004
7.7000e-003
2.0200e-003
1.4000e-004
2.1700e-003
Worker 8.9500e-003
6.5800e-003
0.0272 1.1000e-004
0.0000 26.6191 26.6191 2.3000e-004
0.0000 26.62396.9700e-003
1.5200e-003
8.4900e-003
1.9100e-003
1.4000e-003
3.3200e-003
Vendor 0.0133 0.0605 0.1700 3.1000e-004
0.0000 437.2983 437.2983 0.0139 0.0000 437.58940.9989 8.5600e-003
1.0074 0.2549 7.9000e-003
0.2628Hauling 0.4894 0.3508 1.3631 6.4700e-003
Category tons/yr MT/yr

4.4 Fleet MixHistorical Energy Use: N
5.1 Mitigation Measures Energy
6.0 Area Detail
6.1 Mitigation Measures Area
0.002593 0.003201 0.003751 0.000525 0.001830
5.0 Energy Detail
SBUS MH
0.522550 0.057918 0.180146 0.126595 0.040312 0.006532 0.017397 0.036650
LHD2 MHD HHD OBUS UBUS MCY
H-S or C-C H-O or C-NW Primary Diverted Pass-by
LDA LDT1 LDT2 MDV LHD1
4.3 Trip Type Information
Miles Trip % Trip Purpose %
Land Use H-W or C-W H-S or C-C H-O or C-NW H-W or C-W
Total
MitigatedLand Use Weekday Saturday Sunday Annual VMT Annual VMT
4.0 Operational Detail - Mobile
4.1 Mitigation Measures Mobile
4.2 Trip Summary Information
Average Daily Trip Rate Unmitigated
0.0000 471.6751 471.6751 0.0143 0.0000 471.97631.0134 0.0102 1.0236 0.2588 9.4400e-003
0.2683Total 0.5116 0.4179 1.5602 6.8900e-003

0.0000 0.0000 0.0000 0.0000 0.0000 0.00000.0000 0 0000 0.0000 0.0000Architectural Coating
0.0000
Total CO2 CH4 N2O CO2e
SubCategory tons/yr MT/yr
PM10 Total
Fugitive PM2.5
Exhaust PM2.5
PM2.5 Total
Bio- CO2 NBio- CO2
Mitigated
ROG NOx CO SO2 Fugitive PM10
Exhaust PM10
0.0000 0.0000 0.0000 0.0000 0.0000 0.00000.0000 0.0000 0.0000 0.0000Total 0.0000
0.0000 0.0000 0.0000 0.0000 0.0000 0.00000.0000 0 0000 0.0000 0.0000Consumer Products
0.0000
0.0000 0.0000 0.0000 0.0000 0.0000 0.00000.0000 0 0000 0.0000 0.0000Architectural Coating
0.0000
Total CO2 CH4 N2O CO2e
SubCategory tons/yr MT/yr
PM10 Total
Fugitive PM2.5
Exhaust PM2.5
PM2.5 Total
Bio- CO2 NBio- CO2
6.2 Area by SubCategoryUnmitigated
ROG NOx CO SO2 Fugitive PM10
Exhaust PM10
0.0000 0.0000 0.0000 0.0000 0.0000 0.00000.0000 0 0000 0.0000 0.0000Unmitigated 0.0000
0.0000 0.0000 0.0000 0.0000 0.0000 0.00000.0000 0 0000 0.0000 0.0000
CO2e
Category tons/yr MT/yr
Mi igated 0.0000
PM2.5 Total
Bio- CO2 NBio- CO2 Total CO2 CH4 N2OSO2 Fugitive PM10
Exhaust PM10
PM10 Total
Fugitive PM2.5
Exhaust PM2.5
ROG NOx CO

Hours/Day Days/Year Horse Power Load Factor Fuel Type
10.0 Vegetation
7.0 Water Detail
7.1 Mitigation Measures Water
8.0 Waste Detail
8.1 Mitigation Measures Waste
9.0 Operational Offroad
Equipment Type Number
0.0000 0.0000 0.0000 0.0000 0.0000 0.00000.0000 0.0000 0.0000 0.0000Total 0.0000
0.0000 0.0000 0.0000 0.0000 0.0000 0.00000.0000 0 0000 0.0000 0.0000Consumer Products
0.0000
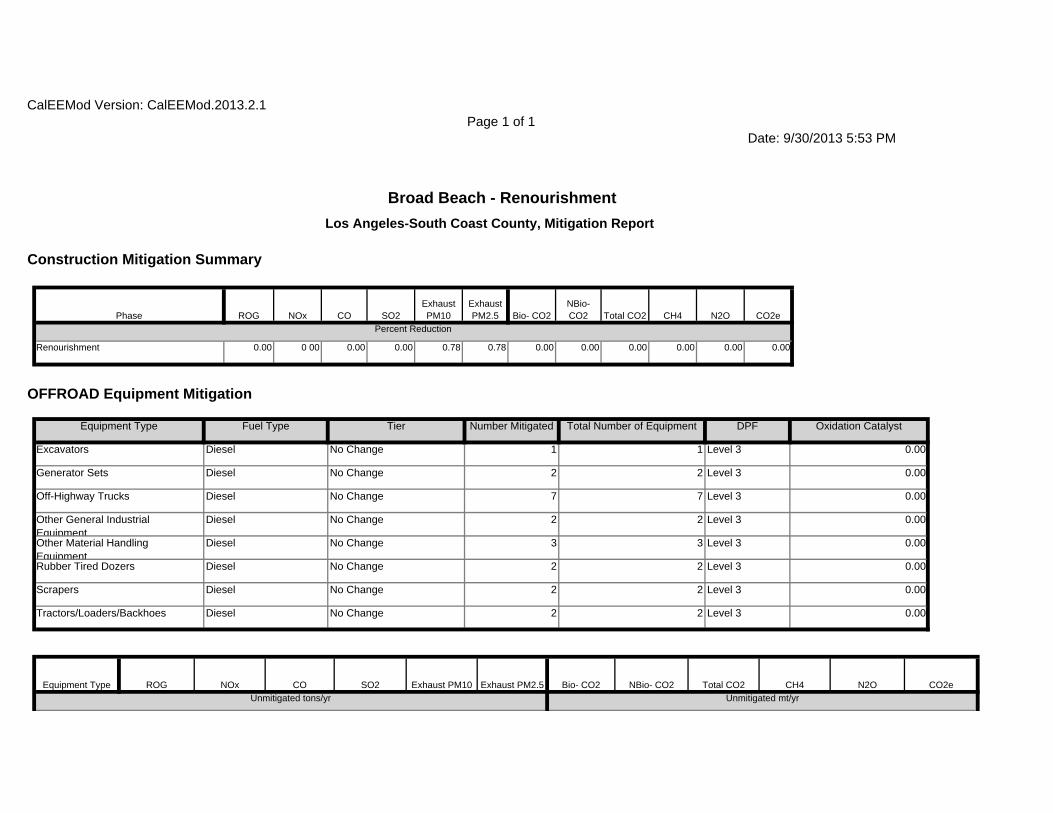
Total CO2 CH4 N2O CO2eUnmitigated tons/yr Unmitigated mt/yr
0.00
Equipment Type ROG NOx CO SO2 Exhaust PM10 Exhaust PM2.5 Bio- CO2 NBio- CO2
Tractors/Loaders/Backhoes Diesel No Change 2 2 Level 3
0.00
Scrapers Diesel No Change 2 2 Level 3 0.00
Rubber Tired Dozers Diesel No Change 2 2 Level 3
0.00
Other Material Handling Equipment
Diesel No Change 3 3 Level 3 0.00
Other General Industrial Equipment
Diesel No Change 2 2 Level 3
0.00
Off-Highway Trucks Diesel No Change 7 7 Level 3 0.00
Generator Sets Diesel No Change 2 2 Level 3
Oxidation Catalyst
Excavators Diesel No Change 1 1 Level 3 0.00
Equipment Type Fuel Type Tier Number Mitigated Total Number of Equipment DPF
0.00 0.00 0.00 0.00 0.00
OFFROAD Equipment Mitigation
CO2ePercent Reduction
Renourishment 0.00 0 00 0.00 0.00 0.78 0.78 0.00
Exhaust PM2.5 Bio- CO2
NBio- CO2 Total CO2 CH4 N2OPhase ROG NOx CO SO2
Exhaust PM10
CalEEMod Version: CalEEMod.2013.2.1Page 1 of 1
Date: 9/30/2013 5:53 PM
Broad Beach - RenourishmentLos Angeles-South Coast County, Mitigation Report
Construction Mitigation Summary

1.04624E-006 1 04624E-006 0.00000E+000 0.00000E+000 1.29898E-006
0.00000E+000 1.18603E-006
Other General Industrial Equipment
0.00000E+000 0.00000E+000 0 00000E+000 0.00000E+000 8.49755E-001 8.49658E-001 0.00000E+000
8.50007E-001 8.49986E-001 0.00000E+000 1.19408E-006 1.19408E-006 0.00000E+000
1.13233E-006 1.13233E-006 0.00000E+000 0.00000E+000 1.23416E-006
Off-Highway Trucks 0.00000E+000 0.00000E+000 0 00000E+000 0.00000E+000
0.00000E+000 1.24216E-006
Generator Sets 0.00000E+000 0.00000E+000 0 00000E+000 0.00000E+000 8.49952E-001 8.49952E-001 0.00000E+000
8.49612E-001 8.49916E-001 0.00000E+000 1.00048E-006 1.00048E-006 0.00000E+000
Total CO2 CH4 N2O CO2ePercent Reduction
Excavators 0.00000E+000 0.00000E+000 0 00000E+000 0.00000E+000
4.73535E+001
Equipment Type ROG NOx CO SO2 Exhaust PM10 Exhaust PM2.5 Bio- CO2 NBio- CO2
1.71000E-003 0.00000E+000 4.70341E+001 4.70341E+001 1.52100E-002 0.00000E+000
2.25416E+002 7.29000E-002 0.00000E+000 2.26947E+002
Tractors/Loaders/Backhoes
2.55100E-002 2.58050E-001 3.83800E-001 5.40000E-004 1.86000E-003
1.35396E+002
Scrapers 1.31240E-001 1.36148E+000 1 02629E+000 2.57000E-003 8.03000E-003 7.39000E-003 0.00000E+000 2.25416E+002
8.28000E-003 0.00000E+000 1.34482E+002 1.34482E+002 4.34900E-002 0.00000E+000
1.30120E+002 4.20800E-002 0.00000E+000 1.31004E+002
Rubber Tired Dozers 1.34440E-001 1.31725E+000 1.11204E+000 1.53000E-003 9.00000E-003
3.84918E+001
Other Material Handling Equipment
6.48600E-002 5.21790E-001 9.64300E-001 1.48000E-003 4.23000E-003 3.89000E-003 0.00000E+000 1.30120E+002
1.98000E-003 0.00000E+000 3.82321E+001 3.82321E+001 1.23700E-002 0.00000E+000
6.95094E+002 2.24810E-001 0.00000E+000 6.99815E+002
Other General Industrial Equipment
2.68600E-002 2.54580E-001 3.26750E-001 4.40000E-004 2.15000E-003
9.72318E+001
Off-Highway Trucks 2.99990E-001 2.07931E+000 1 95941E+000 7.92000E-003 1.12600E-002 1.03600E-002 0.00000E+000 6.95094E+002
3.13000E-003 0.00000E+000 9.71449E+001 9.71449E+001 4.14000E-003 0.00000E+000Generator Sets 5.11700E-002 4.55220E-001 6.30300E-001 1.13000E-003 3.13000E-003
0.00000E+000 3.99809E+001 3.99809E+001 1.29300E-002 0.00000E+000 4.02524E+001
CO2eMitigated tons/yr Mitigated mt/yr
Excavators 1.63300E-002 1.31420E-001 2.87300E-001 4.60000E-004 9.70000E-004 8.90000E-004
Exhaust PM2.5 Bio- CO2 NBio- CO2 Total CO2 CH4 N2O
4.70342E+001 1.52100E-002 0.00000E+000 4.73536E+001
Equipment Type ROG NOx CO SO2 Exhaust PM10
2.26947E+002
Tractors/Loaders/Backhoes
2.55100E-002 2.58050E-001 3.83800E-001 5.40000E-004 1.24000E-002 1.14100E-002 0.00000E+000 4.70342E+001
4.92600E-002 0.00000E+000 2.25416E+002 2.25416E+002 7.29000E-002 0.00000E+000
1.34483E+002 4.34900E-002 0.00000E+000 1.35396E+002
Scrapers 1.31250E-001 1.36148E+000 1.02629E+000 2.57000E-003 5.35400E-002
1.31004E+002
Rubber Tired Dozers
1.34440E-001 1.31725E+000 1.11204E+000 1.53000E-003 5.99800E-002 5.51800E-002 0.00000E+000 1.34483E+002
2.59300E-002 0.00000E+000 1.30120E+002 1.30120E+002 4.20800E-002 0.00000E+000
3.82321E+001 1.23700E-002 0.00000E+000 3.84918E+001
Other Material Handling
6.48600E-002 5.21790E-001 9.64310E-001 1.48000E-003 2.81800E-002
6.99816E+002
Other General Industrial
2.68600E-002 2.54580E-001 3.26750E-001 4.40000E-004 1.43100E-002 1.31700E-002 0.00000E+000 3.82321E+001
6.90600E-002 0.00000E+000 6.95095E+002 6.95095E+002 2.24810E-001 0.00000E+000
9.71450E+001 4.14000E-003 0.00000E+000 9.72320E+001
Off-Highway Trucks
2.99990E-001 2.07931E+000 1.95941E+000 7.92000E-003 7.50700E-002
4.02524E+001
Generator Sets 5.11700E-002 4.55220E-001 6.30300E-001 1.13000E-003 2.08600E-002 2.08600E-002 0.00000E+000 9.71450E+001
5.93000E-003 0.00000E+000 3.99809E+001 3.99809E+001 1.29300E-002 0.00000E+000Excavators 1.63300E-002 1.31420E-001 2.87300E-001 4.60000E-004 6.45000E-003

0.000.00 0.00 0.00 0.00 0.00 0.00Consumer Products 0.00 0.00 0.00 0.00 0.00
0.00 0.00 0.00 0.00 0.00 0.00
N2O CO2ePercent Reduction
Architectural Coating 0.00 0.00 0.00 0.00 0.00 0.00
Exhaust PM10
Exhaust PM2.5 Bio- CO2 NBio- CO2
Total CO2 CH4
Operational Percent Reduction Summary
Category ROG NOx CO SO2
0.69
Renourishment Roads 2.07 0.53 2.07 0.53 0.00 0.00
PM2.5 PM10 PM2.5Renourishment Fugitive Dust 2.49 1.18 0.77 0.37 0.69
Unmitigated Mitigated Percent Reduction
Phase Source PM10 PM2.5 PM10
No Clean Paved Road % PM Reduction 0.00
No Unpaved Road Mitigation Moisture Content %
0.00 Vehicle Speed (mph)
15.00
Yes Water Exposed Area PM10 Reduction 69.00 PM2.5 Reduction
69.00 Frequency (per day)
0.00
No Replace Ground Cover of Area Disturbed
PM10 Reduction 0.00 PM2.5 Reduction
0.00
Mitigation InputYes/No Mitigation Measure Mitigation Input Mitigation Input
No Soil Stabilizer for unpaved Roads
PM10 Reduction 0.00 PM2.5 Reduction
1.06306E-006 1 06306E-006 0.00000E+000 0.00000E+000 1.26706E-006
Fugitive Dust Mitigation
0.00000E+000 1.18970E-006
Tractors/Loaders/Backhoes
0.00000E+000 0.00000E+000 0 00000E+000 0.00000E+000 8.50000E-001 8.50131E-001 0.00000E+000
8.50019E-001 8.49980E-001 0.00000E+000 1.19778E-006 1.19778E-006 0.00000E+000
1.18975E-006 1.18975E-006 0.00000E+000 0.00000E+000 1.18172E-006
Scrapers 7.61905E-005 0.00000E+000 0 00000E+000 0.00000E+000
0.00000E+000 1.14501E-006
Rubber Tired Dozers 0.00000E+000 0.00000E+000 0 00000E+000 0.00000E+000 8.49950E-001 8.49946E-001 0.00000E+000
8.49894E-001 8.49981E-001 0.00000E+000 1.15278E-006 1.15278E-006 0.00000E+000Other Material Handling Equipment
0.00000E+000 0.00000E+000 1.03701E-005 0.00000E+000

No Parking Policy Pricing Unbundle Parking Costs 0.00
No Parking Policy Pricing Limit Parking Supply 0.00
Neighborhood Enhancements Neighborhood Enhancements Subtotal 0.00
No Neighborhood Enhancements Implement NEV Network 0.00
No Neighborhood Enhancements Provide Traffic Calming Measures
No Neighborhood Enhancements Improve Pedestrian Network
Land Use Land Use SubTotal 0.00
No Land Use Integrate Below Market Rate Housing 0.00
No Land Use Increase Transit Accessibility 0.25
No Land Use Improve Destination Accessibility 0.00
No Land Use Improve Walkability Design 0.00
No Land Use Increase Diversity 0.00 0.15
Input Value 3
No Land Use Increase Density 0.00
Mitigation c
Category Measure % Reduction Input Value 1 Input Value 2
0.00 0.00 0.00 0.00
Operational Mobile Mitigation
Project Setting:
0.00
Water Outdoor 0.00 0.00 0.00 0.00 0.00 0.00 0.00 0.00
0.00 0.00 0.00 0.00 0.00 0.00
0.00 0.00 0.00 0.00
Water Indoor 0.00 0.00 0.00 0.00 0.00
0.00
Natural Gas 0.00 0.00 0.00 0.00 0.00 0.00 0.00 0.00
0.00 0.00 0.00 0.00 0.00 0.00
0.00 0.00 0.00 0.00
Mobile 0.00 0.00 0.00 0.00 0.00
0.00
Landscaping 0.00 0.00 0.00 0.00 0.00 0.00 0.00 0.00
0.00 0.00 0.00 0.00 0.00 0.00
0.00 0.00 0.00 0.00
Hearth 0.00 0.00 0.00 0.00 0.00
Electricity 0.00 0.00 0.00 0.00 0.00 0.00 0.00 0.00

No Use Low VOC Paint (Residential Interior) 50.00
No No Hearth
No Use Low VOC Cleaning Supplies
Area Mitigation
Measure Implemented Mitigation Measure Input Value
No Only Natural Gas Hearth
Total VMT Reduction 0.00
No School Trip Implement School Bus Program 0.00
Commute Commute Subtotal 0.00
No Commute Provide Ride Sharing Program
No Commute Employee Vanpool/Shuttle 0.00 2.00
No Commute Market Commute Trip Reduction Option 0.00
No Commute Encourage Telecommuting and Alternative Work Schedules
0.00
No Commute Workplace Parking Charge
No Commute Implement Employee Parking "Cash Out"
No Commute Transit Subsidy
No Commute Implement Trip Reduction Program
Land Use and Site Enhancement Subtotal 0.00
Transit Improvements Transit Improvements Subtotal 0.00
No Transit Improvements Increase Transit Frequency 0.00
No Transit Improvements Expand Transit Network 0.00
No Transit Improvements Provide BRT System 0.00
Parking Policy Pricing Parking Policy Pricing Subtotal 0.00
No Parking Policy Pricing On-street Market Pricing 0.00

No Install low-flow bathroom faucet 32.00
No Use Reclaimed Water
No Use Grey Water
Water Mitigation Measures
Measure Implemented Mitigation Measure Input Value 1 Input Value 2
No Apply Water Conservation on Strategy
Fan 50.00
Refrigerator 15.00
ClothWasher 30.00
DishWasher 15.00
No On-site Renewable
Appliance Type Land Use Subtype % Improvement
No Exceed Title 24
No Install High Efficiency Lighting
No % Electric Chainsaw
Energy Mitigation Measures
Measure Implemented Mitigation Measure Input Value 1 Input Value 2
No % Electric Lawnmower
No % Electric Leafblower
No Use Low VOC Paint (Non-residential Interior) 250.00
No Use Low VOC Paint (Non-residential Exterior) 250.00
No Use Low VOC Paint (Residential Exterior) 100.00

Institute Recycling and Composting ServicesPercent Reduction in Waste Disposed
No Water Efficient Landscape
Solid Waste Mitigation
Mitigation Measures Input Value
No Turf Reduction
No Use Water Efficient Irrigation Systems 6.10
No Install low-flow Toilet 20.00
No Install low-flow Shower 20.00
No Install low-flow Kitchen faucet 18.00
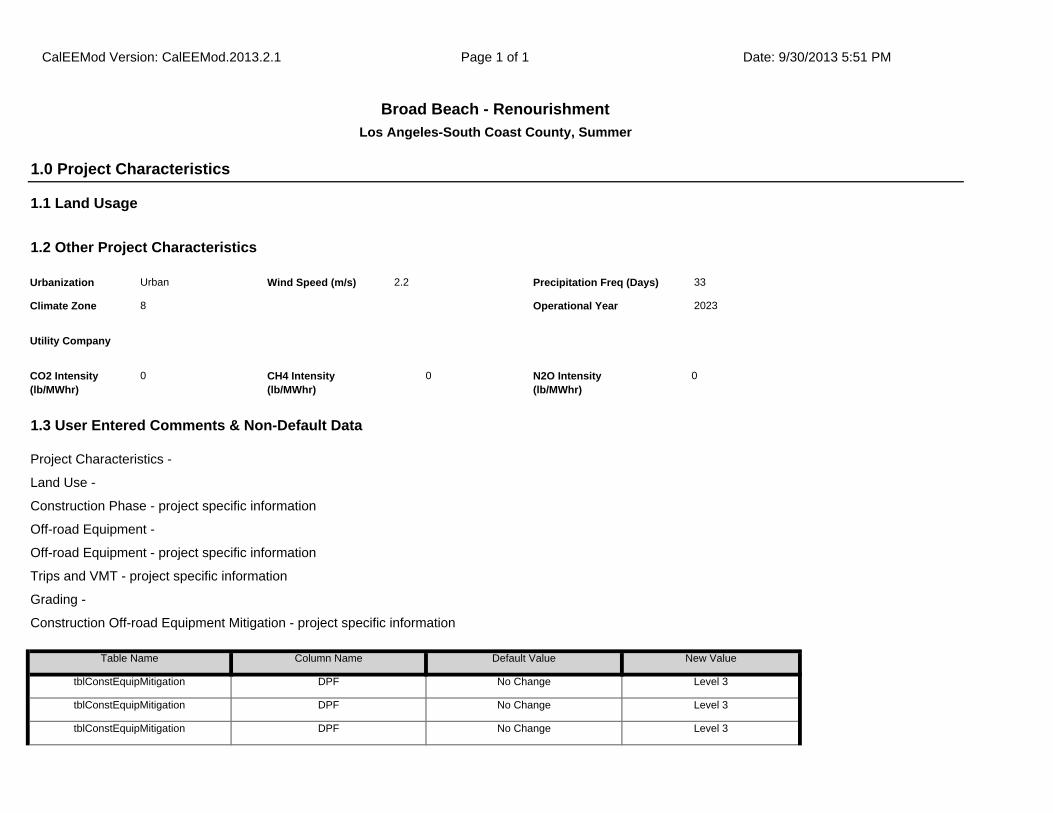
tblConstEquipMitigation DPF No Change Level 3
tblConstEquipMitigation DPF No Change Level 3
tblConstEquipMitigation DPF No Change Level 3
Off-road Equipment -
Off-road Equipment - project specific information
Trips and VMT - project specific information
Grading -
Construction Off-road Equipment Mitigation - project specific information
Table Name Column Name Default Value New Value
N2O Intensity (lb/MWhr)
0
1.3 User Entered Comments & Non-Default Data
Project Characteristics -
Land Use -
Construction Phase - project specific information
Utility Company
CO2 Intensity (lb/MWhr)
0 CH4 Intensity (lb/MWhr)
0
Precipitation Freq (Days) 33
Climate Zone 8 Operational Year 2023
1.1 Land Usage
1.2 Other Project Characteristics
Urbanization Urban Wind Speed (m/s) 2.2
CalEEMod Version: CalEEMod.2013.2.1 Page 1 of 1 Date: 9/30/2013 5:51 PM
Broad Beach - RenourishmentLos Angeles-South Coast County, Summer
1.0 Project Characteristics

2.0 Emissions Summary
2.1 Overall Construction (Maximum Daily Emission)Unmitigated Construction
tblTripsAndVMT WorkerTripNumber 53.00 24.00
tblTripsAndVMT WorkerVehicleClass EMFAC_Mix
tblTripsAndVMT VendorVehicleClass HHDT
tblTripsAndVMT WorkerTripLength 14.70 16.90
tblTripsAndVMT HaulingTripNumber 56,250.00 64,300.00
tblTripsAndVMT HaulingVehicleClass EMFAC_Mix
tblOffRoadEquipment UsageHours 6.00 11.00
tblProjectCharacteristics OperationalYear 2014 2023
tblOffRoadEquipment OffRoadEquipmentUnitAmount 1.00 2.00
tblOffRoadEquipment UsageHours 1.00 11.00
tblConstructionPhase NumDays 0.00 125.00
tblGrading MaterialImported 0.00 450,000.00
tblConstEquipMitigation NumberOfEquipmentMitigated 0.00 2.00
tblConstEquipMitigation NumberOfEquipmentMitigated 0.00 2.00
tblConstEquipMitigation NumberOfEquipmentMitigated 0.00 3.00
tblConstEquipMitigation NumberOfEquipmentMitigated 0.00 2.00
tblConstEquipMitigation NumberOfEquipmentMitigated 0.00 7.00
tblConstEquipMitigation NumberOfEquipmentMitigated 0.00 2.00
tblConstEquipMitigation NumberOfEquipmentMitigated 0.00 1.00
tblConstEquipMitigation NumberOfEquipmentMitigated 0.00 2.00
tblConstEquipMitigation DPF No Change Level 3
tblConstEquipMitigation DPF No Change Level 3
tblConstEquipMitigation DPF No Change Level 3
tblConstEquipMitigation DPF No Change Level 3
tblConstEquipMitigation DPF No Change Level 3

2.2 Overall OperationalUnmitigated Operational
0.00 0.00 0.00 0.00 0.00 0.0024.85 77.50 28.99 35.24 77.53 43.28
NBio-CO2 Total CO2 CH4 N20 CO2e
Percent Reduction
0.00 0.00 0.00 0.00
Exhaust PM10
PM10 Total
Fugitive PM2.5
Exhaust PM2.5
PM2.5 Total
Bio- CO2ROG NOx CO SO2 Fugitive PM10
0.0000 93,365.4737
93,365.4737
16.3978 0.0000 93,709.8266
82.9682 2.1178 85.0860 24.0381 1.9581 25.9962Total 64.0927 234.3836 346.8872 1.0924
0.0000 46,676.8841
46,676.8841
8.1894 0.0000 46,848.8604
48.4196 1.0318 49.4514 13.7216 0.9538 14.67542024 31.5366 113.2524 171.2876 0.5474
0.0000 46,688.5895
46,688.5895
8.2084 0.0000 46,860.9662
34.5486 1.0860 35.6346 10.3165 1.0042 11.32082023 32.5560 121.1312 175.5996 0.5450
Total CO2 CH4 N2O CO2e
Year lb/day lb/day
PM10 Total
Fugitive PM2.5
Exhaust PM2.5
PM2.5 Total
Bio- CO2 NBio- CO2
Mitigated Construction
ROG NOx CO SO2 Fugitive PM10
Exhaust PM10
0.0000 93,365.4737
93,365.4737
16.3978 0.0000 93,709.8266
110.4084 9.4113 119.8197 37.1201 8.7127 45.8328Total 64.0927 234.3836 346.8872 1.0924
0.0000 46,676.8841
46,676.8841
8.1894 0.0000 46,848.8604
62.1397 4.5115 66.6512 20.2626 4.1758 24.43832024 31.5366 113.2524 171.2876 0.5474
0.0000 46,688.5896
46,688.5896
8.2084 0.0000 46,860.9662
48.2687 4.8999 53.1686 16.8575 4.5369 21.39442023 32.5560 121.1312 175.5996 0.5450
NBio- CO2
Total CO2 CH4 N2O CO2e
Year lb/day lb/day
Exhaust PM10
PM10 Total
Fugitive PM2.5
Exhaust PM2.5
PM2.5 Total
Bio- CO2ROG NOx CO SO2 Fugitive PM10

125
End Date Num Days Week
Num Days Phase Description
1 Renourishment Grading 9/15/2023 3/7/2024 5
3.0 Construction Detail
Construction Phase
Phase Number
Phase Name Phase Type Start Date
0.00 0.00 0.00 0.00 0.00 0.000.00 0.00 0.00 0.00 0.00 0.00
NBio-CO2 Total CO2 CH4 N20 CO2e
Percent Reduction
0.00 0.00 0.00 0.00
Exhaust PM10
PM10 Total
Fugitive PM2.5
Exhaust PM2.5
PM2.5 Total
Bio- CO2ROG NOx CO SO2 Fugitive PM10
0.0000 0.00000.0000 0.0000 0.0000 0.0000Total 0.0000
0.0000 0.00000.0000 0.0000 0.0000 0.0000Area 0.0000
Total CO2 CH4 N2O CO2e
Category lb/day lb/day
PM10 Total
Fugitive PM2.5
Exhaust PM2.5
PM2.5 Total
Bio- CO2 NBio- CO2
Mitigated Operational
ROG NOx CO SO2 Fugitive PM10
Exhaust PM10
0.0000 0.00000.0000 0.0000 0.0000 0.0000Total 0.0000
0.0000 0.00000.0000 0.0000 0.0000 0.0000Area 0.0000
Total CO2 CH4 N2O CO2e
Category lb/day lb/day
PM10 Total
Fugitive PM2.5
Exhaust PM2.5
PM2.5 Total
Bio- CO2 NBio- CO2
ROG NOx CO SO2 Fugitive PM10
Exhaust PM10

Use DPF for Construction Equipment
Water Exposed Area
Reduce Vehicle Speed on Unpaved Roads
3.2 Renourishment - 2023Unmitigated Construction On-Site
6.90 45.00 EMFAC_Mix HHDT EMFAC_Mix
3.1 Mitigation Measures Construction
Renourishment 21 24.00 48.00 64,300.00 16.90
Worker Trip Length
Vendor Trip Length
Hauling Trip Length
Worker Vehicle Class
Vendor Vehicle Class
Hauling Vehicle Class
Trips and VMT
Phase Name Offroad Equipment Count
Worker Trip Number
Vendor Trip Number
Hauling Trip Number
Renourishment Tractors/Loaders/Backhoes 2 11.00 97 0.37
Renourishment Scrapers 2 11.00 361 0.48
Renourishment Rubber Tired Dozers 2 11.00 255 0.40
Renourishment Other Material Handling Equipment 3 11.00 167 0.40
Renourishment Other General Industrial Equipment 2 11.00 87 0.34
Renourishment Off-Highway Trucks 7 11.00 400 0.38
Renourishment Generator Sets 2 11.00 84 0.74
Load Factor
Renourishment Excavators 1 11.00 162 0.38
OffRoad Equipment
Phase Name Offroad Equipment Type Amount Usage Hours Horse Power
Acres of Grading (Site Preparation Phase): 0
Acres of Grading (Grading Phase): 0
Acres of Paving: 0
Residential Indoor: 0; Residential Outdoor: 0; Non-Residential Indoor: 0; Non-Residential Outdoor: 0 (Architectural Coating – sqft)

Total CO2 CH4 N2O CO2e
Category lb/day lb/day
PM10 Total
Fugitive PM2.5
Exhaust PM2.5
PM2.5 Total
Bio- CO2 NBio- CO2
Mitigated Construction On-Site
ROG NOx CO SO2 Fugitive PM10
Exhaust PM10
21,865.2239
21,865.2239
0.6588 21,879.0585
28.3845 0.4130 28.7975 7.3778 0.3808 7.7587Total 20.3740 16.0790 67.8073 0.2882
360.2181 360.2181 0.0115 360.45920.3141 6.2000e-003
0 3203 0.0841 5.7200e-003
0.0898Worker 0.3580 0.2534 1.1754 4 8000e-003
1,198.5448
1,198.5448 0.0101 1,198.75600.2893 0.0620 0.3513 0.0793 0.0570 0.1363Vendor 0.5256 2.3732 5.8676 0.0128
20,306.4610
20,306.4610
0.6373 20,319 8433
27.7811 0.3448 28.1259 7.2145 0.3181 7.5326Hauling 19.4905 13.4524 60.7642 0.2706
Total CO2 CH4 N2O CO2e
Category lb/day lb/day
PM10 Total
Fugitive PM2.5
Exhaust PM2.5
PM2.5 Total
Bio- CO2 NBio- CO2
Unmitigated Construction Off-Site
ROG NOx CO SO2 Fugitive PM10
Exhaust PM10
24,823.3657
24,823.3657
7.5496 24,981.9077
19.8842 4.4868 24.3711 9.4797 4.1561 13.6358Total 12.1820 105.0522 107.7923 0.2568
24,823.3657
24,823.3657
7.5496 24,981 9077
4.4868 4.4868 4.1561 4.1561Off-Road 12.1820 105.0522 107.7923 0.2568
0.0000 0.000019.8842 0.0000 19.8842 9.4797 0.0000 9.4797
CO2e
Category lb/day lb/day
Fugitive Dust
PM2.5 Total
Bio- CO2 NBio- CO2
Total CO2 CH4 N2OSO2 Fugitive PM10
Exhaust PM10
PM10 Total
Fugitive PM2.5
Exhaust PM2.5
ROG NOx CO

24,825.3833
24,825.3833
7.5442 24,983.8124
19.8842 4.0937 23.9779 9.4797 3.7906 13.2702Total 11.7349 97.4341 105.8811 0.2568
24,825.3833
24,825.3833
7.5442 24,983 8124
4.0937 4.0937 3.7906 3.7906Off-Road 11.7349 97.4341 105.8811 0.2568
0.0000 0.000019.8842 0.0000 19.8842 9.4797 0.0000 9.4797Fugitive Dust
Total CO2 CH4 N2O CO2e
Category lb/day lb/day
PM10 Total
Fugitive PM2.5
Exhaust PM2.5
PM2.5 Total
Bio- CO2 NBio- CO2
3.2 Renourishment - 2024Unmitigated Construction On-Site
ROG NOx CO SO2 Fugitive PM10
Exhaust PM10
21,865.2239
21,865.2239
0.6588 21,879.0585
28.3845 0.4130 28.7975 7.3778 0.3808 7.7587Total 20.3740 16.0790 67.8073 0.2882
360.2181 360.2181 0.0115 360.45920.3141 6.2000e-003
0 3203 0.0841 5.7200e-003
0.0898Worker 0.3580 0.2534 1.1754 4 8000e-003
1,198.5448
1,198.5448 0.0101 1,198.75600.2893 0.0620 0.3513 0.0793 0.0570 0.1363Vendor 0.5256 2.3732 5.8676 0.0128
20,306.4610
20,306.4610
0.6373 20,319 8433
27.7811 0.3448 28.1259 7.2145 0.3181 7.5326Hauling 19.4905 13.4524 60.7642 0.2706
Total CO2 CH4 N2O CO2e
Category lb/day lb/day
PM10 Total
Fugitive PM2.5
Exhaust PM2.5
PM2.5 Total
Bio- CO2 NBio- CO2
Mitigated Construction Off-Site
ROG NOx CO SO2 Fugitive PM10
Exhaust PM10
0.0000 24,823.3656
24,823.3656
7.5496 24,981.9077
6.1641 0.6730 6.8371 2.9387 0.6234 3.5621Total 12.1820 105.0522 107.7923 0.2568
0.0000 24,823.3656
24,823.3656
7.5496 24,981 9077
0.6730 0.6730 0.6234 0.6234Off-Road 12.1820 105.0522 107.7923 0.2568
0.0000 0.00006.1641 0.0000 6.1641 2.9387 0.0000 2.9387Fugitive Dust

Mitigated Construction Off-Site
0.0000 24,825.3833
24,825.3833
7.5442 24,983.8124
6.1641 0.6141 6.7782 2.9387 0.5686 3.5073Total 11.7349 97.4341 105.8811 0.2568
0.0000 24,825.3833
24,825.3833
7.5442 24,983 8124
0.6141 0.6141 0.5686 0.5686Off-Road 11.7349 97.4341 105.8811 0.2568
0.0000 0.00006.1641 0.0000 6.1641 2.9387 0.0000 2.9387Fugitive Dust
Total CO2 CH4 N2O CO2e
Category lb/day lb/day
PM10 Total
Fugitive PM2.5
Exhaust PM2.5
PM2.5 Total
Bio- CO2 NBio- CO2
Mitigated Construction On-Site
ROG NOx CO SO2 Fugitive PM10
Exhaust PM10
21,851.5009
21,851.5009
0.6451 21,865.0481
42.2555 0.4178 42.6732 10.7829 0.3852 11.1681Total 19.8017 15.8183 65.4065 0.2906
359.9281 359.9281 0.0112 360.16380.3141 6.2800e-003
0 3204 0.0841 5.8000e-003
0.0899Worker 0.3477 0.2488 1.1325 4 8400e-003
1,200.9692
1,200.9692 0.0102 1,201.18290.2893 0.0621 0.3514 0.0793 0.0571 0.1364Vendor 0.5194 2.3685 5.8038 0.0128
20,290.6037
20,290.6037
0.6237 20,303.7014
41.6520 0.3494 42.0014 10.6195 0.3224 10.9419Hauling 18.9347 13.2010 58.4702 0.2729
Total CO2 CH4 N2O CO2e
Category lb/day lb/day
PM10 Total
Fugitive PM2.5
Exhaust PM2.5
PM2.5 Total
Bio- CO2 NBio- CO2
Unmitigated Construction Off-Site
ROG NOx CO SO2 Fugitive PM10
Exhaust PM10

4.4 Fleet MixHistorical Energy Use: N
5.1 Mitigation Measures Energy
0.002593 0.003201 0.003751 0.000525 0.001830
5.0 Energy Detail
SBUS MH
0.522550 0.057918 0.180146 0.126595 0.040312 0.006532 0.017397 0.036650
LHD2 MHD HHD OBUS UBUS MCY
H-S or C-C H-O or C-NW Primary Diverted Pass-by
LDA LDT1 LDT2 MDV LHD1
4.3 Trip Type Information
Miles Trip % Trip Purpose %
Land Use H-W or C-W H-S or C-C H-O or C-NW H-W or C-W
Total
MitigatedLand Use Weekday Saturday Sunday Annual VMT Annual VMT
4.0 Operational Detail - Mobile
4.1 Mitigation Measures Mobile
4.2 Trip Summary Information
Average Daily Trip Rate Unmitigated
21,851.5009
21,851.5009
0.6451 21,865.0481
42.2555 0.4178 42.6732 10.7829 0.3852 11.1681Total 19.8017 15.8183 65.4065 0.2906
359.9281 359.9281 0.0112 360.16380.3141 6.2800e-003
0 3204 0.0841 5.8000e-003
0.0899Worker 0.3477 0.2488 1.1325 4 8400e-003
1,200.9692
1,200.9692 0.0102 1,201.18290.2893 0.0621 0.3514 0.0793 0.0571 0.1364Vendor 0.5194 2.3685 5.8038 0.0128
20,290.6037
20,290.6037
0.6237 20,303.7014
41.6520 0.3494 42.0014 10.6195 0.3224 10.9419Hauling 18.9347 13.2010 58.4702 0.2729
Total CO2 CH4 N2O CO2e
Category lb/day lb/day
PM10 Total
Fugitive PM2.5
Exhaust PM2.5
PM2.5 Total
Bio- CO2 NBio- CO2
ROG NOx CO SO2 Fugitive PM10
Exhaust PM10
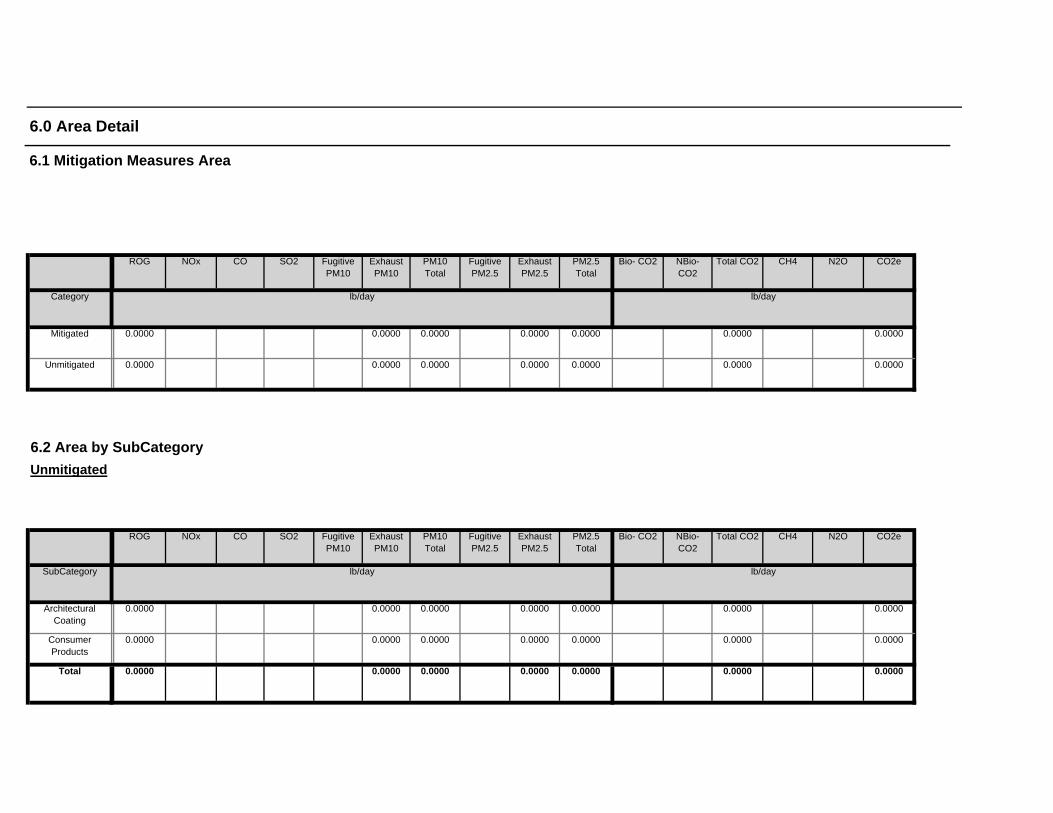
0.0000 0.00000.0000 0.0000 0.0000 0.0000Total 0.0000
0.0000 0.00000.0000 0.0000 0.0000 0.0000Consumer Products
0.0000
0.0000 0.00000.0000 0.0000 0.0000 0.0000Architectural Coating
0.0000
Total CO2 CH4 N2O CO2e
SubCategory lb/day lb/day
PM10 Total
Fugitive PM2.5
Exhaust PM2.5
PM2.5 Total
Bio- CO2 NBio- CO2
6.2 Area by SubCategoryUnmitigated
ROG NOx CO SO2 Fugitive PM10
Exhaust PM10
0.0000 0.00000.0000 0.0000 0.0000 0.0000Unmitigated 0.0000
0.0000 0.00000.0000 0.0000 0.0000 0.0000
CO2e
Category lb/day lb/day
Mitigated 0.0000
PM2.5 Total
Bio- CO2 NBio- CO2
Total CO2 CH4 N2OSO2 Fugitive PM10
Exhaust PM10
PM10 Total
Fugitive PM2.5
Exhaust PM2.5
6.0 Area Detail
6.1 Mitigation Measures Area
ROG NOx CO
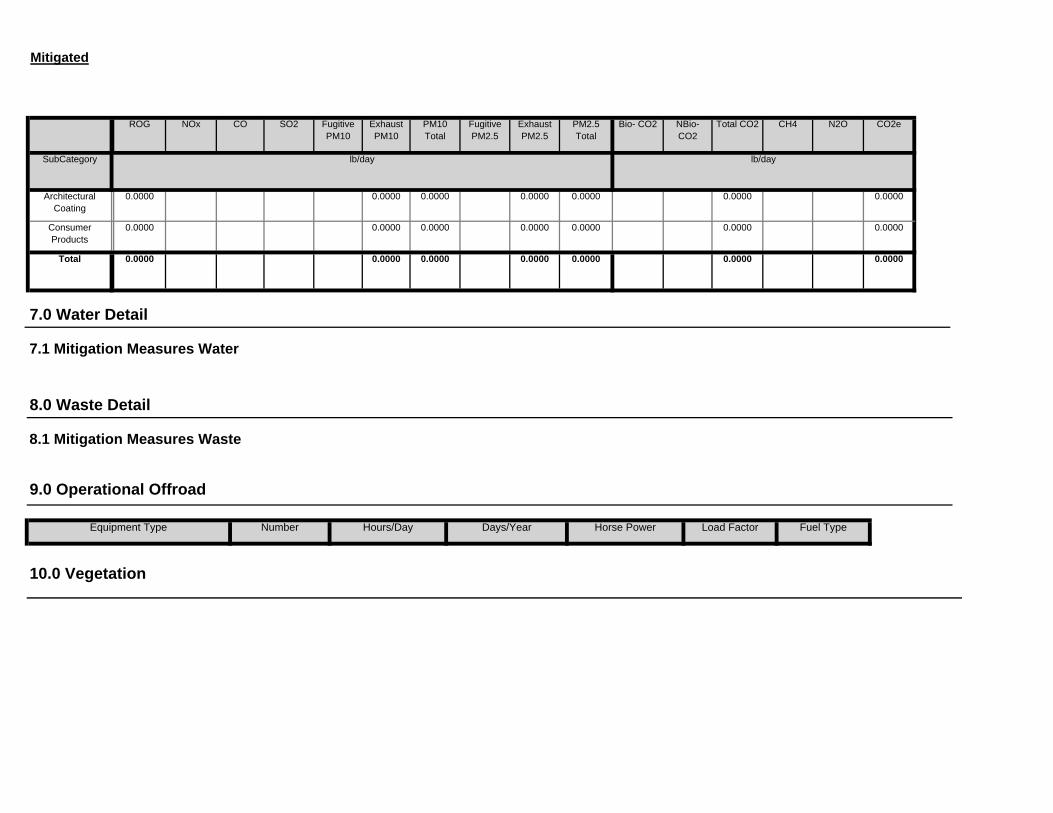
Hours/Day Days/Year Horse Power Load Factor Fuel Type
10.0 Vegetation
7.0 Water Detail
7.1 Mitigation Measures Water
8.0 Waste Detail
8.1 Mitigation Measures Waste
9.0 Operational Offroad
Equipment Type Number
0.0000 0.00000.0000 0.0000 0.0000 0.0000Total 0.0000
0.0000 0.00000.0000 0.0000 0.0000 0.0000Consumer Products
0.0000
0.0000 0.00000.0000 0.0000 0.0000 0.0000Architectural Coating
0.0000
Total CO2 CH4 N2O CO2e
SubCategory lb/day lb/day
PM10 Total
Fugitive PM2.5
Exhaust PM2.5
PM2.5 Total
Bio- CO2 NBio- CO2
Mitigated
ROG NOx CO SO2 Fugitive PM10
Exhaust PM10

tblConstEquipMitigation DPF No Change Level 3
tblConstEquipMitigation DPF No Change Level 3
tblConstEquipMitigation DPF No Change Level 3
Off-road Equipment -
Off-road Equipment - project specific information
Trips and VMT - project specific information
Grading -
Construction Off-road Equipment Mitigation - project specific information
Table Name Column Name Default Value New Value
N2O Intensity (lb/MWhr)
0
1.3 User Entered Comments & Non-Default Data
Project Characteristics -
Land Use -
Construction Phase - project specific information
Utility Company
CO2 Intensity (lb/MWhr)
0 CH4 Intensity (lb/MWhr)
0
Precipitation Freq (Days) 33
Climate Zone 8 Operational Year 2023
1.1 Land Usage
1.2 Other Project Characteristics
Urbanization Urban Wind Speed (m/s) 2.2
CalEEMod Version: CalEEMod.2013.2.1 Page 1 of 1 Date: 9/30/2013 5:52 PM
Broad Beach - RenourishmentLos Angeles-South Coast County, Winter
1.0 Project Characteristics
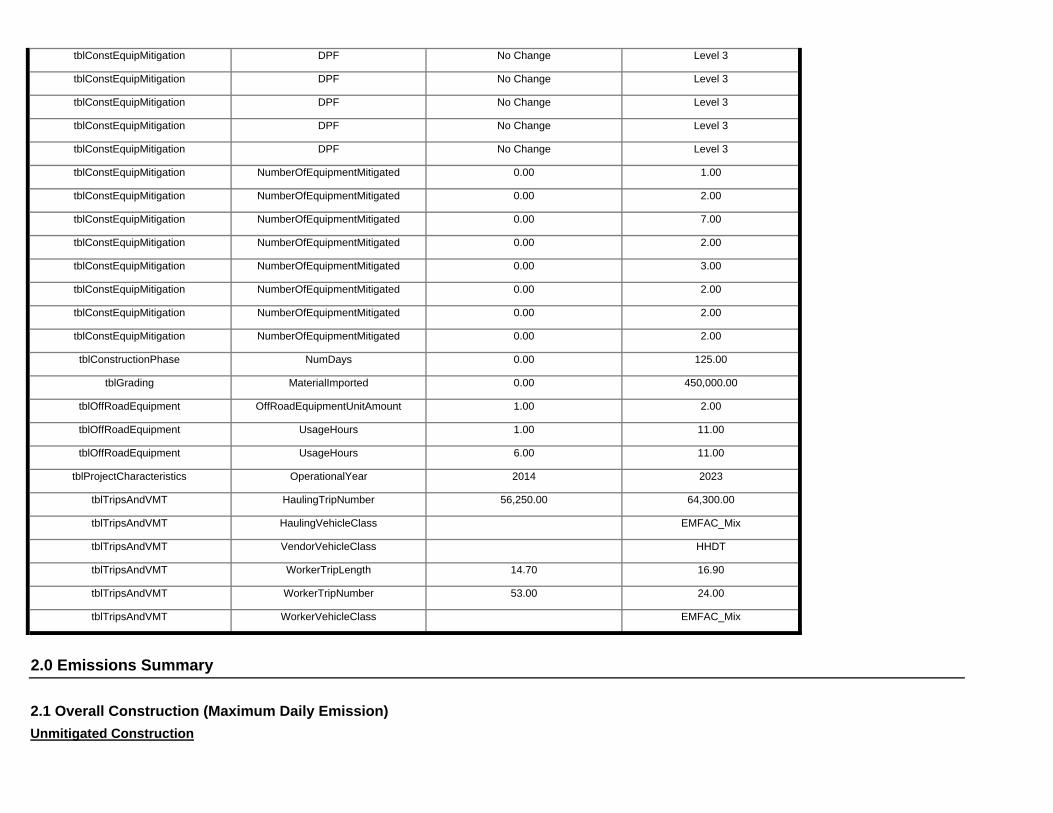
2.0 Emissions Summary
2.1 Overall Construction (Maximum Daily Emission)Unmitigated Construction
tblTripsAndVMT WorkerTripNumber 53.00 24.00
tblTripsAndVMT WorkerVehicleClass EMFAC_Mix
tblTripsAndVMT VendorVehicleClass HHDT
tblTripsAndVMT WorkerTripLength 14.70 16.90
tblTripsAndVMT HaulingTripNumber 56,250.00 64,300.00
tblTripsAndVMT HaulingVehicleClass EMFAC_Mix
tblOffRoadEquipment UsageHours 6.00 11.00
tblProjectCharacteristics OperationalYear 2014 2023
tblOffRoadEquipment OffRoadEquipmentUnitAmount 1.00 2.00
tblOffRoadEquipment UsageHours 1.00 11.00
tblConstructionPhase NumDays 0.00 125.00
tblGrading MaterialImported 0.00 450,000.00
tblConstEquipMitigation NumberOfEquipmentMitigated 0.00 2.00
tblConstEquipMitigation NumberOfEquipmentMitigated 0.00 2.00
tblConstEquipMitigation NumberOfEquipmentMitigated 0.00 3.00
tblConstEquipMitigation NumberOfEquipmentMitigated 0.00 2.00
tblConstEquipMitigation NumberOfEquipmentMitigated 0.00 7.00
tblConstEquipMitigation NumberOfEquipmentMitigated 0.00 2.00
tblConstEquipMitigation NumberOfEquipmentMitigated 0.00 1.00
tblConstEquipMitigation NumberOfEquipmentMitigated 0.00 2.00
tblConstEquipMitigation DPF No Change Level 3
tblConstEquipMitigation DPF No Change Level 3
tblConstEquipMitigation DPF No Change Level 3
tblConstEquipMitigation DPF No Change Level 3
tblConstEquipMitigation DPF No Change Level 3
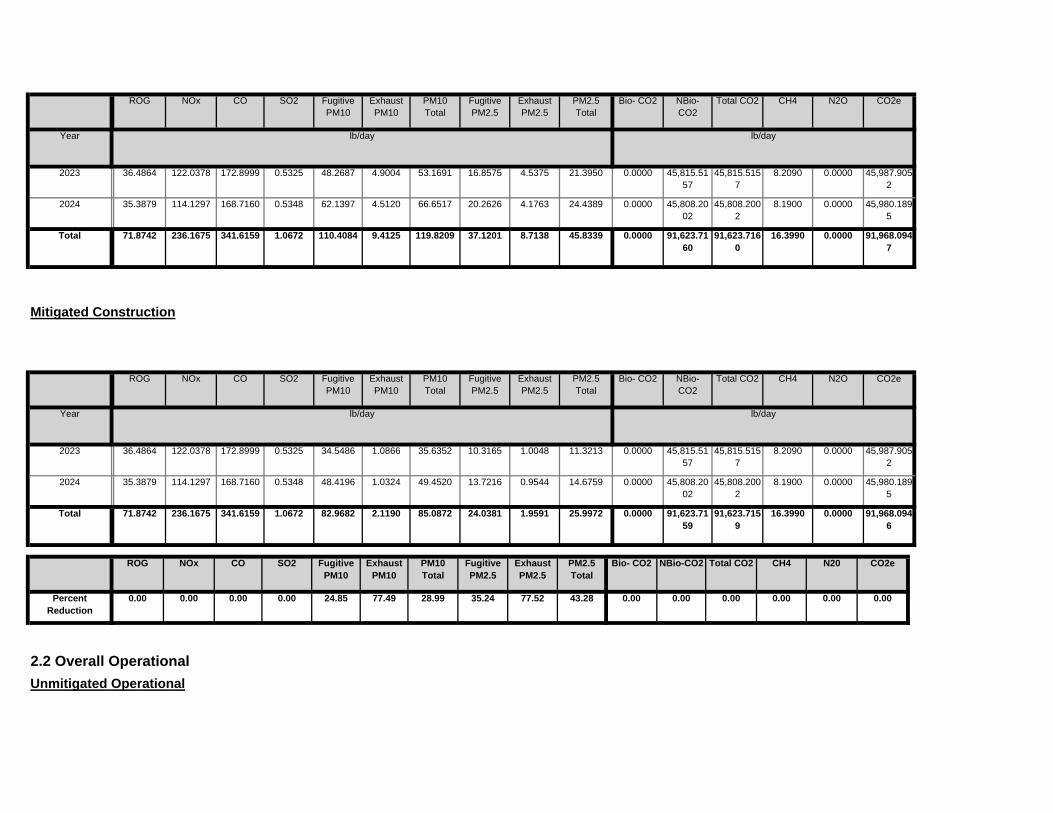
2.2 Overall OperationalUnmitigated Operational
0.00 0.00 0.00 0.00 0.00 0.0024.85 77.49 28.99 35.24 77.52 43.28
NBio-CO2 Total CO2 CH4 N20 CO2e
Percent Reduction
0.00 0.00 0.00 0.00
Exhaust PM10
PM10 Total
Fugitive PM2.5
Exhaust PM2.5
PM2.5 Total
Bio- CO2ROG NOx CO SO2 Fugitive PM10
0.0000 91,623.7159
91,623.7159
16.3990 0.0000 91,968.0946
82.9682 2.1190 85.0872 24.0381 1.9591 25.9972Total 71.8742 236.1675 341.6159 1.0672
0.0000 45,808.2002
45,808.2002
8.1900 0.0000 45,980.1895
48.4196 1.0324 49.4520 13.7216 0.9544 14.67592024 35.3879 114.1297 168.7160 0.5348
0.0000 45,815.5157
45,815.5157
8.2090 0.0000 45,987.9052
34.5486 1.0866 35.6352 10.3165 1.0048 11.32132023 36.4864 122.0378 172.8999 0.5325
Total CO2 CH4 N2O CO2e
Year lb/day lb/day
PM10 Total
Fugitive PM2.5
Exhaust PM2.5
PM2.5 Total
Bio- CO2 NBio- CO2
Mitigated Construction
ROG NOx CO SO2 Fugitive PM10
Exhaust PM10
0.0000 91,623.7160
91,623.7160
16.3990 0.0000 91,968.0947
110.4084 9.4125 119.8209 37.1201 8.7138 45.8339Total 71.8742 236.1675 341.6159 1.0672
0.0000 45,808.2002
45,808.2002
8.1900 0.0000 45,980.1895
62.1397 4.5120 66.6517 20.2626 4.1763 24.43892024 35.3879 114.1297 168.7160 0.5348
0.0000 45,815.5157
45,815.5157
8.2090 0.0000 45,987.9052
48.2687 4.9004 53.1691 16.8575 4.5375 21.39502023 36.4864 122.0378 172.8999 0.5325
NBio- CO2
Total CO2 CH4 N2O CO2e
Year lb/day lb/day
Exhaust PM10
PM10 Total
Fugitive PM2.5
Exhaust PM2.5
PM2.5 Total
Bio- CO2ROG NOx CO SO2 Fugitive PM10
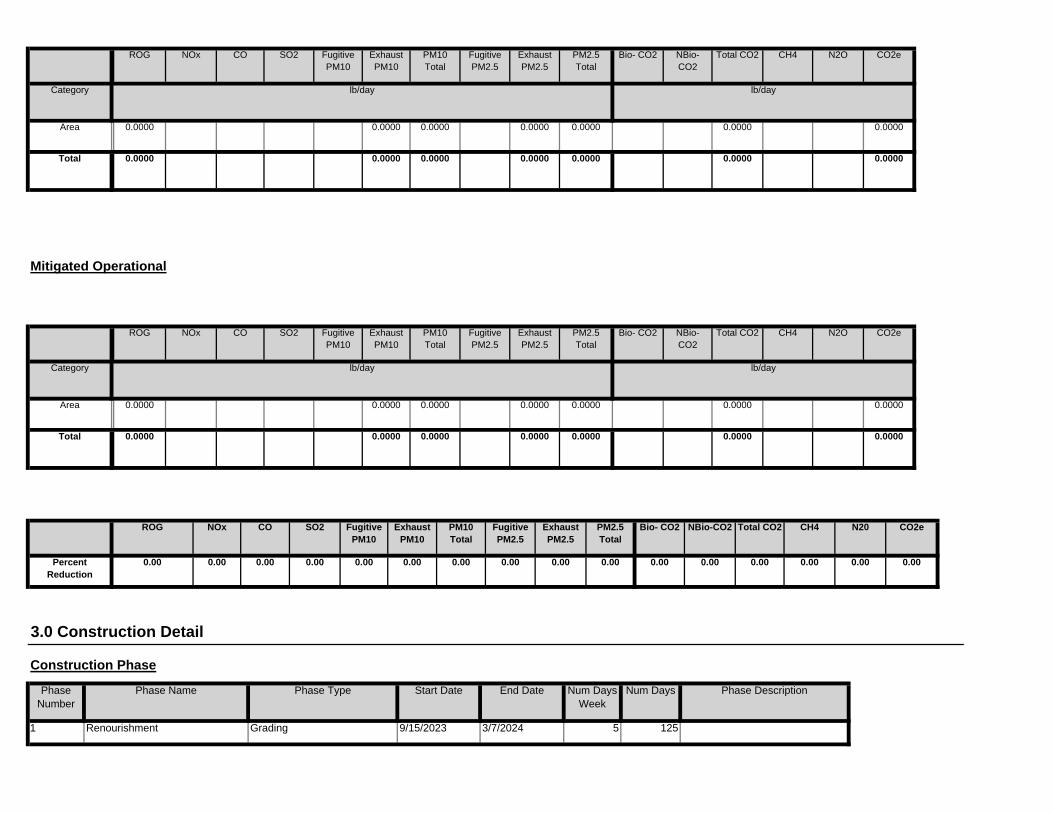
125
End Date Num Days Week
Num Days Phase Description
1 Renourishment Grading 9/15/2023 3/7/2024 5
3.0 Construction Detail
Construction Phase
Phase Number
Phase Name Phase Type Start Date
0.00 0.00 0.00 0.00 0.00 0.000.00 0.00 0.00 0.00 0.00 0.00
NBio-CO2 Total CO2 CH4 N20 CO2e
Percent Reduction
0.00 0.00 0.00 0.00
Exhaust PM10
PM10 Total
Fugitive PM2.5
Exhaust PM2.5
PM2.5 Total
Bio- CO2ROG NOx CO SO2 Fugitive PM10
0.0000 0.00000.0000 0.0000 0.0000 0.0000Total 0.0000
0.0000 0.00000.0000 0.0000 0.0000 0.0000Area 0.0000
Total CO2 CH4 N2O CO2e
Category lb/day lb/day
PM10 Total
Fugitive PM2.5
Exhaust PM2.5
PM2.5 Total
Bio- CO2 NBio- CO2
Mitigated Operational
ROG NOx CO SO2 Fugitive PM10
Exhaust PM10
0.0000 0.00000.0000 0.0000 0.0000 0.0000Total 0.0000
0.0000 0.00000.0000 0.0000 0.0000 0.0000Area 0.0000
Total CO2 CH4 N2O CO2e
Category lb/day lb/day
PM10 Total
Fugitive PM2.5
Exhaust PM2.5
PM2.5 Total
Bio- CO2 NBio- CO2
ROG NOx CO SO2 Fugitive PM10
Exhaust PM10

Use DPF for Construction Equipment
Water Exposed Area
Reduce Vehicle Speed on Unpaved Roads
3.2 Renourishment - 2023Unmitigated Construction On-Site
6.90 45.00 EMFAC_Mix HHDT EMFAC_Mix
3.1 Mitigation Measures Construction
Renourishment 21 24.00 48.00 64,300.00 16.90
Worker Trip Length
Vendor Trip Length
Hauling Trip Length
Worker Vehicle Class
Vendor Vehicle Class
Hauling Vehicle Class
Trips and VMT
Phase Name Offroad Equipment Count
Worker Trip Number
Vendor Trip Number
Hauling Trip Number
Renourishment Tractors/Loaders/Backhoes 2 11.00 97 0.37
Renourishment Scrapers 2 11.00 361 0.48
Renourishment Rubber Tired Dozers 2 11.00 255 0.40
Renourishment Other Material Handling Equipment 3 11.00 167 0.40
Renourishment Other General Industrial Equipment 2 11.00 87 0.34
Renourishment Off-Highway Trucks 7 11.00 400 0.38
Renourishment Generator Sets 2 11.00 84 0.74
Load Factor
Renourishment Excavators 1 11.00 162 0.38
OffRoad Equipment
Phase Name Offroad Equipment Type Amount Usage Hours Horse Power
Acres of Grading (Site Preparation Phase): 0
Acres of Grading (Grading Phase): 0
Acres of Paving: 0
Residential Indoor: 0; Residential Outdoor: 0; Non-Residential Indoor: 0; Non-Residential Outdoor: 0 (Architectural Coating – sqft)
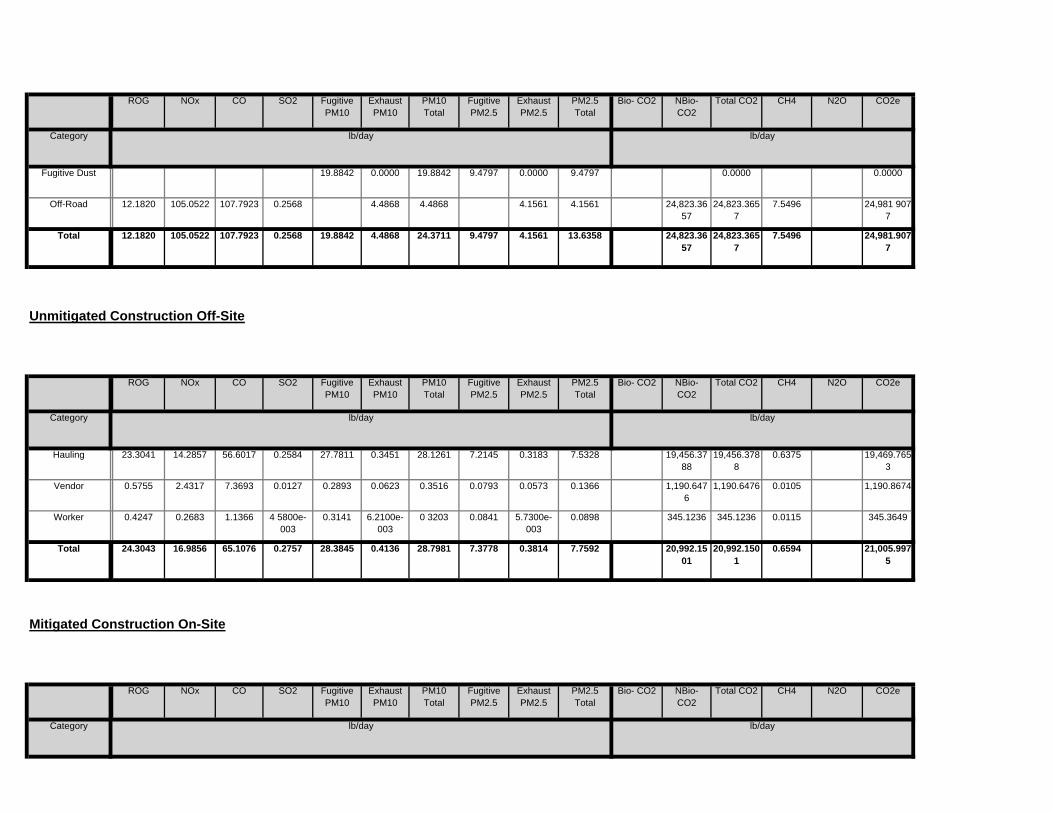
Total CO2 CH4 N2O CO2e
Category lb/day lb/day
PM10 Total
Fugitive PM2.5
Exhaust PM2.5
PM2.5 Total
Bio- CO2 NBio- CO2
Mitigated Construction On-Site
ROG NOx CO SO2 Fugitive PM10
Exhaust PM10
20,992.1501
20,992.1501
0.6594 21,005.9975
28.3845 0.4136 28.7981 7.3778 0.3814 7.7592Total 24.3043 16.9856 65.1076 0.2757
345.1236 345.1236 0.0115 345.36490.3141 6.2100e-003
0 3203 0.0841 5.7300e-003
0.0898Worker 0.4247 0.2683 1.1366 4 5800e-003
1,190.6476
1,190.6476 0.0105 1,190.86740.2893 0.0623 0.3516 0.0793 0.0573 0.1366Vendor 0.5755 2.4317 7.3693 0.0127
19,456.3788
19,456.3788
0.6375 19,469.7653
27.7811 0.3451 28.1261 7.2145 0.3183 7.5328Hauling 23.3041 14.2857 56.6017 0.2584
Total CO2 CH4 N2O CO2e
Category lb/day lb/day
PM10 Total
Fugitive PM2.5
Exhaust PM2.5
PM2.5 Total
Bio- CO2 NBio- CO2
Unmitigated Construction Off-Site
ROG NOx CO SO2 Fugitive PM10
Exhaust PM10
24,823.3657
24,823.3657
7.5496 24,981.9077
19.8842 4.4868 24.3711 9.4797 4.1561 13.6358Total 12.1820 105.0522 107.7923 0.2568
24,823.3657
24,823.3657
7.5496 24,981 9077
4.4868 4.4868 4.1561 4.1561Off-Road 12.1820 105.0522 107.7923 0.2568
0.0000 0.000019.8842 0.0000 19.8842 9.4797 0.0000 9.4797
CO2e
Category lb/day lb/day
Fugitive Dust
PM2.5 Total
Bio- CO2 NBio- CO2
Total CO2 CH4 N2OSO2 Fugitive PM10
Exhaust PM10
PM10 Total
Fugitive PM2.5
Exhaust PM2.5
ROG NOx CO

24,825.3833
24,825.3833
7.5442 24,983.8124
19.8842 4.0937 23.9779 9.4797 3.7906 13.2702Total 11.7349 97.4341 105.8811 0.2568
24,825.3833
24,825.3833
7.5442 24,983 8124
4.0937 4.0937 3.7906 3.7906Off-Road 11.7349 97.4341 105.8811 0.2568
0.0000 0.000019.8842 0.0000 19.8842 9.4797 0.0000 9.4797Fugitive Dust
Total CO2 CH4 N2O CO2e
Category lb/day lb/day
PM10 Total
Fugitive PM2.5
Exhaust PM2.5
PM2.5 Total
Bio- CO2 NBio- CO2
3.2 Renourishment - 2024Unmitigated Construction On-Site
ROG NOx CO SO2 Fugitive PM10
Exhaust PM10
20,992.1501
20,992.1501
0.6594 21,005.9975
28.3845 0.4136 28.7981 7.3778 0.3814 7.7592Total 24.3043 16.9856 65.1076 0.2757
345.1236 345.1236 0.0115 345.36490.3141 6.2100e-003
0 3203 0.0841 5.7300e-003
0.0898Worker 0.4247 0.2683 1.1366 4 5800e-003
1,190.6476
1,190.6476 0.0105 1,190.86740.2893 0.0623 0.3516 0.0793 0.0573 0.1366Vendor 0.5755 2.4317 7.3693 0.0127
19,456.3788
19,456.3788
0.6375 19,469.7653
27.7811 0.3451 28.1261 7.2145 0.3183 7.5328Hauling 23.3041 14.2857 56.6017 0.2584
Total CO2 CH4 N2O CO2e
Category lb/day lb/day
PM10 Total
Fugitive PM2.5
Exhaust PM2.5
PM2.5 Total
Bio- CO2 NBio- CO2
Mitigated Construction Off-Site
ROG NOx CO SO2 Fugitive PM10
Exhaust PM10
0.0000 24,823.3656
24,823.3656
7.5496 24,981.9077
6.1641 0.6730 6.8371 2.9387 0.6234 3.5621Total 12.1820 105.0522 107.7923 0.2568
0.0000 24,823.3656
24,823.3656
7.5496 24,981 9077
0.6730 0.6730 0.6234 0.6234Off-Road 12.1820 105.0522 107.7923 0.2568
0.0000 0.00006.1641 0.0000 6.1641 2.9387 0.0000 2.9387Fugitive Dust
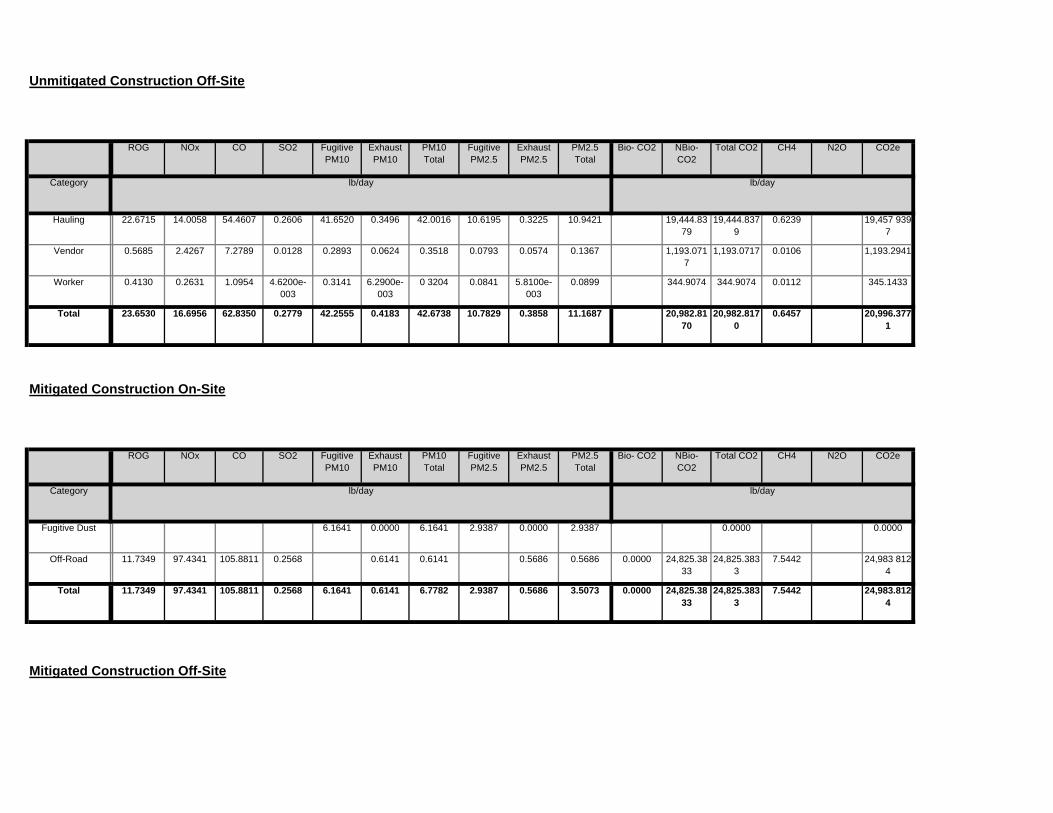
Mitigated Construction Off-Site
0.0000 24,825.3833
24,825.3833
7.5442 24,983.8124
6.1641 0.6141 6.7782 2.9387 0.5686 3.5073Total 11.7349 97.4341 105.8811 0.2568
0.0000 24,825.3833
24,825.3833
7.5442 24,983 8124
0.6141 0.6141 0.5686 0.5686Off-Road 11.7349 97.4341 105.8811 0.2568
0.0000 0.00006.1641 0.0000 6.1641 2.9387 0.0000 2.9387Fugitive Dust
Total CO2 CH4 N2O CO2e
Category lb/day lb/day
PM10 Total
Fugitive PM2.5
Exhaust PM2.5
PM2.5 Total
Bio- CO2 NBio- CO2
Mitigated Construction On-Site
ROG NOx CO SO2 Fugitive PM10
Exhaust PM10
20,982.8170
20,982.8170
0.6457 20,996.3771
42.2555 0.4183 42.6738 10.7829 0.3858 11.1687Total 23.6530 16.6956 62.8350 0.2779
344.9074 344.9074 0.0112 345.14330.3141 6.2900e-003
0 3204 0.0841 5.8100e-003
0.0899Worker 0.4130 0.2631 1.0954 4.6200e-003
1,193.0717
1,193.0717 0.0106 1,193.29410.2893 0.0624 0.3518 0.0793 0.0574 0.1367Vendor 0.5685 2.4267 7.2789 0.0128
19,444.8379
19,444.8379
0.6239 19,457 9397
41.6520 0.3496 42.0016 10.6195 0.3225 10.9421Hauling 22.6715 14.0058 54.4607 0.2606
Total CO2 CH4 N2O CO2e
Category lb/day lb/day
PM10 Total
Fugitive PM2.5
Exhaust PM2.5
PM2.5 Total
Bio- CO2 NBio- CO2
Unmitigated Construction Off-Site
ROG NOx CO SO2 Fugitive PM10
Exhaust PM10

4.4 Fleet MixHistorical Energy Use: N
5.1 Mitigation Measures Energy
0.002593 0.003201 0.003751 0.000525 0.001830
5.0 Energy Detail
SBUS MH
0.522550 0.057918 0.180146 0.126595 0.040312 0.006532 0.017397 0.036650
LHD2 MHD HHD OBUS UBUS MCY
H-S or C-C H-O or C-NW Primary Diverted Pass-by
LDA LDT1 LDT2 MDV LHD1
4.3 Trip Type Information
Miles Trip % Trip Purpose %
Land Use H-W or C-W H-S or C-C H-O or C-NW H-W or C-W
Total
MitigatedLand Use Weekday Saturday Sunday Annual VMT Annual VMT
4.0 Operational Detail - Mobile
4.1 Mitigation Measures Mobile
4.2 Trip Summary Information
Average Daily Trip Rate Unmitigated
20,982.8170
20,982.8170
0.6457 20,996.3771
42.2555 0.4183 42.6738 10.7829 0.3858 11.1687Total 23.6530 16.6956 62.8350 0.2779
344.9074 344.9074 0.0112 345.14330.3141 6.2900e-003
0 3204 0.0841 5.8100e-003
0.0899Worker 0.4130 0.2631 1.0954 4.6200e-003
1,193.0717
1,193.0717 0.0106 1,193.29410.2893 0.0624 0.3518 0.0793 0.0574 0.1367Vendor 0.5685 2.4267 7.2789 0.0128
19,444.8379
19,444.8379
0.6239 19,457 9397
41.6520 0.3496 42.0016 10.6195 0.3225 10.9421Hauling 22.6715 14.0058 54.4607 0.2606
Total CO2 CH4 N2O CO2e
Category lb/day lb/day
PM10 Total
Fugitive PM2.5
Exhaust PM2.5
PM2.5 Total
Bio- CO2 NBio- CO2
ROG NOx CO SO2 Fugitive PM10
Exhaust PM10

0.0000 0.00000.0000 0.0000 0.0000 0.0000Total 0.0000
0.0000 0.00000.0000 0.0000 0.0000 0.0000Consumer Products
0.0000
0.0000 0.00000.0000 0.0000 0.0000 0.0000Architectural Coating
0.0000
Total CO2 CH4 N2O CO2e
SubCategory lb/day lb/day
PM10 Total
Fugitive PM2.5
Exhaust PM2.5
PM2.5 Total
Bio- CO2 NBio- CO2
6.2 Area by SubCategoryUnmitigated
ROG NOx CO SO2 Fugitive PM10
Exhaust PM10
0.0000 0.00000.0000 0.0000 0.0000 0.0000Unmitigated 0.0000
0.0000 0.00000.0000 0.0000 0.0000 0.0000
CO2e
Category lb/day lb/day
Mitigated 0.0000
PM2.5 Total
Bio- CO2 NBio- CO2
Total CO2 CH4 N2OSO2 Fugitive PM10
Exhaust PM10
PM10 Total
Fugitive PM2.5
Exhaust PM2.5
6.0 Area Detail
6.1 Mitigation Measures Area
ROG NOx CO

Hours/Day Days/Year Horse Power Load Factor Fuel Type
10.0 Vegetation
7.0 Water Detail
7.1 Mitigation Measures Water
8.0 Waste Detail
8.1 Mitigation Measures Waste
9.0 Operational Offroad
Equipment Type Number
0.0000 0.00000.0000 0.0000 0.0000 0.0000Total 0.0000
0.0000 0.00000.0000 0.0000 0.0000 0.0000Consumer Products
0.0000
0.0000 0.00000.0000 0.0000 0.0000 0.0000Architectural Coating
0.0000
Total CO2 CH4 N2O CO2e
SubCategory lb/day lb/day
PM10 Total
Fugitive PM2.5
Exhaust PM2.5
PM2.5 Total
Bio- CO2 NBio- CO2
Mitigated
ROG NOx CO SO2 Fugitive PM10
Exhaust PM10