Embed Size (px)
Citation preview
ACE is supported by the Department for Environment, Food & Rural Affairs
Atmosphere, Climate & Environment Information Programme, aric
Manchester Metropolitan University Chester Street, Manchester M1 5GD
Tel: 0161 247 1590 Fax: 0161 247 6332 E-Mail: [email protected]
Internet: http://www.ace.mmu.ac.uk/
Fact Sheet Series for
Key Stage 4 and A-Level
Sue Hare, Laura Cresswell, Rebecca Twigg, & Joe Buchdahl
1999 (updated 2002)
ACE Information Programme aric
Air Pollution & Acid Rain Fact Sheets Series: KS4 & A 2
Introduction
The Science of Air Pollution & Acid Rain
01. What is Acid Rain?02. History of Air Pollution in the UK03. Changing Air Quality & Clean Air Acts04. The Key Air Pollutants05. Urban & Rural Air Quality Data in the UK06. Major UK Air Pollution Emissions from Transport07. Major UK Air Pollution Emissions from Power Stations & Industry08. Current Air Pollution Emissions in UK09. Deposition of Air Pollutants10. Critical Loads11. Urban Air Pollution in World Megacities
The Impacts of Air Pollution & Acid Rain
12. Impacts of Acid Rain on Buildings13. Freshwater Acidification14. Impacts of Air Pollution & Acid Rain on Farmland & Crops15. Impacts of Air Pollution & Acid Rain on Vegetation16. Impacts of Acid Rain on Soils17. Impacts of Air Pollution & Acid Rain on Wildlife18. Air Pollution and Human Health19. Air Quality and Lichens
ACE Information Programme aric
Air Pollution & Acid Rain Fact Sheets Series: KS4 & A 3
Managing Air Pollution & Acid Rain
20. The UK National Air Quality Strategy21. Standards & Guidelines of the Major Air Pollutants22. Monitoring & Modelling Air Pollution23. International Co-operation to Reduce Air Pollution24. Local Air Quality Management25. Motor Vehicle Emission Controls: Technologies26. Motor Vehicle Emission Controls: Fuel Types27. Industrial Emission Controls: Sulphur Dioxide28. Industrial Emission Controls: Nitrogen Oxide29. Sustainable Transport & Air Quality30. Reducing Air Pollution - How Can You Help?
Glossary
Further Reading
ACE Information Programme aric
Air Pollution & Acid Rain Fact Sheets Series: KS4 & A 4
Air pollution is a major problem that has been recognised throughout the world for hundreds of years. In the Middle Ages, the burning of coal in cities released increasing amounts of smoke and sulphur dioxide to the atmosphere. In the late 18th century, the Industrial Revolution, beginning in the UK, led to escalation in pollutant emissions based around the use of coal by both homes and industry. Pollutant emissions continued to grow through the 19th and early 20th centuries, and the dramatic smog episodes known as pea-soupers became common place in many of Britain’s inner cities. In addition, sulphur and nitrogen emissions were causing “acid rain” (or acid deposition), damaging buildings, forests and freshwater environments. After the infamous London Smog of 1952, pollution from industries and homes was dramatically reduced in an attempt to protect health. In more recent times pollution from motor vehicles has become the most recognised air quality issue. Present pollution monitoring is revealing that if we do not think and act cautiously then vehicle pollution could seriously damage the environment in which we live and render it unfit for generations to come. The number of cars on Britain’s roads is constantly increasing and a speed up in technological development is required to try and combat the pollution problem. The introduction of the catalytic converter reduced pollution significantly, but much more needs to be done to preserve the environment for the future. Research into alternative fuels is constantly ongoing, but they need to be available at a price everyone can afford. People need to be encouraged to use public transport or share cars whenever possible so only the minimum amount of pollution is created. A balanced solution integrating all methods of pollution reduction could help reduce emissions to a minimum. Air pollution and acid rain have negative effects on the environment in which we live. Air pollution from transport includes emissions of
ACE Information Programme aric
Air Pollution & Acid Rain Fact Sheets Series: KS4 & A 5
carbon monoxide, particulates, nitrogen oxide and hydrocarbons. Between 1980 and 1990 vehicle ownership in the UK increased by over one quarter. To compliment this vehicle usage increased by 50% during this time. If the use of the private vehicle continues to rise at this rate then impacts on wildlife, health and the general environment are likely to increase. Furthermore, acid rain is a transboundary pollution problem as emissions produced by one country can be deposited in another. The UK National Air Quality Strategy (March 1997 and January 2000) was published in response to the Environment Act of 1995, with commitments to achieve new air quality objectives throughout the UK by 2005. The strategy aims to address areas of poor and declining air quality, to reduce any significant risk to health and to achieve the wider objectives of sustainable development in relation to air quality in the UK. Sustainable development is development today that does not compromise the development needs of future generations. In practical terms, this means using resources, particularly fossil-fuel-derived energy, more efficiently, re-using and recycling products where possible, and developing renewable forms of energy which are inexhaustible and do not pollute the atmosphere. Sustainability will impact upon the energy, transport and waste management sectors; the challenge facing society today and in the future is to manage the transition from unsustainable to sustainable practices in these areas in a manner that does not adversely affect human welfare and standards of living.
The Atmospheric Research & Information Centre (aric), through its
Atmosphere, Climate and Environment Information Programme, has compiled a series of 30 topical fact sheets concerning air pollution and acid rain. The series is divided into three sections - the science of air pollution and acid rain (11), the impacts of air pollution and acid rain (8), and managing air pollution and acid rain (11). Together, they describe what air pollution and acid rain are, how they occur, their impacts, and ways to control or prevent them. The fact series is aimed at students involved in Key Stage 4 of the

ACE Information Programme aric
Air Pollution & Acid Rain Fact Sheets Series: KS4 & A 6
National Curriculum (GCSE) and higher. Although some of the concepts covered by the fact sheets may be challenging, a glossary is provided to compliment the main text, which sometimes contains words and phrases that may seem unfamiliar to the reader. Furthermore, there is also a list of additional reading materials concerning all the topics covered throughout this fact sheet series.
aric hope that the reader will find this fact sheet series a useful
information resource on air pollution and acid rain.
ACE Information Programme aric
Air Pollution & Acid Rain Fact Sheets Series: KS4 & A 7
Introduction Acid rain is a term which describes the acidity of wet and dry deposition. This includes acidity falling as rain, snow, sleet, hail, mist or fog (wet deposition) and the dry deposition of gases and particles.
Sources Rain water is naturally acidic as a result of carbon dioxide dissolved in water and from volcanic emissions of sulphur. However, it is the chemical conversion of sulphur and nitrogen emissions from power stations, factories, vehicles and homes, where fossil fuels are burnt, that we call acid rain. These waste gases are carried by the wind and can in time be converted into sulphuric and nitric acids, having travelled many hundreds of miles.
Sources of SO2 Natural sources of sulphur dioxide (SO2) include release from volcanoes, oceans, biological decay and forest fires. Actual amounts released from natural sources in the world are difficult to quantify; in 1983 the United Nations Environment Programme estimated a figure of between 80 million and 288 million tonnes of sulphur oxides per year. Sulphur dioxide emissions also result from combustion of fossil fuels due to varying amounts of sulphur being present in these fuels. World-wide emissions of SO2 are thought to be around 69 million tonnes per year (2000) and nitrogen oxides around 24 million tonnes per year (1990). Levels of SO2 from combustion sources in the UK have declined in recent decades. Between 1970 and 1999, UK SO2 emissions fell by
ACE Information Programme aric
Air Pollution & Acid Rain Fact Sheets Series: KS4 & A 8
82% due to recession, restructuring of industry, substitution of fuels (e.g. natural gas) and air pollution control technology. Power station emissions fell by 73% over the same period, but the percentage of UK emissions from power stations has actually increased to 65% of the 1999 total compared to 45% of the total in 1970.
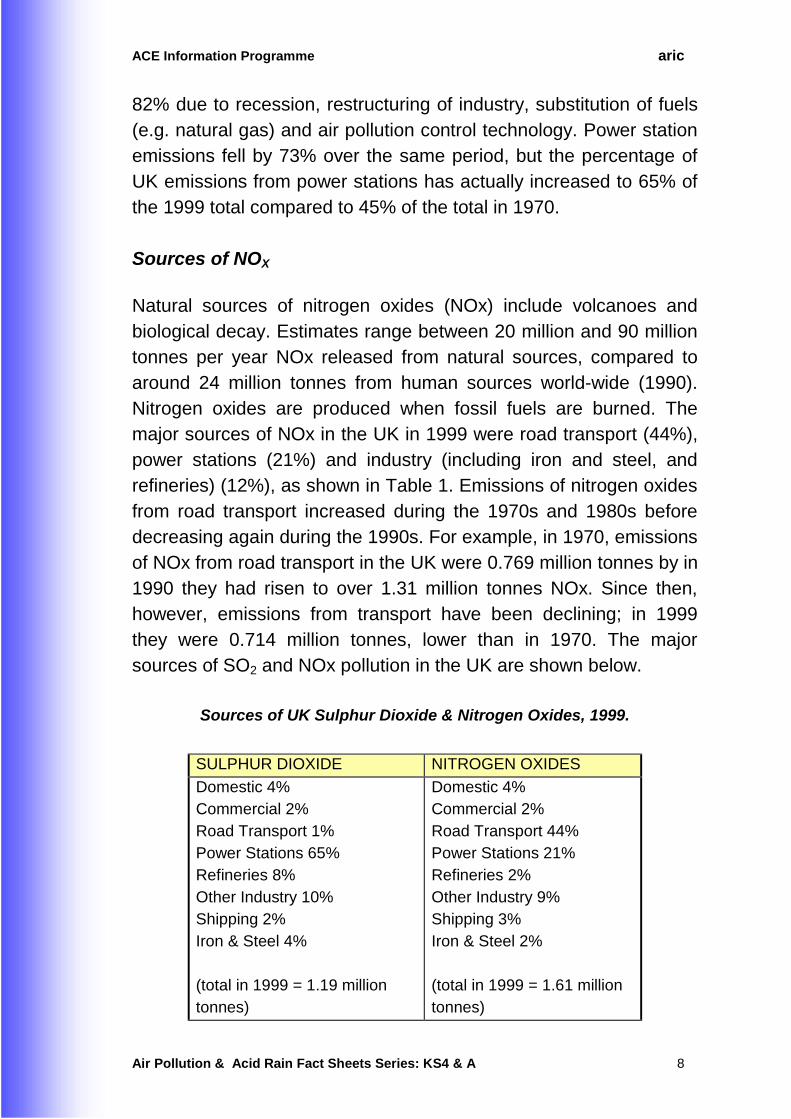
Sources of NOX Natural sources of nitrogen oxides (NOx) include volcanoes and biological decay. Estimates range between 20 million and 90 million tonnes per year NOx released from natural sources, compared to around 24 million tonnes from human sources world-wide (1990). Nitrogen oxides are produced when fossil fuels are burned. The major sources of NOx in the UK in 1999 were road transport (44%), power stations (21%) and industry (including iron and steel, and refineries) (12%), as shown in Table 1. Emissions of nitrogen oxides from road transport increased during the 1970s and 1980s before decreasing again during the 1990s. For example, in 1970, emissions of NOx from road transport in the UK were 0.769 million tonnes by in 1990 they had risen to over 1.31 million tonnes NOx. Since then, however, emissions from transport have been declining; in 1999 they were 0.714 million tonnes, lower than in 1970. The major sources of SO2 and NOx pollution in the UK are shown below.
Sources of UK Sulphur Dioxide & Nitrogen Oxides, 1999.
SULPHUR DIOXIDE NITROGEN OXIDES
Domestic 4% Commercial 2% Road Transport 1% Power Stations 65% Refineries 8% Other Industry 10% Shipping 2% Iron & Steel 4% (total in 1999 = 1.19 million tonnes)
Domestic 4% Commercial 2% Road Transport 44% Power Stations 21% Refineries 2% Other Industry 9% Shipping 3% Iron & Steel 2% (total in 1999 = 1.61 million tonnes)
ACE Information Programme aric
Air Pollution & Acid Rain Fact Sheets Series: KS4 & A 9
The geographical distribution of human emission sources is not even. Nitrogen and sulphur emission sources are heavily concentrated in the northern hemisphere, particularly in Europe and North America. As a result, precipitation is generally acidic in these countries (pH 4.1 to pH 5.1).
Deposition The distances that pollutant gases travel means that acidification is an international problem. In 1998, for example, the UK received one quarter of it sulphur deposition from other countries whereas, for example, Sweden and Norway both received more than 90% of their sulphur pollution from abroad. Acid pollutants are not necessarily deposited in the same country where they were produced.
Transport of Acidifying Gases The Chernobyl disaster of 1986 highlighted the way in which air pollutants are carried many hundreds and thousands of kilometres by the wind. The upper winds can move pollutants at a speed of 500km per day. The distance travelled depends upon a number of factors such as wind speed and direction, the height of release into the atmosphere, topography, and the presence or absence of other reactants.
Rainfall Acidity Rainfall is naturally acidic due to the presence of carbon dioxide in the atmosphere which combines with rainwater to form weak carbonic acid. However, the combustion of fossil fuels produces waste gases such as sulphur dioxide (SO2), oxides of nitrogen (collectively known as NOx) and to a lesser extent, chloride (Cl). These pollutants can be converted, through a series of complex
ACE Information Programme aric
Air Pollution & Acid Rain Fact Sheets Series: KS4 & A 10
chemical reactions, into sulphuric acid, nitric acid or hydrochloric acid, increasing the acidity of the rain or other type of precipitation.
Carbon dioxide + Water � Carbonic acid (weak) Sulphur dioxide + Water � Sulphuric acid Nitrogen oxides + Water � Nitric acid
The pH Scale Rainfall acidity is measured in pH units. The pH scale is used to measure the acidity of a solution and ranges from 0 to 14; 0 being the most acid, 7 being neutral and 14 being the most alkaline.
0 1 2 3 4 5 6 7 8 9 10 11 12 13 14
ACID NEUTRAL ALKALINE The pH scale is logarithmic rather than linear, and so there is a ten-fold increase in acidity with each pH unit, such that rainfall with pH 5 is 10 times more acidic than pH 6, rainfall with pH 4 is 100 times more acidic than pH 6 and rainfall with pH 3 is 1000 times more acidic than pH 6.
Conclusion Acid rain has been called the environmental issue of the 1980s although it continues to be a problem today. However, acid rain is not a new problem at all. It dates from the middle of the 19th century when a Scottish chemist, Robert Angus Smith, began to study the effect of air pollution in Manchester and used the term ‘acid rain’ to describe his findings. What is very new is the scale of the problem. In Smith's time, acid rain fell both in towns and cities and downwind from them, but now, the pollution is spread far and wide, within and between nations. It has now become an international problem.
ACE Information Programme aric
Air Pollution & Acid Rain Fact Sheets Series: KS4 & A 11
Introduction Concern about urban air quality is not new. Complaints were recorded in the 13th century when coal was first used in London. Since the middle of the 19th century, the atmosphere of the major British cities was regularly polluted by coal smoke in winter, giving rise to an infamous mixture of fog and smoke known as smog. Today the emphasis has shifted from the pollution problems caused by industry to the ones associated with motor vehicle emissions. The following pages show in chronological order the major pieces of legislation passed in the UK since 1845 with regards to combating air pollution in urban areas. 1273: Use of coal prohibited in London as being "prejudicial to health". 1306: Royal Proclamation: Prohibiting artificers (craftsmen) from using sea-coal (a soft coal) in their furnaces. 1845: Railway Clauses Consolidated Act: Required railway engines to consume their own smoke. 1847: The Improvement Clauses Act: Contained a section dealing with factory smoke. 1863: Alkali, etc. Works Regulation Act: Required that 95% of the offensive emissions should be arrested. 1866: The Sanitary Act: Empowered sanitary authorities to take action in cases of smoke nuisances.
ACE Information Programme aric
Air Pollution & Acid Rain Fact Sheets Series: KS4 & A 12
1875: The Public Health Act: Contained a section on smoke abatement from which legislation to the present day has been based. 1906: The Alkali, etc. Works Regulation Act: It extended and consolidated previous Acts and embodied the prevention of discharge of noxious or offensive gases from scheduled works by the use of best practicable means. 1926: Public Health (Smoke Abatement) Act: By which the Acts of 1875 and 1891 were amended and extended. 1946: First smokeless zone and prior approval legislation. 1956: Clean Air Act: Introduced Smoke control Areas, controlled chimney heights. Prohibited emission of dark smoke from chimneys, with some exceptions. 1968: Clean Air Act: Extended the smoke control provisions of the 1956 Act and added further prohibitions on dark smoke emission. 1970: EC Directive 70/220/EEC: Relating to measures to be taken against air pollution by gases from positive ignition engines of motor vehicles. Limited emissions of CO and hydrocarbons from petrol engines. Came into force in 1971. 1972: EC Directive 72/306/EEC: Measures to be taken against emissions from diesel engines for use in motor vehicles. Limited black smoke emissions from heavy duty vehicles. 1973: Motor Vehicles (Construction and Use) Regulations 1973.
ACE Information Programme aric
Air Pollution & Acid Rain Fact Sheets Series: KS4 & A 13
1974: Control of Pollution Act: Allowed for the regulation of the composition of motor fuels. In addition the Act limited the amount of sulphur in fuel oil. 1975: EC Directive 75/441/EEC: Set up a procedure for exchanging air quality information between Member States. Repealed in 1982. 1975: EC Directive 75/716/EEC: Concerned with the sulphur content of certain liquid fuels. Defined two types of gas oil (diesel and heating oil). Introduced in two stages, sulphur limits for these fuels. Amended in 1987: EC Directive 87/219/EEC: (1) The motor fuel (sulphur content of gas oil), (2) the oil fuel (sulphur content of gas). 1978: EC Directive 78/611/EEC: Concerning the lead content of petrol. Limited the maximum permissible lead content of petrol to 0.4gl-1. 1979: International Convention on Long Range Transboundary Pollution: Introduced to contol the transboundary effects of acid rain and to limit emission of acidifying pollutants. 1980: EC Directive 80/779/EEC: Air quality limit values and guide values for sulphur dioxide and suspended particles. 1981: The Motor Fuel (Lead content of Petrol) Regulation: Limited the maximum amount of lead in petrol to 0.4gl-1. 1982: EC Directive 82/884/EEC: Limit value for lead in the air.
ACE Information Programme aric
Air Pollution & Acid Rain Fact Sheets Series: KS4 & A 14
1984: Directive 84/360/EEC: Establishes a common framework directive on combating pollution from industrial plants throughout the Community. 1985: EC Directive 85/210/EEC: Allowed for the introduction of unleaded petrol. 1987: EC Directive 88/77/EC: Specified the measures to be taken against the emission of gaseous pollutants from diesel engines for use in vehicles. Controlled emissions of gaseous pollutants from heavy duty vehicles. AMENDED 1991:(EC Directive 91/542EEC). 1988: EC Directive 88/609/EEC: Limited emissions of SO2 and NOx and particulates from power stations and other large combustion plants. 1989: EC Directive 89/427/EEC: Limit values and guide values of air quality for sulphur dioxide and suspended particulates. Harmonised measurement methods. 1989: The Air Quality Standards Regulations: Brought into UK law as the limit and guide values for SO2 and suspended particulates, lead in air and nitrogen dioxide set by EC. 1989: EC Directive 89/429/EEC: Directive on air pollution from existing municipal waste incinerators. Set limits on new waste incinerators. 1989: EC Directive 89/369/EEC: Directive on air pollution from new municipal waste incinerators. Set emission limits on new waste incinerator. 1990: Environmental Protection Act: Brings many smaller emission sources under air pollution control by local authorities for the first time and establishes a system of
ACE Information Programme aric
Air Pollution & Acid Rain Fact Sheets Series: KS4 & A 15
integrated pollution control for the most potentially polluting industrial processes. 1991: The Road Vehicles Regulations: Set standards for in service emissions of carbon monoxide and hydrocarbons to be included in the MOT test for petrol cars and light goods vehicles. 1992: EC Directive 92/72/EEC: Air pollution by ozone. Establishes a harmonised procedure for monitoring, exchange of information and warnings to be issued to the public about ozone pollution. 1995: The Environment Act: This provides a new statutory framework for local air quality management. The Act requires publication of a National Strategy which will set air quality standards and targets for the pollutants of most concern. 1996 EC Directive 96/62/EC: This provides a new statutory framework for controlling levels of sulphur dioxide, nitrogen dioxide, particulate matter, lead and ozone, benzene, carbon monoxide, and other hydrocarbons. 1997: The National Air Quality Strategy: The first National Air Quality Strategy was published in response to The Environment Act on March 12th 1997, with commitments to achieve new air quality objectives throughout the UK by 2005. It is reviewed periodically. 2000: The Air Quality Strategy for England, Scotland, Wales and Northern Ireland: The second National Air Quality Strategy was published with new air quality objectives for local authorities.
ACE Information Programme aric
Air Pollution & Acid Rain Fact Sheets Series: KS4 & A 16
Introduction
In 1905 Dr HA Des Voeux used the term smog to describeconditions of fuliginous or sooty / smoky fogs. Smog occurs as aresult of particular meteorological conditions in which smokeparticles from the domestic and industrial burning of coal becametrapped in fog.
The Early 1900s
Fog and smoke frequencies began to reduce in the UK urban areasduring the early 1900s, compared with the latter half of thenineteenth century. Air pollution was still a severe problem but thenumber of major smogs began to decrease. Several changes helpedcontribute to this situation, including:
• changing social conditions;
• tighter industrial controls;
• declining importance of coal as a domestic fuel;
• changes in fuel type - gas and electricity became alternatives tocoal.
The Great London Smog
On December 4th 1952, however, an anticyclone settled overLondon. The wind dropped and the air grew damp; a thick fog beganto form. The great London smog lasted for five days and led toaround four thousand more deaths than usual.
ACE Information Programme aric
Air Pollution & Acid Rain Fact Sheets Series: KS4 & A 17
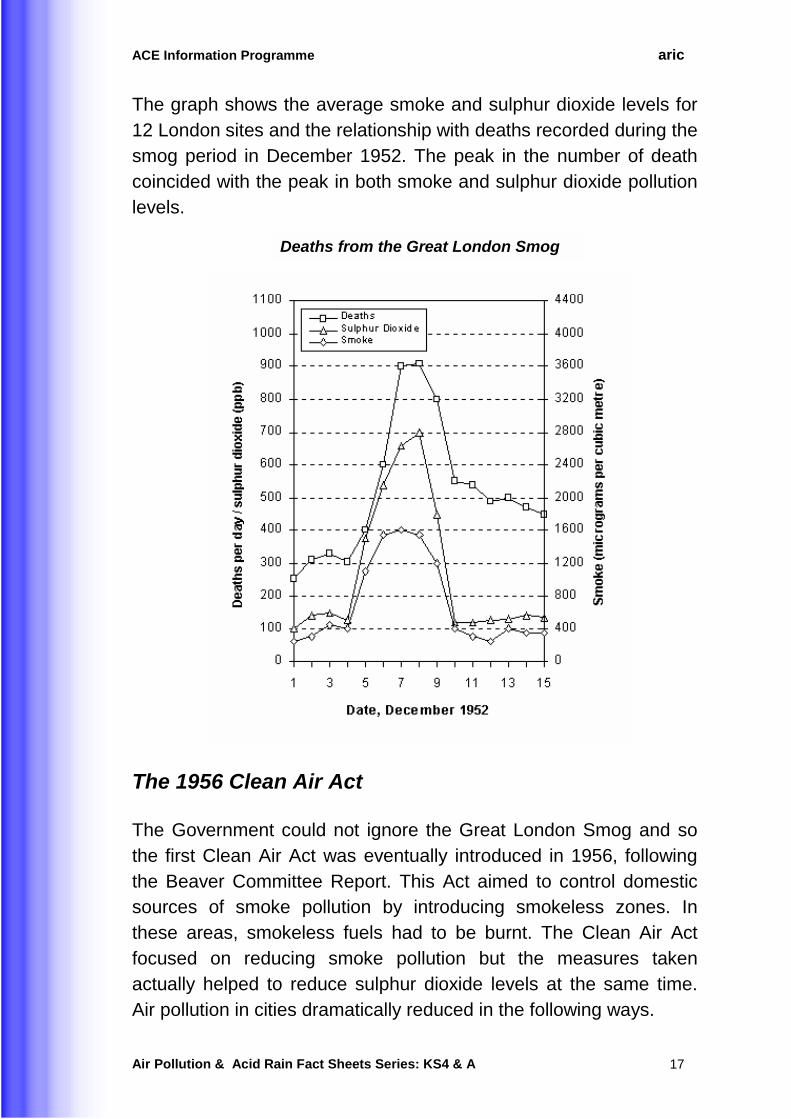
The graph shows the average smoke and sulphur dioxide levels for12 London sites and the relationship with deaths recorded during thesmog period in December 1952. The peak in the number of deathcoincided with the peak in both smoke and sulphur dioxide pollutionlevels.
The 1956 Clean Air Act
The Government could not ignore the Great London Smog and sothe first Clean Air Act was eventually introduced in 1956, followingthe Beaver Committee Report. This Act aimed to control domesticsources of smoke pollution by introducing smokeless zones. Inthese areas, smokeless fuels had to be burnt. The Clean Air Actfocused on reducing smoke pollution but the measures takenactually helped to reduce sulphur dioxide levels at the same time.Air pollution in cities dramatically reduced in the following ways.
Deaths from the Great London Smog
ACE Information Programme aric
Air Pollution & Acid Rain Fact Sheets Series: KS4 & A 18
• domestic emissions reduced because of smoke control areas;
• electric and gas usage increased and the use of solid fuelsdecreased;
• cleaner coals were burnt which had a lower sulphur content;
• use of tall chimney stacks on power stations;
• relocation of power stations to more rural areas;
• continued decline in heavy industry.
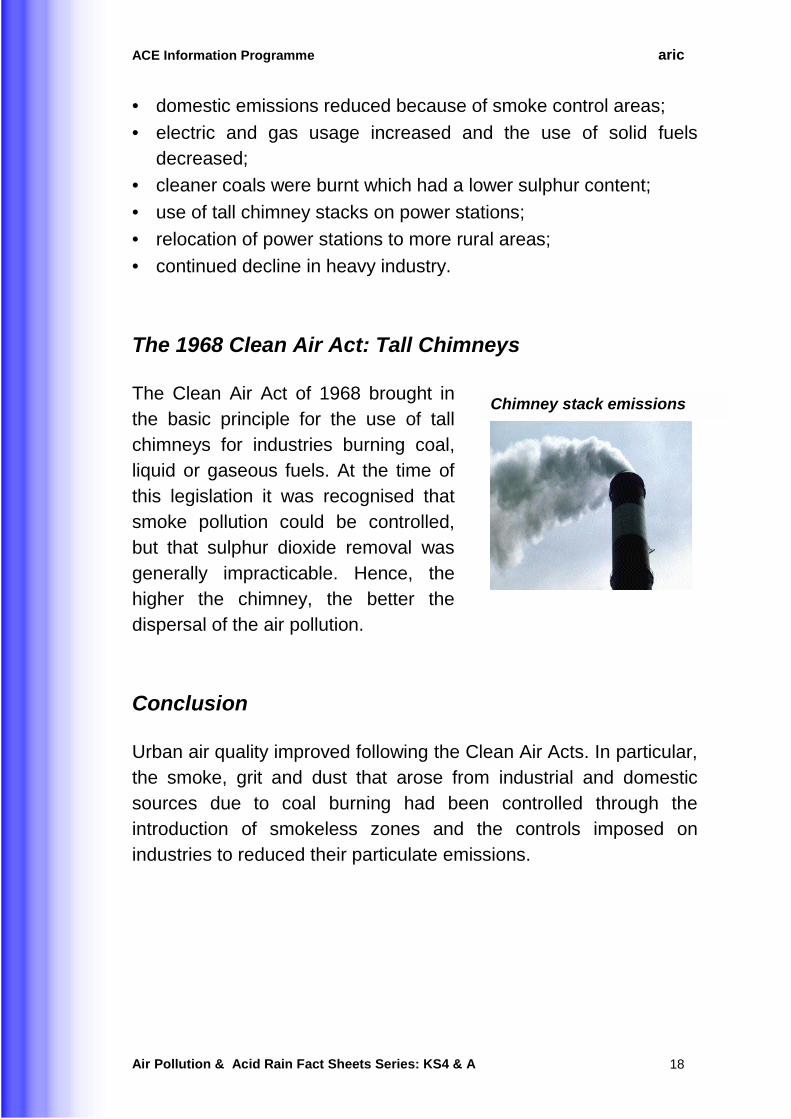
The 1968 Clean Air Act: Tall Chimneys
The Clean Air Act of 1968 brought inthe basic principle for the use of tallchimneys for industries burning coal,liquid or gaseous fuels. At the time ofthis legislation it was recognised thatsmoke pollution could be controlled,but that sulphur dioxide removal wasgenerally impracticable. Hence, thehigher the chimney, the better thedispersal of the air pollution.
Conclusion
Urban air quality improved following the Clean Air Acts. In particular,the smoke, grit and dust that arose from industrial and domesticsources due to coal burning had been controlled through theintroduction of smokeless zones and the controls imposed onindustries to reduced their particulate emissions.
Chimney stack emissions
ACE Information Programme aric
Air Pollution & Acid Rain Fact Sheets Series: KS4 & A 19
Introduction Air pollutants arise from a wide variety of sources, although they are mainly a result of the combustion process. The largest sources include motor vehicles and industry. The main air pollutants are reviewed according to: 1) description, 2) occurrence in air, and 3) major sources. The following units of measurement are used
throughout: ppb = parts per billion; ppm = parts per million; µµµµgm-3 =
micrograms per cubic metre; mgm-3 = milligrams per cubic metre;
µµµµm = micron or micrometre (one millionth of a metre).
Oxides of Nitrogen (NOx) 1. NOx is a collective term used to refer to two species of oxides of
nitrogen: nitric oxide (NO) and nitrogen dioxide (NO2). 2. Annual mean concentrations of NO2 in urban areas are generally
in the range 10-45 ppb (20-90 µgm-3). Levels vary significantly
throughout the day, with peaks generally occurring twice daily as a consequence of "rush hour" traffic. Maximum daily and one
hourly means can be as high as 200 ppb (400 µgm-3) and 600
ppb (1200 µgm-3) respectively.
3. Globally, quantities of nitrogen oxides produced naturally (by bacterial and volcanic action and lightning) far outweigh anthropogenic (man-made) emissions. Anthropogenic emissions are mainly due to fossil fuel combustion from both stationary sources, i.e. power generation (21%), and mobile sources, i.e. transport (44%). Other atmospheric contributions come from non-combustion processes, for example nitric acid manufacture, welding processes and the use of explosives.
ACE Information Programme aric
Air Pollution & Acid Rain Fact Sheets Series: KS4 & A 20
Sulphur Dioxide (SO2) 1. SO2 is a colourless gas. It reacts on the surface of a variety of
airborne solid particles, is soluble in water and can be oxidised within airborne water droplets.
2. Annual mean concentrations in most major UK cities are now well
below 35 ppb (100 µgm-3) with typical mean values in the range
of 5-20 ppb (15-50 µgm-3). Hourly peak values can be 400-750
ppb (1000-2000 µgm-3) on infrequent occasions. Natural
background levels are about 2 ppb (5 µgm-3).
3. The most important sources of SO2 are fossil fuel combustion, smelting, manufacture of sulphuric acid, conversion of wood pulp to paper, incineration of refuse and production of elemental sulphur. Coal burning is the single largest man-made source of SO2 accounting for about 50% of annual global emissions, with oil burning accounting for a further 25-30%.
Carbon Monoxide (CO) 1. Carbon Monoxide is a colourless, odourless, tasteless gas that is
slightly lighter than air. 2. Natural background levels of CO fall in the range of 10-200 ppb.
Levels in urban areas are highly variable, depending upon weather conditions and traffic density. 8-hour mean values are generally less than 10 ppm (12 mgm-3) but have been known to be as high as 500 ppm (600 mgm-3).
3. CO is an intermediate product through which all carbon species must pass when combusted in oxygen (O2). In the presence of an adequate supply of O2 most CO produced during combustion is immediately oxidised to carbon dioxide (CO2). However, this is not the case in spark ignition engines, especially under idling and deceleration conditions. Thus, the major source of atmospheric CO is the spark ignition combustion engine. Smaller contributions come from processes involving the combustion of organic matter, for example in power stations and waste incineration.
ACE Information Programme aric
Air Pollution & Acid Rain Fact Sheets Series: KS4 & A 21
Ozone (O3) 1. O3 is the tri-atomic form of molecular oxygen. It is a strong
oxidising agent, and hence highly reactive. 2. Background levels of O3 in Europe are usually less than 15 ppb
but can be as high as 100 ppb during summer time photochemical smog episodes. In the UK ozone occurs in higher concentrations during summer than winter, in the south rather than the north and in rural rather than urban areas.
3. Most O3 in the troposphere (lower atmosphere) is formed indirectly by the action of sunlight on nitrogen dioxide - there are no direct emissions of O3 to the atmosphere. About 10 - 15% of tropospheric O3 is transported from the stratosphere where it is formed by the action of ultraviolet (UV) radiation on O2. In addition to O3, photochemical reactions involving sunlight produce a number of oxidants including peroxyacetyl nitrate (PAN), nitric acid and hydrogen peroxide, as well as secondary aldehydes, formic acid, fine particulates and an array of short lived radicals. As a result of the various reactions that take place, O3 tends to build up downwind of urban centres where most of NOx is emitted from vehicles.
Particulate Matter 1. Particulate matter is a complex mixture of organic and inorganic
substances, present in the atmosphere as both liquids and solids. Coarse particulates can be regarded as those with an
aerodynamic diameter greater than 2.5 µm (micrometres), and
fine particles less than 2.5 µm. Coarse particles usually contain
earth crustal materials and fugitive dust from roads and industries. Fine particles contain the secondarily formed aerosols, combustion particles and re-condensed organic and metallic vapours. The acid component of particulate matter generally occurs as fine particles. A further distinction that can be made is to classify particulates as either primary or secondary, according
ACE Information Programme aric
Air Pollution & Acid Rain Fact Sheets Series: KS4 & A 22
to their origin. Primary particulates are those emitted directly to the atmosphere while secondary particulates are those formed by reactions involving other pollutants. In the urban context, most secondary particulate matter occurs as sulphates and nitrates formed in reactions involving SO2 and NOx.
2. Reported concentrations vary according to the sampling technique. In urban areas typical annual mean values are 10 - 40
µgm-3 (gravimetric sampling) although short-lived pollution
episodes such as Bonfire night can cause particulate
concentrations to rise to several hundred µgm-3. Background
levels in rural areas range from 0-10 µgm-3 .
3. Particulate matter is emitted from a wide range of sources, the most significant primary sources being road transport (20%), homes (20%), construction, mining and quarrying (13%), industrial combustion plants and processes (10%) and public power generation (10%). Natural sources are less important; these include volcanoes and dust storms. Particulate matter can also be formed by the transformation of gaseous emissions such as oxides of sulphur and nitrogen and VOCs.
Volatile Organic Compounds (VOCs) 1. VOCs comprise a very wide range of individual substances,
including hydrocarbons, halocarbons and oxygenates. All are organic compounds and of sufficient volatility to exist as vapour in the atmosphere. Methane is an important component of VOCs, its environmental impact principally related to its contribution to global warming and to the production of ozone in the troposphere. Regional effects derive from non-methane VOCs (NMVOCs), such as benzene and toluene.
2. Most measurements of total VOCs are in terms of their carbon content, without analysis as individual compounds. The major contributor to VOCs is normally methane with a local background concentration of 1.6 ppm. Whilst most other individual compounds (e.g. benzene) are present in urban air at
ACE Information Programme aric
Air Pollution & Acid Rain Fact Sheets Series: KS4 & A 23
concentrations of a few ppb, or less, total NMVOCs will amount to several hundred ppb concentrations.
3. Hydrocarbons are emitted from petrol evaporation and incomplete combustion, and from leakage of natural gas from distribution systems. Oxygenates arise in vehicle exhausts and via atmospheric chemical reactions. Evaporation of solvents, used in paints or industrial degreasing processes, cause a release of hydrocarbons, oxygenates and halocarbons to the atmosphere.
Benzene (C6H6) 1. C6H6 is a colourless, clear liquid. It is fairly stable but highly
volatile, i.e. it readily evaporates. 2. Ambient concentrations of benzene are typically between 1 - 50
ppb. Levels close to major emission sources can be as high as several hundred ppb. The urban background mean concentration
of benzene is 1 to 2 ppb (3 to 6 µgm-3); rural areas average 0.5 to
1 ppb (1.5 to 3 µgm-3). Mean annual concentration can be 5 ppb
(15 µgm-3) on urban roadsides.
3. About 80% of man-made emissions come from petrol-fuelled vehicles. This results from both the benzene content of the fuel and partial combustion of the petrol. A further 5% comes from the handling, distribution and storage of petrol and approximately 1% comes from oil refining. Emissions also come from benzene-producing and handling industries, the burning of wood and other organic material, and the use of benzene as a laboratory reagent.
ACE Information Programme aric
Air Pollution & Acid Rain Fact Sheets Series: KS4 & A 24
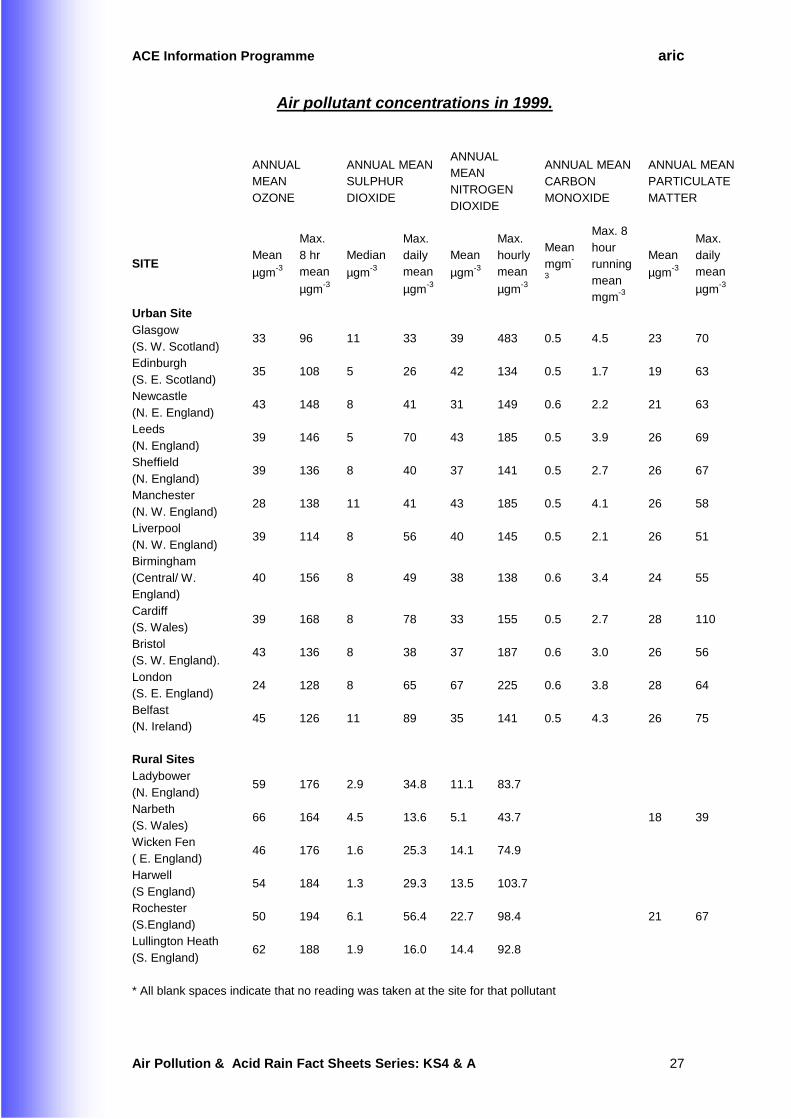
Introduction A selection of 12 urban sites and 6 rural sites from the UK automatic monitoring networks have been chosen for this factsheet in order to give a summary of typical air quality levels for various pollutants for 1999.
• = Ozone (O3)
• = Sulphur dioxide (SO2)
• = Nitrogen dioxide (NO2)
• = Carbon monoxide (CO)
• = Particulates (PM10) The results from this investigation show a number of findings which are discussed below. Whilst the data are for 1999, the general pattern of atmospheric concentrations of air pollutants is similar in other years. Data is tabulated at the end of the factsheet.
Ozone Levels of ozone are highest in rural areas, particularly those in southern England. Higher ozone levels are expected in southern and eastern England due to the transport of polluted air from Europe.
Sulphur Dioxide The highest levels of SO2 are found in urban areas whilst very low levels are recorded in rural areas. This is because the major
ACE Information Programme aric
Air Pollution & Acid Rain Fact Sheets Series: KS4 & A 25
emitters of SO2 are domestic, industrial and power generation sources, often located in or near urban areas. The high level of SO2 in Belfast reflects the greater use of coal compared to the British cities, and the topography of Belfast prevents effective dispersion as it is surrounded by hills on three sides. Industrial plants in south Wales are also likely to be responsible for occasional high concentrations of sulphur dioxide at the Cardiff site.
Nitrogen Dioxide NO2 is a traffic-related pollutant and hence emissions are expected to be highest in urban rather than rural areas. The table shows that NO2 levels were clearly seen to be higher in the city centre sites than the rural locations.
Carbon Monoxide CO is considered as an urban pollutant because it is traffic related. Annual mean levels of CO at all the urban sites were quite similar. This would be expected due to high vehicle use in each city. Carbon monoxide is rarely monitored in rural locations.
Particulates Particulate sources are very diverse and include motor vehicles, fuel combustion and construction work as well as aerosol particles produced by reactions between gases in the air. There may be particular pollution incidences of PM10 at times, for example on Bonfire Night or long distance transport of particles such as dust from the Saharan desert.
ACE Information Programme aric
Air Pollution & Acid Rain Fact Sheets Series: KS4 & A 26
Conclusion There are various standards and guidelines issued around the world which can be used to assess air quality. Guidelines in the UK have been issued by the UK Air Quality Strategy based on advice from the Expert Panel on Air Quality Standards, and European standards. The World Health Organisation have also set guidelines for air pollutants. Guidelines are usually set at levels which are unlikely to have any adverse effects on healthy individuals. There is, however, often controversy as to what levels of each pollutant can be considered to have no harmful effects as some individuals can be more sensitive to air pollution than others, for example, the very young, the elderly and those with respiratory problems. Guidelines are usually revised regularly and the stated ‘safe’ levels are often downwardly revised as new research findings become available.
ACE Information Programme aric
Air Pollution & Acid Rain Fact Sheets Series: KS4 & A 27
Air pollutant concentrations in 1999.
ANNUAL MEAN
OZONE
ANNUAL MEAN SULPHUR
DIOXIDE
ANNUAL MEAN
NITROGEN DIOXIDE
ANNUAL MEAN
CARBON MONOXIDE
ANNUAL MEAN PARTICULATE
MATTER
SITE Mean
µgm-3
Max.
8 hr mean
µgm-3
Median
µgm-3
Max.
daily mean
µgm-3
Mean
µgm-3
Max.
hourly mean
µgm-3
Mean
mgm-
3
Max. 8
hour running
mean mgm-3
Mean
µgm-3
Max.
daily mean
µgm-3
Urban Site Glasgow
(S. W. Scotland) 33 96 11 33 39 483 0.5 4.5 23 70
Edinburgh
(S. E. Scotland) 35 108 5 26 42 134 0.5 1.7 19 63
Newcastle
(N. E. England) 43 148 8 41 31 149 0.6 2.2 21 63
Leeds
(N. England) 39 146 5 70 43 185 0.5 3.9 26 69
Sheffield
(N. England) 39 136 8 40 37 141 0.5 2.7 26 67
Manchester
(N. W. England) 28 138 11 41 43 185 0.5 4.1 26 58
Liverpool
(N. W. England) 39 114 8 56 40 145 0.5 2.1 26 51
Birmingham
(Central/ W. England)
40 156 8 49 38 138 0.6 3.4 24 55
Cardiff (S. Wales)
39 168 8 78 33 155 0.5 2.7 28 110
Bristol (S. W. England).
43 136 8 38 37 187 0.6 3.0 26 56
London (S. E. England)
24 128 8 65 67 225 0.6 3.8 28 64
Belfast (N. Ireland)
45 126 11 89 35 141 0.5 4.3 26 75
Rural Sites
Ladybower
(N. England) 59 176 2.9 34.8 11.1 83.7
Narbeth
(S. Wales) 66 164 4.5 13.6 5.1 43.7 18 39
Wicken Fen
( E. England) 46 176 1.6 25.3 14.1 74.9
Harwell
(S England) 54 184 1.3 29.3 13.5 103.7
Rochester
(S.England) 50 194 6.1 56.4 22.7 98.4 21 67
Lullington Heath
(S. England) 62 188 1.9 16.0 14.4 92.8
* All blank spaces indicate that no reading was taken at the site for that pollutant
ACE Information Programme aric
Air Pollution & Acid Rain Fact Sheets Series: KS4 & A 28
Introduction The relationship between humans and vehicles probably began about 3000 BC with the invention of the wheel. The first linking of wheels with engines occurred in the 18th century with the appearance of steam power. However, it was not until the invention of the internal combustion engine towards the end of the 19th Century that a practical horseless carriage was invented. In the early 20th Century the introduction of assembly line techniques put the motor car within reach of many more people. Motor vehicles now include petrol and diesel-engined cars, motorcycles, light vans, passenger service vehicles (buses and coaches) and heavy goods vehicles (HGVs). There are currently about 24 million cars on the UK’s roads. Petrol is the major fuel type used for cars and light vans, with diesel making up 14% (2001) and other fuel sources making up the remaining 1%. HGVs, light goods vehicles, motorcycles and passenger service vehicles make up around 5 million vehicles, making the total number of vehicles on the UK’s roads approximately 29 million. The transport related problems that we are experiencing now will be made worse by the projected increase in UK traffic. The Department for Transport's (DfT) 10 Year Plan projects an increase in vehicle traffic of 17% from 2000 to 2010 (compared to 21% without the Plan). Road traffic and hence vehicle pollution, tends to be greatest in urban areas. The impacts of exhaust emissions include acid deposition and air pollution, human health effects, global climate change and noise pollution. Since the 1950s, emissions from aircraft have been increasing, posing yet further problems for the environment, both local and global. Today, the growth in air transport is faster than that witnessed for land-based vehicles.
ACE Information Programme aric
Air Pollution & Acid Rain Fact Sheets Series: KS4 & A 29
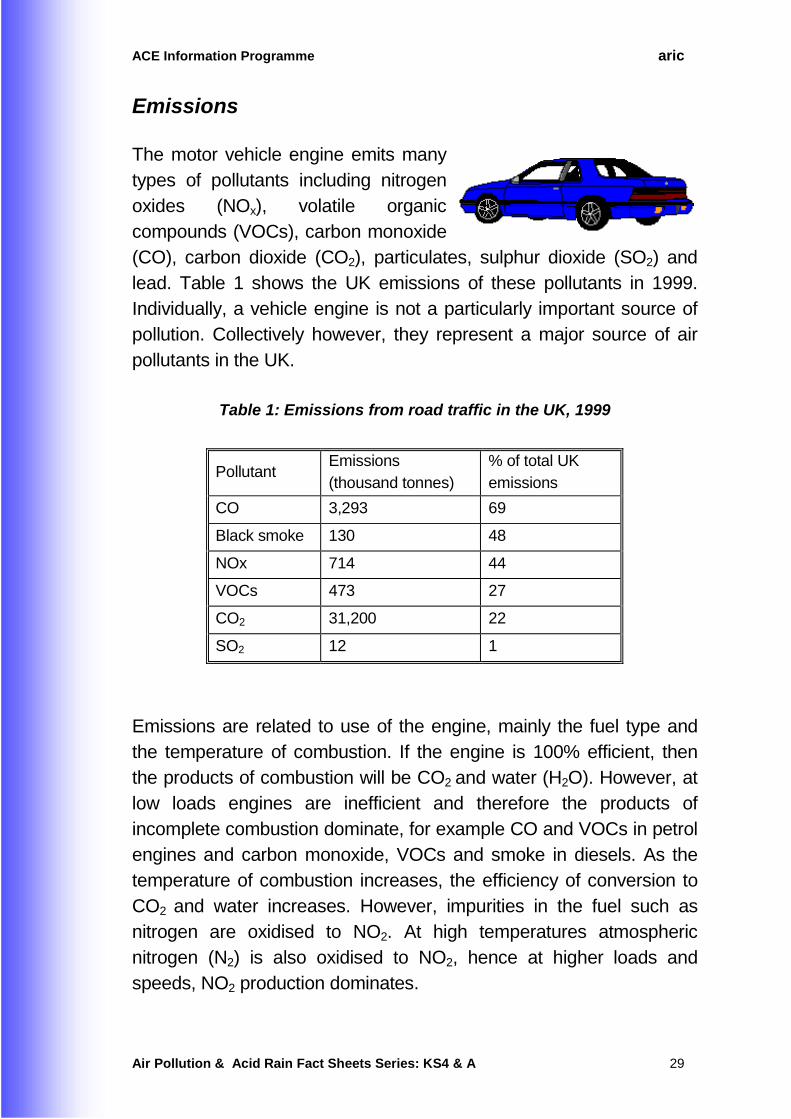
Emissions The motor vehicle engine emits many types of pollutants including nitrogen oxides (NOx), volatile organic compounds (VOCs), carbon monoxide (CO), carbon dioxide (CO2), particulates, sulphur dioxide (SO2) and lead. Table 1 shows the UK emissions of these pollutants in 1999. Individually, a vehicle engine is not a particularly important source of pollution. Collectively however, they represent a major source of air pollutants in the UK.
Table 1: Emissions from road traffic in the UK, 1999
Pollutant Emissions (thousand tonnes)
% of total UK emissions
CO 3,293 69
Black smoke 130 48
NOx 714 44
VOCs 473 27
CO2 31,200 22
SO2 12 1
Emissions are related to use of the engine, mainly the fuel type and the temperature of combustion. If the engine is 100% efficient, then the products of combustion will be CO2 and water (H2O). However, at low loads engines are inefficient and therefore the products of incomplete combustion dominate, for example CO and VOCs in petrol engines and carbon monoxide, VOCs and smoke in diesels. As the temperature of combustion increases, the efficiency of conversion to CO2 and water increases. However, impurities in the fuel such as nitrogen are oxidised to NO2. At high temperatures atmospheric nitrogen (N2) is also oxidised to NO2, hence at higher loads and speeds, NO2 production dominates.
ACE Information Programme aric
Air Pollution & Acid Rain Fact Sheets Series: KS4 & A 30
Emission of VOCs from motor vehicles is a problem that accounts for 40% of anthropogenic (man-made) emissions in Western Europe. Most VOCs are emitted in the exhaust, although they also escape at other points within the fuelling chain. Evaporative losses can occur during filling, the so-called “fuelling loss”. Losses can also occur from the engine when the car is being driven and when the engine is cooling down. VOCs are also released from the fuel tank as the temperature goes up and down during the day; this is called the “breathing loss” and is due to vapour evaporating from the petrol as the fuel gets hot.
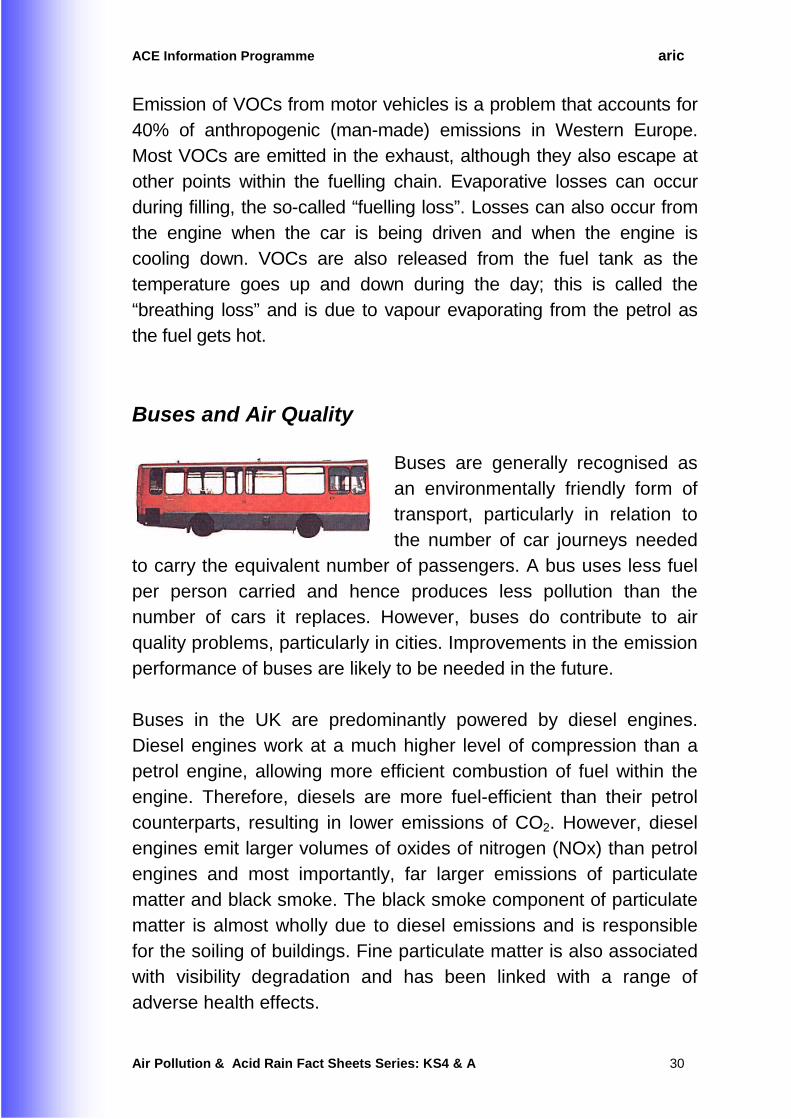
Buses and Air Quality
Buses are generally recognised as an environmentally friendly form of transport, particularly in relation to the number of car journeys needed
to carry the equivalent number of passengers. A bus uses less fuel per person carried and hence produces less pollution than the number of cars it replaces. However, buses do contribute to air quality problems, particularly in cities. Improvements in the emission performance of buses are likely to be needed in the future. Buses in the UK are predominantly powered by diesel engines. Diesel engines work at a much higher level of compression than a petrol engine, allowing more efficient combustion of fuel within the engine. Therefore, diesels are more fuel-efficient than their petrol counterparts, resulting in lower emissions of CO2. However, diesel engines emit larger volumes of oxides of nitrogen (NOx) than petrol engines and most importantly, far larger emissions of particulate matter and black smoke. The black smoke component of particulate matter is almost wholly due to diesel emissions and is responsible for the soiling of buildings. Fine particulate matter is also associated with visibility degradation and has been linked with a range of adverse health effects.
ACE Information Programme aric
Air Pollution & Acid Rain Fact Sheets Series: KS4 & A 31
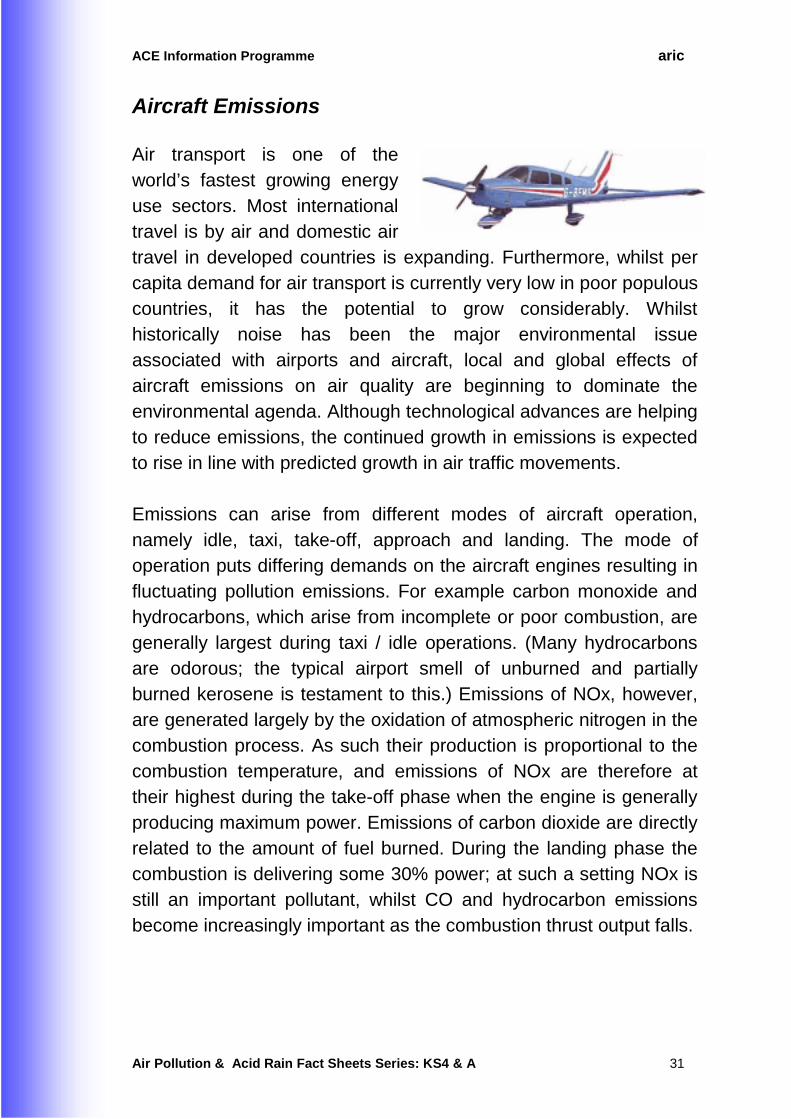
Aircraft Emissions Air transport is one of the world’s fastest growing energy use sectors. Most international travel is by air and domestic air travel in developed countries is expanding. Furthermore, whilst per capita demand for air transport is currently very low in poor populous countries, it has the potential to grow considerably. Whilst historically noise has been the major environmental issue associated with airports and aircraft, local and global effects of aircraft emissions on air quality are beginning to dominate the environmental agenda. Although technological advances are helping to reduce emissions, the continued growth in emissions is expected to rise in line with predicted growth in air traffic movements. Emissions can arise from different modes of aircraft operation, namely idle, taxi, take-off, approach and landing. The mode of operation puts differing demands on the aircraft engines resulting in fluctuating pollution emissions. For example carbon monoxide and hydrocarbons, which arise from incomplete or poor combustion, are generally largest during taxi / idle operations. (Many hydrocarbons are odorous; the typical airport smell of unburned and partially burned kerosene is testament to this.) Emissions of NOx, however, are generated largely by the oxidation of atmospheric nitrogen in the combustion process. As such their production is proportional to the combustion temperature, and emissions of NOx are therefore at their highest during the take-off phase when the engine is generally producing maximum power. Emissions of carbon dioxide are directly related to the amount of fuel burned. During the landing phase the combustion is delivering some 30% power; at such a setting NOx is still an important pollutant, whilst CO and hydrocarbon emissions become increasingly important as the combustion thrust output falls.
ACE Information Programme aric
Air Pollution & Acid Rain Fact Sheets Series: KS4 & A 32
Introduction Industries contribute significantly to the air pollution problems in the UK. During the Industrial Revolution industries were often located in urban areas. Following the Clean Air Acts and with the decline in heavy industry, few large industries and power stations are located in towns and cities today. Many large industries are now located in the more rural areas of the UK. However, most urban areas have some smaller industries and possibly a power station. The larger industrial sources, even though located out of town, also have an impact on urban air quality.
Industrial Smoke Pollution Smoke pollution can be defined as particulate material less than
15µm in diameter, which arises from the incomplete combustion of
fuel. Estimates for emission of smoke in the UK for 1999 identify that power stations account for 5% of UK emissions and other industries for 2%. The significant sources of smoke pollution are therefore not industries, but rather road vehicles (48%) and domestic sources (29%). In the past, urban air pollution was dominated by thick black smoke, which was emitted by industries and power plants burning coal. Levels of smoke in cities and towns during the wintertime in particular were at much higher concentrations than those measured today. In the early 1960s, winter smoke concentrations in
Manchester averaged at more than 250µgm-3. Today the typical
urban annual mean for smoke is 10 - 40µgm-3. The amount has
decreased dramatically due to technical industrial air pollution
ACE Information Programme aric
Air Pollution & Acid Rain Fact Sheets Series: KS4 & A 33
control, the decline in the use of coal for domestic purposes and the general shift of power stations and industries from town and city centres to more rural locations.
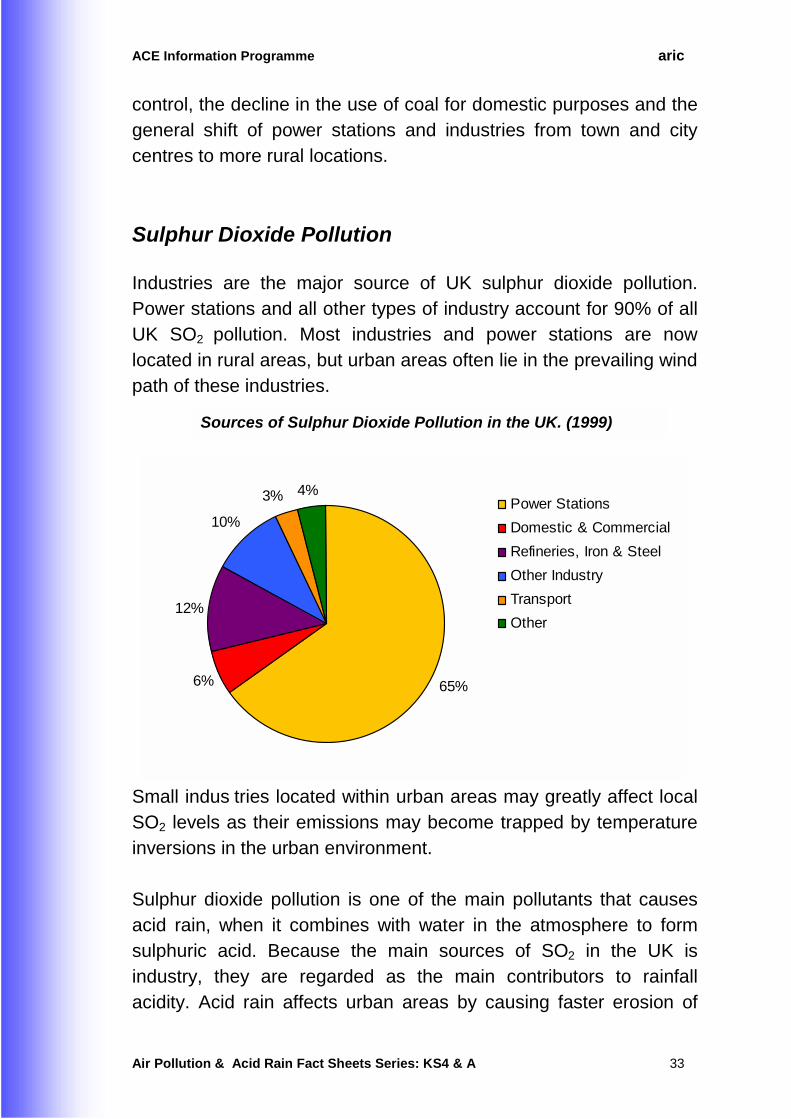
Sulphur Dioxide Pollution Industries are the major source of UK sulphur dioxide pollution. Power stations and all other types of industry account for 90% of all UK SO2 pollution. Most industries and power stations are now located in rural areas, but urban areas often lie in the prevailing wind path of these industries.
Small indus tries located within urban areas may greatly affect local SO2 levels as their emissions may become trapped by temperature inversions in the urban environment. Sulphur dioxide pollution is one of the main pollutants that causes acid rain, when it combines with water in the atmosphere to form sulphuric acid. Because the main sources of SO2 in the UK is industry, they are regarded as the main contributors to rainfall acidity. Acid rain affects urban areas by causing faster erosion of
Sources of Sulphur Dioxide Pollution in the UK. (1999)
65%6%
12%
10%
3% 4%Power Stations
Domestic & Commercial
Refineries, Iron & Steel
Other Industry
Transport
Other
ACE Information Programme aric
Air Pollution & Acid Rain Fact Sheets Series: KS4 & A 34
certain building materials and it can causes damage to urban vegetation.
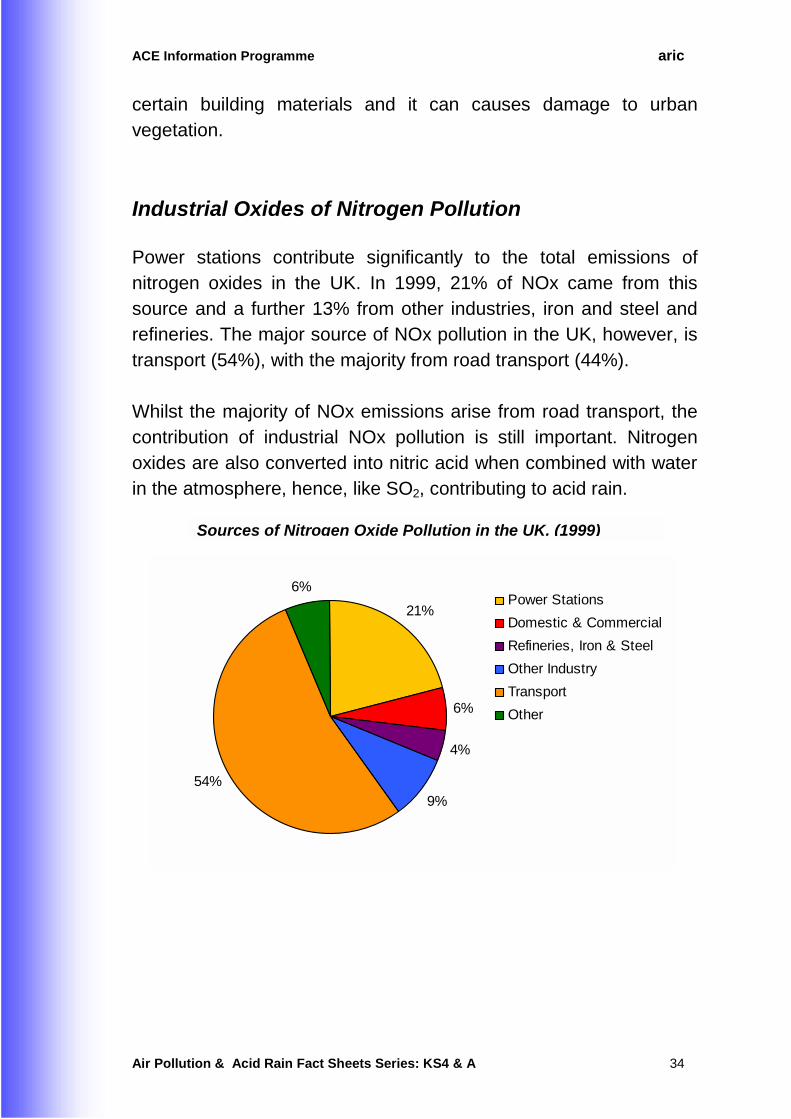
Industrial Oxides of Nitrogen Pollution Power stations contribute significantly to the total emissions of nitrogen oxides in the UK. In 1999, 21% of NOx came from this source and a further 13% from other industries, iron and steel and refineries. The major source of NOx pollution in the UK, however, is transport (54%), with the majority from road transport (44%). Whilst the majority of NOx emissions arise from road transport, the contribution of industrial NOx pollution is still important. Nitrogen oxides are also converted into nitric acid when combined with water in the atmosphere, hence, like SO2, contributing to acid rain.
Sources of Nitrogen Oxide Pollution in the UK. (1999)
21%
6%
4%
9%
54%
6%Power Stations
Domestic & Commercial
Refineries, Iron & Steel
Other Industry
Transport
Other
ACE Information Programme aric
Air Pollution & Acid Rain Fact Sheets Series: KS4 & A 35
Other Air Pollutants Industries do not emit large quantities of the other urban air pollutants. The UK contribution of power stations and industrial sources in 1999 for carbon monoxide was 5% and for volatile organic compounds less than 1%.
Conclusion Power generation and industry are the main sources of sulphur dioxide emissions, the precursor for sulphuric acid in acid rain, in the UK. Such emissions, however, have been falling steadily since 1990. For other major air pollutants, including the oxides of nitrogen, black smoke, VOCs and carbon monoxide, transport accounts for a much larger proportion of UK emissions than power generation and industry.
ACE Information Programme aric
Air Pollution & Acid Rain Fact Sheets Series: KS4 & A 36
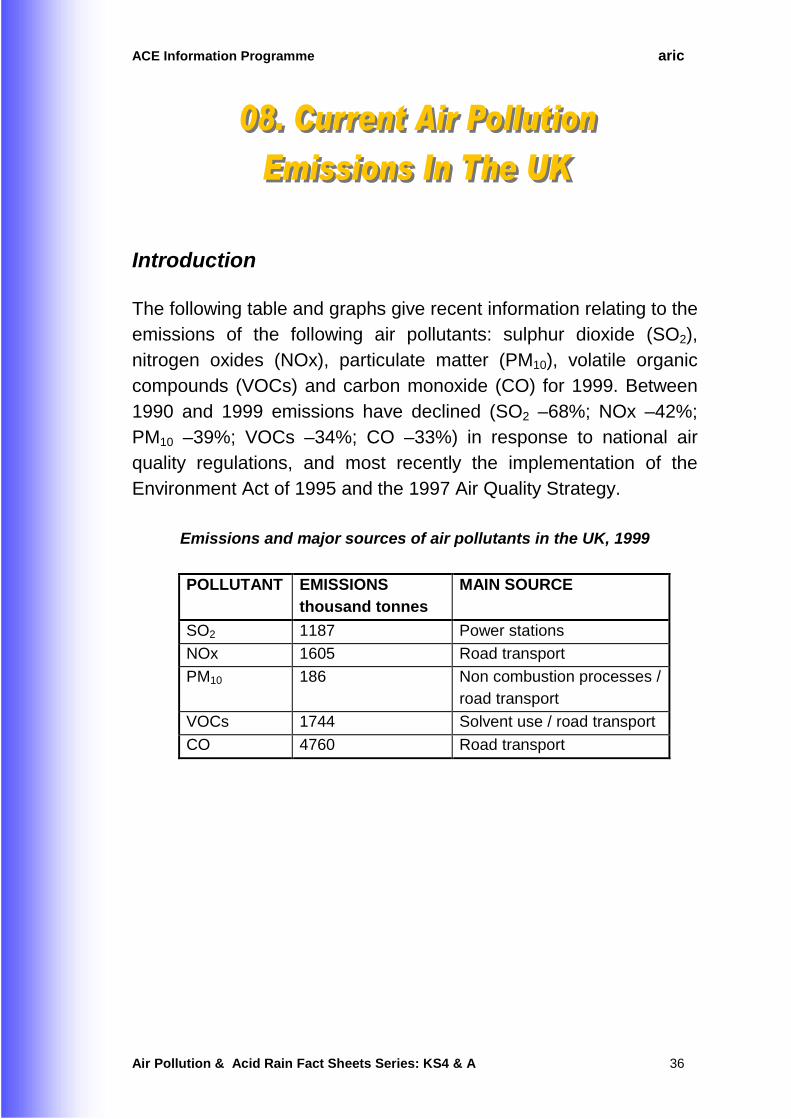
Introduction The following table and graphs give recent information relating to the emissions of the following air pollutants: sulphur dioxide (SO2), nitrogen oxides (NOx), particulate matter (PM10), volatile organic compounds (VOCs) and carbon monoxide (CO) for 1999. Between 1990 and 1999 emissions have declined (SO2 –68%; NOx –42%; PM10 –39%; VOCs –34%; CO –33%) in response to national air quality regulations, and most recently the implementation of the Environment Act of 1995 and the 1997 Air Quality Strategy.
Emissions and major sources of air pollutants in the UK, 1999
POLLUTANT EMISSIONS thousand tonnes
MAIN SOURCE
SO2 1187 Power stations
NOx 1605 Road transport
PM10 186 Non combustion processes / road transport
VOCs 1744 Solvent use / road transport
CO 4760 Road transport
ACE Information Programme aric
Air Pollution & Acid Rain Fact Sheets Series: KS4 & A 37
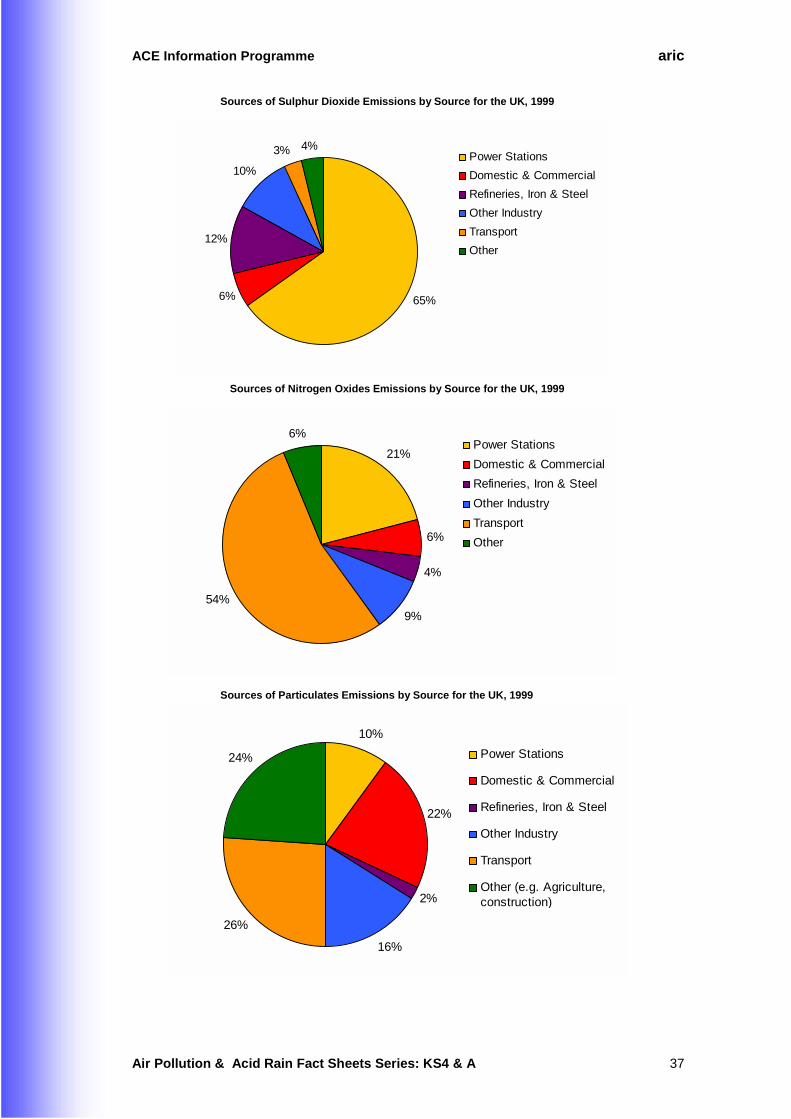
Sources of Sulphur Dioxide Emissions by Source for the UK, 1999
65%6%
12%
10%
3% 4%Power Stations
Domestic & Commercial
Refineries, Iron & Steel
Other Industry
Transport
Other
Sources of Nitrogen Oxides Emissions by Source for the UK, 1999
21%
6%
4%
9%
54%
6%Power Stations
Domestic & Commercial
Refineries, Iron & Steel
Other Industry
Transport
Other
Sources of Particulates Emissions by Source for the UK, 1999
10%
22%
2%
16%
26%
24% Power Stations
Domestic & Commercial
Refineries, Iron & Steel
Other Industry
Transport
Other (e.g. Agriculture,construction)
ACE Information Programme aric
Air Pollution & Acid Rain Fact Sheets Series: KS4 & A 38
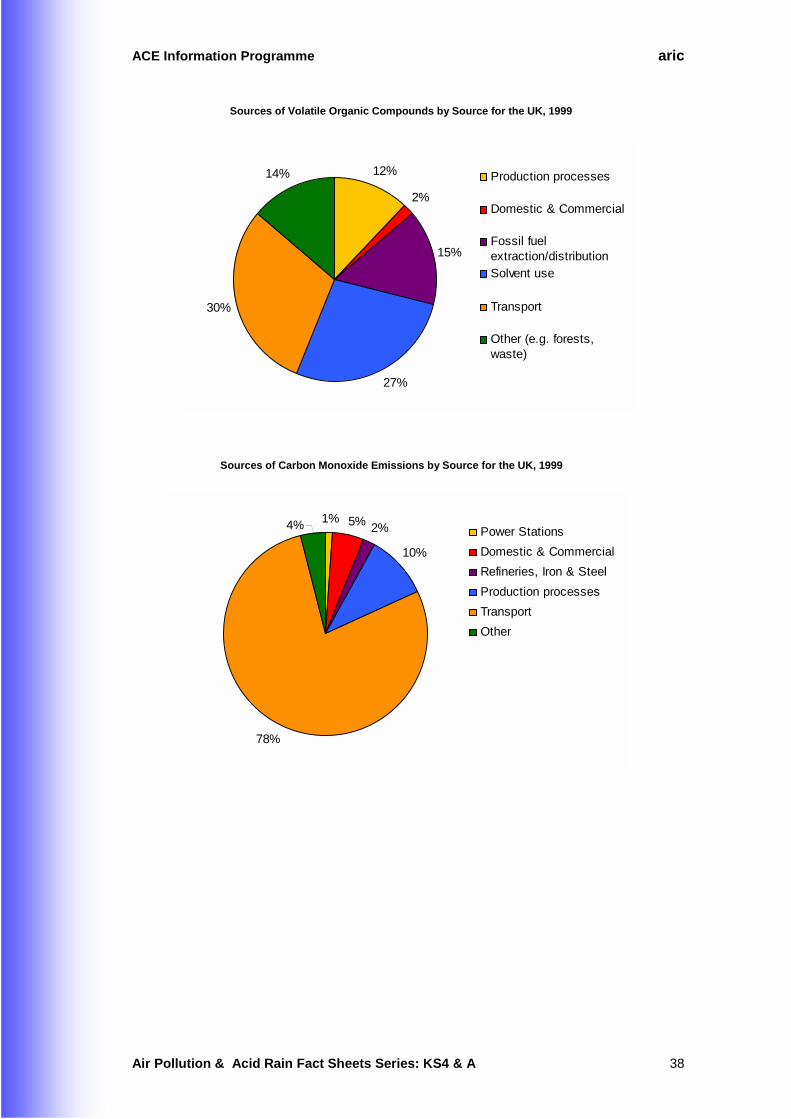
Sources of Volatile Organic Compounds by Source for the UK, 1999
12%
2%
15%
27%
30%
14% Production processes
Domestic & Commercial
Fossil fuelextraction/distribution
Solvent use
Transport
Other (e.g. forests,waste)
Sources of Carbon Monoxide Emissions by Source for the UK, 1999
1% 5% 2%
10%
78%
4% Power Stations
Domestic & Commercial
Refineries, Iron & Steel
Production processes
Transport
Other
ACE Information Programme aric
Air Pollution & Acid Rain Fact Sheets Series: KS4 & A 39
Introduction Air pollutants are deposited on Earth by one of two processes: wet deposition or dry deposition. Wet deposition occurs when pollutants are emitted into the atmosphere and oxidised to form an acid. Sulphur dioxide (SO2), for example, is emitted and oxidised to sulphuric acid (H2SO4). The pollutants then fall to earth as acidic precipitation. Dry deposition occurs when the acids are transformed chemically into gases and salts, and then fall to Earth. SO2, for example, is deposited as a gas and a salt. The gases present in acid deposition are found to occur naturally in the environment. They are given off from a number of sources including volcanic eruptions and the rotting of vegetation. They become a problem when humans produce the gases in large amounts, and at high concentrations by the burning of fossil fuels. In the UK, power stations are the main source of acidic precursor emissions, contributing 65% and 21% of total suphur dioxide and nitrogen oxides emissions respectively (1999).
A Transboundary Problem Once in the air, pollutant gases are carried by the wind, and hence deposition can take place a long distance from the source. If large quantities of acid are deposited in one place then it may have detrimental consequence for:
• = humans;
• = wildlife;
• = vegetation;
• = soils;
ACE Information Programme aric
Air Pollution & Acid Rain Fact Sheets Series: KS4 & A 40
• = crops;
• = freshwater;
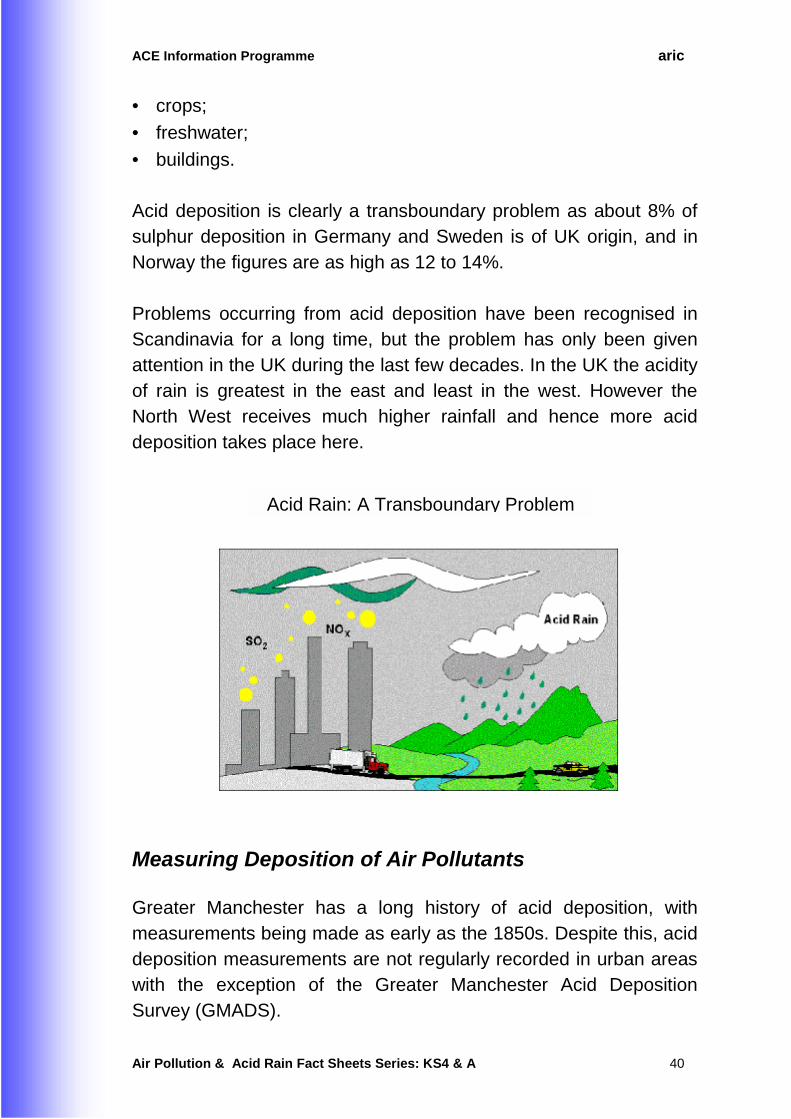
• = buildings. Acid deposition is clearly a transboundary problem as about 8% of sulphur deposition in Germany and Sweden is of UK origin, and in Norway the figures are as high as 12 to 14%. Problems occurring from acid deposition have been recognised in Scandinavia for a long time, but the problem has only been given attention in the UK during the last few decades. In the UK the acidity of rain is greatest in the east and least in the west. However the North West receives much higher rainfall and hence more acid deposition takes place here.
Measuring Deposition of Air Pollutants Greater Manchester has a long history of acid deposition, with measurements being made as early as the 1850s. Despite this, acid deposition measurements are not regularly recorded in urban areas with the exception of the Greater Manchester Acid Deposition Survey (GMADS).
Acid Rain: A Transboundary Problem
ACE Information Programme aric
Air Pollution & Acid Rain Fact Sheets Series: KS4 & A 41
Regular monitoring of acid deposition takes place within the rural environment in the UK on a national basis. This network of sites is known as the secondary acid precipitation network. This monitoring began in 1983 with 59 sites, falling to 32 sites by 1991. Samples are analysed for sulphate, nitrate, ammonium and hydrogen concentrations and deposition rates are presented on an annual basis. The network is managed by the National Environmental Technology Centre (NETCEN) on behalf of the Department forEnvironment, Food & Rural Affairs (DEFRA). In the urban environment of the UK, however, the only long term continuous monitoring of acid deposition that has taken place is for the Greater Manchester Acid Deposition Survey in the northwest of England. This covers an area of some 2000km2 and supports a population in excess of 2.8 million. The area has a diverse industrial base contributing to a wide array of large and small point sources of pollution. In terms of altitude, there is a great variation, ranging from 20m above sea level in the west to over 600m in the High Peak. GMADS began in 1986 and ran until 1997 in collaboration with the Association of Greater Manchester Authorities. The local authorities included within the survery were Bolton, Bury, High Peak, Manchester, Oldham, Rochdale, Rossendale, Salford, Stockport, Tameside, Trafford, Warrington and Wigan. The aim of the survey was to identify the urban influence on acidity, sulphate, nitrate, ammonium and other ions present in precipitation. The Greater Manchester Acid Deposition Survey provided the only long-term continuous survey of acid deposition in the urban environment. The data obtained from this network has been useful in enabling informed decisions to be made on local, regional and national solutions to the problem of acid deposition. A long-term trends network like GMADS is also important in tracking the response of acid deposition to the various control strategies being implemented. Within Europe more studies need to be established in
ACE Information Programme aric
Air Pollution & Acid Rain Fact Sheets Series: KS4 & A 42
order to quantify wet deposition and assess their effects in the urban environment.
Conclusion Acid deposition is clearly an international problem that requires attention from all countries. By working together to keep SO2 and NOx emissions to a minimum the problems of acid rain may reduce. This would be beneficial to all and lead to a reduction in the damage to buildings, freshwater, vegetation, crops, soil, wildlife and human health.
ACE Information Programme aric
Air Pollution & Acid Rain Fact Sheets Series: KS4 & A 43
Introduction Critical loads have been defined as: “the highest load that will not cause chemical changes leading to long-term harmful effects in the most sensitive ecological systems”. Critical loads are the maximum amount of pollutants that ecosystems can tolerate without being damaged. The definition has been redrafted in order to fit specialist areas of interest, most particularly the acidification of freshwater, vegetation and soils.
The Concept Since 1988 the critical loads approach has been given much attention by the United Nations Economic Commission for Europe (UN-ECE), and new strategies in relation to acid rain are being developed along these lines. In 1986 the Nordic countries, at a workshop in Norway, defined the term “critical load”, and values were given for the critical loads of sulphur and nitrogen on different ecosystems. These values are subject to change, and Parties are asked to submit revised maps on a twice-yearly basis. The concept behind critical loads is based upon a dose-response relationship where the threshold of harmful response is triggered by a certain load of pollutant - the critical load. However, it is not always easy to apply without careful consideration of the pollutant receptor and the threshold effects of harmful pollutants. In order for critical loads to be used, target loads need to be set for different areas in order to try and halt the acidification processes. Target loads have been defined as “the permitted pollutant load determined by political agreement”. Therefore, target loads can be either higher or lower than the critical load values. For example, the target load may be lower so as to give a safety margin or the target load may be higher for economic
ACE Information Programme aric
Air Pollution & Acid Rain Fact Sheets Series: KS4 & A 44
reasons. The reasoning behind this is that critical loads only show where there is a problem and to what degree damage is occurring. Target loads are used in order that emissions can be reduced accordingly to meet the targets and limit the amount of damage.
Methods for Calculating Critical Loads The critical loads for total acidity of sulphur and nitrogen need to be determined so that a coherent international agreement can be reached with regard to abatement policies. There are numerous methods that are available for obtaining critical loads. The National Centre for Critical Loads at the Centre for Ecology and Hydrology can supply further information if required. In order to obtain values for the critical loads, an ecosystem has to be chosen and then a suitable indicator species is selected to represent the ecosystem. A chemical limit is subsequently defined as the concentration at which the indicator species will die. In forests the indicators are trees, and in fresh waters they are fish. The UN-ECE Convention on Long-Range Transboundary Air Pollution (LRTAP), signed in 1979, was devised to limit and find solutions to cross border air pollution problems within Europe. It was agreed to promote protocols whereby reductions could be made in the deposition of sulphur and nitrogen. To achieve this it has been agreed by the member countries of the UN-ECE that the critical loads approach provides an effective scientific approach for devising strategies for the abatement of air pollution. The strategy for a Europe-wide reduction in the deposition of sulphur follows a five point basic framework.
• = Each country has to produce maps depicting critical loads for national areas, receptors and pollutants.
• = The resulting data are then assembled to produce Europe-wide maps showing critical loads.
ACE Information Programme aric
Air Pollution & Acid Rain Fact Sheets Series: KS4 & A 45
• = Using this data and data on the deposition of pollutants, maps can be produced showing where critical loads are being exceeded (exceedence maps).
• = Countries then set target loads which can be regarded as intermediate objectives towards bringing down deposition so that critical loads are not exceeded.
• = Finally, there are negotiations to arrive at new agreements on emissions reductions.
This strategy, known as the optimised approach, allows for the reduction in emissions to be applied to the most effective geographical areas at the least overall cost. This strategy was implemented with the signing of the Second Sulphur Protocol in 1994.
The Second Sulphur Protocol The Second Sulphur Protocol of the UN-ECE was signed by the then Secretary of State for the Environment, John Gummer, in June 1994 in Oslo. This followed the original Protocol adopted in 1985 which agreed for the reduction of a minimum of 30% in sulphur dioxide (SO2) emissions by 1993 from a baseline level of 1980 emissions. This was adopted by many countries throughout Europe, but there were some notable exceptions including the UK. However, the UK did begin the introduction of Flue Gas Desulphurisation (FGD) technology into large combustion plants in 1986 and subsequently signed the 1988 EC directive on large combustion plants which committed the UK to reducing SO2 by 60% from these sources by 2003 based on 1980 levels. With the signing of the Second Sulphur Protocol, the UK has agreed to secure a reduction of at least 80% of its national annual emissions of sulphur dioxide by 2010 compared with 1980 levels. This is to be achieved through transitional reductions of at least 50% by 2000 and 70% by 2005.
ACE Information Programme aric
Air Pollution & Acid Rain Fact Sheets Series: KS4 & A 46
UK Critical Load Maps The UK Government accepted that the critical loads approach was the best way to establish abatement strategies in relation to SO2 and NOx emissions. It was recognised that critical loading maps are essential in providing information on the geographical distribution of pollutant sensitive locations and in their ability to allow comparison with pollution distribution maps. This comparison allows identification of areas where the critical load is exceeded. As part of its commitment to the UN-ECE Convention on Long-Range Transboundary Pollution, the Critical Loads Advisory Group (CLAG) was set up by the Department of the Environment to produce critical load maps for the United Kingdom. The National Centre for Critical Loads Mapping was subsequently established at the Institute for Terrestrial Ecology, now the Centre for Ecology and Hydrology. Critical load maps of soil and vegetation acidity have been produced for the UK, including Northern Ireland at a grid resolution of 1 km squares. Maps for the critical acidity of freshwater environments are based on a single water sample from a single site in each of the 10 km squares used, assumed to be the most sensitive surface water within the grid square. The critical loads maps, when combined with deposition values, produce exceedance maps which show where and by how much the critical loads are being exceeded. Maps are available for soils, vegetation and freshwater in the UK relating to acidity and sulphur deposition showing areas that are sensitive to acidification. These correspond to areas where there have been reports of acidification. In the UK a national target load map for the year 2005 has been produced for soils on a 20km by 20km grid system, showing the target loads that need to be met for such areas. These maps have been submitted to the UN-ECE, and with the maps produced for other countries, will provide the basis for discussions on new agreements under the LRTAP.
ACE Information Programme aric
Air Pollution & Acid Rain Fact Sheets Series: KS4 & A 47
In 1997, critical loads for acidification were exceeded in 71% of UK ecosystems. As sulphur deposition continues to fall, this value is expected to fall to below half by 2010, when nitrogen deposition will dominate. Critical loads for eutrophication (nutrient depletion) in 1997 were exceeded in about a quarter of UK 1km by 1km squares with sensitive grasslands and a little over half with heathland. Again, this is expected to decline over the next 10 to 15 years.
Conclusion “Critical loads” provide a useful approach for dealing with the problem of acid rain. However, its use does have limitations. One of the main problems with the approach is the way in which areas are assigned critical load values. In the UK the maps for freshwater ecosystems are calculated on a 10km by 10km grid. This can mean that in some squares the critical load value may be too high to protect some of the ecosystems present. This is also a problem where only the dominant ecosystem is taken into account, resulting in maps which are not representative of the area.
ACE Information Programme aric
Air Pollution & Acid Rain Fact Sheets Series: KS4 & A 48
Introduction
A megacity is defined as a city with an estimated population of morethan 10 million people by year 2000. Megacities are the largest citiesin the world but may not necessarily be the most polluted. Urban airpollution, however, is a particularly serious environmental problem inthe developing countries of the world.
Urban Air Quality Monitoring in Megacities
The World Health Organisation (WHO) and the United NationsEnvironment Programme (UNEP) operate an air pollution monitoringnetwork as part of the Global Environment Monitoring System whichwas set up in 1974. This network has enabled monitoring equipmentto be established in more than 50 cities of the world in 35 countries.Initially sulphur dioxide (SO2), suspended particulate matter (SPM)and lead were monitored, but in 1991 the network was expanded tomeasure SPM less than 10 microns in diameter, carbon monoxide(CO), nitrogen dioxide (NO2) and ozone (O3).
The Quality of Air in World Megacities
Results of the WHO / UNEP study of megacities show that the mostsevere air pollution is monitored in cities in developing countries, butthat air pollution is a widespread problem in megacities with at leastone major air pollutant exceeding health guidelines in all of the 20megacities studied.
ACE Information Programme aric
Air Pollution & Acid Rain Fact Sheets Series: KS4 & A 49
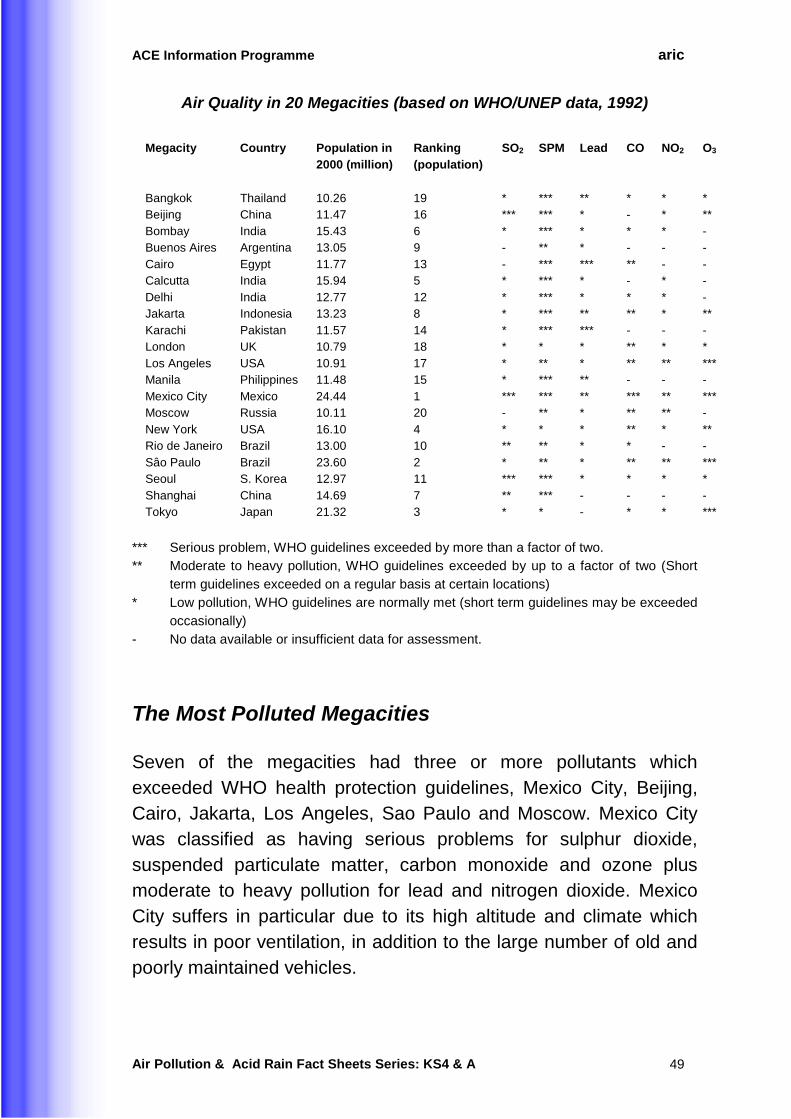
Air Quality in 20 Megacities (based on WHO/UNEP data, 1992)
Megacity Country Population in2000 (million)
Ranking(population)
SO2 SPM Lead CO NO2 O3
Bangkok Thailand 10.26 19 * *** ** * * *Beijing China 11.47 16 *** *** * - * **
Bombay India 15.43 6 * *** * * * -Buenos Aires Argentina 13.05 9 - ** * - - -
Cairo Egypt 11.77 13 - *** *** ** - -Calcutta India 15.94 5 * *** * - * -
Delhi India 12.77 12 * *** * * * -Jakarta Indonesia 13.23 8 * *** ** ** * **
Karachi Pakistan 11.57 14 * *** *** - - -London UK 10.79 18 * * * ** * *
Los Angeles USA 10.91 17 * ** * ** ** ***Manila Philippines 11.48 15 * *** ** - - -
Mexico City Mexico 24.44 1 *** *** ** *** ** ***Moscow Russia 10.11 20 - ** * ** ** -
New York USA 16.10 4 * * * ** * **Rio de Janeiro Brazil 13.00 10 ** ** * * - -
Sâo Paulo Brazil 23.60 2 * ** * ** ** ***Seoul S. Korea 12.97 11 *** *** * * * *
Shanghai China 14.69 7 ** *** - - - -Tokyo Japan 21.32 3 * * - * * ***
*** Serious problem, WHO guidelines exceeded by more than a factor of two.
** Moderate to heavy pollution, WHO guidelines exceeded by up to a factor of two (Short
term guidelines exceeded on a regular basis at certain locations)
* Low pollution, WHO guidelines are normally met (short term guidelines may be exceeded
occasionally)
- No data available or insufficient data for assessment.
The Most Polluted Megacities
Seven of the megacities had three or more pollutants whichexceeded WHO health protection guidelines, Mexico City, Beijing,Cairo, Jakarta, Los Angeles, Sao Paulo and Moscow. Mexico Citywas classified as having serious problems for sulphur dioxide,suspended particulate matter, carbon monoxide and ozone plusmoderate to heavy pollution for lead and nitrogen dioxide. MexicoCity suffers in particular due to its high altitude and climate whichresults in poor ventilation, in addition to the large number of old andpoorly maintained vehicles.
ACE Information Programme aric
Air Pollution & Acid Rain Fact Sheets Series: KS4 & A 50
Suspended Particulate Matter
The worst pollutant affecting the megacities as a whole issuspended particulate matter (SPM), particularly amongstmegacities in the continent of Asia. This is of particular concern ashigh levels of SPM are known to be related to increased mortalityrates, and in many of the megacities in developing countries healthcare for acute cases is less proficient than in developed countries.The sources of SPM are varied and can include natural sourcessuch as wind blown dust from desert areas and the generally moretoxic SPM from man-made sources such as power generation,motor vehicles (particularly diesel) and industrial processes. Thethree megacities which meet WHO guidelines are those which haveundergone large scale control measures to reduce man-made SPM.
Sulphur Dioxide
Many of the megacities have reduced emissions of SO2 throughchanges in fuel use from high sulphur coal and oil to cleaner fuelssuch as natural gas. Three megacities, Beijing, Mexico City andSeoul continue to have serious SO2 problems, although the closureof a major refinery in Mexico City is expected to lead to a reductionin levels there. In Shanghai, SO2 is a problem due to its heavydependence on coal.
Carbon Monoxide, Nitrogen Dioxide and Lead
The main source of these pollutants, and hydrocarbons which arenot monitored in all the megacities, is road vehicles. The number ofcars across the world has grown tenfold since 1950 to around 630million vehicles, and is expected to double within the next 20 - 30years. Although leaded petrol has been phased out or greatlyreduced in many countries, serious lead problems are stillexperienced in Cairo and Karachi. Lead has serious healthimplications particularly for infants and young children.
ACE Information Programme aric
Air Pollution & Acid Rain Fact Sheets Series: KS4 & A 51
Ozone
Data on ozone, available for only 10 of the megacities, show that themost serious ozone problems are recorded in the three largestmegacities, Mexico City, Sao Paulo and Tokyo, and also in LosAngeles. Ozone is a secondary pollutant and requires a high degreeof sunshine and vehicle pollution for its formation. These conditionsare experienced in many of the ten megacities that do not recordozone levels, and hence high levels would be expected in Bombay,Cairo, Calcutta, Delhi and Manila.
Conclusion
Air pollution is a widespread problem in megacities. The mainpollutant of concern is suspended particulate matter. In addition, themegacities experiencing high SPM levels usually also experiencehigh sulphur dioxide levels. These pollutants can act synergistically,exacerbating health problems. Pollutants arising from vehicleemissions are also a major cause of poor air quality in megacities.
There is a great need to implement control measures in most of themegacities of the world to improve air quality and hence protectpublic health. As many of the developing countries are becomingmore industrialised, emissions of air pollutants are likely to increasedramatically as exemplified in the past by megacities in developedcountries. There is also a great need to improve the air pollutionmonitoring capabilities in many of the megacities; at present dataavailability is hardly comparable between the megacities.
ACE Information Programme aric
Air Pollution & Acid Rain Fact Sheets Series: KS4 & A 52
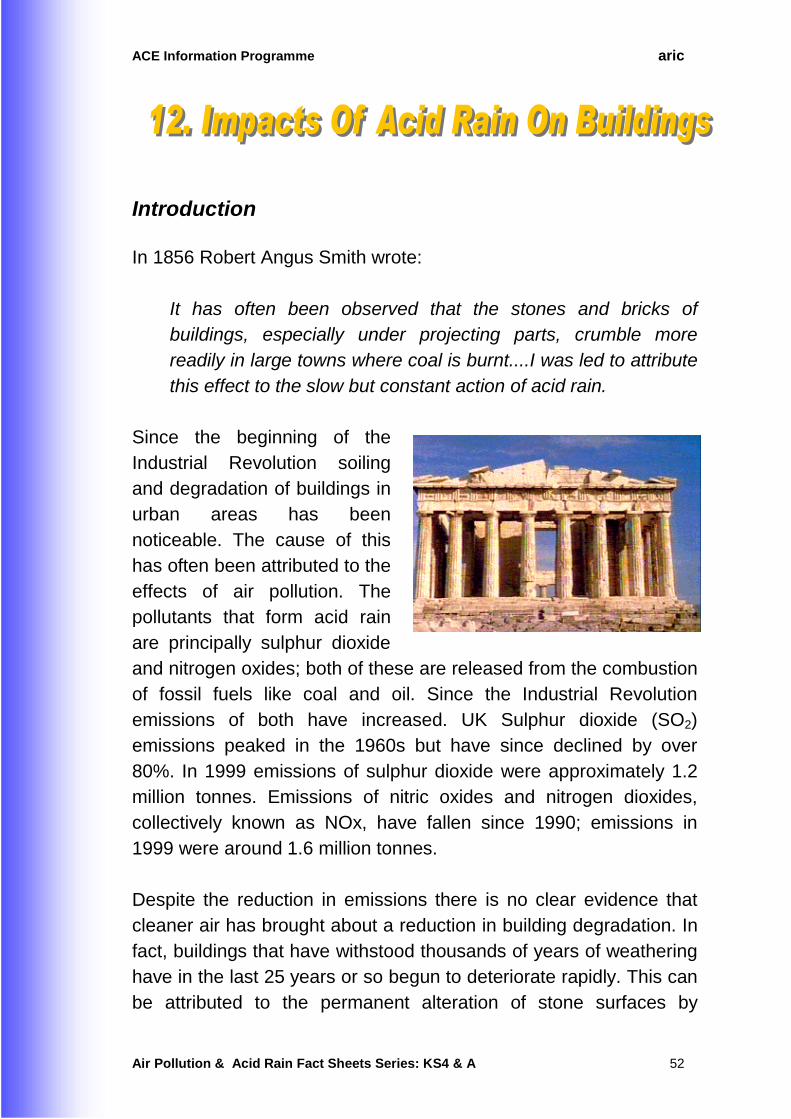
Introduction In 1856 Robert Angus Smith wrote:
It has often been observed that the stones and bricks of buildings, especially under projecting parts, crumble more readily in large towns where coal is burnt....I was led to attribute this effect to the slow but constant action of acid rain.
Since the beginning of the Industrial Revolution soiling and degradation of buildings in urban areas has been noticeable. The cause of this has often been attributed to the effects of air pollution. The pollutants that form acid rain are principally sulphur dioxide and nitrogen oxides; both of these are released from the combustion of fossil fuels like coal and oil. Since the Industrial Revolution emissions of both have increased. UK Sulphur dioxide (SO2) emissions peaked in the 1960s but have since declined by over 80%. In 1999 emissions of sulphur dioxide were approximately 1.2 million tonnes. Emissions of nitric oxides and nitrogen dioxides, collectively known as NOx, have fallen since 1990; emissions in 1999 were around 1.6 million tonnes. Despite the reduction in emissions there is no clear evidence that cleaner air has brought about a reduction in building degradation. In fact, buildings that have withstood thousands of years of weathering have in the last 25 years or so begun to deteriorate rapidly. This can be attributed to the permanent alteration of stone surfaces by
ACE Information Programme aric
Air Pollution & Acid Rain Fact Sheets Series: KS4 & A 53
sulphation, a process whereby the exposed surface of limestone dissolves away as rainfall washes away the sulphated layers. It is only in the last couple of decades that attempts have been made to quantify the amount of damage that has been caused to materials as a result of acid deposition. Concern about the effects of acid rain on building materials was raised in a House of Commons Select Committee report in September 1984. As part of the Government's response, the Buildings Effect Review Group (BERG) was established to give considered advice on the effects of acid deposition on buildings. It is only relatively recently that the spatial concentrations of acid rain pollutants and their transport mechanisms have become fully understood so more accurate estimates of the damage that may occur to buildings can be made.
Materials Affected The list of materials affected by acid deposition is very long as most materials are liable to some degree of damage. Those most vulnerable are: limestone; marble; carbon-steel; zinc; nickel; paint and some plastics. Stone decay can take several forms, including the removal of detail from carved stone, and the build-up of black gypsum crusts in sheltered areas. Metal corrosion is caused primarily by oxygen and moisture, although SO2 does accelerate the process. Most structures and buildings are affected by acid deposition to some degree because few materials are safe from these effects. In addition to atmospheric attack structures that are submerged in acidified waters such as foundations and pipes can also be corroded.
The Chemistry of Corrosion Wet and dry deposition both contribute to the corrosion of materials. Dry deposition consists of gaseous and particulate matter that falls
ACE Information Programme aric
Air Pollution & Acid Rain Fact Sheets Series: KS4 & A 54
to Earth close to the source of emissions causing direct damage. Sulphur dioxide often falls as dry deposition within 30km of its source. Wet deposition occurs when the pollutants are spread high into the atmosphere, where they react with water vapour in clouds to form dilute acids. The effects are felt much further afield and therefore wet deposition can affect areas that are many tens of kilometres away from any sources of pollution. Calcium carbonate in certain stones dissolves in dilute sulphuric acid to form calcium sulphate:
CaCO3 + H2SO4 + H2O → CaSO4.2H2O + CO2
This has two effects. Firstly it causes the surface of the stone to break up; secondly, a black skin of gypsum (calcium sulphate) forms which blisters off exposing more stone. When the gypsum crystals form they can grow into the stone, and the process may continue for up to 50 years. This is known as the Memory Effect. Sulphur dioxide is the main pollutant in respect to corrosion but others also take their toll including NOx, carbon dioxide (CO2), ozone (on organic materials) and sea salt from sea spray. Research has revealed that when nitrogen dioxide (NO2) is present with SO2, increased corrosion rates occur. This is because the NO2 oxidises the SO2 to sulphite (SO3) thereby promoting further SO2 absorption. The Review Group on Acid Rain report in 1990 indicated that in remote areas wet deposition will predominate, whereas in Eastern England dry deposition will predominate. This finding is supported by a study of south-east England, which suggests that up to 40% of total damage is due to dry deposition. The interactions between materials and pollutants are very complex and many variables are involved. Deposition of pollutants onto surfaces depends on atmospheric concentrations of the pollutants and the climate and micro-climate around the surface. Once the pollutants are on the surface, interactions will vary depending on the
ACE Information Programme aric
Air Pollution & Acid Rain Fact Sheets Series: KS4 & A 55
amount of exposure, the reactivity of different materials and the amount of moisture present. The last factor is particularly important because the SO2 that falls as dry deposition is oxidised to sulphuric acid in the presence of moisture on the surface.
Studies Undertaken There are a number of studies that have been initiated looking at the effects of acid deposition on different materials. The National Materials Exposure Programme (NMEP) was initiated by BERG in 1987 and consists of 29 sites throughout the country. Samples of different materials are exposed at the sites for a period of not less than four years, during which time data on meteorological conditions and atmospheric conditions will be collected and corrosion rates monitored. The UK NMEP is also part of the International Materials Exposure Programme set up under the United Nations Economic Commission for Europe framework, in which materials are exposed to polluted environments in Europe and North America.
Examples of Damage The effects of acid deposition on modern buildings are considerably less damaging than the effects on ancient monuments. Limestone and calcareous stones which are used in most heritage buildings are the most vulnerable to corrosion and need continued renovation. Evidence of the damaging effect of acid deposition can be seen throughout the world. For example, world famous structures as the Taj Mahal, Cologne Cathedral, Notre Dame, the Colosseum and Westminster Abbey have all been affected.
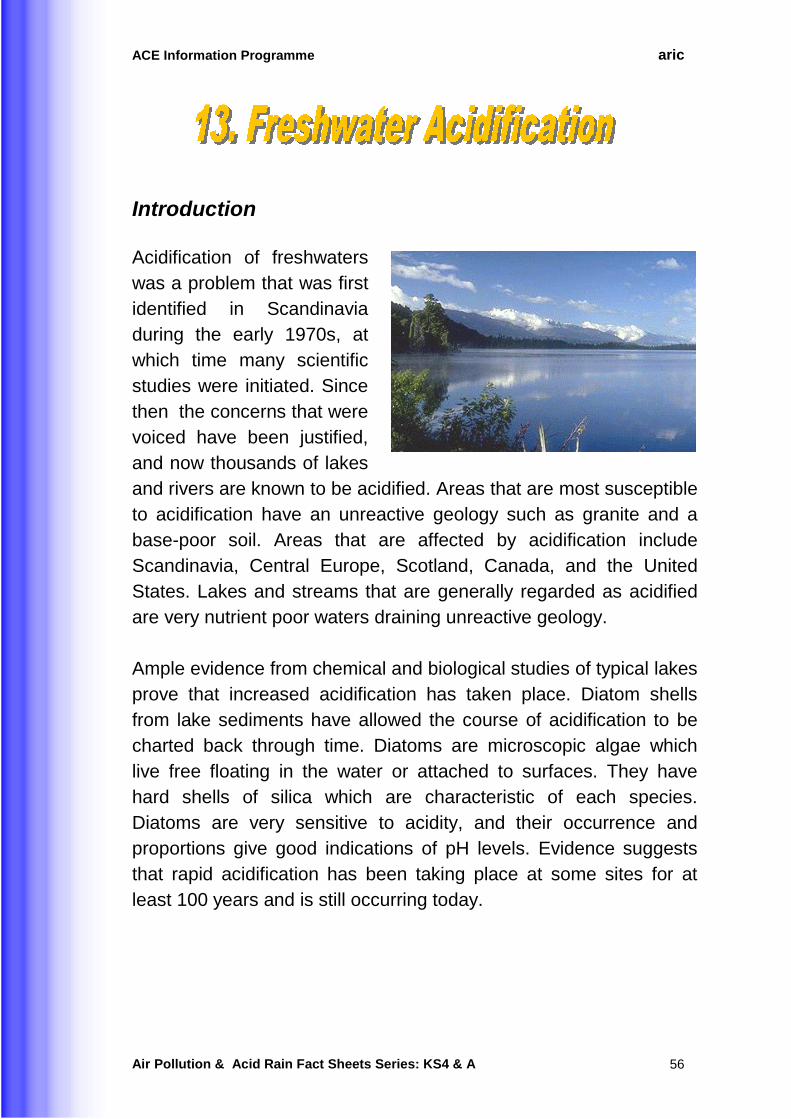
ACE Information Programme aric
Air Pollution & Acid Rain Fact Sheets Series: KS4 & A 56
Introduction
Acidification of freshwaterswas a problem that was firstidentified in Scandinaviaduring the early 1970s, atwhich time many scientificstudies were initiated. Sincethen the concerns that werevoiced have been justified,and now thousands of lakesand rivers are known to be acidified. Areas that are most susceptibleto acidification have an unreactive geology such as granite and abase-poor soil. Areas that are affected by acidification includeScandinavia, Central Europe, Scotland, Canada, and the UnitedStates. Lakes and streams that are generally regarded as acidifiedare very nutrient poor waters draining unreactive geology.
Ample evidence from chemical and biological studies of typical lakesprove that increased acidification has taken place. Diatom shellsfrom lake sediments have allowed the course of acidification to becharted back through time. Diatoms are microscopic algae whichlive free floating in the water or attached to surfaces. They havehard shells of silica which are characteristic of each species.Diatoms are very sensitive to acidity, and their occurrence andproportions give good indications of pH levels. Evidence suggeststhat rapid acidification has been taking place at some sites for atleast 100 years and is still occurring today.
ACE Information Programme aric
Air Pollution & Acid Rain Fact Sheets Series: KS4 & A 57
Process
Acid rain can enter the water course either directly or more usuallythrough the catchment. If the catchment has a thin, base-poor soilthen acid water is passed to the lake. If the catchment has alkaline-rich soil then the acid rain is neutralised and so water entering thelake is of low acidity. In areas where a continual supply of base(alkali) cations is not assured then the gradual depletion of thebicarbonate in the lake means that the once stable pH will droprapidly resulting in an acidified lake. Acidification can also occur insurges after snowmelt or drought; the first 30% of snow melt cancontain 50 - 80% of the total acids in the snow. During droughtconditions sulphur dioxide (SO2) deposition onto the soil is reducedto sulphur and hydrogen; this is then re-oxidised in combination withrainwater to form acids. This is termed an acid pulse.
Effects
The effects of freshwater acidification are as follows.
• Carbon source changes from carbonate (HCO3) to carbon dioxide(CO2).
• Release of toxic metals.
• Phosphorous is retained.
• Freshwater fauna and flora gradually changes.
• Short-term pH depressions have direct toxic effects onsusceptible organisms.
The onset of acidification brings about a clearer bluer water bodydue to the precipitation of humic substances. Whilst total biomassremains largely unchanged, the diversity drops considerably. Manyalgal species disappear, but some green filamentous algae arecapable of mass proliferation in the extreme environment. Thenumber of macrophytes in and around the water decreases, withRush becoming the dominant species. White Sphagnum moss may
ACE Information Programme aric
Air Pollution & Acid Rain Fact Sheets Series: KS4 & A 58
invade lakes and form a thick green carpet over the bottom of thelake on account of the clearer waters allowing more light to reachthe moss.
Soft bodied animals such as leeches, snails and crayfish are earlyvictims, often being one of the first signs of the commencement ofacidification. Few insect species are very resistant to acidificationand species such as mayfly disappear even under moderateacidification. However, species such as dragonfly larvae, waterbeetle and bloodworms can grow abnormally large in theirpopulation size when competition is removed. Salmon, trout androach are particularly at risk from freshwater acidification, pike andeel being relatively resistant. All life stages of fish are affected; thereproductive ability of adults, the survival of eggs and young fry. Thedeath of adults at a low pH is caused primarily by the release oftoxic metals such as aluminium. At pH 5 aluminium is at its mostpoisonous, being precipitated onto the gills of the fish in the form ofaluminium hydroxide.
Causes
Acidification takes place most readily in areas where the naturalgeology is slightly acidic. Upland regions that have been subject toland-use changes over the last few decades are showing the signsof acidification.
Several factors affect acidity:
Natural:1. Action of atmospheric carbonic acids.2. Formation of organic acids by humus podzolisation.3. Podzolisation.
Land-use changes:4. Livestock introduction into the catchment.
ACE Information Programme aric
Air Pollution & Acid Rain Fact Sheets Series: KS4 & A 59
5. Use of nitrogen fertiliser.6. Increased efficiency of drainage7. Dry deposition of air pollutants.8. Wet deposition of sulphuric and nitric acids.
It will be a combination of the above factors that will lead tofreshwater acidification. Natural acidification has been taking placesince the last ice age, although the recent rapid acidification of manyof the lakes can not be attributed to natural causes.
Restoration of Acid Waters
The only sure way to prevent further acidification of othersusceptible water bodies is to reduce the emissions of acidpollutants. There is a relationship between sulphur emissions,deposition, sulphur in run-off and loss of alkalinity. If acidification ofsoils and freshwaters is to be prevented then sulphur depositionrates need to be reduced further. The technical means are availableto reduce emissions, such as flue gas desulphurisation, low NOxburners, use of low sulphur coal and oil and increasing energyefficiency. At present the main way of reversing acidification infreshwaters is liming the water body or its surrounding catchment.The main liming method is to add the lime directly to the water body.However in the cases of certain lakes where the turnaround is veryquick, the lime is added to the catchment. This has disadvantagesthough, the main one being that the lime can have an adverse effecton wetland species of plants. The advantages, however, are that theeffects are longer lasting and metals are prevented from leachinginto the lake water from the soil. The effects of liming are almostentirely favourable within the lake. The alkalinity of the limed lake isincreased, the pH increased and heavy metal concentrationsdecrease back to within safe limits for fish life. The number ofspecies of fish, benthic animals and plankton increases as doesbiomass production.
ACE Information Programme aric
Air Pollution & Acid Rain Fact Sheets Series: KS4 & A 60
Summary
Freshwater acidification occurs in areas of high sulphur depositionand where soils are derived from granite or other rocks resistant toweathering. The magnitude of acidification in the last 150 years is alot greater that in the last 100,000 years. It seems that atmosphericpollution is the major cause of acidification. There is evidence that inthe past decade there has been a significant decrease in the acidityof rain and this is reflected by a small decline in acidity of somelakes.
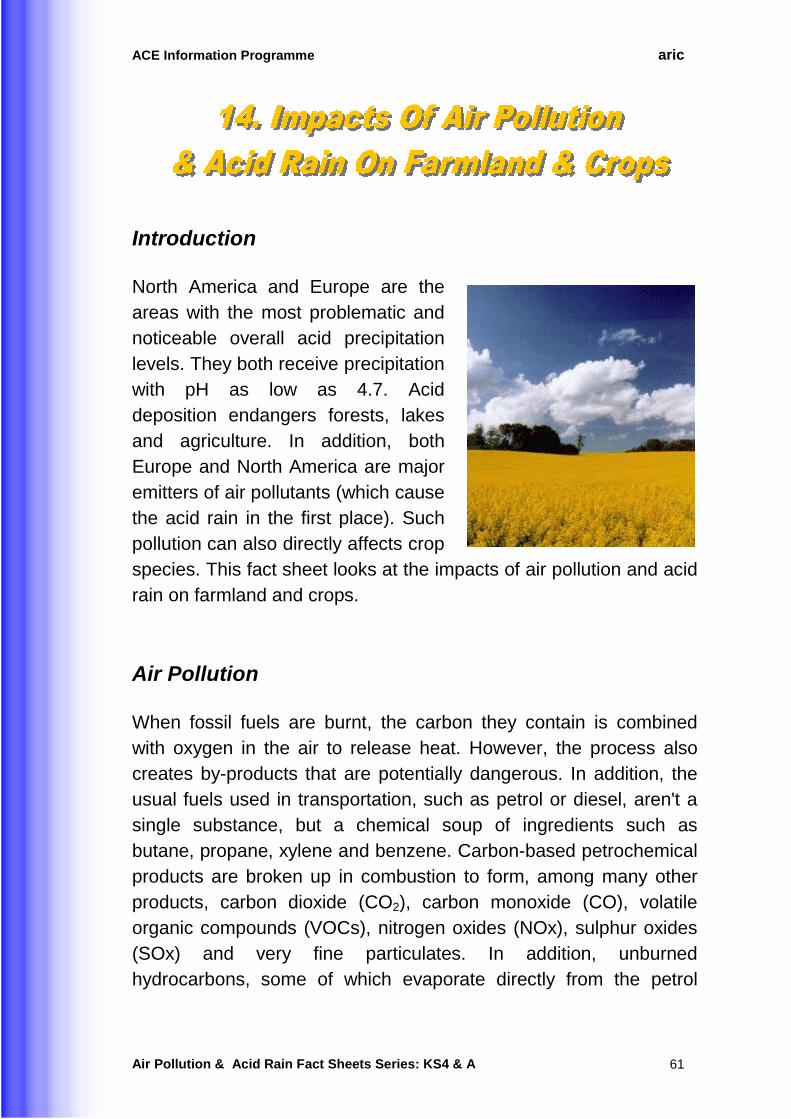
ACE Information Programme aric
Air Pollution & Acid Rain Fact Sheets Series: KS4 & A 61
Introduction
North America and Europe are theareas with the most problematic andnoticeable overall acid precipitationlevels. They both receive precipitationwith pH as low as 4.7. Aciddeposition endangers forests, lakesand agriculture. In addition, bothEurope and North America are majoremitters of air pollutants (which causethe acid rain in the first place). Suchpollution can also directly affects cropspecies. This fact sheet looks at the impacts of air pollution and acidrain on farmland and crops.
Air Pollution
When fossil fuels are burnt, the carbon they contain is combinedwith oxygen in the air to release heat. However, the process alsocreates by-products that are potentially dangerous. In addition, theusual fuels used in transportation, such as petrol or diesel, aren't asingle substance, but a chemical soup of ingredients such asbutane, propane, xylene and benzene. Carbon-based petrochemicalproducts are broken up in combustion to form, among many otherproducts, carbon dioxide (CO2), carbon monoxide (CO), volatileorganic compounds (VOCs), nitrogen oxides (NOx), sulphur oxides(SOx) and very fine particulates. In addition, unburnedhydrocarbons, some of which evaporate directly from the petrol
ACE Information Programme aric
Air Pollution & Acid Rain Fact Sheets Series: KS4 & A 62
tanks of cars and trucks, escape before and after combustion andjoin other VOCs in the air.
Nitrogen dioxide is a poisonous brown gas used as a catalyst andoxidising agent. Nitric acid is a transparent, fuming corrosive liquidthat is a highly reactive oxidising agent used in the production offertilisers, explosives and rocket fuels. Ozone is an unstableoxidising agent, poisonous in high concentrations, with a pungent,irritating odour. In weak concentrations, ozone is used as a bleachand to sterilise water.
When a sufficient concentration of sulphur and nitrogen oxides andhydrocarbons builds up in the atmosphere and is bombarded bysunlight, a complex series of chemical reactions takes place thatcreates more chemicals, including nitrogen dioxide (NO2) and ozone(O3). Also, very fine acidic particles are formed, such as sulphatesand nitrates. When nitrogen oxides and reactive organic gasescombine, especially on sunny, still days, a photochemical (ozone)smog is formed and this can also cause crop damage.
Sulphur dioxide
One of the main components of acid rain is sulphur dioxide (SO2),another by-product of fossil fuel combustion. The effects of SO2 oncrops are influenced by other biological and environmental factorssuch as plant type, age, sunlight levels, temperature, humidity andthe presence of other pollutants (ozone and nitrogen oxides). Thus,even though sulphur dioxide levels may be extremely high, thelevels may not affect vegetation because of the surroundingenvironmental conditions. It is also possible that the plants and soilsmay temporarily store pollutants. By storing the pollutants they arepreventing the pollutants from reacting with other substances in theplants or soil.
ACE Information Programme aric
Air Pollution & Acid Rain Fact Sheets Series: KS4 & A 63
Experiments have shown that SO2 is capable of interacting withother factors which influence crop yields, in some cases increasingthem. Also, some reports state that airborne concentrations of SO2
and NOx in rural areas are generally below the levels at which yieldlosses of crops have been shown to occur.
Any effects of acid deposition on agricultural soils may be dwarfedby the action of fertilisers and other soil treatments. Food crops arenot usually seriously affected because the fertilisers replace anynutrients washed away. Farmers may also add crushed limestone tothe soil. Limestone is a basic material and increases the ability ofthe soil to act as a buffer against acidity.
Impacts on Crop Species
Acid deposition directly reduces the yield of radishes, beets, carrotsand broccoli. Scientists believe that acid rain damages the protectivewaxy coating of leaves and allows acids to diffuse into them, whichinterrupts the evaporation of water and gas exchange so that theplant can no longer breathe. This stops the plant's conversion ofnutrients and water into a form useful for plant growth and affectscrop yields. In addition, crops such as corn, potatoes, soy beans andlettuce are damaged by ozone that is created when nitrogenemissions combine with hydrocarbons in the air.
Nutrient deficiency
The problems caused by acid rain across Europe and North Americaover the last 100 years became so serious that, in 1985, mostEuropean countries agreed to reduce their sulphur emissions by atleast 30% by 1993. The reduction in acid rain would seem to havebeen a good thing but, strangely, trees and crop plants in northernEurope are still dying, crop yields have not increased and outbreaksof several new plant diseases have occurred.
ACE Information Programme aric
Air Pollution & Acid Rain Fact Sheets Series: KS4 & A 64
There is evidence that crops of several plants, especially one called'oilseed rape' have produced lower yields, despite decreasedsulphur fallout from the atmosphere. In some regions the crop yieldsare slightly better. In those regions there seems to be a higher levelof soil sulphur.
The conclusion is that, in many regions, crops are suffering from toolittle sulphur. Before the Second World War farmers mainly usedfertilisers based on nitrogen and phosphate which are the majornutrients required by plants. These also contained small amounts ofsulphur.
Since the 1950s farmers switched to sulphur-free fertilisers, usingammonium nitrate instead of ammonium sulphate. This reduction insulphur supplied by fertilisers was counterbalanced by the increasedsulphur in the atmosphere, caused by the increased burning of fossilfuels.
Today, with the combination of lower levels of sulphur in theatmosphere and little or no sulphur in the fertilisers, the crops areshowing signs of stress. It seems that these crop plants actuallyrequire small amounts of sulphur to remain healthy.
Agriculture - a Source of Pollution
In industrialised countries 80% to 90% of ammonia emissions arefrom livestock and artificial fertilisers. World-wide, animal wastesremain the largest single source of ammonium. Ammonium isproduced when nitrogen in animal excreta is volatilised. Ammoniadirectly damages plants by disturbing the uptake of minerals. It canalso be a component of acid rain, increasing the conversion rate ofsulphur dioxide to sulphate ion. This reaction produces ammoniumsulphate, which increases the acidity in the soil.
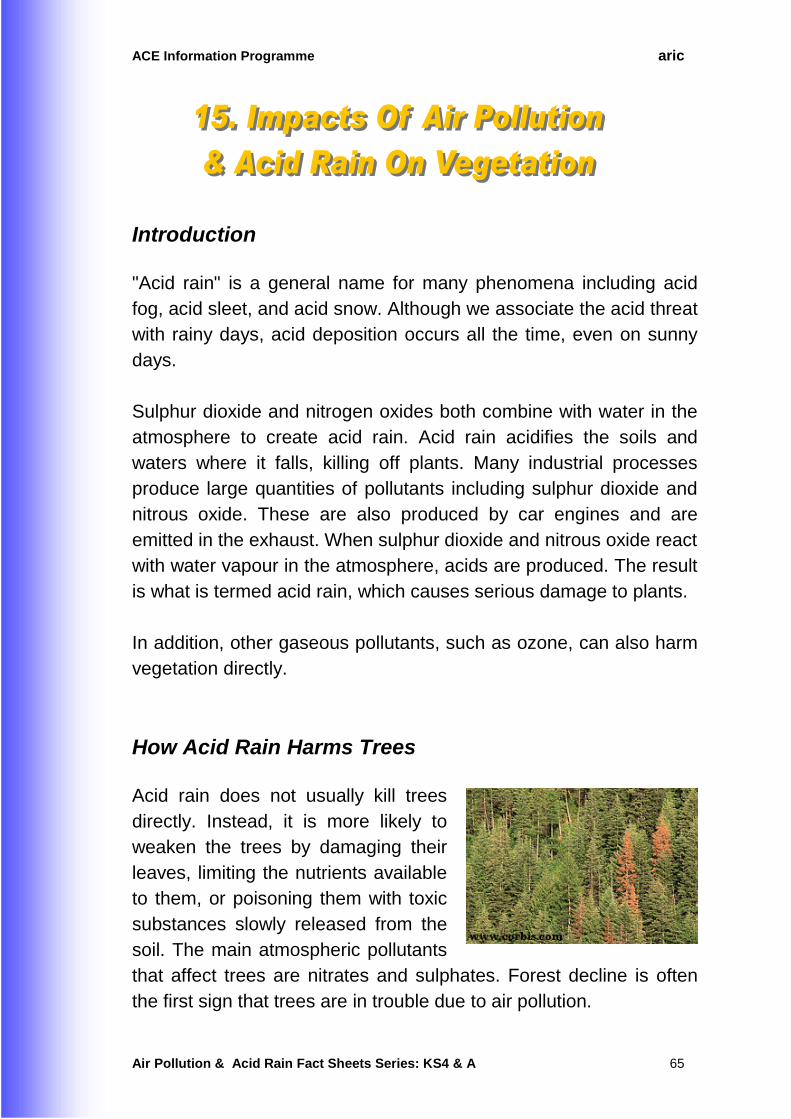
ACE Information Programme aric
Air Pollution & Acid Rain Fact Sheets Series: KS4 & A 65
Introduction "Acid rain" is a general name for many phenomena including acid fog, acid sleet, and acid snow. Although we associate the acid threat with rainy days, acid deposition occurs all the time, even on sunny days. Sulphur dioxide and nitrogen oxides both combine with water in the atmosphere to create acid rain. Acid rain acidifies the soils and waters where it falls, killing off plants. Many industrial processes produce large quantities of pollutants including sulphur dioxide and nitrous oxide. These are also produced by car engines and are emitted in the exhaust. When sulphur dioxide and nitrous oxide react with water vapour in the atmosphere, acids are produced. The result is what is termed acid rain, which causes serious damage to plants. In addition, other gaseous pollutants, such as ozone, can also harm vegetation directly.
How Acid Rain Harms Trees Acid rain does not usually kill trees directly. Instead, it is more likely to weaken the trees by damaging their leaves, limiting the nutrients available to them, or poisoning them with toxic substances slowly released from the soil. The main atmospheric pollutants that affect trees are nitrates and sulphates. Forest decline is often the first sign that trees are in trouble due to air pollution.
ACE Information Programme aric
Air Pollution & Acid Rain Fact Sheets Series: KS4 & A 66
Scientists believe that acidic water dissolves the nutrients and helpful minerals in the soil and then washes them away before the trees and other plants can use them to grow. At the same time, the acid rain causes the release of toxic substances such as aluminium into the soil. These are very harmful to trees and plants, even if contact is limited. Toxic substances also wash away in the runoff that carries the substances into streams, rivers, and lakes. Fewer of these toxic substances are released when the rainfall is cleaner. Even if the soil is well buffered, there can be damage from acid rain. Forests in high mountain regions receive additional acid from the acidic clouds and fog that often surround them. These clouds and fog are often more acidic than rainfall. When leaves are frequently bathed in this acid fog, their protective waxy coating can wear away. The loss of the coating damages the leaves and creates brown spots. Leaves turn the energy in sunlight into food for growth. This process is called photosynthesis. When leaves are damaged, they cannot produce enough food energy for the tree to remain healthy. Once trees are weak, diseases or insects that ultimately kill them can more easily attack them. Weakened trees may also become injured more easily by cold weather.
How Air Pollution Harms Trees Whilst acid rain is a major cause of damage to vegetation, air pollutants which can also be harmful directly. These include sulphur dioxide and ozone.
Sulphur Dioxide Sulphur dioxide, one of the main components of acid rain, has direct effects on vegetation. Changes in the physical appearance of vegetation are an indication that the plants' metabolism is impaired by the concentration of sulphur dioxide. Harm caused by sulphur
ACE Information Programme aric
Air Pollution & Acid Rain Fact Sheets Series: KS4 & A 67
dioxide is first noticeable on the leaves of the plants. For some plants injury can occur within hours or days of being exposed to high levels of sulphur dioxide. It is the leaves in mid-growth that are the most vulnerable, while the older and younger leaves are more resistant. You can see the damage to coniferous needles by observing the extreme colour difference between the green base and the bright orange-red tips. The effects of sulphur dioxide are influenced by other biological and environmental factors such as plant type, age, sunlight levels, temperature, humidity and the presence of other pollutants (ozone and nitrogen oxides). Thus, even though sulphur dioxide levels may be extremely high, the levels may not affect vegetation because of the surrounding environmental conditions. It is also possible that the plants and soils may temporarily store pollutants. By storing the pollutants they are preventing the pollutants from reacting with other substances in the plants or soil.
Ozone The effects of ozone on plants have been investigated intensively for almost two decades. Studies made in controlled environment (CE) chambers, glasshouses and in the field, using open-topped chambers, have all contributed to the understanding of the mechanisms underlying ozone effects and their ultimate impact on vegetation. The biochemical mechanisms by which ozone interacts with plants have been intensively studied and, although the relative significance of different initial reactions remains unclear, there is a consensus that the key event in plant responses is oxidative damage to cell membranes. This primary oxidative damage results in the loss of membrane integrity and function, and in turn to inhibition of essential biochemical and physiological processes. A key target is photosynthesis, although ozone may also affect stomatal function and so modify plant responses to other factors, such as drought and elevated carbon dioxide. These changes result in reduced growth and yield in many plants. However, it is clear that
ACE Information Programme aric
Air Pollution & Acid Rain Fact Sheets Series: KS4 & A 68
such responses vary in magnitude between species and also between different cultivars within species. The mechanisms by which some species and genotypes are protected from ozone injury are not clear, but may include differences in uptake into the leaf or in the various components of antioxidant metabolism. Ozone may also increase the severity of many fungal diseases, while virus infections reduce the effects of ozone in some plants.
Past and Present Pollution Acid deposition and ozone exposure have increased considerably in the past 50 years in Asia, Europe and the US, with many reports of tree/forest decline and increased mortality. In general, the more highly polluted forests have the higher rate of decline and mortality. However, there has been no recent chronic deterioration in the UK of tree condition. Since the early 1990s, peak concentrations of ozone have been falling, whilst the large reduction in sulphur dioxide emissions since the 1970s has provided an opportunity for recovery of many plant species. By 2010, atmospheric sulphur dioxide concentrations in the UK should pose little or no threat to vegetation.
Acidification by Forestry While forestry has long been considered to be adversely affected by air pollution and acid rain, recent studies show it to be part of the acidifying process. The rough canopies of mature evergreen forests are efficient scavengers of particulate and gaseous contaminants in polluted air. This results in a more acidic deposition under the forest canopies than in open land. Chemical processes at the roots of trees, evergreens in particular, further acidify the soil and soil water in forest catchments. When the forests are located on poorly buffered soils, these processes can lead to a significant acidification of the run-off water and consequent damage to associated streams and lakes.
ACE Information Programme aric
Air Pollution & Acid Rain Fact Sheets Series: KS4 & A 69
Introduction Soil is the basis of wealth upon which all land-based life depends. The damage that occurs to ecosystems from acidic deposition is dependent on the buffering ability of that ecosystem. This buffering ability is dependent on a number of factors, the two major ones being soil chemistry and the inherent ecosystem sensitivity to acidification. Indirect damage to ecosystems is largely caused by changes in the soil chemistry. Increasing soil acidity can affect micro-organisms which break down organic matter into nutrient form for plants to take up. Increasing soil acidity also allows aluminium (a common constituent of soil minerals) to come into solution. In its free organic form, aluminium is toxic to plant roots and can lock up phosphate, thereby reducing the concentrations of this important plant nutrient.
What Effect Does the Soil and Underlying Bedrock Have on Acid Rain? Soils containing calcium and limestone are more able to neutralise sulphuric and nitric acid depositions than a thin layer of sand or gravel with a granite base. If the soil is rich in limestone or if the underlying bedrock is either composed of limestone or marble, then the acid rain may be neutralised. This is because limestone and marble are more alkaline (basic) and produce a higher pH when dissolved in water. The higher pH of these materials dissolved in water offsets or buffers the acidity of the rainwater producing a more neutral pH.
ACE Information Programme aric
Air Pollution & Acid Rain Fact Sheets Series: KS4 & A 70
Acid Sensitive Areas In regions where the soil is not rich in limestone or if the bedrock is not composed of limestone or marble, then no neutralising effect takes place, and the acid rainwater accumulates in the bodies of water in the area. This applies to much of the north-eastern United States where the bedrock is typically composed of granite. Granite has no neutralising effect on acid rainwater. Therefore over time more and more acid precipitation accumulates in lakes and ponds. The water bodies most susceptible to change due to acid precipitation are those whose catchments have shallow soil cover and poorly weathering bedrock, for example granite and quartzite. These soil types are characterised by the absence of carbonates that could neutralise acidity. The run-off water from such areas is less buffered than from areas such as limestone catchments, with an adequate level of carbonate. Such catchments and waters are termed acid-sensitive (poorly buffered), and can suffer serious ecological damage due to artificially acidified precipitation from air masses downwind of major emissions. Notable high-risk areas in Canada and the United States are the Canadian Shield, the Adirondack Mountains, the Laurentians, the Appalachians, and the Green Mountains of Vermont. These areas are vulnerable because of their high elevations, small watersheds, and naturally acidic soils. Different types of bedrock contain variable amounts of alkaline chemicals. Regions with bedrock containing less alkali have a lower capacity for reducing acidity, and thus are more sensitive to acid deposition.
Effects of soil on vegetation When acid rain falls, it can affect forests as well as lakes and rivers. To grow, trees need healthy soil to develop in. Acid rain is absorbed into the soil making it virtually impossible for these trees to survive.
ACE Information Programme aric
Air Pollution & Acid Rain Fact Sheets Series: KS4 & A 71
As a result of this, trees are more susceptible to viruses, fungi and insect pests. Long-term changes in the chemistry of some sensitive soils may have already occurred as a result of acid rain. As acid rain moves through the soils, it can strip away vital plant nutrients through chemical reactions, thus posing a potential threat to future forest productivity. Poisonous metals such as aluminium, cadmium and mercury, are leached from soils through reacting with acids. This happens because these metals are bound to the soil under normal conditions, but the added dissolving action of hydrogen ions causes rocks and small-bound soil particles to break down. Plant life in areas where acid rain is common may grow more slowly or die as a result of soil acidification. In the Green Mountains of Vermont and the White Mountains of New Hampshire in the United States 50% of the red spruce have died in the past 25 years. There has also been noted a reduced amount of growth in existing trees as measured by the size of growth rings of the trees in these areas. These effects occur because acid rain leaches many of the existing soil nutrients from the soil. The number of micro-organisms present in the soil also decreases as the soil becomes more acidic. This further depletes the amount of nutrients available to plant life because the micro-organisms play an important role in releasing nutrients from decaying organic material. In addition, the roots of plants trying to survive in acidic soil may be damaged directly by the acids present. Finally, if the plant life does not die from these effects, then it may be weakened enough so that it will be more susceptible to disease or other harsh environmental influences like cold winters or high winds.
ACE Information Programme aric
Air Pollution & Acid Rain Fact Sheets Series: KS4 & A 72
Critical Loads Environmental response to pollutants depends on many factors. Some regions cope with acidification better than others, having larger ‘critical loads’. Critical load refers to the greatest assault that an ecological system can withstand before showing measurable degradation. Scientists determine critical load by examining rock and soil type, land use and rainfall. If soil is fertile with a pH greater than 4.5, and rainfall is relatively low, the critical load will be high. The terrain can withstand moderately large additions of acidity without undue suffering. Conversely, in low pH soils, acidification mobilises toxic aluminium ions. If coniferous forests predominate, or if land is devoted to rough grazing, the result is a low critical load. Even minor acid deposition is undesirable. There are very few long-term UK monitoring studies of soil acidification and none of soil biota. Chemical data are available from a few specific sites, from a small number of regional studies and from three national studies. From the limited information available, the National Expert Group on Transboundary Pollution has concluded that there is evidence that acid deposition has resulted in widespread acidification of acid sensitive soils in the UK. Further critical loads modelling research suggests that soil recovery from acidification may take many years or even decades.
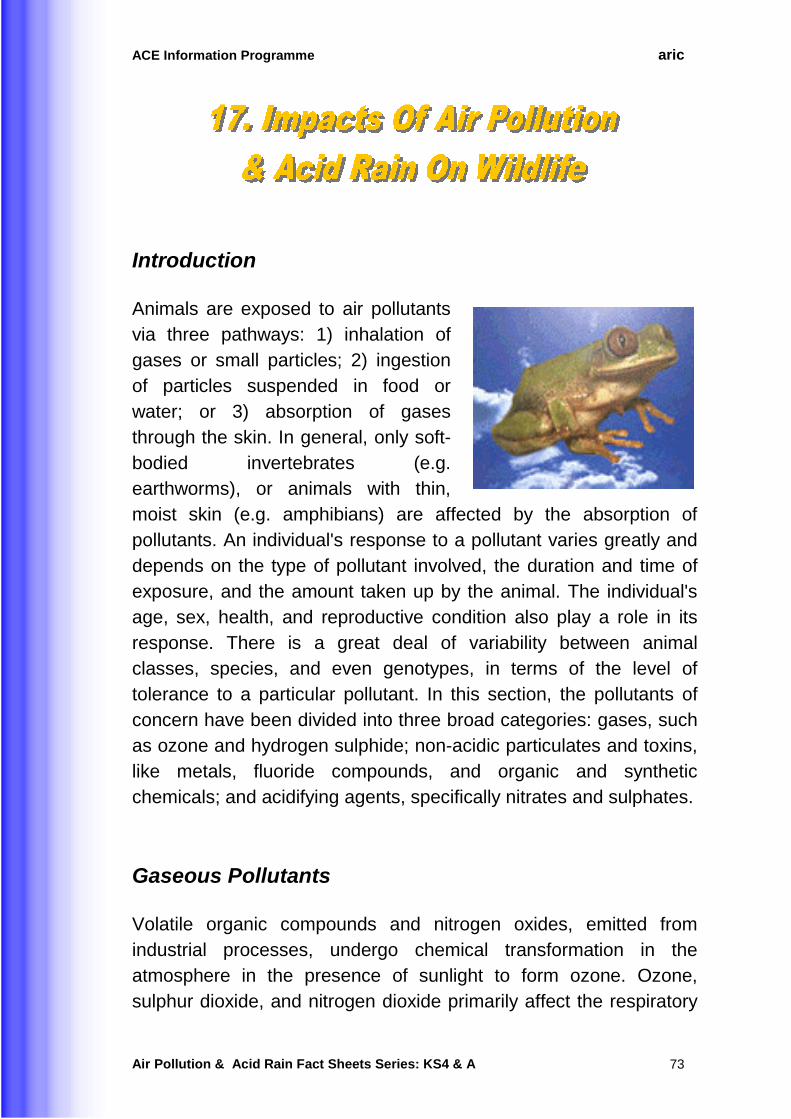
ACE Information Programme aric
Air Pollution & Acid Rain Fact Sheets Series: KS4 & A 73
Introduction
Animals are exposed to air pollutantsvia three pathways: 1) inhalation ofgases or small particles; 2) ingestionof particles suspended in food orwater; or 3) absorption of gasesthrough the skin. In general, only soft-bodied invertebrates (e.g.earthworms), or animals with thin,moist skin (e.g. amphibians) are affected by the absorption ofpollutants. An individual's response to a pollutant varies greatly anddepends on the type of pollutant involved, the duration and time ofexposure, and the amount taken up by the animal. The individual'sage, sex, health, and reproductive condition also play a role in itsresponse. There is a great deal of variability between animalclasses, species, and even genotypes, in terms of the level oftolerance to a particular pollutant. In this section, the pollutants ofconcern have been divided into three broad categories: gases, suchas ozone and hydrogen sulphide; non-acidic particulates and toxins,like metals, fluoride compounds, and organic and syntheticchemicals; and acidifying agents, specifically nitrates and sulphates.
Gaseous Pollutants
Volatile organic compounds and nitrogen oxides, emitted fromindustrial processes, undergo chemical transformation in theatmosphere in the presence of sunlight to form ozone. Ozone,sulphur dioxide, and nitrogen dioxide primarily affect the respiratory
ACE Information Programme aric
Air Pollution & Acid Rain Fact Sheets Series: KS4 & A 74
system, and it is likely that birds are even more susceptible togaseous pollutant injury than mammals due to their higherrespiratory rates.
Non-Acidic Particulates and Toxins
There are a number of air pollutants that are categorised asparticulates. Heavy metals (e.g. lead, arsenic, and cadmium) areemitted by smelters; fluoride is emitted in both gaseous andparticulate form from aluminium reduction plants and coal-firedpower plants; and dioxins, furans, and mercury are emitted byresource recovery facilities. Metals may affect the circulatory,respiratory, gastrointestinal, and central nervous systems ofanimals. Often organs such as the kidney, liver, and brain aretargeted. Entire populations can be affected as metal contaminationcan cause changes in birth, growth, and death rates.
Fluoride poisoning, or fluorosis, causes gross malformations ofbones and teeth. Plants take up gaseous fluoride and store it in theirtissues, and fluoride in particulate form is deposited on leaf surfacesand stays there until washed off. Herbivores are best known forexhibiting symptoms of fluoride poisoning. However, earthwormsand other soil invertebrates also accumulate fluoride, which is, inturn, passed on to the animals that eat them.
Organic and synthetic chemicals, such as dioxins andorganochlorines, affect wildlife. Dioxins bioaccumulate, or build up inthe body by concentrating in body fat, and they are resistant tobiological breakdown. A study of earthworms showed theyaccumulated dioxin up to five times the concentration found in thesoil, although this dose was not lethal to the worms. Nevertheless,this non-lethal accumulation could have strong ecologicalimplications, since earthworms are a major source of food for anumber of bird and small mammal species, many of which have
ACE Information Programme aric
Air Pollution & Acid Rain Fact Sheets Series: KS4 & A 75
exhibited carcinogenic, reproductive, and immunotoxic effects afterexposure to low levels of dioxins.
Nitrates and Sulphates
Sulphur dioxide and nitrogen oxides emitted as a result of fossil fuelcombustion undergo chemical transformation in the atmosphere,and occur as sulphate, nitrate, and hydrogen ions when dissolved inprecipitation known as “acid rain”. Well-buffered soils can adsorbsulphate and neutralise acidity, resulting in soil water andstreamwater composition being maintained in a range acceptable toorganisms. The adsorption capacity of even well-buffered soils islimited, however, and long-term deposition of acidic compoundsdepletes the supply of base cations in the soils that buffer theseinputs. The build-up of sulphates and nitrates in soils can result indelayed acidification of surface waters once saturation is reached insensitive watersheds.
The effects of decreasing pH on aquatic invertebrates and fish havebeen summarised in a National Acid Precipitation AssessmentProgram (NAPAP) report. Insect taxa differ greatly in their responseto acidity, with some species affected at pH levels near 6.0. In theearly stages of acidification, acid-sensitive species are replaced byacid-tolerant ones. However, as pH levels continue to drop, morespecies are lost.
Many studies have demonstrated that surface water acidification canlead to a decline in, and loss of, fish populations. Below pH 4.5 nofish are likely to survive. Fish loss is occurring in many countries,including Scandinavia, Scotland, Wales and North America. Adecrease in pH is often associated with an increase in metalavailability, being particularly true for aluminium and mercury.Decreased pH and elevated aluminium have been shown toincrease fish mortality, decrease fish growth, decrease eggproduction and embryo survival, and result in physiological
ACE Information Programme aric
Air Pollution & Acid Rain Fact Sheets Series: KS4 & A 76
impairment of adult fish. In general, embryos, fry, and juveniles areless acid-tolerant than adult fish. Aluminium can precipitate onto fishgills, inhibiting diffusion and resulting in respiratory stress.
Acid deposition is a possible cause of declines in amphibianpopulations. The larval stages of aquatic amphibian species aremost affected by acidic water. Many frog species use temporaryponds, but these tend to be small and shallow, and are easilyaffected by precipitation chemistry because their only sources ofwater are rainfall and snowmelt. Frogs that use large, permanentbodies of water for breeding generally lay their eggs in the summer,so they do not experience the acid pulses from snowmelt. However,the eggs and larvae of these species are even more sensitive tosubtle changes in pH levels than those of species that breed in thetemporary ponds. As is true with fish, the toxic effect of decreasedpH levels on amphibians is complicated when concentrations ofmetals, such as aluminium, in the water increase, but as a generalrule, embryos of sensitive amphibian species are killed by water witha pH of 4.5 or lower, while embryos of tolerant species can survivedown to a pH of 3.7.
Indirect Effects
In addition to affecting individual animals or populations directly, airpollutants also affect wildlife indirectly by causing changes in theecosystem. Vegetation affords cover for protection from predatorsand weather, provides breeding and nesting habitat, and also servesas a food source. Therefore, any change in vegetation couldindirectly affect animal populations. Many studies have found thatinvertebrates show a preference for, or are better able to establishthemselves in, air pollution-injured vegetation.
Fluoride and heavy metals can accumulate in the soil to levels thatare toxic to soil invertebrates. Species sensitive to metals arereplaced by ones that are more metal-tolerant. For example, soft-
ACE Information Programme aric
Air Pollution & Acid Rain Fact Sheets Series: KS4 & A 77
bodied species such as earthworms and nematodes seem to bemore readily affected by elevated metal concentrations.Invertebrates play an important role in forest floor litterdecomposition. As forest floor litter builds up, mineral release isdelayed, and the availability of nutrients to plants is reduced.Herbivores are ultimately affected when the quantity or quality oftheir food supply decreases.
Although birds and mammals are not directly affected by wateracidification, they are indirectly affected by changes in the quantityand quality of their food resources. Some birds such as the osprey,find difficulty in living around an acid lake because there are farfewer fish to be found. However, the diver finds hunting easier in anacid lake because the water of an acid lake is clearer than that of anormal lake. In Scotland, Otters are quite rare around acidic streamsand rivers, as their main food supply, fish, are reduced.
Calcium is an essential element for both mammals and birds. Anadequate dietary supply is crucial during reproduction. Birds needcalcium for the proper formation of eggshells and for skeletal growthof hatchlings, and mammals need calcium for skeletal developmentof foetuses. Many invertebrate species that contain highconcentrations of calcium, such as molluscs and crustaceans, arevery sensitive to pH levels and are among the first to disappearduring the acidification of wetlands.
ACE Information Programme aric
Air Pollution & Acid Rain Fact Sheets Series: KS4 & A 78
Introduction Since the early 1800s, pollution problems have largely resulted from industry and domestic heating, principally due to sulphur dioxide. In recent years, however, the transport sector has become the most significant source of both primary pollutants, such as nitrogen dioxide, and secondary pollutants, like ozone. This fact sheet investigates the major air pollutants in the United Kingdom, and their health effects.
Particulates Particulates may be seen as the more critical of all pollutants, and some estimates have suggested that particulates are responsible for up to 10,000 premature deaths in the UK each year. The extent to which particulates are considered harmful depends largely on their composition. Sea salt, for example, is believed to have a positive effect on health. Man-made sources of particulates, however, are rarely harmless. In towns and cities, these are extensively from diesel vehicle exhausts. The effects of particulate emissions are considered detrimental due to their composition, containing mainly unburned fuel oil and polycyclic aromatic hydrocarbons (PAHs) that are known to be carcinogenic among laboratory animals. Particulates may originate from many other sources including cement manufacturing processes, incineration and power generation, meaning localised instances of particulate pollution are common. The categorisation of particles through size has recently become important when assessing their effects on health.
ACE Information Programme aric
Air Pollution & Acid Rain Fact Sheets Series: KS4 & A 79
Monitoring now exists for PM10 as well as total suspended particulates. This is due to the fact that particles of less than 10
micrometres (µm3) in diameter can penetrate deep into the lung and
cause more damage, as opposed to larger particles that may be filtered out through the airways’ natural mechanisms.
Ozone Ozone differs from most pollutants in that it is created as a secondary pollutant by the action of sunlight on volatile organic compounds (VOCs) and oxides of nitrogen, often over several days. This results in ozone being widely dispersed as a pollutant, and can form in greater concentrations in rural areas. As ozone concentrations are particularly dependant on sunlight, episodes are always likely to develop following sustained periods of warmth and calm weather. Ozone is a toxic gas that can bring irreversible damage to the respiratory tract and lung tissue if delivered in high quantities. Levels during air pollution episodes have peaked at around 250 ppb. At these concentrations ozone is likely to impair lung function and cause irritation to the respiratory tract. Asthmatics are known to adopt these symptoms more easily.
Oxides of Nitrogen The oxides of most concern are nitric oxide (NO) and nitrogen dioxide (NO2). The latter is more damaging to health, due to the toxic nature of this gas. NO is more readily emitted to the atmosphere as a primary pollutant, from traffic and power stations, and is often oxidised to nitrogen dioxide following dispersal. Health effects of exposure to NO2 include shortness of breath and chest pains. The effects of NO include changes to lung function at high concentrations.
ACE Information Programme aric
Air Pollution & Acid Rain Fact Sheets Series: KS4 & A 80
Carbon Monoxide Transport, tobacco smoke and gas appliances are the major sources of carbon monoxide. Its link with haemoglobin, the oxygen carrying component of the blood stream, forms carboxyhaemoglobin (COHb) which can be life-threatening in high doses. The effects of carbon monoxide pollution are more damaging to pregnant women and their foetus. Research into smoking and pregnancy shows that concentrations within the blood stream of unborn infants is as high as 12%, causing retardation of the unborn child’s growth and mental development.
Lead A significant proportion of atmospheric lead comes from traffic emissions, due to the lead content in petrol. This has been significantly reduced in recent years but lead is still a serious air pollutant especially to those living near to areas of dense traffic in cities where leaded fuel is still used. Damage to the central nervous system, kidneys and brain can result when levels in the blood reach concentrations of 800 mg/litre. Much of the concern regarding pollution from lead centres around its effects on child health. Children exhibit vulnerability to the toxic effects of lead at much lower concentrations than for adults. It has been shown that there is a strong link between high lead exposures and impaired intelligence.
Sulphur dioxide The health effects of sulphur dioxide pollution were exposed graphically during the "Great Smog" of London in 1952. This resulted in approximately 4000 premature deaths through heart disease and bronchitis. Since then, however, emissions have been significantly reduced through legislative measures. Research has shown that exposure for asthmatics is significantly more damaging
ACE Information Programme aric
Air Pollution & Acid Rain Fact Sheets Series: KS4 & A 81
than for normal subjects. Concentrations above 125 ppb may resultin a fall in lung function in asthmatics. Tightness in the chest andcoughing may also result at levels approaching 400 ppb. At levelsabove 400 ppb the lung function of asthmatics may be impaired tothe extent that medical help is required. There have been severalexceedences of levels in Northern Ireland due to the high use ofsolid fuel (coal) in homes for heating purposes. Sulphur dioxidepollution is considered more harmful when particulate and otherpollution concentrations are high. This is known as the synergisticeffect, or more commonly the “cocktail effect.” Therefore themonitoring networks in the UK incorporate both smoke and sulphurdioxide.
Volatile Organic Compounds (VOCs)
Some VOCs are quite harmful, including the following: Benzene:may increase susceptibility to leukaemia, if exposure is maintainedover a period of time. Polycyclic Aromatic Hydrocarbons (PAH):forms of this compound can cause cancer. There are severalhundred different forms of PAH, and sources can be both naturaland man-made. Dioxins: sources of dioxins vary, although themanufacturing of organic compounds as well as the incineration ofwastes and various other combustion processes involvingchlorinated compounds may also produce dioxins. Health effects areas much a problem due to ingestion, as inhalation, such is theproblem of dioxins entering the food chain from soils. 1,3Butadiene: there is an apparent correlation between butadieneexposure and a higher risk of cancer. Sources are manufacturing ofsynthetic rubbers, petrol driven vehicles and cigarette smoke.
ACE Information Programme aric
Air Pollution & Acid Rain Fact Sheets Series: KS4 & A 82
General Air Quality Problems
Air quality indoors
Many different compounds are contained in tobacco smoke,including carbon monoxide, ammonia, dioxins and PAH; the lattertwo are thought to be carcinogenic. Other sources of indoor pollutioninclude particulates from mineral fibres as well as household dust.Dust in buildings is known to cause problems including fatigue andnausea. One of the most pressing concerns with indoor air pollutionis with carbon monoxide build up from gas fired appliances.
Asthma and air pollution
There has been a steady rise in the number of reported asthmacases since the 1970s. Awareness of the disease has beensignificant in the rising numbers of hospital admissions although airpollution problems are also believed to be significant in the risingnumber of cases. High concentrations of nitrogen dioxide, sulphurdioxide, ozone and particulates (especially PM10) can all triggerbreathing difficulties in asthmatics.
ACE Information Programme aric
Air Pollution & Acid Rain Fact Sheets Series: KS4 & A 83
Introduction
Lichens are mutualistic associations of a fungus and an alga orcyanobacterium and occur as crusty patches or bushy growths ontrees, rocks and bare ground. The names given to lichens strictlyrefer to the fungal partner; the algae have separate names. Lichensare very sensitive to sulphur dioxide pollution in the air. Sinceindustrialisation, many lichen species have become extinct in largeareas of lowland Britain, one example being the beard moss Usneaarticulata. This is mainly due to sulphur dioxide pollution, but theloss of habitat, particularly ancient woodland, has also led toreductions in some species. Lichens are sensitive to sulphur dioxidebecause their efficient absorption systems result in rapidaccumulation of sulphur when exposed to high levels of sulphurdioxide pollution. The algal partner seems to be most affected by thesulphur dioxide; chlorophyll is destroyed and photosynthesis isinhibited. Lichens also absorb sulphur dioxide dissolved in water.
Use as Bio-indicators
Lichens are widely used as environmental indicators or bio-indicators. If air is very badly polluted with sulphur dioxide there maybe no lichens present, just green algae may be found. If the air isclean, shrubby, hairy and leafy lichens become abundant. A fewlichen species can tolerate quite high levels of pollution and arecommonly found on pavements, walls and tree bark in urban areas.The most sensitive lichens are shrubby and leafy while the mosttolerant lichens are all crusty in appearance. Since industrialisationmany of the shrubby and leafy lichens such as Ramalina, Usneaand Lobaria species have very limited ranges, often being confined
ACE Information Programme aric
Air Pollution & Acid Rain Fact Sheets Series: KS4 & A 84
to the parts of Britain with the purest air such as northern andwestern Scotland and Devon and Cornwall.
Impacts of Acid Rain
Acid rain became a recognised international problem during the1980s resulting from the dispersion of air pollutants via tall chimneystacks. Air pollution and acid deposition has led to problems forlichens on bark, particularly because the tree bark has often becomemore acidic. In some areas, although gaseous sulphur dioxide levelshave fallen, the bark of older trees is too acidic for recolonisation,and new growth develops on twigs and younger trees. Somespecies of lichens have become more widely distributed than theywere a century ago as they are more tolerant of acid conditions,such as some species of Bryoria, Parmeliopsis, Pseudevernia andRinodina.
Zonation of Lichens
A lichen zone pattern may be observed in large towns and cities oraround industrial complexes which corresponds to the mean levelsof sulphur dioxide experienced. Table 1 shows the lichen zone scaleof Hawksworth & Rose (1970). Particular species of lichen presenton tree bark can indicate the typical sulphur dioxide levelsexperienced in that area. For example if there are no lichenspresent, the air quality is very poor (zone 1), whilst generally onlycrusty lichens such as Lecanora conizaeoides or Lepraria incanacan tolerate poor air quality (zone 3). In moderate to good air, leafylichens such as Parmelia caperata or Evernia prunastri can survive(zone 6) and in areas where the air is very clean, rare species suchas ‘the string of sausages’ Usnea articulata or the golden wiry lichenTeloschistes flavicans may grow (zone 10).
ACE Information Programme aric
Air Pollution & Acid Rain Fact Sheets Series: KS4 & A 85
It is important to note that the zone chart in Table 1 applies to areaswhere sulphur dioxide levels are increasing. If sulphur dioxideconditions are falling, lichens rarely colonise in exactly the samesequence; lichens are slow growing and may take a year or two torecolonise bark or other substrates following a reduction in airpollution levels, and tiny recolonising specimens can be difficult tospot and identify.
During the early and mid-twentieth century, air pollution levels weremuch greater than they are today in towns and cities of the UK.Sulphur dioxide levels were highest in the inner city areas becomingless polluted out towards the edges of the urban areas. At suchtimes, the lichen zone scale would often highlight zone 1 as theinner city area, moving through the zones to the cleaner air at theedge of the city. From the 1970s onwards, sulphur dioxide levelshave been falling markedly in the central and outer areas of cities,such that there may be no differentiation between levels in centraland outer areas of many cities. The fall in sulphur dioxide levelsbetween the 1970s and the 1990s has led to a number of lichensrecolonising in areas from which they had previously beeneliminated.
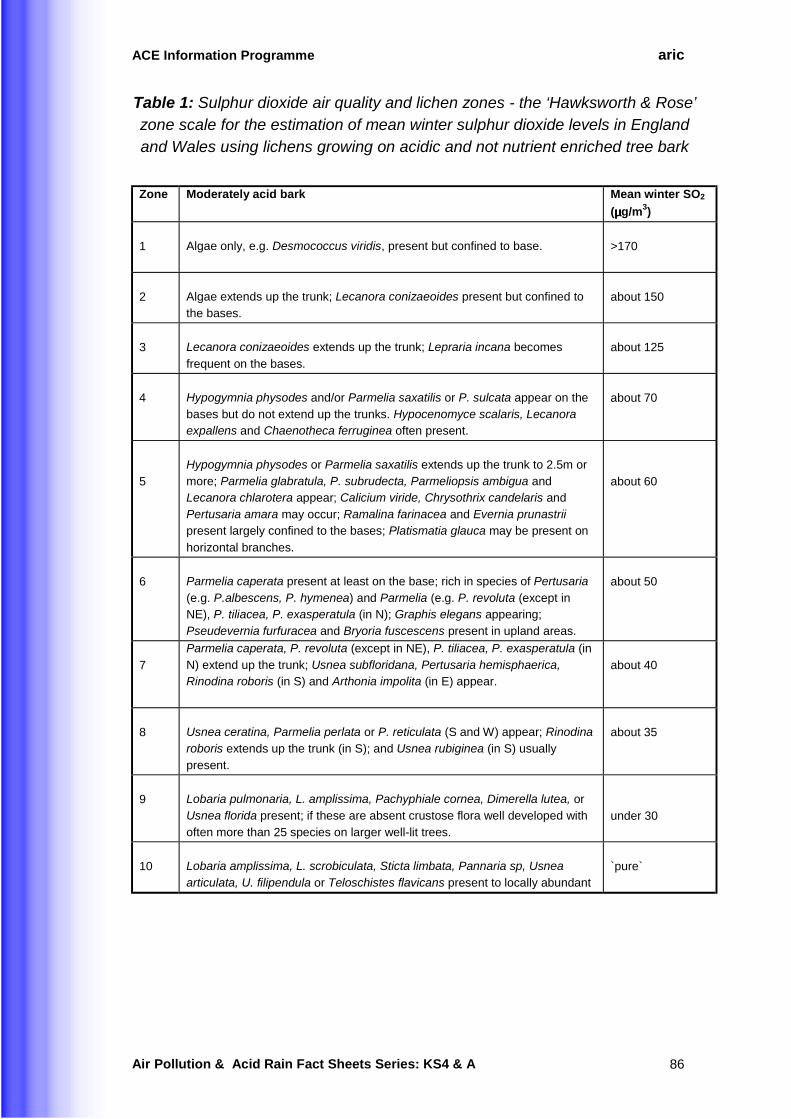
ACE Information Programme aric
Air Pollution & Acid Rain Fact Sheets Series: KS4 & A 86
Table 1: Sulphur dioxide air quality and lichen zones - the ‘Hawksworth & Rose’zone scale for the estimation of mean winter sulphur dioxide levels in Englandand Wales using lichens growing on acidic and not nutrient enriched tree bark
Zone Moderately acid bark Mean winter SO2
(µµµµg/m3)
1 Algae only, e.g. Desmococcus viridis, present but confined to base. >170
2 Algae extends up the trunk; Lecanora conizaeoides present but confined to
the bases.about 150
3 Lecanora conizaeoides extends up the trunk; Lepraria incana becomes
frequent on the bases.
about 125
4 Hypogymnia physodes and/or Parmelia saxatilis or P. sulcata appear on the
bases but do not extend up the trunks. Hypocenomyce scalaris, Lecanoraexpallens and Chaenotheca ferruginea often present.
about 70
5
Hypogymnia physodes or Parmelia saxatilis extends up the trunk to 2.5m or
more; Parmelia glabratula, P. subrudecta, Parmeliopsis ambigua andLecanora chlarotera appear; Calicium viride, Chrysothrix candelaris andPertusaria amara may occur; Ramalina farinacea and Evernia prunastriipresent largely confined to the bases; Platismatia glauca may be present on
horizontal branches.
about 60
6 Parmelia caperata present at least on the base; rich in species of Pertusaria
(e.g. P.albescens, P. hymenea) and Parmelia (e.g. P. revoluta (except inNE), P. tiliacea, P. exasperatula (in N); Graphis elegans appearing;Pseudevernia furfuracea and Bryoria fuscescens present in upland areas.
about 50
7
Parmelia caperata, P. revoluta (except in NE), P. tiliacea, P. exasperatula (in
N) extend up the trunk; Usnea subfloridana, Pertusaria hemisphaerica,Rinodina roboris (in S) and Arthonia impolita (in E) appear.
about 40
8 Usnea ceratina, Parmelia perlata or P. reticulata (S and W) appear; Rinodina
roboris extends up the trunk (in S); and Usnea rubiginea (in S) usually
present.
about 35
9 Lobaria pulmonaria, L. amplissima, Pachyphiale cornea, Dimerella lutea, orUsnea florida present; if these are absent crustose flora well developed with
often more than 25 species on larger well-lit trees.under 30
10 Lobaria amplissima, L. scrobiculata, Sticta limbata, Pannaria sp, Usnea
articulata, U. filipendula or Teloschistes flavicans present to locally abundant`pure`
ACE Information Programme aric
Air Pollution & Acid Rain Fact Sheets Series: KS4 & A 87
Introduction The development of air pollution control in the UK has been strongly influenced by the smogs experienced in cities during the 1950s. As a result of measures put in place in response to the smogs, the UK no longer experiences high levels of smoke and sulphur dioxide pollution. High mortality rates associated with smogs have been eliminated and healthy individuals are unlikely to experience acute effects at typical air pollution levels. However, there is evidence of associations with advanced mortality, chronic illness and discomfort for sensitive groups. The Environment Act of 1995 included a requirement for the development of a strategy to address areas of poor and declining air quality, to reduce any significant risk to health and to achieve the wider objectives of sustainable development in relation to air quality in the UK. The National Air Quality Strategy was published in response to this Act on March 12th 1997, with commitments to achieve new air quality objectives throughout the UK by 2005. A review of the Strategy led to the publication of Air Quality Strategy for England, Scotland, Wales and Northern Ireland in January 2000.
The Strategy The Air Quality Strategy intends to provide a clear framework for improving air quality through:
• = a clear and simple policy framework;
• = realistic but challenging objectives;
• = regulation and financial incentives to help achieve the objectives;
• = analysis of costs and benefits;
ACE Information Programme aric
Air Pollution & Acid Rain Fact Sheets Series: KS4 & A 88
• = monitoring and research to increase our understanding;
• = information to raise public awareness. The Air Quality Strategy proposals aim to protect health and the environment without imposing unacceptable economic or social costs. They form an essential part of the Government’s strategy for sustainable development, which has four main aims:
• = social progress which meets the needs of everyone;
• = effective protection of the environment;
• = prudent use of natural resources; and ;
• = maintenance of high and stable levels of economic growth and employment.
The fundamental aim of the Government is to render polluting emissions harmless. It is necessary, therefore, to firstly define a level of harmlessness, and then to establish a policy towards the achievement of the levels by means of objectives as costs and benefits dictate.
Air Quality Standards and Objectives The Strategy sets out standards and objectives for the 8 main health-threatening air pollutants in the UK. The standards are based on an assessment of the effects of each pollutant on public health. They are based on recommendations by the Expert Panel on Air Quality Standards, The European Union Air Quality Daughter Directive and the World Health Organisation. Local Authorities are responsible for seven of the eight air pollutants under Local Air Quality Management (LAQM). National objectives have also been set for the eighth pollutant, ozone, as well as for nitrogen oxides and sulphur dioxide.
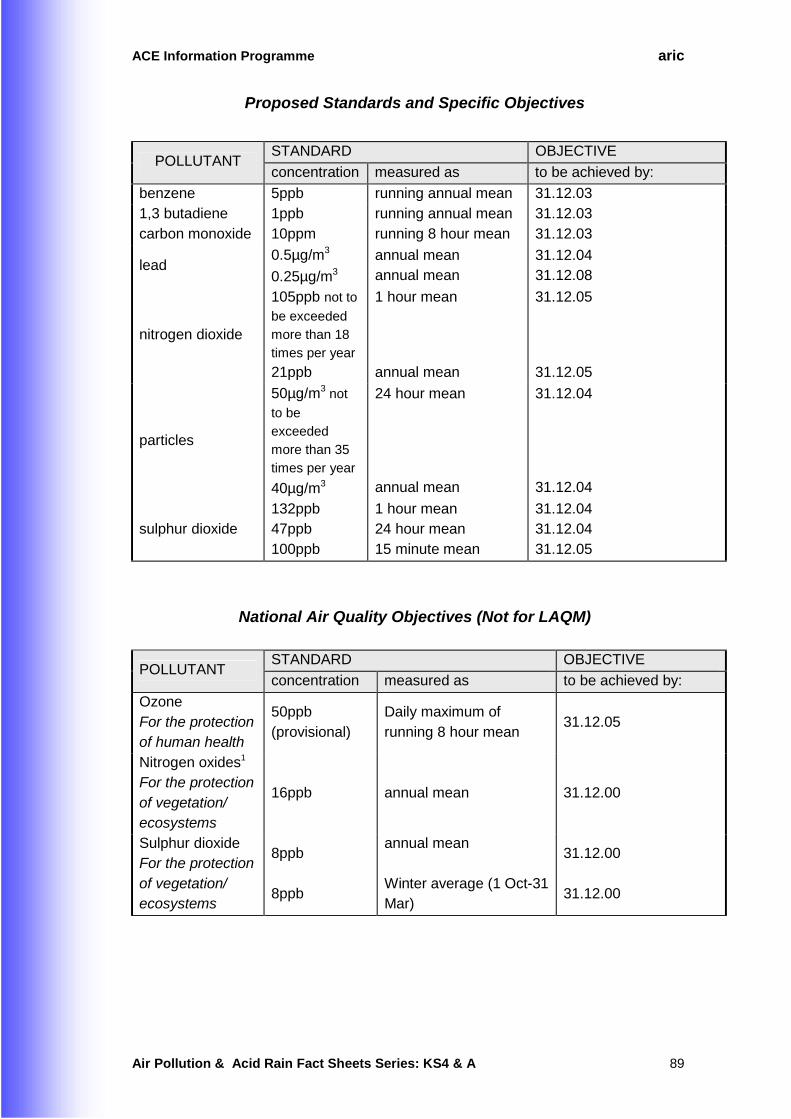
ACE Information Programme aric
Air Pollution & Acid Rain Fact Sheets Series: KS4 & A 89
Proposed Standards and Specific Objectives
STANDARD OBJECTIVE
POLLUTANT concentration measured as to be achieved by:
benzene 5ppb running annual mean 31.12.03 1,3 butadiene 1ppb running annual mean 31.12.03 carbon monoxide 10ppm running 8 hour mean 31.12.03
lead 0.5µg/m3
0.25µg/m3
annual mean annual mean
31.12.04 31.12.08
nitrogen dioxide
105ppb not to
be exceeded
more than 18
times per year
21ppb
1 hour mean
annual mean
31.12.05
31.12.05
particles
50µg/m3 not
to be
exceeded
more than 35
times per year
40µg/m3
24 hour mean
annual mean
31.12.04
31.12.04
sulphur dioxide 132ppb 47ppb 100ppb
1 hour mean 24 hour mean 15 minute mean
31.12.04 31.12.04 31.12.05
National Air Quality Objectives (Not for LAQM)
STANDARD OBJECTIVE POLLUTANT
concentration measured as to be achieved by:
Ozone For the protection of human health
50ppb (provisional)
Daily maximum of running 8 hour mean
31.12.05
Nitrogen oxides1
For the protection of vegetation/ ecosystems
16ppb annual mean 31.12.00
Sulphur dioxide For the protection of vegetation/ ecosystems
8ppb 8ppb
annual mean Winter average (1 Oct-31 Mar)
31.12.00 31.12.00
ACE Information Programme aric
Air Pollution & Acid Rain Fact Sheets Series: KS4 & A 90
Achieving the Objectives The objectives in the 2000 Air Quality Strategy are generally more stringent than in the original 1997 Strategy. These objectives are expected to be met through involvement from key sectors. The Government and devolved administrations are to provide a clear and simple policy framework on improving air quality, which includes the setting of objectives, monitoring air quality, conducting emission inventories and predicting pollution concentrations. A key role of the government is also to inform and promote awareness of air quality issues. Industry is a significant emitter of air pollutants. Under the Environmental Protection Act 1990 some 2000 of the most polluting processes have been made subject to Integrated Pollution Control, whilst a further 13,000 processes have been made subject to Local Air Pollution Control. Pollution Prevention and Control (PPC) is being phased in from October 1999 and will apply to a larger number of industrial applications than previously, which will lead to further reductions in emissions over time. Industry is required to use best available technology (BAT) to reduce emissions in pursuit of air quality objectives. Local authorities now have an important role in helping to reduce air pollution. In England and Wales, local authorities control emissions from certain industrial processes though PPC. In Scotland, the Scottish Environment Protection Agency carry out similar functions. Local Air Quality Management is the main tool for local authorities to deal with problem areas of pollution, known as pollution hotspots. Road transport is often a major source of urban pollution and local authorities may choose to reduce such pollution through strategies such as traffic reduction and local air quality strategies.
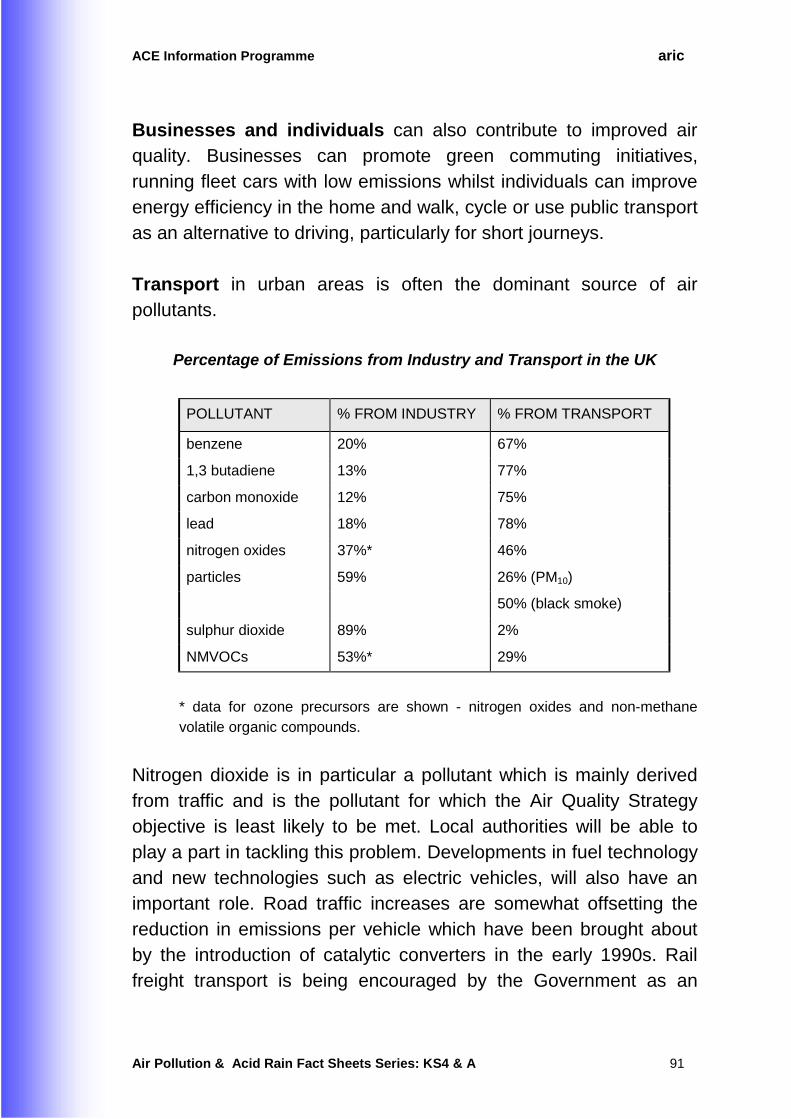
ACE Information Programme aric
Air Pollution & Acid Rain Fact Sheets Series: KS4 & A 91
Businesses and individuals can also contribute to improved air quality. Businesses can promote green commuting initiatives, running fleet cars with low emissions whilst individuals can improve energy efficiency in the home and walk, cycle or use public transport as an alternative to driving, particularly for short journeys. Transport in urban areas is often the dominant source of air pollutants.
Percentage of Emissions from Industry and Transport in the UK
POLLUTANT % FROM INDUSTRY % FROM TRANSPORT
benzene 20% 67%
1,3 butadiene 13% 77%
carbon monoxide 12% 75%
lead 18% 78%
nitrogen oxides 37%* 46%
particles 59% 26% (PM10)
50% (black smoke)
sulphur dioxide 89% 2%
NMVOCs 53%* 29%
* data for ozone precursors are shown - nitrogen oxides and non-methane volatile organic compounds.
Nitrogen dioxide is in particular a pollutant which is mainly derived from traffic and is the pollutant for which the Air Quality Strategy objective is least likely to be met. Local authorities will be able to play a part in tackling this problem. Developments in fuel technology and new technologies such as electric vehicles, will also have an important role. Road traffic increases are somewhat offsetting the reduction in emissions per vehicle which have been brought about by the introduction of catalytic converters in the early 1990s. Rail freight transport is being encouraged by the Government as an
ACE Information Programme aric
Air Pollution & Acid Rain Fact Sheets Series: KS4 & A 92
alternative to road transport, as one means of reducing vehicle emissions.
Conclusion The Air Quality Strategy 2000 sets out the way forward for improving air quality in the UK over the next few years and is to be regularly reviewed. The framework has been set to achieve cleaner air that will bring health and social benefits to all individuals, though the effort of everyone is required to help deliver cleaner air. The full Air Quality Strategy for England, Wales, Scotland and Northern Ireland is available on the DEFRA website: http://www.defra.gov.uk/environment/airquality/strategy/index.htm
ACE Information Programme aric
Air Pollution & Acid Rain Fact Sheets Series: KS4 & A 93
Introduction The major urban air pollutants are monitored at a variety of urban and rural sites within the UK by the National Environmental Technology Centre (NETCEN) on behalf of the Department for Environment, Food & Rural Affairs (DEFRA). Pollutants monitored include oxides of nitrogen, particulates, sulphur dioxide, hydrocarbons (e.g. benzene, toluene), carbon monoxide, lead and ozone. Guidelines and standards, set either by the UK or by other international organisations, provide criteria against which UK levels of air pollutants can be compared and assessed:
• = UK National Air Quality Guidelines;
• = UK Air Quality Bands (DEFRA);
• = European Community Directive and Daughter Directive Limit and Guide Values;
• = World Health Organisation Guidelines;
• = United Nations Economic Commission for Europe Critical Levels.
UK National Air Quality Guidelines The UK National Air Quality Strategy was adopted in March 1997 with the intention of providing a clear framework for improving air quality. The Strategy was revised in January 2000 and is now known as the Air Quality Strategy for England, Wales, Scotland & Northern Ireland. Central to the structure of the Strategy are standards and objectives relating to air quality. The Air Quality Strategy places responsibility with local authorities for reviewing, assessing and managing seven of the eight main health threatening pollutants in the UK.
ACE Information Programme aric
Air Pollution & Acid Rain Fact Sheets Series: KS4 & A 94
The Air Quality Strategy objectives are based on the recommendations of the UK Expert Panel on Air Quality Standards (EPAQS) and European Union Air Quality Directives. The Strategy aims to provide the best practicable protection to human health and the environment with regard to the scientific and medical evidence of the effects of each particular pollutant on health.
UK Air Pollution Bands / Index The Department for Environment, Food & Rural Affairs (DEFRA) operate an air quality information service to inform the public about levels of pollutants. Air pollution is classified as either ‘low’, ‘moderate’, ‘high’ or ‘very high’ for nitrogen dioxide, sulphur dioxide, ozone, carbon monoxide and fine particles (PM10). DEFRA have recently modified this system to include a 1-10 index, similar to the sun index and pollen index used on national TV weather forecasts. Index 1 is low and 10 is very high.
European Community Directives & Daughter Directives The European Community, now known as the European Union, aim to control and regulate air pollution by setting long-term air quality objectives. In 1996 the EC adopted the Framework Directive 96/62/EC on ambient air quality and assessment. This Directive revises preceding legislation and introduces new legislation for air pollutants that have not previously been regulated. The Framework Directive is to be supported by a series of Daughter Directives. European Union limit values for air pollutants are generally derived from World Health Organisation (WHO) guideline values. The Daughter Directives set the numerical limit values and thresholds for particular pollutants (or target values for ozone). The first Daughter Directive came into force in July 1999 (First Daughter Directive 1999/30/EC). This Directive relates to limit values for
ACE Information Programme aric
Air Pollution & Acid Rain Fact Sheets Series: KS4 & A 95
nitrogen oxides, sulphur dioxide, lead and particulates (PM10). EU member states must ensure that ambient air quality data for NOx, SO2, Pb and PM10 are made available to the public. The Second Daughter Directive 2000/69/EC relates to limit values for benzene and carbon monoxide in ambient air and came into force on the 13th of December 2000. This Directive establishes limit values for concentrations of benzene and carbon monoxide in ambient air. The Third Daughter Directive is proposed to replace the current legislation on ozone (Directive 92/72/EC) and the Fourth Daughter Directive will cover new pollutants; arsenic, cadmium, nickel, mercury and polycyclic aromatic hydrocarbons (PAHs). Concentrations of air pollutants in the ambient environment of European Union states are regulated by statutory air quality limit values which have been set by EC Directives. The limit values within these directives are incorporated into member state law and are designed for the protection of human health. In addition, these directives set guide values which are at a lower concentration than the limit value, for the protection of the environment as a whole.
World Health Organisation Guidelines The World Health Organisation (WHO) set air quality guidelines for Europe in 1987 (WHO, 1987). These covered, amongst other pollutants, nitrogen dioxide, sulphur dioxide and ozone with guideline values set for the protection of human health. In 1999, the World Health Organisation updated the 1997 Air Quality Guidelines for Europe by introducing Guidelines for Air Quality which were applicable globally. There is a general downward revision of air quality standards, as evidence becomes available of health based effects of certain air pollutants. Therefore the WHO guidelines are likely to be changed again in coming years.
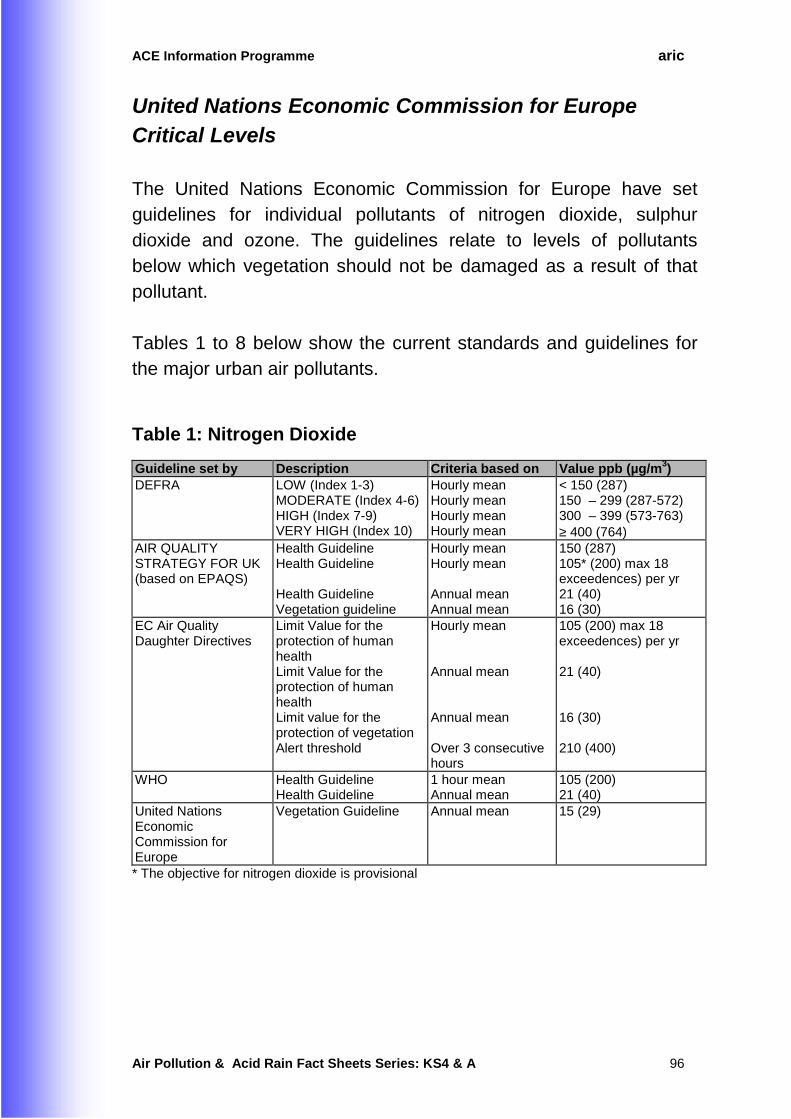
ACE Information Programme aric
Air Pollution & Acid Rain Fact Sheets Series: KS4 & A 96
United Nations Economic Commission for Europe Critical Levels The United Nations Economic Commission for Europe have set guidelines for individual pollutants of nitrogen dioxide, sulphur dioxide and ozone. The guidelines relate to levels of pollutants below which vegetation should not be damaged as a result of that pollutant. Tables 1 to 8 below show the current standards and guidelines for the major urban air pollutants.
Table 1: Nitrogen Dioxide Guideline set by Description Criteria based on Value ppb (µg/m3) DEFRA LOW (Index 1-3)
MODERATE (Index 4-6) HIGH (Index 7-9) VERY HIGH (Index 10)
Hourly mean Hourly mean Hourly mean Hourly mean
< 150 (287) 150 – 299 (287-572) 300 – 399 (573-763) ≥ 400 (764)
AIR QUALITY STRATEGY FOR UK (based on EPAQS)
Health Guideline Health Guideline Health Guideline Vegetation guideline
Hourly mean Hourly mean Annual mean Annual mean
150 (287) 105* (200) max 18 exceedences) per yr 21 (40) 16 (30)
EC Air Quality Daughter Directives
Limit Value for the protection of human health Limit Value for the protection of human health Limit value for the protection of vegetation Alert threshold
Hourly mean Annual mean Annual mean Over 3 consecutive hours
105 (200) max 18 exceedences) per yr 21 (40) 16 (30) 210 (400)
WHO Health Guideline Health Guideline
1 hour mean Annual mean
105 (200) 21 (40)
United Nations Economic Commission for Europe
Vegetation Guideline Annual mean 15 (29)
* The objective for nitrogen dioxide is provisional
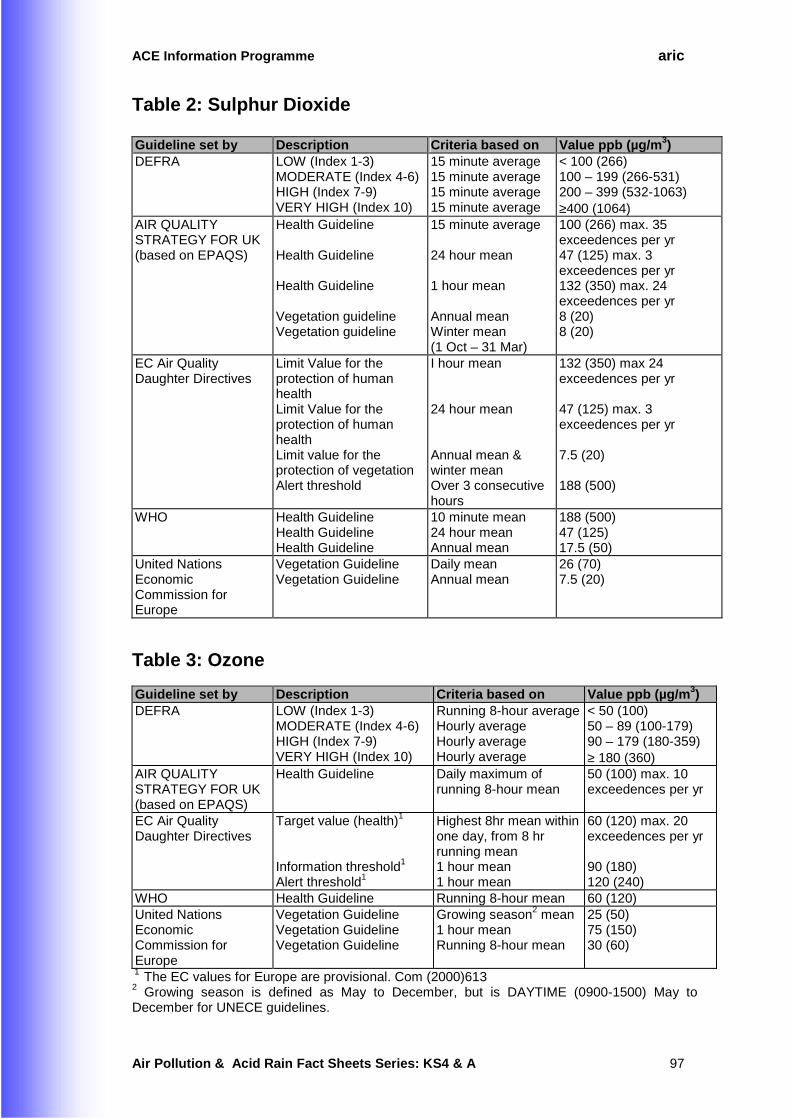
ACE Information Programme aric
Air Pollution & Acid Rain Fact Sheets Series: KS4 & A 97
Table 2: Sulphur Dioxide Guideline set by Description Criteria based on Value ppb (µg/m3) DEFRA LOW (Index 1-3)
MODERATE (Index 4-6) HIGH (Index 7-9) VERY HIGH (Index 10)
15 minute average 15 minute average 15 minute average 15 minute average
< 100 (266) 100 – 199 (266-531) 200 – 399 (532-1063) ≥400 (1064)
AIR QUALITY STRATEGY FOR UK (based on EPAQS)
Health Guideline Health Guideline Health Guideline Vegetation guideline Vegetation guideline
15 minute average 24 hour mean 1 hour mean Annual mean Winter mean (1 Oct – 31 Mar)
100 (266) max. 35 exceedences per yr 47 (125) max. 3 exceedences per yr 132 (350) max. 24 exceedences per yr 8 (20) 8 (20)
EC Air Quality Daughter Directives
Limit Value for the protection of human health Limit Value for the protection of human health Limit value for the protection of vegetation Alert threshold
I hour mean 24 hour mean Annual mean & winter mean Over 3 consecutive hours
132 (350) max 24 exceedences per yr 47 (125) max. 3 exceedences per yr 7.5 (20) 188 (500)
WHO Health Guideline Health Guideline Health Guideline
10 minute mean 24 hour mean Annual mean
188 (500) 47 (125) 17.5 (50)
United Nations Economic Commission for Europe
Vegetation Guideline Vegetation Guideline
Daily mean Annual mean
26 (70) 7.5 (20)
Table 3: Ozone Guideline set by Description Criteria based on Value ppb (µg/m3) DEFRA LOW (Index 1-3)
MODERATE (Index 4-6) HIGH (Index 7-9) VERY HIGH (Index 10)
Running 8-hour average Hourly average Hourly average Hourly average
< 50 (100) 50 – 89 (100-179) 90 – 179 (180-359) ≥ 180 (360)
AIR QUALITY STRATEGY FOR UK (based on EPAQS)
Health Guideline Daily maximum of running 8-hour mean
50 (100) max. 10 exceedences per yr
EC Air Quality Daughter Directives
Target value (health)1
Information threshold1 Alert threshold1
Highest 8hr mean within one day, from 8 hr running mean 1 hour mean 1 hour mean
60 (120) max. 20 exceedences per yr 90 (180) 120 (240)
WHO Health Guideline Running 8-hour mean 60 (120) United Nations Economic Commission for Europe
Vegetation Guideline Vegetation Guideline Vegetation Guideline
Growing season2 mean 1 hour mean Running 8-hour mean
25 (50) 75 (150) 30 (60)
1 The EC values for Europe are provisional. Com (2000)613 2 Growing season is defined as May to December, but is DAYTIME (0900-1500) May to December for UNECE guidelines.
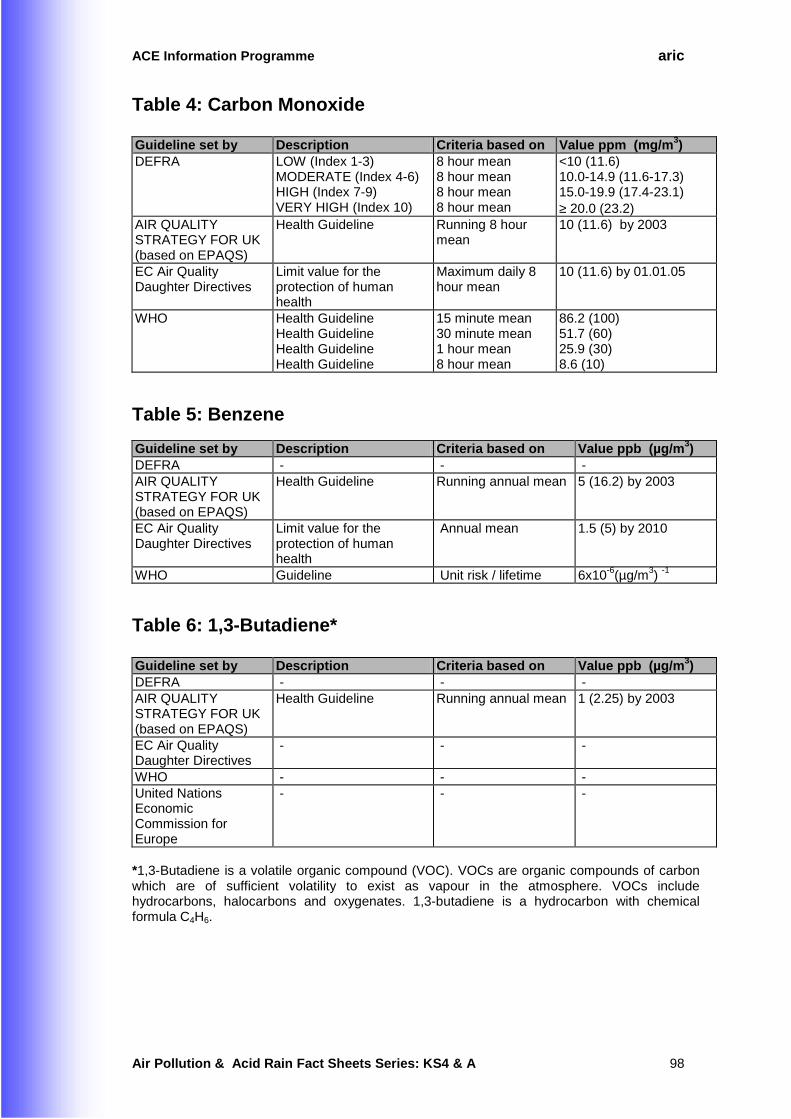
ACE Information Programme aric
Air Pollution & Acid Rain Fact Sheets Series: KS4 & A 98
Table 4: Carbon Monoxide Guideline set by Description Criteria based on Value ppm (mg/m3) DEFRA LOW (Index 1-3)
MODERATE (Index 4-6) HIGH (Index 7-9) VERY HIGH (Index 10)
8 hour mean 8 hour mean 8 hour mean 8 hour mean
<10 (11.6) 10.0-14.9 (11.6-17.3) 15.0-19.9 (17.4-23.1) ≥ 20.0 (23.2)
AIR QUALITY STRATEGY FOR UK (based on EPAQS)
Health Guideline Running 8 hour mean
10 (11.6) by 2003
EC Air Quality Daughter Directives
Limit value for the protection of human health
Maximum daily 8 hour mean
10 (11.6) by 01.01.05
WHO Health Guideline Health Guideline Health Guideline Health Guideline
15 minute mean 30 minute mean 1 hour mean 8 hour mean
86.2 (100) 51.7 (60) 25.9 (30) 8.6 (10)
Table 5: Benzene Guideline set by Description Criteria based on Value ppb (µg/m3) DEFRA - - - AIR QUALITY STRATEGY FOR UK (based on EPAQS)
Health Guideline Running annual mean 5 (16.2) by 2003
EC Air Quality Daughter Directives
Limit value for the protection of human health
Annual mean 1.5 (5) by 2010
WHO Guideline Unit risk / lifetime 6x10⁻⁶(µg/m3) -1
Table 6: 1,3-Butadiene* Guideline set by Description Criteria based on Value ppb (µg/m3) DEFRA - - - AIR QUALITY STRATEGY FOR UK (based on EPAQS)
Health Guideline Running annual mean 1 (2.25) by 2003
EC Air Quality Daughter Directives
- - -
WHO - - - United Nations Economic Commission for Europe
- - -
*1,3-Butadiene is a volatile organic compound (VOC). VOCs are organic compounds of carbon which are of sufficient volatility to exist as vapour in the atmosphere. VOCs include hydrocarbons, halocarbons and oxygenates. 1,3-butadiene is a hydrocarbon with chemical formula C4H6.
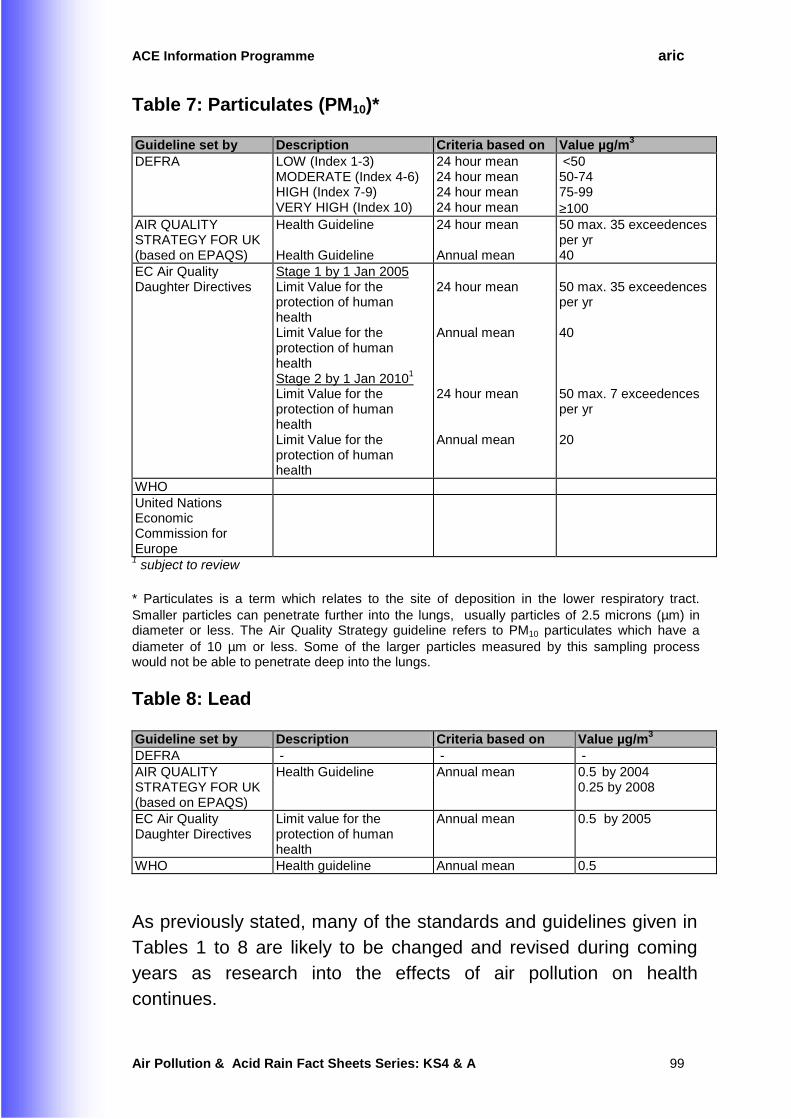
ACE Information Programme aric
Air Pollution & Acid Rain Fact Sheets Series: KS4 & A 99
Table 7: Particulates (PM10)* Guideline set by Description Criteria based on Value µg/m3 DEFRA LOW (Index 1-3)
MODERATE (Index 4-6) HIGH (Index 7-9) VERY HIGH (Index 10)
24 hour mean 24 hour mean 24 hour mean 24 hour mean
<50 50-74 75-99 ≥100
AIR QUALITY STRATEGY FOR UK (based on EPAQS)
Health Guideline Health Guideline
24 hour mean Annual mean
50 max. 35 exceedences per yr 40
EC Air Quality Daughter Directives
Stage 1 by 1 Jan 2005 Limit Value for the protection of human health Limit Value for the protection of human health Stage 2 by 1 Jan 20101 Limit Value for the protection of human health Limit Value for the protection of human health
24 hour mean Annual mean 24 hour mean Annual mean
50 max. 35 exceedences per yr 40 50 max. 7 exceedences per yr 20
WHO United Nations Economic Commission for Europe
1 subject to review
* Particulates is a term which relates to the site of deposition in the lower respiratory tract. Smaller particles can penetrate further into the lungs, usually particles of 2.5 microns (µm) in diameter or less. The Air Quality Strategy guideline refers to PM10 particulates which have a diameter of 10 µm or less. Some of the larger particles measured by this sampling process would not be able to penetrate deep into the lungs.
Table 8: Lead Guideline set by Description Criteria based on Value µg/m3 DEFRA - - - AIR QUALITY STRATEGY FOR UK (based on EPAQS)
Health Guideline Annual mean 0.5 by 2004 0.25 by 2008
EC Air Quality Daughter Directives
Limit value for the protection of human health
Annual mean 0.5 by 2005
WHO Health guideline Annual mean 0.5
As previously stated, many of the standards and guidelines given in Tables 1 to 8 are likely to be changed and revised during coming years as research into the effects of air pollution on health continues.
ACE Information Programme aric
Air Pollution & Acid Rain Fact Sheets Series: KS4 & A 100
Introduction Both the monitoring and modelling of air pollution is essential to provide a picture of the damage humans are doing to the environment, and to enable pollution problems to be discovered and dealt with. Since the introduction of the National Air Quality Strategy in 1997, local authorities are being encouraged to make assessments of local air quality (a local air quality review), through the monitoring of air pollutant emissions and atmospheric concentrations, and through the modelling of air pollution dispersion and deposition (as acid rain).
Monitoring Local Air Quality Most local authorities to some degree have undertaken air quality monitoring. This has traditionally included a smoke and sulphur dioxide "bubbler", and perhaps some roadside lead monitoring and nitrogen dioxide diffusion tube monitoring. In terms of the automatic monitoring of air quality various sites have been monitoring atmospheric concentrations of number of pollutants over many years. However, in the past 10 years there has been more extensive monitoring of air quality, both as part of the DEFRA automatic urban network and as "stand-alone" sites. Clearly an assessment of the monitoring data needs to take place in each authority to determine if any of the national standards are likely to be currently exceeded. The more inexpensive monitoring techniques, such as NO2 diffusion tubes, may be employed to locate potential pollution "hot spots". Clearly, in areas where no monitoring takes place it will be appropriate to use surrogate data in the air quality review. However, for authorities where it is expected that standards are exceeded more detailed data is required for the assessment process.
ACE Information Programme aric
Air Pollution & Acid Rain Fact Sheets Series: KS4 & A 101
Monitoring Networks Co-ordinated air quality monitoring throughout the UK has been carried out since the early 1960s, and now there are nine networks with a total of 1565 sites. The aim of all of these networks is to provide reliable and high quality measurements of air quality throughout the UK. The networks, which are automatic, utilise instruments that monitor the air continuously. Through the use of data loggers and modems the data are interrogated every hour and are used to provide information to the public via television and radio weather forecasts, CEEFAX and TELETEXT, newspapers and the Internet.
1. The Automatic Urban Monitoring Network The primary objectives of this network are to provide the public with rapid and reliable information on urban air quality, and to satisfy the statutory requirements of EC Directives on ozone, nitrogen dioxide and sulphur dioxide. There are currently 104 sites.
2. The Automatic Hydrocarbon Monitoring Network The aim of this network is to monitor 25 hydrocarbon species in urban air on a continuous basis. The compounds measured have been selected because of their photochemical oxidant formation potential. In addition, 2 known carcinogens are measured, benzene and 1,3-butadiene.
3. The Automatic Rural Monitoring Network The overall objective of this network is to provide information on photochemical pollution across the UK. There are 18 sites on this network, all of which monitor ozone, with NOx and SO2 monitored at 3 sites.
4. Nitrogen Dioxide Diffusion Tube Network In 1986 and 1991 Warren Spring Laboratory (now NETCEN) undertook diffusion tube measurements at 360 sites at existing smoke and SO2 sites throughout the country on behalf of the
ACE Information Programme aric
Air Pollution & Acid Rain Fact Sheets Series: KS4 & A 102
Government. As a result of a significant increase in concentrations in 1991 a network of 1200 sites was established in 1993. This survey is operated in conjunction with local authorities that identified one kerbside, one intermediate and two background sites in their areas.
5. Smoke and SO2 Monitoring Network This network has been in operation since the 1960s and was implemented following the Clean Air Acts. Before 1981 all sites were referred to as the 'National Survey', but since then a restructure has been carried out owing to decreasing concentrations, so that remaining sites were classified as either part of the 'Basic Urban Network' or 'EC Directive Network'. There are 165 sites in this network.
6. Multi Element and Lead Monitoring Networks Eight important trace elements (Cd, Cr, Cu, Fe, Mn, Ni, Pb and Zn) have been monitored since 1976 at five urban sites. In addition, lead is monitored under four different networks: i) Multi-element - five urban sites since 1976; ii) Lead in Petrol - 8 sites (2 rural, 3 urban and 3 kerbside) since 1983-4 (currently 6 of these remain with one addition); iii) Industrial Area - monitoring occurs at hot spot industrial areas (9 sites in 3 areas); and iv) Rural network - 4 long term trend sites in rural areas. 7. Acid Deposition Monitoring Network Precipitation composition is monitored at 32 sites throughout the country to provide an accurate measurement of pollutant deposition in rain and snow to assist in implementing a critical loads approach to environmental protection. All precipitation samples are analysed for conductivity, pH, cations (NH4+, Na+, K+, Ca2+, Mg2+) and anions (NO3-, Cl-, SO4
2- and PO43-).
8. Rural SO2 Monitoring Network A network of 38 sites is maintained with the primary aim of mapping rural SO2 concentrations, using volumetric apparatus.
ACE Information Programme aric
Air Pollution & Acid Rain Fact Sheets Series: KS4 & A 103
9. Toxic Organic Micropollutants (TOMPS) Measurements of toxic organic micropollutants (dioxins and polycyclic aromatic hydrocarbons or PAHs) are undertaken at 17 sites, 15 of which are urban sites.
Making Emissions Estimates A number of local and regional air pollutant emission inventories have been developed in the UK. These inventories are invaluable in the air quality review process. Emissions of the key pollutants are provided on a 1-km by 1-km basis. These pollution maps will enable identification of "hot spots". Less developed emissions inventories monitor point (e.g. combustion plants), line (e.g. roads and railways) and area (e.g. domestic and agricultural emissions) sources for the purposes the air quality review. Emission estimates can be calculated from production rates, vehicle flows, population figures and assigned an appropriate emission factor. The level of detail required in an emissions inventory depends upon local circumstances.
Air Quality Dispersion Modelling Dispersion modelling of air quality enables prediction of air quality in a given scenario and/or for a future year. Dispersion modelling requires specialist software and expertise, and in many circumstances, is a one off task. The Department for Environment, Food & Rural Affairs has not recommended a particular model to use for compliance with the Environment Act. However, current scientific thinking in the UK leads to the recommendation of ADMS-Urban for the modelling of local authority areas. This model will provide contour plots showing levels of pollution for both the present scenario and 2005. ADMS-Urban is the only commonly used model that enables a direct comparison with national standards.
ACE Information Programme aric
Air Pollution & Acid Rain Fact Sheets Series: KS4 & A 104
Introduction Acid rain, or acid deposition as it should be correctly termed, is one of the major environmental issues of our time. Acid rain however, is not a new problem. In the mid 19th century, a Scottish scientist, Robert Angus Smith, began to study the effects of air pollution in Manchester where he coined the term “acid rain” to describe his findings. In Smith's time, acid rain fell in both towns and cities and downwind from them but now, following Clean Air Acts, levels of smoke and sulphur dioxide have been greatly reduced. Gaseous and particulate airborne pollutants are now dispersed higher into the atmosphere via tall chimney stacks. Other sources of pollutants such as vehicle exhausts may also be transported high into the atmosphere, depending on weather conditions. Complex chemical reactions occur over time in the atmosphere including the formation of sulphuric and nitric acids, leading to the deposition of acidic precipitation. Because pollutants can be carried many hundreds of kilometres by winds, acid pollutants emitted in one country may be deposited as acid precipitation in other countries. Acid deposition has become an international problem. This problem is highlighted by the fact that emission of a particular pollutant from one country does not equal the deposition of that pollutant in the same country. Some countries emit small quantities of pollutants yet deposition can be several times greater, for example Norway, Sweden, Austria and Switzerland. Other countries such as Bulgaria, Italy and the UK emit more pollution than is deposited in their country because of prevailing wind directions. Within Europe, emissions of air pollutants vary greatly, depending upon many factors such as size of population, degree of
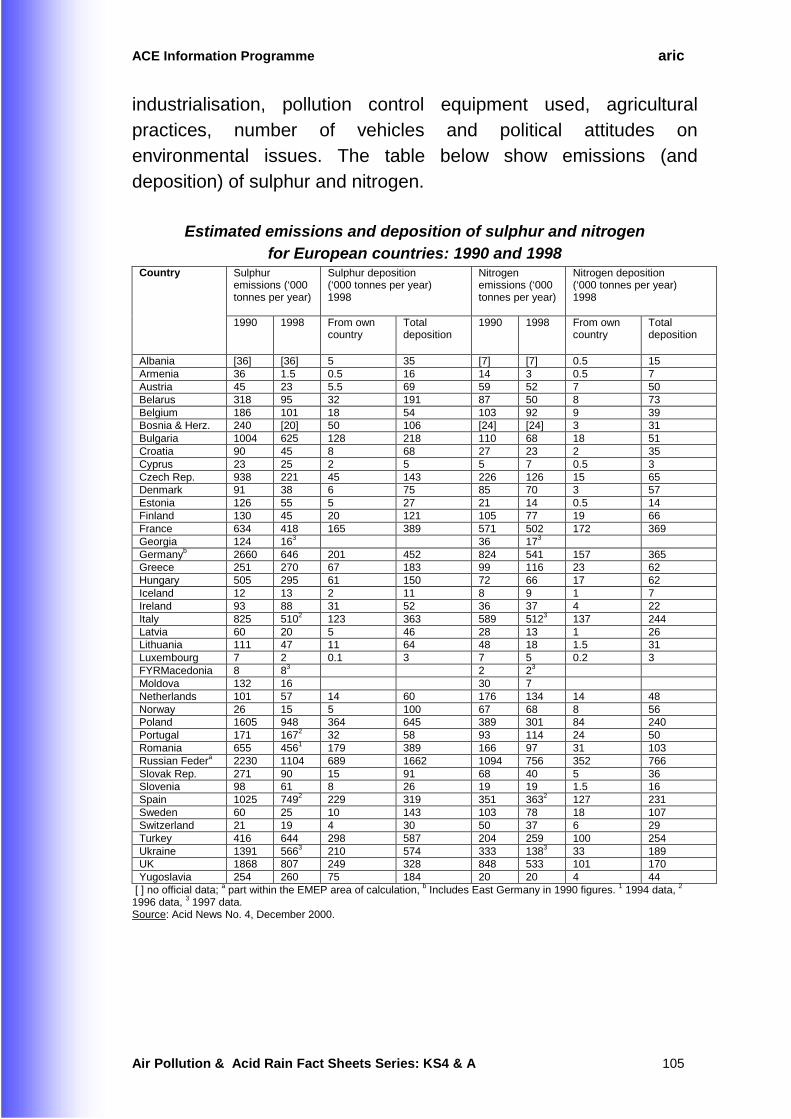
ACE Information Programme aric
Air Pollution & Acid Rain Fact Sheets Series: KS4 & A 105
industrialisation, pollution control equipment used, agricultural practices, number of vehicles and political attitudes on environmental issues. The table below show emissions (and deposition) of sulphur and nitrogen.
Estimated emissions and deposition of sulphur and nitrogen for European countries: 1990 and 1998
Sulphur emissions (‘000 tonnes per year)
Sulphur deposition (‘000 tonnes per year) 1998
Nitrogen emissions (‘000 tonnes per year)
Nitrogen deposition (‘000 tonnes per year) 1998
Country
1990 1998 From own country
Total deposition
1990 1998 From own country
Total deposition
Albania [36] [36] 5 35 [7] [7] 0.5 15 Armenia 36 1.5 0.5 16 14 3 0.5 7 Austria 45 23 5.5 69 59 52 7 50 Belarus 318 95 32 191 87 50 8 73 Belgium 186 101 18 54 103 92 9 39 Bosnia & Herz. 240 [20] 50 106 [24] [24] 3 31 Bulgaria 1004 625 128 218 110 68 18 51 Croatia 90 45 8 68 27 23 2 35 Cyprus 23 25 2 5 5 7 0.5 3 Czech Rep. 938 221 45 143 226 126 15 65 Denmark 91 38 6 75 85 70 3 57 Estonia 126 55 5 27 21 14 0.5 14 Finland 130 45 20 121 105 77 19 66 France 634 418 165 389 571 502 172 369 Georgia 124 163 36 173 Germanyb 2660 646 201 452 824 541 157 365 Greece 251 270 67 183 99 116 23 62 Hungary 505 295 61 150 72 66 17 62 Iceland 12 13 2 11 8 9 1 7 Ireland 93 88 31 52 36 37 4 22 Italy 825 5102 123 363 589 5123 137 244 Latvia 60 20 5 46 28 13 1 26 Lithuania 111 47 11 64 48 18 1.5 31 Luxembourg 7 2 0.1 3 7 5 0.2 3 FYRMacedonia 8 83 2 23 Moldova 132 16 30 7 Netherlands 101 57 14 60 176 134 14 48 Norway 26 15 5 100 67 68 8 56 Poland 1605 948 364 645 389 301 84 240 Portugal 171 1672 32 58 93 114 24 50 Romania 655 4561 179 389 166 97 31 103 Russian Federa 2230 1104 689 1662 1094 756 352 766 Slovak Rep. 271 90 15 91 68 40 5 36 Slovenia 98 61 8 26 19 19 1.5 16 Spain 1025 7492 229 319 351 3632 127 231 Sweden 60 25 10 143 103 78 18 107 Switzerland 21 19 4 30 50 37 6 29 Turkey 416 644 298 587 204 259 100 254 Ukraine 1391 5663 210 574 333 1383 33 189 UK 1868 807 249 328 848 533 101 170 Yugoslavia 254 260 75 184 20 20 4 44
[ ] no official data; a part within the EMEP area of calculation, b Includes East Germany in 1990 figures. 1 1994 data, 2
1996 data, 3 1997 data. Source: Acid News No. 4, December 2000.
ACE Information Programme aric
Air Pollution & Acid Rain Fact Sheets Series: KS4 & A 106
Reducing European Emissions
Sulphur Dioxide In the late 1970s, the United Nations Economic Commission for Europe (UNECE) set up an international convention concerning Long Range Transboundary Pollution. In 1984 and 1985 most UNECE members agreed to reduce sulphur dioxide emissions by 30% (on 1980 levels) by 1993. This was called the 30% club. All of the countries that signed the Protocol achieved this reduction, and many of those that did not sign, have met these reductions. Austria greatly exceeded their target reduction by achieving an 82% reduction, whilst the UK achieved a 35% reduction. Only two countries increased their emissions, Croatia (20%) and Greece (27%). In June 1994, a number of European countries signed the second Protocol for sulphur. Most of the western European countries have agreed to reduce sulphur emissions by between 70 and 80% by the year 2000 (against 1980 levels) whilst eastern European countries generally have a lower target of between 40 and 50% (against 1980 levels). Overall, emissions of sulphur dioxide in Europe are estimated to have fallen by 25-30% between 1980 and 1990 (compared with 75% in the UK). If the signatories of the 1994 Protocol achieve their target reductions, European sulphur dioxide emissions are estimated to fall 47% by 2005 and 51% by 2010 (on 1980 levels).
Nitrogen Dioxide The Sofia Protocol for reducing nitrogen oxide emissions was set up in 1988. This required all countries that signed the Protocol to stabilise emissions of NOx (against 1987 levels) but some countries committed themselves to 30% reductions by 1998 (against levels of any year between 1980 and 1986). However, many of these
ACE Information Programme aric
Air Pollution & Acid Rain Fact Sheets Series: KS4 & A 107
countries are unlikely to meet these targets; several countries such as Spain and Italy have increased their NOx emissions between 1987 and 1993 by 41% and 8% respectively.
Targets for Combustion Plants In 1988 a Directive was introduced for EC countries which requires Large Combustion Plants over 50MW in size to reduce emissions of SO2 and NOx by varying percentages by 1998 and 2003 (against 1980 levels). For the UK, reductions of 60% SO2 by 2003 and 30% NOx by 1998 have been set. The UK is well on course to exceed both targets through new gas-fired power stations (which produce small quantities of SO2 and NOx) replacing coal fired power stations, and flue gas desulphurisation equipment fitted to Drax and Ratcliffe-on-Soar power stations.
Vehicle Emissions In addition, all cars sold within the European union from 1993 onwards have to be fitted with a catalytic converter to help reduce emissions of vehicular pollutants. Many non-EU countries also require catalytic converters to be fitted to vehicles sold within their countries.
Gothenburg Protocol The most recent UNECE Convention on Long Range Transboundary Air Pollution protocol was signed by 27 countries in December 1999. The Gothenburg Protocol, designed to Abate Acidification, Eutrophication and Ground-level Ozone aims to cut emissions of four pollutants: sulphur dioxide (SO2), nitrogen oxides (NOx), volatile organic compounds (VOCs), and ammonia (NH3), by setting country-by-country emission ceilings to be achieved by the year 2010. The table below lists the countries that have agreed to sign the 1999 Protocol and the expected emissions reductions by 2010.
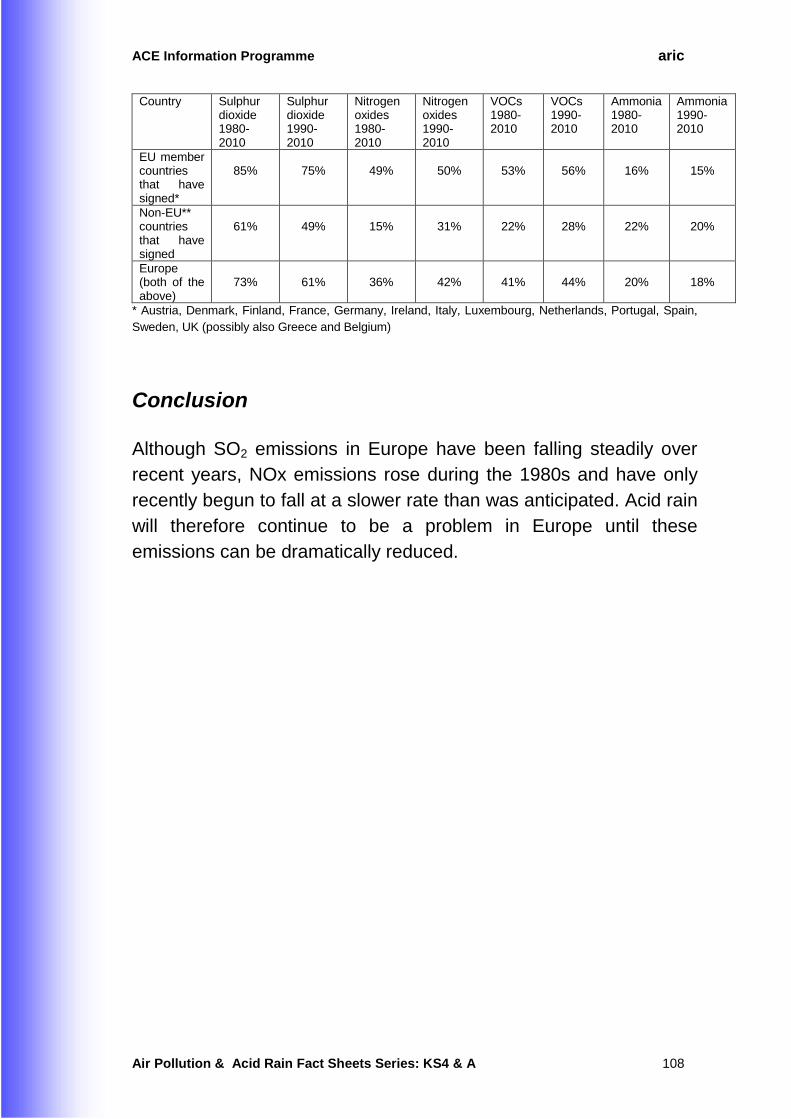
ACE Information Programme aric
Air Pollution & Acid Rain Fact Sheets Series: KS4 & A 108
Country Sulphur dioxide 1980-2010
Sulphur dioxide 1990-2010
Nitrogen oxides 1980-2010
Nitrogen oxides 1990-2010
VOCs 1980-2010
VOCs 1990-2010
Ammonia 1980-2010
Ammonia 1990-2010
EU member countries that have signed*
85%
75%
49%
50%
53%
56%
16%
15%
Non-EU** countries that have signed
61%
49%
15%
31%
22%
28%
22%
20%
Europe (both of the above)
73%
61%
36%
42%
41%
44%
20%
18%
* Austria, Denmark, Finland, France, Germany, Ireland, Italy, Luxembourg, Netherlands, Portugal, Spain, Sweden, UK (possibly also Greece and Belgium)
Conclusion Although SO2 emissions in Europe have been falling steadily over recent years, NOx emissions rose during the 1980s and have only recently begun to fall at a slower rate than was anticipated. Acid rain will therefore continue to be a problem in Europe until these emissions can be dramatically reduced.
ACE Information Programme aric
Air Pollution & Acid Rain Fact Sheets Series: KS4 & A 109
Introduction The UK Government's strategic policies for tackling air quality were laid out in the policy document Air Quality: Meeting the Challenge, published by the then Department of the Environment (DoE) in January 1995. The Environment Act 1995 Part IV, Air Quality, provided the legal framework for development of the Government's National Air Quality Strategy. As part of the Act the Secretary of State published a National Air Quality Strategy in 1997 (updated in 2000). Part IV of the Environment Act 1995 requires local authorities (any unitary or district authority) to review air quality and to assess whether the air quality standards and objectives are being achieved. A local authority, for any area where the air quality standards are not being met, will then be obliged to issue an order designating an air quality management area. The major components of air quality management are generally considered to be: emissions inventorying, ambient air quality monitoring, standards and guidelines, compliance assessment, simulation modelling, public information, alert procedures, land use planning and transport integration, assessment and management procedures. Many of these activities in the UK to date have been directed at the short term improvement in air quality rather than seeking to develop structures capable of ensuring progressive long term improvements in air quality. Central Government has recognised the need to provide an integrated framework for the identification and subsequent management of areas in which air quality may be a problem. Local authorities are to bear the primary responsibility for this, with the co-operation of bodies such as the Environment Agency.

ACE Information Programme aric
Air Pollution & Acid Rain Fact Sheets Series: KS4 & A 110
The Aim of an Air Quality Strategy An air quality strategy will have two component plans: an air quality plan, which will provide a reaction to existing air quality problems, and an air quality strategic plan which will provide longer term solutions and will aim to plan future air quality. The two will have different time scales but will operate in tandem. The goals and success of the local strategy will be judged using the indicators of key pollutant emissions and concentrations and their compliance with air quality standards and guidelines.
Identifying Participating Agencies Developing an air quality management strategy will require the involvement of a range of agencies within and outside the Local Authority, as well as the Department for Environment, Foor & Rural Affairs (DEFRA) and the Department of Health. National and regional pollution control authorities and agencies such as the Environment Agency must also be engaged in the process. Meteorological forecasts are an important component of air quality management; hence the Meteorological Office will be an important agency. The role of these agencies will be to assist, through consultation, the aims and objectives of the strategy, and secondly to participate in the structural adjustments needed in form and functioning as the air quality plans are introduced.
Goals and Objectives The success of any strategy depends on the identification of clear policy goals. In relation to air quality, these goals will mainly develop from the requirement to attain or maintain air quality standards (AQS). The objectives of the strategy must be known to all the relevant local, regional and national agencies. This will help avoid the problems of conflicting policy development.
ACE Information Programme aric
Air Pollution & Acid Rain Fact Sheets Series: KS4 & A 111
Emissions An air quality management strategy will need to consider the range of emission sources at the local, regional and national level, which contribute to the local air quality. A suitably detailed emissions inventory will enable identification of particular problem areas for which specific policies may be developed.
Monitoring An important aspect of an air quality management approach which uses air quality standards as a measure of acceptable air quality is the availability of monitored concentration data with which to assess current air quality and the impacts of policy implementation.
Standards and Guidelines The minimum standards will be those set by the EC and DEFRA. However, local decision makers may select additional more stringent standards to work towards. The legislative position is dynamic and standards at national and EC level are being re-evaluated, new recommendations are being made and standards for new pollutant species are being introduced.
Simulation Modelling Simulation modelling can be used to assess current and potential future air quality in order to enable informed policy decisions to be made. Current emissions and monitoring data can be used to validate an emissions and dispersion model, which can then be used to forecast future changes based upon a range of ‘what if’ scenarios. The model, once developed, is the key to assessing future local air quality management needs. It has relatively high capital costs, requires technical staff to set up and run the model and it will need to be updated regularly.
ACE Information Programme aric
Air Pollution & Acid Rain Fact Sheets Series: KS4 & A 112
Public Information and Its Dissemination The public will also have an influential role within an air quality strategy, as the management activities of the strategy can impact upon the public by changing their activities and expectations. Consequently, the public must be involved in goal-setting, perhaps through undertaking a public attitude survey in order to identify expectations and needs. They should also be informed in accessible ways of the development of the strategy and its success in improving air quality. Clear information is needed about how the public can complain about air quality. In this way, public information will help in allowing the public to become involved in identifying problems and implementing solutions.
Air Quality Alert A discrete component of an air quality management strategy must be the establishment of a set of procedures to deal with the occasional acute occurrence of very poor air quality. It is therefore necessary for the various agencies involved to decide and agree upon a number of threshold concentrations at which an alert system would be triggered and the nature and priority of the procedures to be carried out in response to it.
Planning and Air Quality Management The air quality strategy must be an agreed procedure by which air quality goals are progressively achieved across a specified time period. The period for an air quality strategic plan is, by necessity, long-term. The long time scale means that the land use and transport plans for a local authority can be integrated with the air quality management strategy, and the projected outcomes of the land use and transport plans tested within its framework. The air quality strategy thus becomes a means for integrating and testing alternatives within the Development Plan and Transport Planning and Policy (TPP) of local authorities, and for reconciling highway
ACE Information Programme aric
Air Pollution & Acid Rain Fact Sheets Series: KS4 & A 113
policies, car parking policies, public transport policies, shopping policies, cycling policies, pedestrian policies and industrial development policies with air quality goals.
Conclusion The success of the strategy will be judged according to its success in reducing emissions of a range of air pollutants against specified local targets over an agreed time scale. It is recommended that a variety of indicators are also used which express emissions on an annual basis according to a range of other socio-economic variables.
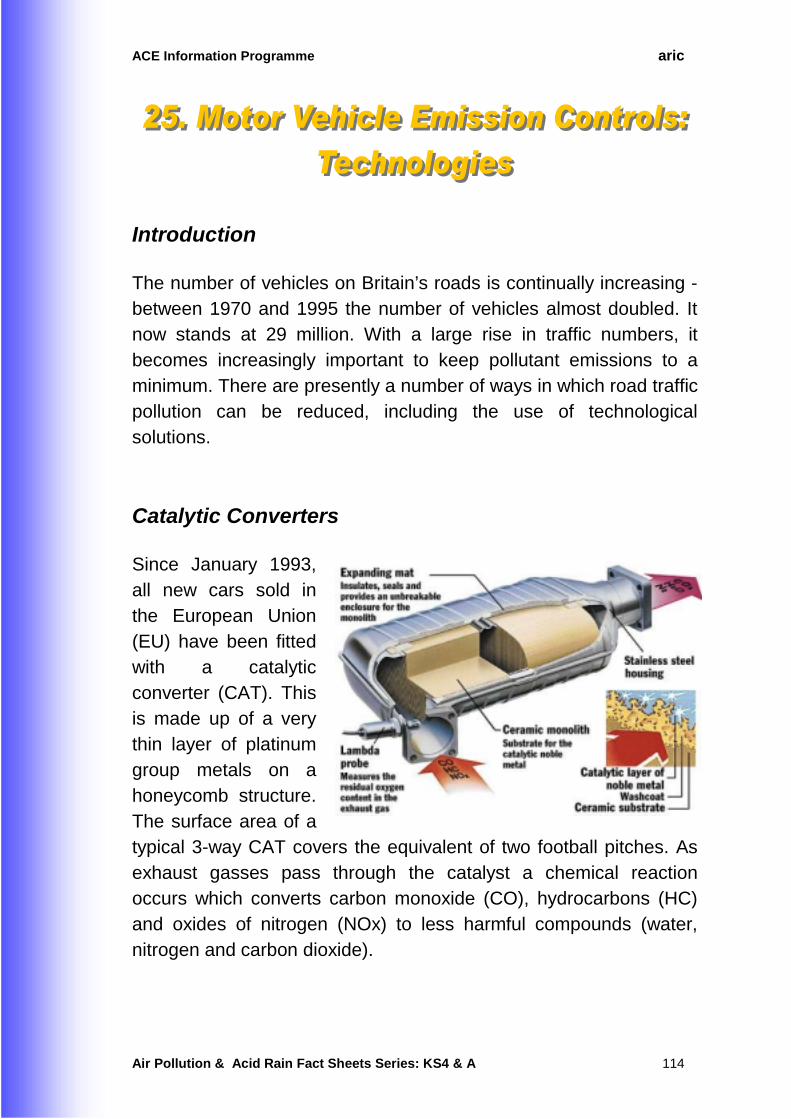
ACE Information Programme aric
Air Pollution & Acid Rain Fact Sheets Series: KS4 & A 114
Introduction The number of vehicles on Britain’s roads is continually increasing - between 1970 and 1995 the number of vehicles almost doubled. It now stands at 29 million. With a large rise in traffic numbers, it becomes increasingly important to keep pollutant emissions to a minimum. There are presently a number of ways in which road traffic pollution can be reduced, including the use of technological solutions.
Catalytic Converters Since January 1993, all new cars sold in the European Union (EU) have been fitted with a catalytic converter (CAT). This is made up of a very thin layer of platinum group metals on a honeycomb structure. The surface area of a typical 3-way CAT covers the equivalent of two football pitches. As exhaust gasses pass through the catalyst a chemical reaction occurs which converts carbon monoxide (CO), hydrocarbons (HC) and oxides of nitrogen (NOx) to less harmful compounds (water, nitrogen and carbon dioxide).
ACE Information Programme aric
Air Pollution & Acid Rain Fact Sheets Series: KS4 & A 115
To work most effectively, a catalytic converter needs to reach an optimum temperature. It may not reach this in a short journey. Devises to pre-warm the catalyst are being developed which improve the overall performance of catalytic converters. The use of catalytic converters leads to a dramatic reduction in the emissions of CO, HC and NOx. However, they also result in an increase in CO2 emissions, which do not cause a problem for urban air quality, but may contribute to global warming. The efficiency of a CAT can be as high as 90%.
Oxidation Catalysts Oxidation catalysts may be fitted to either petrol or diesel cars. The catalyst oxidises the pollutants formed by incomplete combustion to carbon dioxide and water, and is effective for hydrocarbons, aldehydes and carbon monoxide. However, they do not reduce NOx emissions.
Carbon Canisters Carbon canisters are being fitted to petrol tanks to reduce evaporative emissions of petrol (petroleum). Vapour rises into the carbon canister, which then returns the petrol to the tank, hence avoiding a loss due to evaporation.
Lean Burn Engines Lean burn engines are more fuel-efficient than other engines and produce less NOx and CO, but they do emit higher levels of hydrocarbons. At the present time they are still under development and have not yet been able to meet EU emission standards, especially at high speeds.
ACE Information Programme aric
Air Pollution & Acid Rain Fact Sheets Series: KS4 & A 116
Exhaust Gas Recirculation This involves returning exhaust air to the fuel inlet, which results in a reduction in peak engine temperatures and emissions of NOx gasses from petrol vehicles. Levels of CO and HC are also reduced.
Cleaner Cars Smaller, lighter cars use less fuel and hence produce less pollution. Technological development using lighter materials for construction may therefore reduce emissions.
Electric Transport The above technologies all provide a reduction in emissions from vehicles. Electric transport is an alternative development that could lead to a large reduction in pollution at ground level, if it became more wide spread. Electric transport produces no emissions at the point of use, although pollution is emitted during the production of electricity. The amount of pollution created is lower than that from individual vehicles, and the emissions occur away from city centres where the public live and work. Electric vehicles also produce less noise pollution than diesel and petrol vehicles. The main drawback for electric vehicles is the need to recharge batteries. The maximum range of these vehicles is currently around 50 - 100 miles. However, they can reach maximum speeds of 60 - 90 miles per hour and have good acceleration. They have lower fuel and maintenance costs than petrol and diesel but involve a higher capital investment.
ACE Information Programme aric
Air Pollution & Acid Rain Fact Sheets Series: KS4 & A 117
Conclusion Whilst technical fixes, such as those outlined above, may provide cleaner air for the next 10 - 15 years, they do not represent a long term solution to transport related urban air pollution. They need to be combined with management schemes to reduce traffic in city centres, education to encourage the public to use their cars less, and the further development of alternative fuels that are not harmful to the environment.
ACE Information Programme aric
Air Pollution & Acid Rain Fact Sheets Series: KS4 & A 118
Introduction In recent years concern about exhaust emissions from motor vehicles has been increasing. To combat this, the motor industry has been promoting the diesel car as cleaner than petrol cars, due to their greater fuel economy and reduced maintenance requirements. However, diesel cars have very different emission characteristics, and an increase in diesel cars at the expense of petrol cars could have important implications on urban air quality, smog formation, global warming and other environmental issues. Emissions of lead are falling due to the banning of leaded fuel in the UK and many other countries. Recently there has been much debate about which fuel, diesel or petrol, is the cleanest in terms of exhaust emissions. Unfortunately there is no clear answer due to the lack of measurements of emissions from both types of fuel, although data from track tests and dynamometers have shown certain trends.
Emissions from Petrol Vehicles Emissions from petrol cars have been dramatically reduced by the introduction of catalytic converters, which oxidise pollutants such as CO to less harmful gases such as CO2. When compared to petrol cars without catalysts, catalyst cars have much lower CO, HC and NOx emissions, at the expense of CO2 emissions, which increase due to the oxidation of carbon monoxide to CO2. As a consequence of this, a catalyst car will also use slightly more fuel and become less efficient. However, despite these improvements, petrol cars with catalysts still produce more CO and HC than diesel cars, although exhaust emissions of NOx and particulates are much lower than
ACE Information Programme aric
Air Pollution & Acid Rain Fact Sheets Series: KS4 & A 119
diesel cars. In fact particulate emissions from petrol cars are so low that they are not routinely measured.
Emissions from Diesel Vehicles Diesel fuel contains more energy per litre than petrol and coupled with the fact that diesel engines are more efficient than petrol engines, diesel cars are more efficient to run. Diesel fuel contains no lead and emissions of the regulated pollutants (carbon monoxide, hydrocarbons and nitrogen oxides) are lower than those from petrol cars without a catalyst. However, when compared to petrol cars with a catalyst, diesels have higher emissions of NOx and much higher emissions of particulate matter.
Cold Start Emissions Emissions from cars are greatest when an engine is cold. On a cold day a petrol car may take up to 10km to warm up and operate at maximum efficiency; a diesel car may only take 5km. Consequently, diesel cars produce less unburned fuel during a cold start, which will result in lower emissions of carbon monoxide and hydrocarbons. Diesel cars could make a significant impact on air quality in urban areas where most cold starts occur, especially when it is considered that a catalyst on a petrol car would take several minutes to reach its operating temperature. Overall, diesel cars emit less hydrocarbons, carbon monoxide and lead pollution than petrol cars, but produce more noxious gases and significantly more particulates.
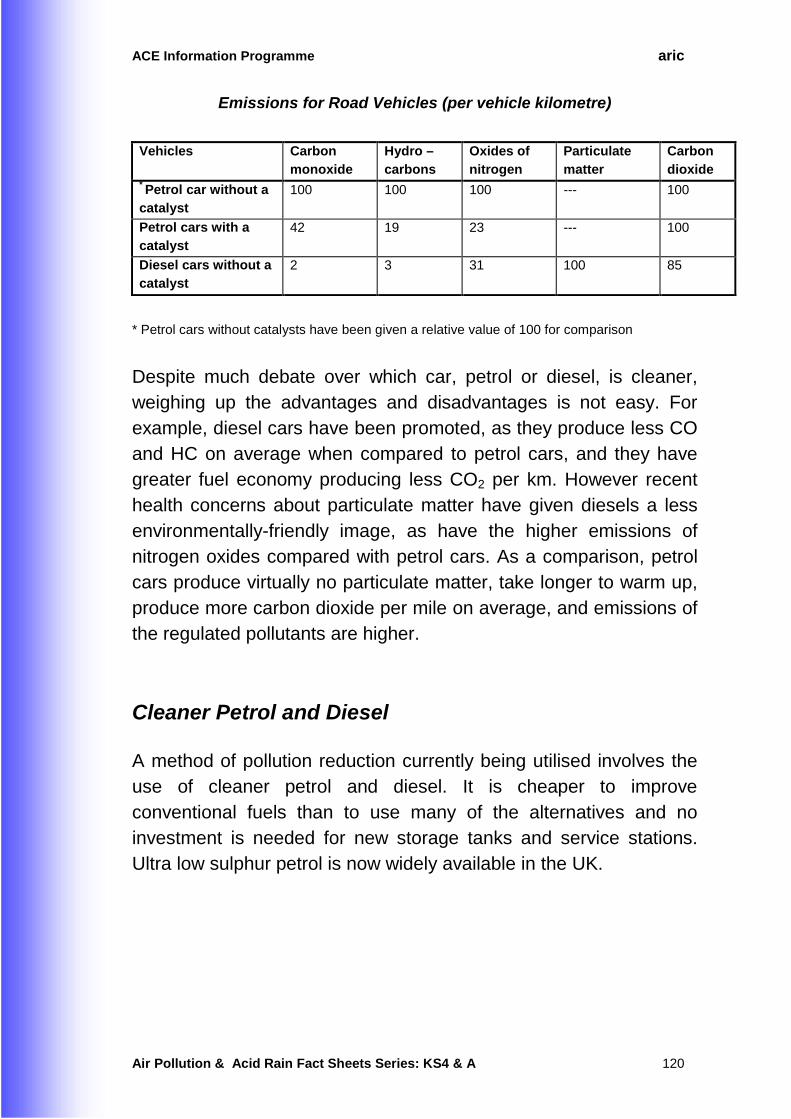
ACE Information Programme aric
Air Pollution & Acid Rain Fact Sheets Series: KS4 & A 120
Emissions for Road Vehicles (per vehicle kilometre)
Vehicles Carbon
monoxide Hydro – carbons
Oxides of nitrogen
Particulate matter
Carbon dioxide
* Petrol car without a catalyst
100 100 100 --- 100
Petrol cars with a catalyst
42 19 23 --- 100
Diesel cars without a catalyst
2 3 31 100 85
* Petrol cars without catalysts have been given a relative value of 100 for comparison
Despite much debate over which car, petrol or diesel, is cleaner, weighing up the advantages and disadvantages is not easy. For example, diesel cars have been promoted, as they produce less CO and HC on average when compared to petrol cars, and they have greater fuel economy producing less CO2 per km. However recent health concerns about particulate matter have given diesels a less environmentally-friendly image, as have the higher emissions of nitrogen oxides compared with petrol cars. As a comparison, petrol cars produce virtually no particulate matter, take longer to warm up, produce more carbon dioxide per mile on average, and emissions of the regulated pollutants are higher.
Cleaner Petrol and Diesel A method of pollution reduction currently being utilised involves the use of cleaner petrol and diesel. It is cheaper to improve conventional fuels than to use many of the alternatives and no investment is needed for new storage tanks and service stations. Ultra low sulphur petrol is now widely available in the UK.
ACE Information Programme aric
Air Pollution & Acid Rain Fact Sheets Series: KS4 & A 121
Alternative Fuels To replace pollutant fuels (petrol and diesel), alternative fuels are currently being developed. Those put forward as alternatives to petrol and conventional diesel include: compressed natural gas (CNG); liquefied petroleum gas (LPG); city diesel; hydrogen; alcohol fuels; and battery operated vehicles.
LPG & CNG On a cycle representing congested urban traffic, both LPG and CNG outperform petrol powered vehicles on emissions of carbon monoxide (CO). Indeed, emissions of CO from CNG powered vehicles are of the same order as those emitted by diesel vehicles. However, emissions of total hydrocarbons (THC) from CNG vehicles are relatively high because of methane, the major component of natural gas. Although methane is a small contributor to the formation of low level ozone it is a major factor in global warming. Emissions of NOx and particulates from both LPG and CNG powered vehicles are significantly lower than those from diesel vehicles. Moreover, emissions of NOx from CNG vehicles are half those from equivalent petrol engined vehicles. A recent study using a small delivery van fitted with a three way catalyst and capable of switching between CNG and petrol, showed that on a modified EU emission test cycle, emissions of CO, non-methane hydrocarbons (NMHC) and NOx were 76%, 88% and 83% respectively lower with CNG than with petrol. Using data from other studies CNG also compares favourably with emissions from equivalent sized diesel-engined vehicles.
City Diesel City diesel is a petroleum based lower emission diesel developed in Sweden but now available in many European Countries including the UK. Exhaust emissions from vehicles fuelled with city diesel
ACE Information Programme aric
Air Pollution & Acid Rain Fact Sheets Series: KS4 & A 122
compare favourably with exhaust emissions from equivalent vehicles fuelled with conventional diesel. The main benefit of city diesel is that its combustion reduces particulate emissions by 34 - 84% depending on engine type, duty cycle, test basis and type of particulate measured. An additional benefit of city diesel is that it is a low sulphur fuel, which is necessary for the optimum running of oxidation catalytic converters.
Conclusion To produce a cleaner environment for all to live and work in, the development of alternative, cleaner fuels is essential. To encourage the use of the fuels, competitive prices combined with good marketing techniques are required.
ACE Information Programme aric
Air Pollution & Acid Rain Fact Sheets Series: KS4 & A 123
Introduction Sulphur dioxide (SO2) is a colourless gas. It reacts on the surface of a variety of airborne solid particles, it is soluble in water and can be oxidised within airborne water droplets to form sulphuric acid (H2SO4), which falls as acid precipitation or "acid rain". SO2 emissions arise from the oxidation, during combustion, of the sulphur contained within fossil fuels. Fossil fuels, including coal, oil and to a lesser extent gas, contain sulphur in both organic and inorganic form.
Removal of Sulphur Dioxide A reduction in the atmospheric emissions of SO2 produced by fossil fuel combustion processes can be achieved at one of three stages, as follows. 1. Reducing the sulphur content of the fuel before combustion: Emissions of SO2 are proportional to the sulphur content of the fuel, although with regard to coal a proportion, usually less than 10%, is retained in the ash. Therefore, one of the simplest ways to reduce the amount of SO2 released from the combustion process can be achieved by switching to a fuel that has a lower sulphur content, i.e. burning low sulphur coal or gas instead of high sulphur coal. The coal sulphur content can vary from below 0.5% to over 10% by weight; for the majority of coals currently in use within the UK this sulphur content is in the range of 1 - 3%.
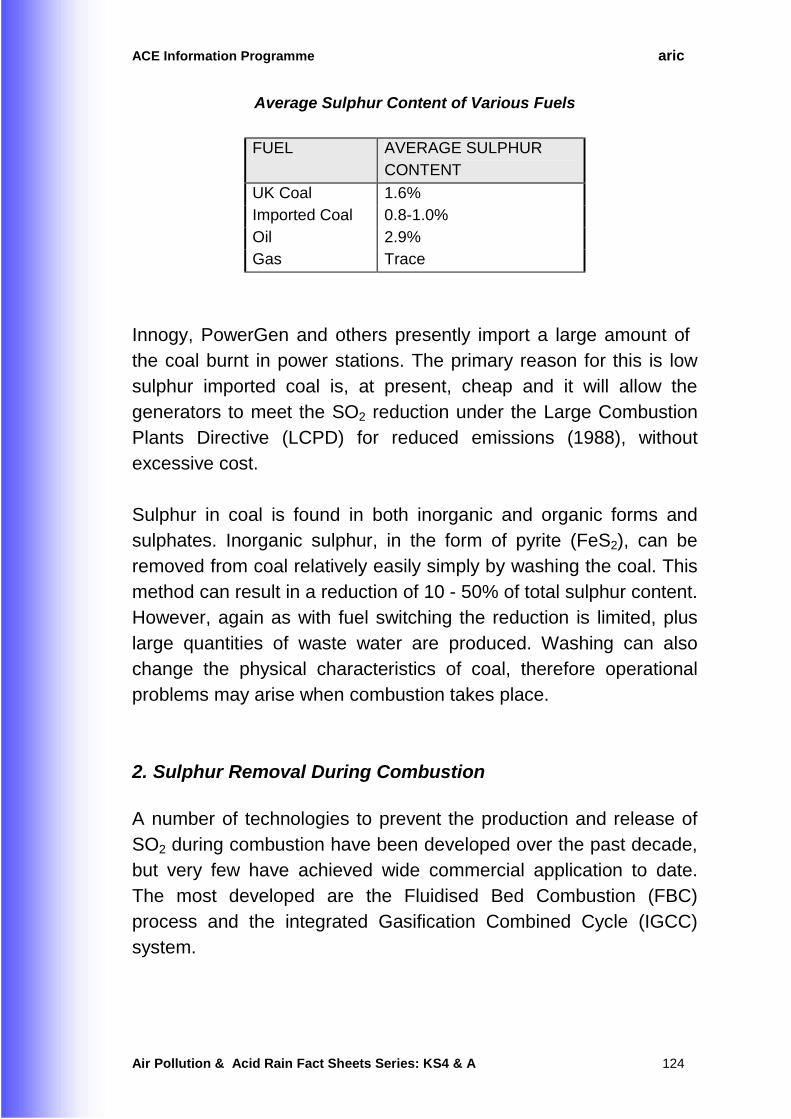
ACE Information Programme aric
Air Pollution & Acid Rain Fact Sheets Series: KS4 & A 124
Average Sulphur Content of Various Fuels
FUEL AVERAGE SULPHUR CONTENT
UK Coal 1.6% Imported Coal 0.8-1.0% Oil 2.9% Gas Trace
Innogy, PowerGen and others presently import a large amount of the coal burnt in power stations. The primary reason for this is low sulphur imported coal is, at present, cheap and it will allow the generators to meet the SO2 reduction under the Large Combustion Plants Directive (LCPD) for reduced emissions (1988), without excessive cost. Sulphur in coal is found in both inorganic and organic forms and sulphates. Inorganic sulphur, in the form of pyrite (FeS2), can be removed from coal relatively easily simply by washing the coal. This method can result in a reduction of 10 - 50% of total sulphur content. However, again as with fuel switching the reduction is limited, plus large quantities of waste water are produced. Washing can also change the physical characteristics of coal, therefore operational problems may arise when combustion takes place.
2. Sulphur Removal During Combustion A number of technologies to prevent the production and release of SO2 during combustion have been developed over the past decade, but very few have achieved wide commercial application to date. The most developed are the Fluidised Bed Combustion (FBC) process and the integrated Gasification Combined Cycle (IGCC) system.
ACE Information Programme aric
Air Pollution & Acid Rain Fact Sheets Series: KS4 & A 125
Fluidised Bed Combustion This process involves the combustion of coal in a bed of inert material such as sand, with air being blown up from beneath the bed at high velocities. As velocity increases individual particles begin to be forced upwards until they reach a point at which they remain suspended in the air stream. The bed in this state behaves like a liquid and can be described as fluidised. Tubes containing water are immersed in the bed to absorb the generated heat (this water is converted to steam which is used to drive the steam turbine and thus produces electricity). The fluidised movement within the combustion chamber results in a greater heat transfer efficiency to the water filled tubes and therefore operating temperatures are lower than in a conventional system. SO2 emissions can be controlled in this system by adding a sorbent (a substance used to absorb any SO2 present, for example lime or limestone) to the bed of inert material. The limestone effectively absorbs the SO2 as it is released from the coal and retains it within the ash, which is removed regularly. The low combustion temperatures allow efficient combustion to take place without causing the ash to soften, thereby allowing easy removal of the ash containing the absorbed SO2. The FBC can achieve in the region of 80 - 90% SO2 removal. Two main disadvantages of this system are firstly the large quantities of sorbent required (approximately twice that of an FGD system (see later) to achieve the same SO2 removal), and secondly the large quantities of strongly alkaline waste produced, which is generally disposed of in landfill.
Integrated Gasification Combined Cycle System This process does not require the addition of a sorbent. Instead the coal is gasified under pressure with a mixture of air and steam. The resulting gas is expanded through a gas turbine to produce electricity. The waste heat from the gas turbine is then passed through a second steam turbine, the second stage of the combined
ACE Information Programme aric
Air Pollution & Acid Rain Fact Sheets Series: KS4 & A 126
cycle process, again producing electricity. As the coal is converted to gas the sulphur present is converted into hydrogen sulphide which can be easily removed and sold for use within the chemical industry. Gas cleaning can be integrated into the gas production process, and emissions can be reduced by more than 99%. Also very little waste is produced. This system has not been adopted for use in the UK because the success of the technology has not been sufficiently proven.
3. Removal of Sulphur after Combustion - FGD Emissions of SO2 generated during the combustion of fossil fuels can be reduced by treating the flue gases before they are emitted into the atmosphere via the stack; this is termed Flue Gas Desulphurisation (FGD). Flue gas desulphurisation systems can be classified as either Regenerable or Non-regenerable.
Limestone/Gypsum System This process is the most globally used FGD system. This system is relatively simple: crushed limestone / lime is mixed with water to form a slurry which is then sprayed into the sulphur containing flue gases. The sorbent reacts with the SO2 to form an aqueous slurry of calcium sulphite. Compressed air blown into the slurry oxidises the calcium sulphite to produce calcium sulphate. This product is then treated to remove excess water and either sold to the building trade or disposed of as landfill. SO2 removal can be in the region of 90%
Spray Dry System Within the spray dry system, a slurry of alkali sorbent, usually slaked lime, is injected into the flue gases in a fine spray. The heat from the flue gases causes the water to evaporate, cooling the gases as it does so. The SO2 present reacts with the drying sorbent to form a solid reaction product, with no waste water.
ACE Information Programme aric
Air Pollution & Acid Rain Fact Sheets Series: KS4 & A 127
Seawater Scrubbing Process The seawater scrubbing process exploits the natural alkalinity of seawater to absorb acidic gases. Flue gases are contained in an absorption tower where they flow counter current to seawater. The heat of the flue gas causes the seawater to be heated and the gases cooled. During this process SO2 is absorbed by the seawater, before passing to a water treatment plant where further seawater is added to increase the pH. Air is supplied to oxidise the absorbed SO2 to sulphate and to saturate the seawater with oxygen. The seawater is then discharged to the sea. This system is a simple and inherently reliable one with low capital and operational costs, which can remove up to 99% of SO2, with no disposal of waste to land. However, heavy metals and chlorides are present in the water released to the sea.
Wellman-Lord Process A third FGD process is the Wellman-Lord process, which can be divided into two main stages. 1) Absorption: the hot flue gases are passed through a pre-scrubber where ash, hydrogen chloride, hydrogen fluoride and SO3 are removed. The gases are then cooled and fed into the absorption tower. A saturated solution of sodium sulphite is then sprayed into the top of the absorber onto the flue gases; the sodium sulphite reacts with the SO2 forming sodium bisulphite. The concentrated bisulphate solution is collected and passed to an evaporation system for regeneration. 2) Regeneration: the sodium bisulphite is broken down, using steam, to release the sodium sulphite, which is recycled back to the flue gases. The remaining product - the released SO2 - is converted to elemental sulphur, sulphuric acid or liquid SO2. This system offers a number of advantages over alternative systems, the main one being that the sorbent is regenerated during the combustion process and is continuously recycled.
ACE Information Programme aric
Air Pollution & Acid Rain Fact Sheets Series: KS4 & A 128
Summary There are various methods for reducing the atmospheric SO2 emissions from power generation. Each method has both advantages and limitations related to cost, removal efficiency, operational experience and waste products produced. Therefore the choice of control technology should be based on the criteria required for each individual combustion plant.
ACE Information Programme aric
Air Pollution & Acid Rain Fact Sheets Series: KS4 & A 129
Introduction Nitrogen Oxide (NOX) is a collective term used to refer to species of oxides of nitrogen, such as: nitric oxide (NO) and nitrogen dioxide (NO2). Nitrogen dioxide is a reddish-brown gas. It is a strong oxidant and soluble in water and can be oxidised within the atmosphere to form nitric acid (HNO3), which along with sulphuric acid (H2SO4) falls as acid precipitation or “acid rain”. Nitrogen oxides are formed at two stages during combustion: 1. The reaction of oxygen with nitrogen compounds in the fuel - this
is termed Fuel NOX; 2. The reaction of nitrogen with oxygen in the combustion air - this is
termed Thermal NOX; The relative contribution of fuel and thermal NOX depends on the type of fuel being used and the operating conditions. A reduction in the atmospheric emissions of NOX produced by fossil fuel combustion processes can be achieved at one of two stages: 1. Preventing the production and release of nitrogen oxides during
combustion; 2. Removal of nitrogen oxides after combustion.
Removal of Nitrogen Oxides Unlike sulphur, it is not possible to reduce the nitrogen content of the fuel by physical cleaning as it is combined within the organic matter of the fuel, and at present there are no commercially available
ACE Information Programme aric
Air Pollution & Acid Rain Fact Sheets Series: KS4 & A 130
methods to reduce organic nitrogen. Fuel switching is also not effective as this will only reduce the fuel NOX contribution and not the thermal NOX. 1. Nitrogen Oxide Removal During Combustion Low NOX burners ensure that initial fuel combustion occurs within fuel rich conditions, that is with low oxygen concentrations, such that any gaseous nitrogen produced is reduced to N2. Once initial combustion has taken place, further air is added to the combustion chamber to ensure complete combustion of the fuel. This greatly reduces the opportunities for NOX production. Advanced low NOX burners can reduce NOX concentration by up to 30%. Low NOX burners can be installed on either new or existing combustion plants, and as such have been retrofitted to a number of UK power stations. They have also been incorporated into the design of many of the new gas-fired power stations that are under construction or operational.
Staged Combustion The combustion modifications required for staged combustion involves introducing air and fuel at different levels within the furnace. In general a furnace contains a number of burners with similar fuel / air ratios. Staged combustion involves altering the fuel / air ratios of individual burners whilst maintaining an overall ratio. For example, by allowing less air into the hottest part of the flame at the bottom of the furnace, less thermal NOX is formed. Further air admitted to the coolest part of the flame at the top of the furnace allows complete combustion of the fuel, whilst maintaining an overall ratio of fuel / air.
Fluidised Bed Combustion (FBC) Fluidised bed combustion involves the combustion of coal in a bed of inert material, commonly sand, with air being blown up from
ACE Information Programme aric
Air Pollution & Acid Rain Fact Sheets Series: KS4 & A 131
beneath the bed at high velocities. As velocity increases individual particles are forced upwards and become suspended in the air stream. The bed in this state behaves like a liquid and can be described as fluidised. Tubes containing water are immersed in the bed to absorb the generated heat (this water is converted to steam which is used to drive the steam turbine and thus produces electricity). The fluidised movement within the combustion chamber results in a greater heat transfer efficiency to the water filled tubes, and therefore operating temperatures are lower than in a conventional system. The low operational temperatures in the region of 750 - 950oC prevent the formation of thermal NOX. Furthermore, the FBC system can achieve in the region of 80 - 90% SO2 removal. This system can also burn coals of low or variable quality which are relatively cheap, with combustion and emission control carried out in a single unit. Consequently, the flue gases do not have to be removed from the boiler for treatment. The FBC system can not easily be fitted to existing plant and therefore will only be suitable for new generation plant.
2. Nitrogen Oxide Removal After Combustion Emissions of NOX generated during the combustion process can be reduced, as with SO2, by treating the flue gases. There are a number of systems available, and a brief description of the following systems will be given.
• = Selective Catalytic Reduction (SCR)
• = Selective Non-Catalytic Reduction (SNCR)
• = Activated Carbon Process
Selective Catalytic Reduction (SCR) Within the SCR, ammonia is injected into the flue gas. The nitrogen oxides present in the flue gases react with the ammonia and are converted to nitrogen and water. This reaction takes place in the
ACE Information Programme aric
Air Pollution & Acid Rain Fact Sheets Series: KS4 & A 132
presence of the catalyst, which is usually vanadium or tungsten oxide. The catalysis allows the reaction to take place at low temperatures between 300 - 400oC. This process is suitable for fitting to existing plant and new build applications, and can achieve a NOX reduction of up to 80 - 90%, with minimal waste production. The main disadvantages with this system are the high costs involved; the cost of the catalyst can amount to between 40 - 60% of operating costs, and it is necessary to replace the catalyst every 2 - 3 years. This system is not operational within the UK, although it is being used extensively in Japan.
Selective Non-Catalytic Reduction (SNCR) Denitrification of the flue gas is achieved by a reaction with ammonia as with the SCR, however, within this system there is no catalyst. As no catalyst is used higher operational temperatures are required, between 930 - 1030oC to ensure that a reaction between the ammonia and nitrogen oxides occurs. This process is also suitable for fitting to existing plant and new build applications, and can achieve a NOX reduction of up to 50 - 60%, again with minimal waste production. This system is far cheaper than the SCR, but maintaining the correct operational temperatures to ensure an adequate reduction of NOX is a drawback of this system. Consequently, the NOX reducing capabilities of the SNCR are less than the SCR. This system is also not operational within the UK but is being used extensively in Japan.
Activated Carbon Process The Activated Carbon (coke or char) Process reduces NO2 produced during combustion to NO via a reaction with carbon at about 80oC. Ammonia can then be added to reduce the NO to N2 and water. NOX removal can be in the region of 40 - 60%.
ACE Information Programme aric
Air Pollution & Acid Rain Fact Sheets Series: KS4 & A 133
Summary For small processes combustion modifications of the combustion chamber are considered to be the most appropriate technique. For larger installations combustion modifications will generally be effective but if the process generates high levels of NOX then a combination of combustion modifications and flue gas treatments may be required. The costs of flue gas treatment are, however, significantly greater than combustion modifications which may inhibit their usage. At present there are no post combustion techniques in operation within the UK and none planned for the future. There are various methods for reducing the atmospheric NOX emissions from power generation. Each method has both advantages and limitations related to cost, removal efficiency, operational experience and waste products produced. Therefore, as with sulphur dioxide removal, the choice of control technology should be based on the criteria required for each individual combustion plant.
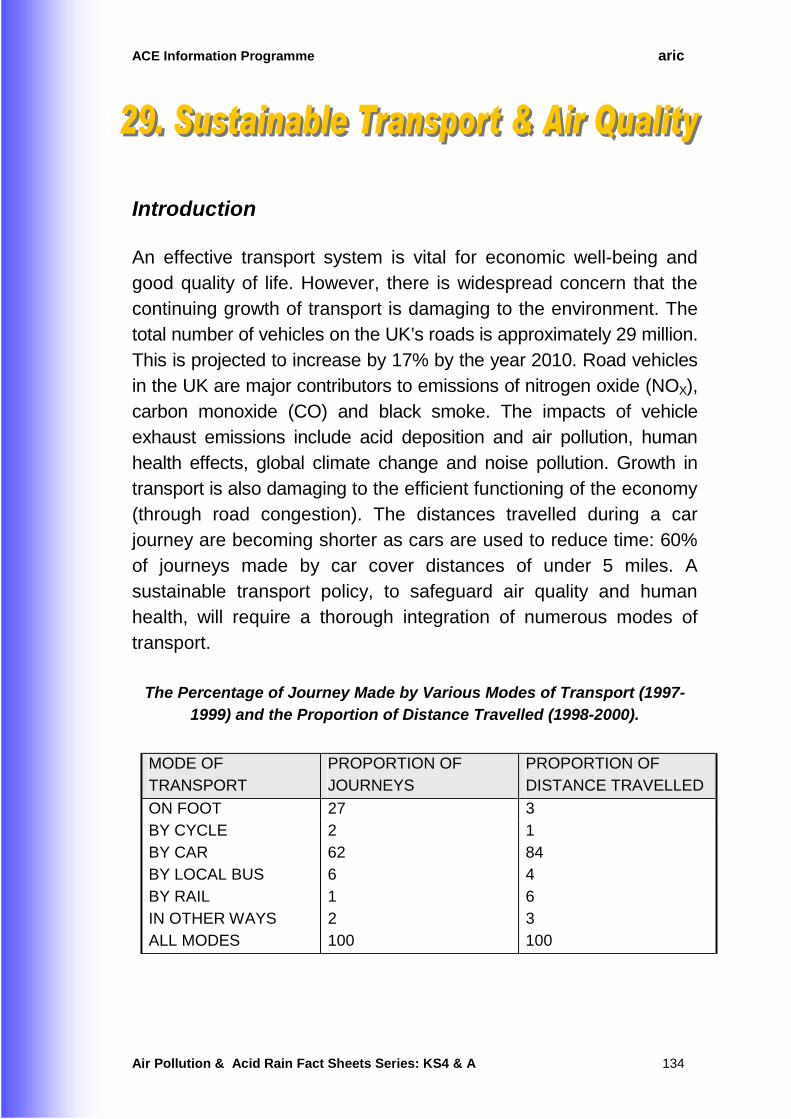
ACE Information Programme aric
Air Pollution & Acid Rain Fact Sheets Series: KS4 & A 134
Introduction An effective transport system is vital for economic well-being and good quality of life. However, there is widespread concern that the continuing growth of transport is damaging to the environment. The total number of vehicles on the UK’s roads is approximately 29 million. This is projected to increase by 17% by the year 2010. Road vehicles in the UK are major contributors to emissions of nitrogen oxide (NOX), carbon monoxide (CO) and black smoke. The impacts of vehicle exhaust emissions include acid deposition and air pollution, human health effects, global climate change and noise pollution. Growth in transport is also damaging to the efficient functioning of the economy (through road congestion). The distances travelled during a car journey are becoming shorter as cars are used to reduce time: 60% of journeys made by car cover distances of under 5 miles. A sustainable transport policy, to safeguard air quality and human health, will require a thorough integration of numerous modes of transport.
The Percentage of Journey Made by Various Modes of Transport (1997-1999) and the Proportion of Distance Travelled (1998-2000).
MODE OF TRANSPORT
PROPORTION OF JOURNEYS
PROPORTION OF DISTANCE TRAVELLED
ON FOOT 27 3 BY CYCLE 2 1 BY CAR 62 84 BY LOCAL BUS 6 4 BY RAIL 1 6 IN OTHER WAYS 2 3 ALL MODES 100 100
ACE Information Programme aric
Air Pollution & Acid Rain Fact Sheets Series: KS4 & A 135
Sustainable Transport in the UK In the Sustainable Development Strategy for the UK, the Government has acknowledged that it will need to take action to control the rate of traffic growth, improve the environmental performance of vehicles and increase public awareness about the environmental impacts of pollutant emissions from transport. The best approach to promoting a more balanced transport policy will be an integrated approach with both "carrot" and "stick" measures to get people out of their cars. If people are to reduce their dependence on the car, they must be provided with alternatives that are affordable.
Reducing the Need to Travel Emphasis needs to be placed on reversing the trend of population dispersal outwards from urban areas. By effective land-use planning, activities (including work, shopping and leisure) are brought closer together, reducing journey distances to a level where travel on foot and by bicycle becomes more popular. To facilitate this, urban centres need to be made more attractive, and the quality of urban living needs to be improved.
Car Pooling "Car-pooling" is the term used to describe regular journey sharing between a group of drivers, usually to and from work. This leads to a reduction in the number of cars in city centres and is also a more economical way to travel.
Reducing Road Space Experience suggests that traffic tends to expand to fill available road space. This process also works in reverse. As road space is reduced, traffic shrinks so the overall level of service is roughly unchanged. This process is termed "traffic evaporation". One of the
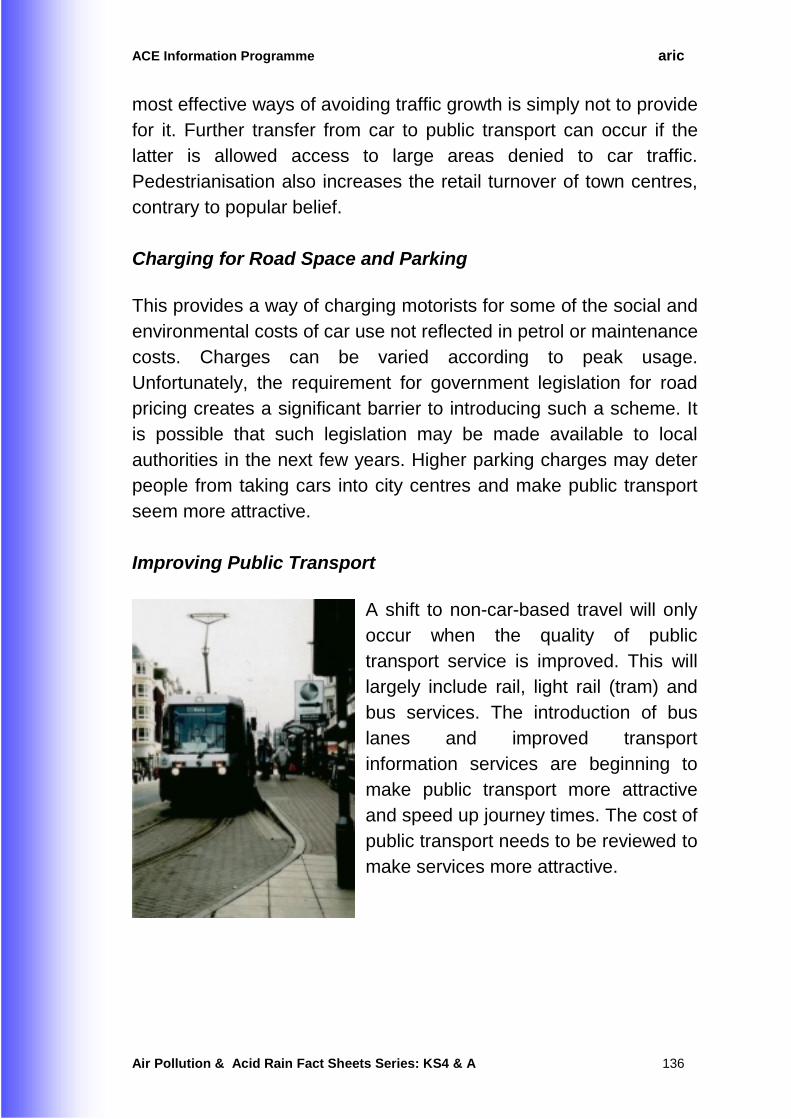
ACE Information Programme aric
Air Pollution & Acid Rain Fact Sheets Series: KS4 & A 136
most effective ways of avoiding traffic growth is simply not to provide for it. Further transfer from car to public transport can occur if the latter is allowed access to large areas denied to car traffic. Pedestrianisation also increases the retail turnover of town centres, contrary to popular belief.
Charging for Road Space and Parking This provides a way of charging motorists for some of the social and environmental costs of car use not reflected in petrol or maintenance costs. Charges can be varied according to peak usage. Unfortunately, the requirement for government legislation for road pricing creates a significant barrier to introducing such a scheme. It is possible that such legislation may be made available to local authorities in the next few years. Higher parking charges may deter people from taking cars into city centres and make public transport seem more attractive.
Improving Public Transport
A shift to non-car-based travel will only occur when the quality of public transport service is improved. This will largely include rail, light rail (tram) and bus services. The introduction of bus lanes and improved transport information services are beginning to make public transport more attractive and speed up journey times. The cost of public transport needs to be reviewed to make services more attractive.
ACE Information Programme aric
Air Pollution & Acid Rain Fact Sheets Series: KS4 & A 137
Cycling Cycling can often be the quickest way to make short journeys. There are presently numerous cycle tracks in towns and cities, but the improvement and expansion of these routes could encourage more people to cycle. Improving cycle parking facilities at convenient locations could assist this.
Walking Walking is a sustainable mode of transport that is available to all at no cost. The safer the walking environment the better, and hence the introduction of pedestrianisation in city centres has increased the number of walkers. As with cycling, walking is also a healthy way to travel as it increases physical fitness.
Promoting More Efficient Motoring Fuel efficiency varies with speed. Above 50mph, fuel consumption increases rapidly. By maintaining slower speeds, fuel is conserved, and less carbon dioxide is emitted. In addition, cars driven economically (with reduced acceleration, braking and cornering speed) can save 10% of car fuel.
Traffic Management Schemes Traffic management schemes can be used to reduce the amount of traffic in city centres. Paris has experimented with a scheme that allows cars with an even number plate to enter the city on one day and those with odd number plates on the next. Leeds city council operates a policy to encourage car sharing by the use of high-occupancy vehicle lanes, available for cars carrying two or more passengers, hence encouraging people to share cars to enable them to get to work quicker.
ACE Information Programme aric
Air Pollution & Acid Rain Fact Sheets Series: KS4 & A 138
Conclusion Motor vehicles generate more air pollution than any other single human activity. Road transport affects local air quality, influences the global climate and creates economic inefficiency through daily road congestion. In the UK, it has been recognised that the continued mismanagement of an unsustainable transport system cannot continue in the future. Sustainable transport policies will involve more than traffic reduction. New technology is required to increase vehicle efficiency and reduce air pollution from the traffic that remains. Investment in other modes of transport, including public transport, cycling and walking will be needed to encourage individuals out of their cars.
ACE Information Programme aric
Air Pollution & Acid Rain Fact Sheets Series: KS4 & A 139
Introduction Energy is produced by the combustion of fossil fuels, such as oil, coal and gas, which release pollutant gases, such as sulphur dioxide and oxides of nitrogen, into the atmosphere. Through international protocols, the introduction of emissions and air quality standards, and the use of emission control technology, nations are beginning to witness sometimes substantial reductions in air pollutant emissions from power generation and transport, and a consequent improvement in air quality. Nevertheless, it is only by reducing our dependence on fossil fuels and energy consumption that a long term improvement in air quality can be maintained. For the individual, there are 3 main areas where action can be taken in this respect, energy use in the home, domestic waste production and private transport.
Energy Use in the Home The individual has little influence on how his/her energy is produced, for example by coal or gas fired power stations, or alternatively by wind or solar power. However, the individual has control on how he or she uses that available energy. Through the implementation of simple measures the individual can effectively bring about a reduction in his/her energy consumption, thereby reducing the need for energy production and consequently reducing pollutant emissions. Using less energy also means savings on fuel bills. Heating (space and water) accounts for approximately 25% of UK energy use. On average 55% of fuel bills are spent on space heating, but in an un-insulated house about half of this heat escapes through
ACE Information Programme aric
Air Pollution & Acid Rain Fact Sheets Series: KS4 & A 140
the walls! Water heating can account for up to 20% of the average fuel bill but we are often wasteful of this resource. Energy use in these two areas can be cut whilst still providing the heating that you require. Energy-saving light bulbs are now widely available in supermarkets and electrical stores. The initial cost of energy saving light bulbs are relatively high at about £2 - £10 each, but the lower running costs and longer lifetimes mean that the initial cost can be recouped within a couple of years. The energy use and efficiency of household appliances, such as fridges, freezers, cookers, washing machines and televisions depends on the age, model and manufacturer. In the UK 20% of electricity is used by domestic appliances. Under an EC Directive, retailers are required to label all new fridges and freezers with an eco-label.
Energy saving ideas • = Draught proofing door and seals at an approximate cost of
£45-£60, annual fuel bill saving of £10 - £20.
• = Insulating your loft to a depth of 6 inches, at an approximate cost of £110 - £160, annual fuel bill saving of £60 - £70. 20% of your energy bill can be saved by effective loft insulation.
• = External wall insulation. Effective wall insulation can reduce heat loss by up to two thirds.
• = Fitting secondary glazing / double glazing windows, saving approximately £15 - £25 on the annual fuel bill.
• = Fitting a hot water jacket to the water tank, cost £5 - £10, annual saving of £10 - £15.
• = Fitting a programmer to the central heating system will ensure heating is only produced when needed.
• = Turning the central heating thermostat down by just 1oC can save on average 10% on heating bills.
• = A shower uses only two-fifths of the hot water needed to run a bath.
• = A wash cycle run at 40oC will cost one quarter of the amount of the hottest cycle on your washing machine.
• = Ensure the rubber door seals on fridges and freezers fit properly.
• = If your washing machine has a half load, and/or, an economy wash option use these when appropriate.
• = If space permits do not place the fridge / freezer next to the cooker.
ACE Information Programme aric
Air Pollution & Acid Rain Fact Sheets Series: KS4 & A 141
Waste Production At present, households in the UK annually produce 28.4 million tonnes of domestic rubbish; about 500 kilograms for every person in the country. Currently 90% of household waste collected by councils is dumped into landfill sites. Landfilled waste produces the second most important greenhouse gas: methane. Paper recycling can reduce water use by about 60% and energy consumption by 40%. It is one of the easiest products to recycle with paperbanks in most towns throughout the UK. Paper recycling is the most popular of all waste product recycling, with over a third of all household paper going to the recycle banks. Every 10% increase in the recycling of crushed glass reduces the energy consumption in glass making by 2%. In the UK glass recycling has increased in popularity over the past 15 years. The number of collection sites increased ten-fold between 1984 to 1998. There are now over 20,000 council collection sites in the UK, and up to 22% of household glass is being recycled. An average family throws away over 100 kilograms of plastics and textiles each year. Currently, only 3% palstics are being recycled. When plastics are landfilled a potential source of energy is lost. Food and drink packaging, such as tins and cans, contribute about 8% to the average family's household waste. Collection points for these materials are widespread throughout the UK with aluminium can banks being the most popular. Recycling rate of cans is now 36%. The potential to reduce the amount of raw materials and energy used in the manufacturing of packaging does exist. The individual can aid this process by adopting the reduce, re-use and recycle attitude wherever feasible. Recycling reduces the need to mine for raw materials, it saves energy and it reduces the amount of waste buried in landfill sites (reducing the potential for methane emissions).
ACE Information Programme aric
Air Pollution & Acid Rain Fact Sheets Series: KS4 & A 142
Ideas for recycling • = Make use of the paper and glass recycling sites in your area.
Separate the coloured glass and deposit the glass at the collection point, but try and avoid making a special car journey.
• = Reuse glass bottles and tins wherever suitable.
• = Ask your local council where the nearest plastic collection point is and try and use these if possible.
• = If there is no suitable collection point try and buy products which have different packaging such as glass.
• = At the supermarket reuse plastic carrier bags, or use a basket instead.
Transport Transport is the fastest growing energy-consumption sector in the UK and the number of cars on the road is projected to increase by 17% by 2010. It is therefore an area that requires great attention to reduce fuel consumption and hence pollution. Transport pollution is emitted at ground level from a mobile source, and is therefore a larger problem than other pollution sources. Ideas to reduce pollutant emissions from private transport • = As an alternative to driving the car, walk, cycle or use public transport where it
is suitable and safe for you to do so, particularly for short trips where using the car is not really necessary and an alternative exists. Even when only a quarter full, a bus is more than twice as fuel-efficient as a family car.
• = If you and your friends drive to work consider the option of car sharing.
• = Adopting a calmer driving style will also result in a reduction of car emissions. A car travelling at 70mph can consume 30% more fuel than a car travelling at 50mph.
• = Ensuring your car is serviced regularly and maintaining the correct tyre pressure improves fuel efficiency.
ACE Information Programme aric
Air Pollution & Acid Rain Fact Sheets Series: KS4 & A 143
Conclusion Everyone contributes to national and global emissions of pollutant gases, but it is not only governments that can take action to reduce the environmental damage caused. For their policies to work effectively and for their targets to be achieved the actions of the individual are required. The cumulative energy reductions by individuals would reduce the need for energy consumption, conserve stocks of raw materials such as coal, oil and gas, and bring about a reduction in pollutant gas emissions.
ACE Information Programme aric
Air Pollution & Acid Rain Fact Sheets Series: KS4 & A 144
Acid deposition Acidic air pollution that falls to the ground as either particles (dry deposition), or solutions in rain (wet deposition). The latter is commonly known as “acid rain”. Produced from the atmospheric build-up of NOx and SO2. Air pollution A term used to describe any unwanted chemicals or other materials that contaminate the air that we breathe resulting in the degradation of air quality. Ammonia (NH3) A gas consisting of molecules of nitrogen (1) and hydrogen (3) atoms produced during the manufacture of fertilisers, it is colourless but has a very strong smell. Anthropogenic Man-made. Atmosphere The envelope of gases which surrounds the Earth. Bed rock The solid unweathered rock that lies beneath loose surface deposits. Buffering The ability to withstand an increase in acid deposition, without changing pH.
ACE Information Programme aric
Air Pollution & Acid Rain Fact Sheets Series: KS4 & A 145
Carbon monoxide (CO) A highly poisonous gas, consisting of molecules of carbon (1) and oxygen (1) atoms, produced when fuel is burnt during incomplete combustion. It is emitted mainly from car exhausts. Carcinogenic The term applied to a cancer-causing substance. Catalytic converter A device fitted to the exhaust system of a vehicle, which converts the majority of harmful exhaust pollutants, such as hydrocarbons, into less harmful ones. Catchment An area of land drained by a river and its tributaries (streams etc.). Clean Air Acts Acts passed in1956 and 1968 to reduce the amount of pollution from industries and homes in the UK. Combustion Burning, e.g. of fossil fuels or biomass. Concentration A measure of the atmospheric content of a gas, defined in terms of the proportion of the total volume that it accounts for. Trace gases in the atmosphere are usually measured in parts per million by volume (ppmv), parts per billion by volume (ppbv) or parts per trillion (million million) by volume (pptv). Corrosion A process in which a solid is dissolved and changed by the action of a chemical.
ACE Information Programme aric
Air Pollution & Acid Rain Fact Sheets Series: KS4 & A 146
Critical load The maximum amount of deposition that a defined environment can withstand, without suffering long term damage. Diffusion tubes Tubes used to measure the amount of a particular pollutant in the atmosphere, usually oxides of nitrogen. Dioxins Poisonous chemical by-products from the manufacture of certain herbicides and bactericides. Dispersion The scattering and distribution of pollutants in the atmosphere. Ecosystem A system of interconnected habitats and their species of flora (plants) and fauna (animals), usually defined by a specific geographical area and/or climatic regime, e.g. mountain, polar, forest ecosystems. Emissions The discharge of waste gases into the atmosphere. Emissions inventory Information concerning the distribution of pollution sources in a certain area, and the amount and types of pollutants being emitted. Energy efficiency Quantitatively, the more energy that can be produced per unit mass of fuel, the more efficient is the energy production. The efficiency with which energy is utilised can be increased by both improving energy supply technology and managing energy demand more effectively.
ACE Information Programme aric
Air Pollution & Acid Rain Fact Sheets Series: KS4 & A 147
EPAQS Expert Panel on Air Quality Standards. EPAQS provides advice and guidance to the UK Government on air quality. Flue-gas desulphurisation (FGD) A process that removes sulphur dioxide after fuel combustion before being emitted to the atmosphere. Fluidised bed combustion (FBC) A process that removes sulphur dioxide during fuel combustion before being emitted to the atmosphere. Fossil fuel Any hydrocarbon deposit that can be burned for heat or power such as coal, oil or natural gas. Fossil fuels are formed from the decomposition of ancient animal and plant remains. Gastrointestinal Relating to the stomach and intestinal tract. Global warming A continued warming of the Earth’s surface and lower atmosphere (troposphere) as a result of pollution by man.
Granite A coarse grained igneous rock consisting of quartz, feldspar and mica. Haemoglobin A constituent of red blood cells, which facilitates the absorption of oxygen into the bloodstream for respiration. Humidity A measure of the amount of water vapour in the air.
ACE Information Programme aric
Air Pollution & Acid Rain Fact Sheets Series: KS4 & A 148
Hydrocarbons Organic compounds containing carbon and hydrogen. Immunotoxic A substance that is toxic to the immune system. Industrial Revolution The rapid growth of industry which began in the late 18th century, made possible by the harnessing of energy from fossil fuels. Lead A toxic blue/white metal emitted as particles by vehicles using leaded petrol. Lead toxicity in the body can lead to the impairment of intelligence, particularly in children. Leukaemia A form of cancer where too many white blood cells are formed. Megawatt (MW) One million watts.
µµµµgm-3
Micrograms per cubic metre.
Micron (µµµµm)
One millionth of a metre. National Air Quality Strategy (NAQS) A national programme to monitor and manage air pollution levels and air quality in the UK. Published in spring 1997 following the Environment Act of 1995. Nitrogen oxides (NOx) The collective term for nitric oxide (NO) and nitrogen dioxide (NO2).
ACE Information Programme aric
Air Pollution & Acid Rain Fact Sheets Series: KS4 & A 149
Ozone (O3) A gas formed when nitrogen oxides and hydrocarbons react in the presence of sunlight. Consequently, it is known as a secondary pollutant. Particulates Coarse and fine particles of organic or inorganic substances present in the atmosphere. Particulate matter (PM10) Particles of organic or inorganic substances present in the
atmosphere that are less than 10 microns (µm) in diameter.
ppb Parts per billion. ppm Parts per million. ppt Parts per trillion. pH A measure of acidity. pH 7 is neutral, values lower than 7 are acidic whilst values higher that 7 are alkaline. The scale is logarithmic so that pH 5 is 10 times as acidic as pH 6. Photochemical smog Describes the hazy conditions that occur when air pollutants are trapped at ground level. High levels of ozone may be produced as nitrogen oxides and hydrocarbons react in the presence of sunlight. Pollution concentrations may become very high and the air quality may be classed as ‘poor’ or ‘very poor’. In summertime, they usually occur on warm, still, sunny days. In winter, smogs may occur on cold, calm days when air pollutants are trapped in urban areas by a layer of colder air above.
ACE Information Programme aric
Air Pollution & Acid Rain Fact Sheets Series: KS4 & A 150
Photolytic A chemical reaction involving sunlight in which molecules are split into their constituent atoms. Also known as photodissociation. Photosynthesis The process by which green plants use light to synthesise organic compounds from carbon dioxide and water. In the process oxygen and water are released. Pollutant Strictly too much of any substance in the wrong place or at the wrong time is a pollutant. More specifically, atmospheric pollution may be defined as ‘the presence of substances in the atmosphere, resulting from man-made activities or from natural processes, causing adverse effects to man and the environment’. Respiration The process by which animals use up stored foods (by combustion with oxygen) to produce energy. Stratosphere A layer in the atmosphere above the troposphere extending upwards to about 50km. The stratosphere contains much of the total atmospheric ozone. The temperature in this region increases with height and can exceed 0oC in the summer. The air density here is much less than in the troposphere. It is not thought that the stratosphere has much influence on the weather on the Earth’s surface. Sulphur dioxide (SO2) A colourless gas, consisting of molecules of sulphur (1) and oxygen (2) atoms, which is given off during fossil fuel combustion. Sulphuric acid An acid produced when sulphur dioxide dissolves in water. A component of “acid rain”.
ACE Information Programme aric
Air Pollution & Acid Rain Fact Sheets Series: KS4 & A 151
Sustainable development Development which meets the needs of the present without compromising the ability of future generations to meet their own needs. Sustainable development tries to reconcile the needs of social and economic development with ecological conservation and environmental protection. Smog Pollution consisting of smoke and sulphur dioxide trapped at ground level. It usually occurs on cold, calm winter days. The term smog was derived from smoke and fog. Transboundary A term used to describe the movement of air pollution emitted in one country that crosses national boundaries to affect other countries. Troposphere The lowest layer of the atmosphere. The altitude of the troposphere varies with latitude, from about 16km at the equator to only 8km at the poles. Normally there is a decrease in temperature with height. This layer contains 75% of the total gaseous mass of the atmosphere and virtually all the water vapour and aerosols. This zone is responsible for most of the weather phenomena experienced and where atmospheric turbulence is most marked. Watt A unit of energy output per unit time (Joules per second). Watts per square metre (Wm-2) is a measure of the energy output per unit area (e.g. the amount of solar energy received at the Earth’s surface). World Health Organisation (WHO) WHO recommend guide values for particular pollutants, which are considered safe for human health.
ACE Information Programme aric
Air Pollution & Acid Rain Fact Sheets Series: KS4 & A 152
Acid Rain National Expert Group on Transboundary Air Pollution (NEGTAP). 2001. Transboundry Air Pollution: Acidification, Eutrophication and Ground-Level Ozone in the UK. NEGTAP, DEFRA Contract EPG 1/3/153. http://www.nbu.ac.uk/negtap/ UK Critical Loads Advisory Group. 1995. Critical Loads of Acid Deposition for UK Freshwaters. Institute of Terrestrial Ecology, Edinburgh. UK Critical Loads Advisory Group. 1996. Critical Levels of Air Pollution in the United Kingdom. Department of the Environment, London. UK Critical Loads Advisory Group. 1997. Deposition Fluxes of Acidifying Compounds in the United Kingdom. Department of the Environment, London. UK Review Group on Acid Rain. 1997. Acid Deposition in the United Kingdom: 1992 – 1994, 4th Report. AEA Technology & Department of the Environment, Transport and the Regions, London. UK Review Group on Impacts of Atmospheric Nitrogen. 1994. Impacts of Nitrogen Deposition on Terrestrial Ecosystems. Department of the Environment, London.
ACE Information Programme aric
Air Pollution & Acid Rain Fact Sheets Series: KS4 & A 153
Air Pollution Brimblecombe, P. 1987. The Big Smoke. Routledge, London. Committee on the Medical Effects of Air Pollutants, Department of Health. 1997. Handbook on Air Pollution and Health. The Stationery Office Limited, London. Department for Environment, Food & Rural Affairs. 2001. Digest of Environmental Statistics. http://www.defra.gov.uk/environment/statistics/des/intro.htm Department of the Environment. 1997. The United Kingdom National Air Quality Strategy. Department of the Environment, London. Department of the Environment, Transport & The Regions (DETR). 2000. The Air Quality Strategy for England, Scotland, Wales and Northern Ireland - Working Together for Clean Air. http://www.defra.gov.uk/environment/airquality/strategy/index.htm National Environmental Technology Centre (NETCEN). 2002. UK National Air Quality Information Archive. http://www.airquality.co.uk/ National Society for Clean Air and Environmental Protection. 1997. NSCA Handbook 1997. NSCA, Brighton. National Statistics. StatBase®, National Statistics data and references. http://www.statistics.gov.uk/statbase/mainmenu.asp Meteorological Office. 1995. Air Quality – A to Z. HMSO, London. World Health Organisation & United Nations Environment Programme. 1992. Urban Air Pollution in Megacities of the World. Blackwell, London.