Embed Size (px)
Citation preview
Chapter – 4 -An Analysis of Cost Of Illness Of Air Pollution
Page | 76
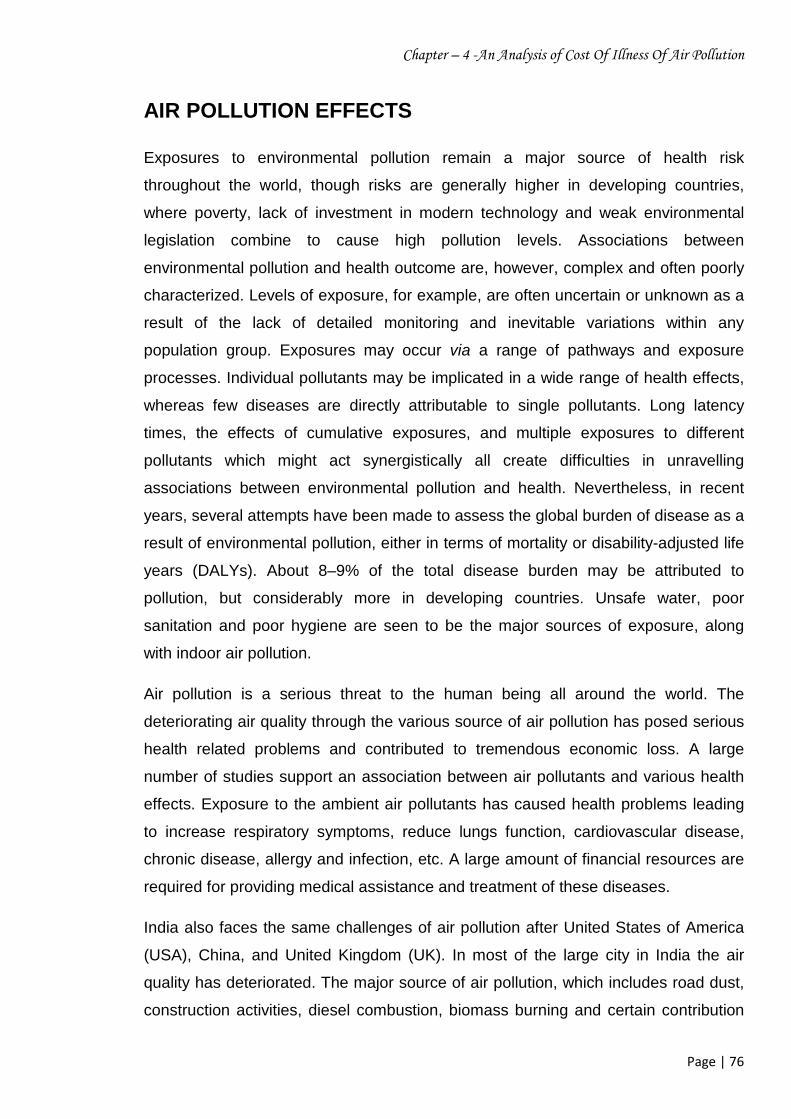
AIR POLLUTION EFFECTS
Exposures to environmental pollution remain a major source of health risk
throughout the world, though risks are generally higher in developing countries,
where poverty, lack of investment in modern technology and weak environmental
legislation combine to cause high pollution levels. Associations between
environmental pollution and health outcome are, however, complex and often poorly
characterized. Levels of exposure, for example, are often uncertain or unknown as a
result of the lack of detailed monitoring and inevitable variations within any
population group. Exposures may occur via a range of pathways and exposure
processes. Individual pollutants may be implicated in a wide range of health effects,
whereas few diseases are directly attributable to single pollutants. Long latency
times, the effects of cumulative exposures, and multiple exposures to different
pollutants which might act synergistically all create difficulties in unravelling
associations between environmental pollution and health. Nevertheless, in recent
years, several attempts have been made to assess the global burden of disease as a
result of environmental pollution, either in terms of mortality or disability-adjusted life
years (DALYs). About 8–9% of the total disease burden may be attributed to
pollution, but considerably more in developing countries. Unsafe water, poor
sanitation and poor hygiene are seen to be the major sources of exposure, along
with indoor air pollution.
Air pollution is a serious threat to the human being all around the world. The
deteriorating air quality through the various source of air pollution has posed serious
health related problems and contributed to tremendous economic loss. A large
number of studies support an association between air pollutants and various health
effects. Exposure to the ambient air pollutants has caused health problems leading
to increase respiratory symptoms, reduce lungs function, cardiovascular disease,
chronic disease, allergy and infection, etc. A large amount of financial resources are
required for providing medical assistance and treatment of these diseases.
India also faces the same challenges of air pollution after United States of America
(USA), China, and United Kingdom (UK). In most of the large city in India the air
quality has deteriorated. The major source of air pollution, which includes road dust,
construction activities, diesel combustion, biomass burning and certain contribution
Chapter – 4 -An Analysis of Cost Of Illness Of Air Pollution
Page | 77
of gasoline has polluted city like, Delhi, Mumbai, Chennai, Kolkata, Howrah,
Bangalore, Noida, Faridabad, Ghaziabad, Kanpur, Firozabad, Agra, etc.
Agra, located in the state of Uttar Pradesh of northern India, is well known for Taj
Mahal, one of the wonders of the world. The Agra city spreads over an area of
approximately 140 sq. km. As per recent census, Agra has a population of about 20
lakhs excluding the daily floating population of 30,000 (approx). The city of Agra is
favorably situated commanding administrative, economic, and cultural influence over
a very large area. Besides its recent development as an international tourist centre
and manufacturing centre, since centuries Agra had flourished with trade, commerce
and household industries. The urban area of Agra is divided into Nagar Mahapalika
(renamed as Municipal Corporation in 1994), Agra Cantonment area and the
Dayalbagh and Swamibagh Panchayat. The municipal area is further divided into
three parts viz. the main city, the Trans Yamuna and the Tajganj. The municipal area
is divided into 90 wards. The jurisdiction of the Agra Urban Area is under the Agra
Development Authority (ADA).
The sources of pollutants in the city are domestic, industrial, vehicular, DG Sets and
natural sources. The air pollution from the industries is mainly due to fuel used in the
manufacturing process. The majority of industries in Agra comprise of foundries.
Besides a number of petha industries are operating in the city, which mainly use coal
as fuel. In foundries, the principal source of emission is cupola. The volume of gas
exhausted and its concentration depends on the cupola, operations, melting rates,
characteristic of charging material and the coke. Gases escape while drawing the hot
metal and during casting. In the pit type of cupola, emissions are fugitive type. The
main pollutants are SPM, sulphur dioxide and carbon monoxide. Agra is famous for
‘Petha’ (a type of sweet). There are large numbers of petha manufacturing units.
Besides these, there are halwaiis, kumhars and bharbhujas who use coal, cow dung
and wood. Kumhars have to use cow dung because of the type of firing adopted by
them.
The vehicular emissions are one of the major sources of air pollution affecting the
urban population in Agra. Unlike industrial emissions, vehicular pollutants are
released at ground level and hence the impact on recipient population will be more.
Chapter – 4 -An Analysis of Cost Of Illness Of Air Pollution
Page | 78
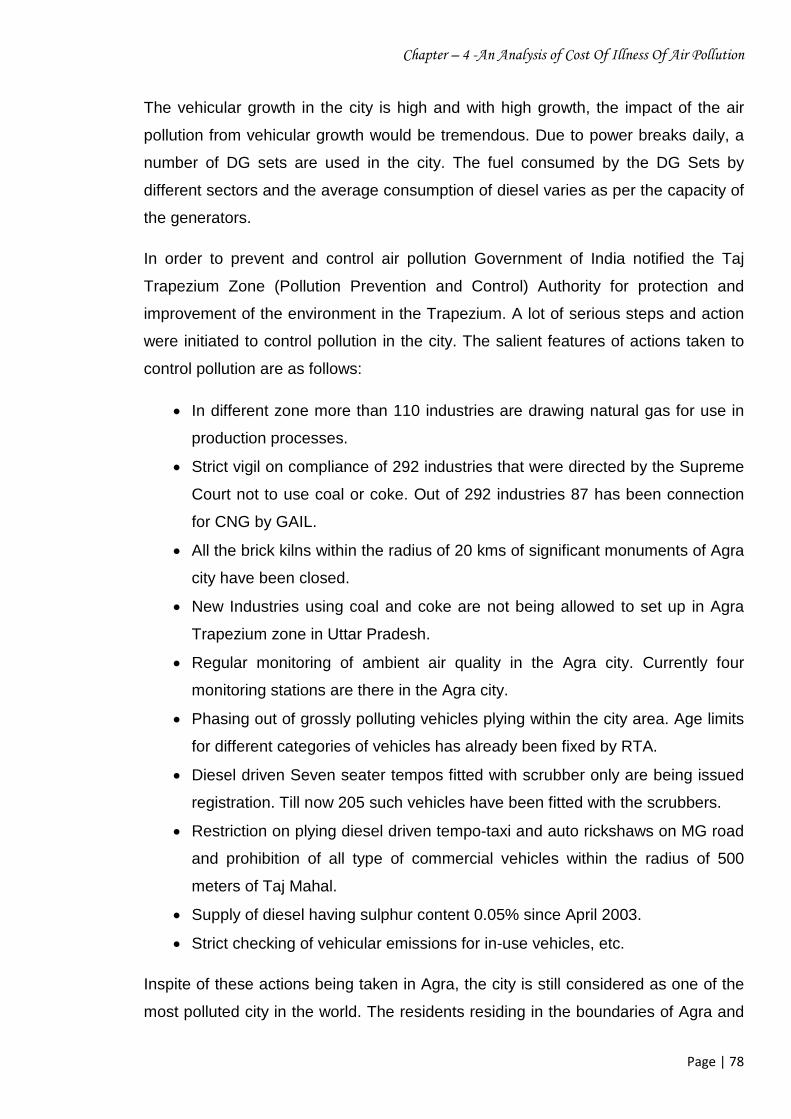
The vehicular growth in the city is high and with high growth, the impact of the air
pollution from vehicular growth would be tremendous. Due to power breaks daily, a
number of DG sets are used in the city. The fuel consumed by the DG Sets by
different sectors and the average consumption of diesel varies as per the capacity of
the generators.
In order to prevent and control air pollution Government of India notified the Taj
Trapezium Zone (Pollution Prevention and Control) Authority for protection and
improvement of the environment in the Trapezium. A lot of serious steps and action
were initiated to control pollution in the city. The salient features of actions taken to
control pollution are as follows:
· In different zone more than 110 industries are drawing natural gas for use in
production processes.
· Strict vigil on compliance of 292 industries that were directed by the Supreme
Court not to use coal or coke. Out of 292 industries 87 has been connection
for CNG by GAIL.
· All the brick kilns within the radius of 20 kms of significant monuments of Agra
city have been closed.
· New Industries using coal and coke are not being allowed to set up in Agra
Trapezium zone in Uttar Pradesh.
· Regular monitoring of ambient air quality in the Agra city. Currently four
monitoring stations are there in the Agra city.
· Phasing out of grossly polluting vehicles plying within the city area. Age limits
for different categories of vehicles has already been fixed by RTA.
· Diesel driven Seven seater tempos fitted with scrubber only are being issued
registration. Till now 205 such vehicles have been fitted with the scrubbers.
· Restriction on plying diesel driven tempo-taxi and auto rickshaws on MG road
and prohibition of all type of commercial vehicles within the radius of 500
meters of Taj Mahal.
· Supply of diesel having sulphur content 0.05% since April 2003.
· Strict checking of vehicular emissions for in-use vehicles, etc.
Inspite of these actions being taken in Agra, the city is still considered as one of the
most polluted city in the world. The residents residing in the boundaries of Agra and
Chapter – 4 -An Analysis of Cost Of Illness Of Air Pollution
Page | 79
its outskirts are heavily exposed to the various air pollutants and suffer from various
disease caused due to various pollutants. In the present chapter a demographic
analysis of respondents.
DEMOGRAPHIC ANALYSIS OF RESPONDENT
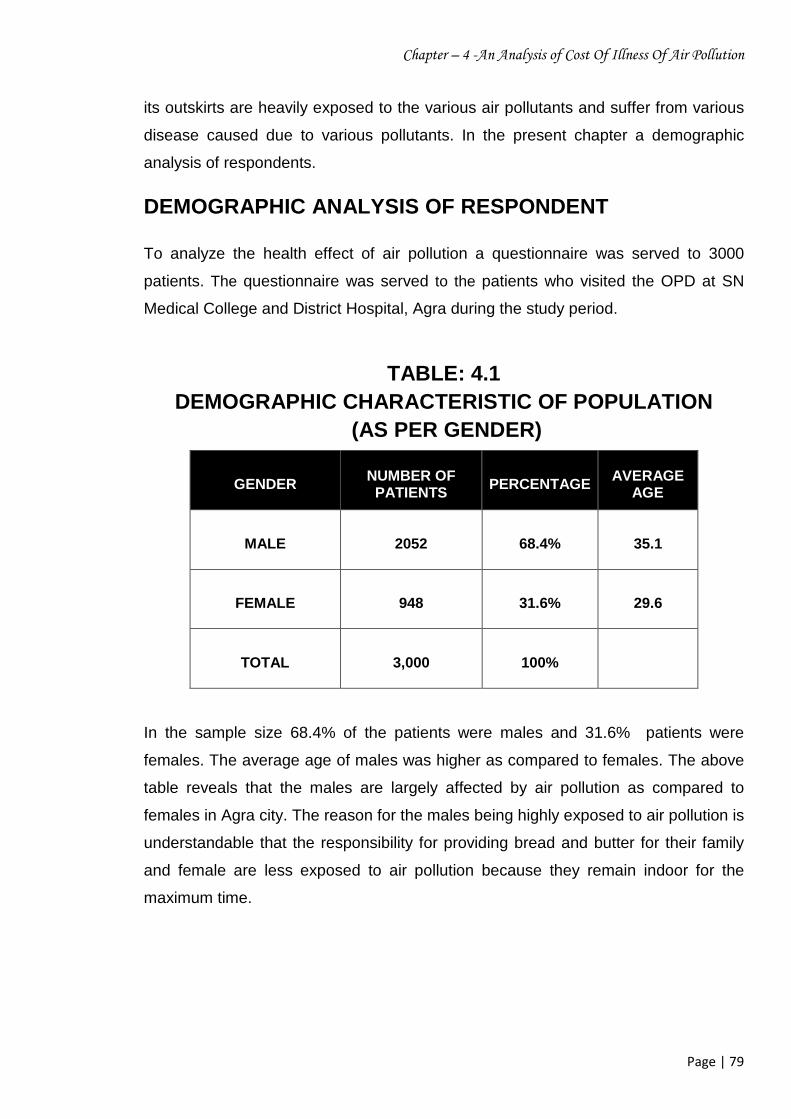
To analyze the health effect of air pollution a questionnaire was served to 3000
patients. The questionnaire was served to the patients who visited the OPD at SN
Medical College and District Hospital, Agra during the study period.
TABLE: 4.1 DEMOGRAPHIC CHARACTERISTIC OF POPULATION
(AS PER GENDER)
In the sample size 68.4% of the patients were males and 31.6% patients were
females. The average age of males was higher as compared to females. The above
table reveals that the males are largely affected by air pollution as compared to
females in Agra city. The reason for the males being highly exposed to air pollution is
understandable that the responsibility for providing bread and butter for their family
and female are less exposed to air pollution because they remain indoor for the
maximum time.
GENDER NUMBER OF
PATIENTS PERCENTAGE
AVERAGE AGE
MALE 2052 68.4% 35.1
FEMALE 948 31.6% 29.6
TOTAL 3,000 100%
Chapter – 4 -An Analysis of Cost Of Illness Of Air Pollution
Page | 80
TABLE- 4.2
DEMOGRAPHIC CHARACTERISTIC OF POPULATION
(AS PER AGE)
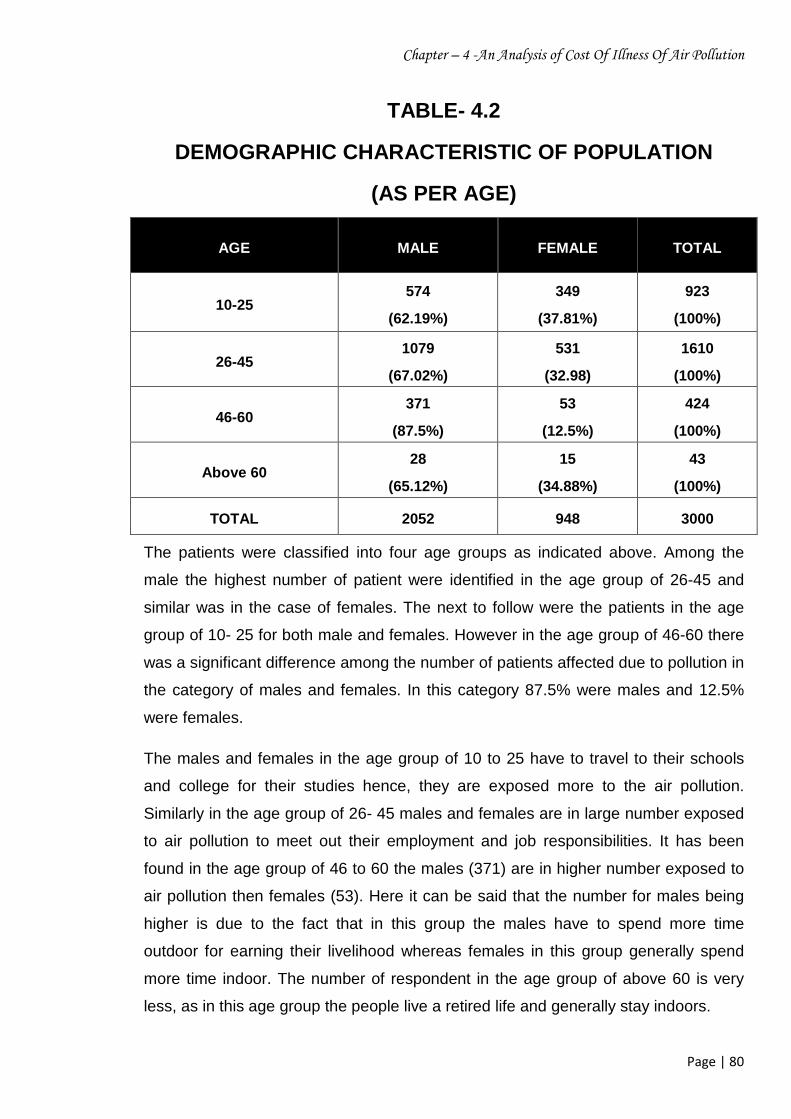
The patients were classified into four age groups as indicated above. Among the
male the highest number of patient were identified in the age group of 26-45 and
similar was in the case of females. The next to follow were the patients in the age
group of 10- 25 for both male and females. However in the age group of 46-60 there
was a significant difference among the number of patients affected due to pollution in
the category of males and females. In this category 87.5% were males and 12.5%
were females.
The males and females in the age group of 10 to 25 have to travel to their schools
and college for their studies hence, they are exposed more to the air pollution.
Similarly in the age group of 26- 45 males and females are in large number exposed
to air pollution to meet out their employment and job responsibilities. It has been
found in the age group of 46 to 60 the males (371) are in higher number exposed to
air pollution then females (53). Here it can be said that the number for males being
higher is due to the fact that in this group the males have to spend more time
outdoor for earning their livelihood whereas females in this group generally spend
more time indoor. The number of respondent in the age group of above 60 is very
less, as in this age group the people live a retired life and generally stay indoors.
AGE MALE FEMALE TOTAL
10-25 574
(62.19%)
349
(37.81%)
923
(100%)
26-45 1079
(67.02%)
531
(32.98)
1610
(100%)
46-60 371
(87.5%)
53
(12.5%)
424
(100%)
Above 60 28
(65.12%)
15
(34.88%)
43
(100%)
TOTAL 2052 948 3000
Chapter – 4 -An Analysis of Cost Of Illness Of Air Pollution
Page | 81
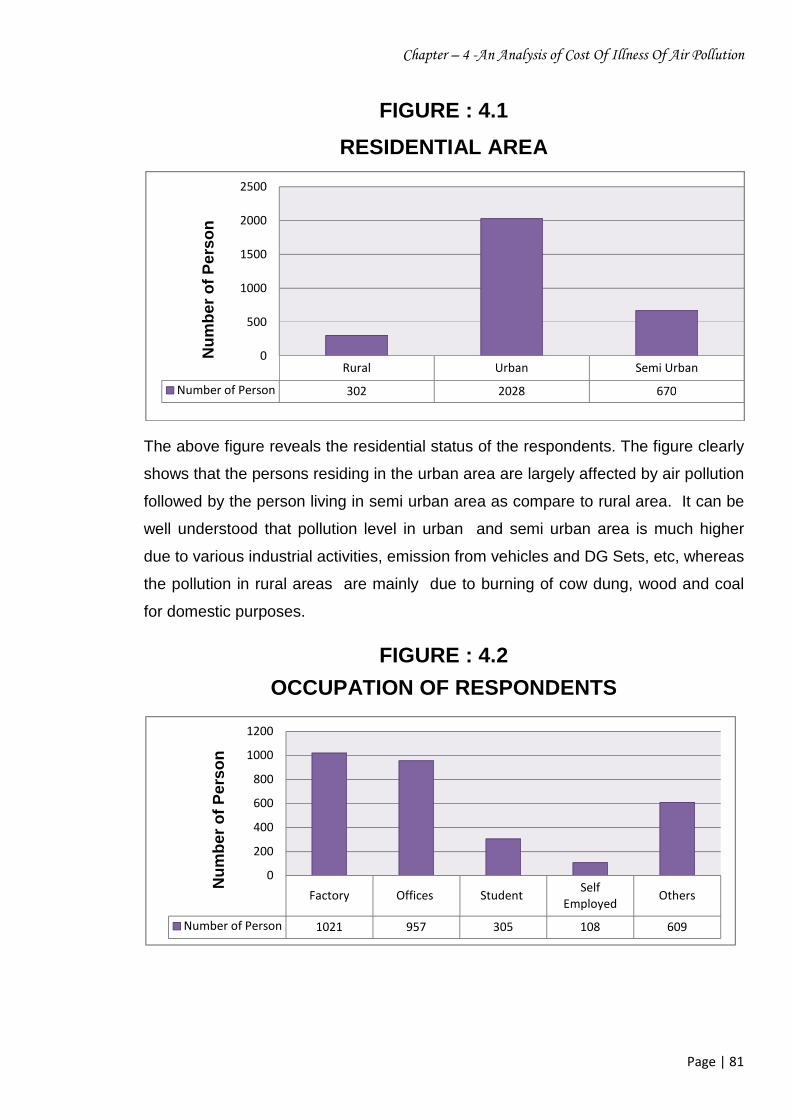
FIGURE : 4.1
RESIDENTIAL AREA
The above figure reveals the residential status of the respondents. The figure clearly
shows that the persons residing in the urban area are largely affected by air pollution
followed by the person living in semi urban area as compare to rural area. It can be
well understood that pollution level in urban and semi urban area is much higher
due to various industrial activities, emission from vehicles and DG Sets, etc, whereas
the pollution in rural areas are mainly due to burning of cow dung, wood and coal
for domestic purposes.
FIGURE : 4.2
OCCUPATION OF RESPONDENTS
Rural Urban Semi Urban
Number of Person 302 2028 670
0
500
1000
1500
2000
2500
Nu
mb
er o
f P
erso
n
Factory Offices Student Self Employed
Others
Number of Person 1021 957 305 108 609
0
200
400
600
800
1000
1200
Nu
mb
er o
f P
erso
n
Chapter – 4 -An Analysis of Cost Of Illness Of Air Pollution
Page | 82
The above figure shows the work place of the respondents in the sample survey. As
large number of respondents are working in factory hence they are directly exposed
to air pollution as compared to other respondents. The students and self employed
persons are found to be low because they are less exposed to air pollution as they
spend lot of time in a particular place and have lesser traveling. The number of other
is high because it includes rickshaw puller, auto drivers and housewives, etc.
Aside from exposures while travelling inside a vehicle, a significant proportion of the
population are exposed through occupations that lead to extended periods of time on
or near roads and highways or close to traffic like asphalt workers (Randem et al.
2004), traffic officers (de Paula et al. 2005; Dragonieri et al. 2006; Tamura et al.
2003; Tomao et al. 2002; Tomei et al. 2001), street cleaners (Raachou-Nielsen et al.
1995), street vendors, and tollbooth workers. Health impacts are greater for these
groups who work close to traffic than for those that are not occupationally exposed.
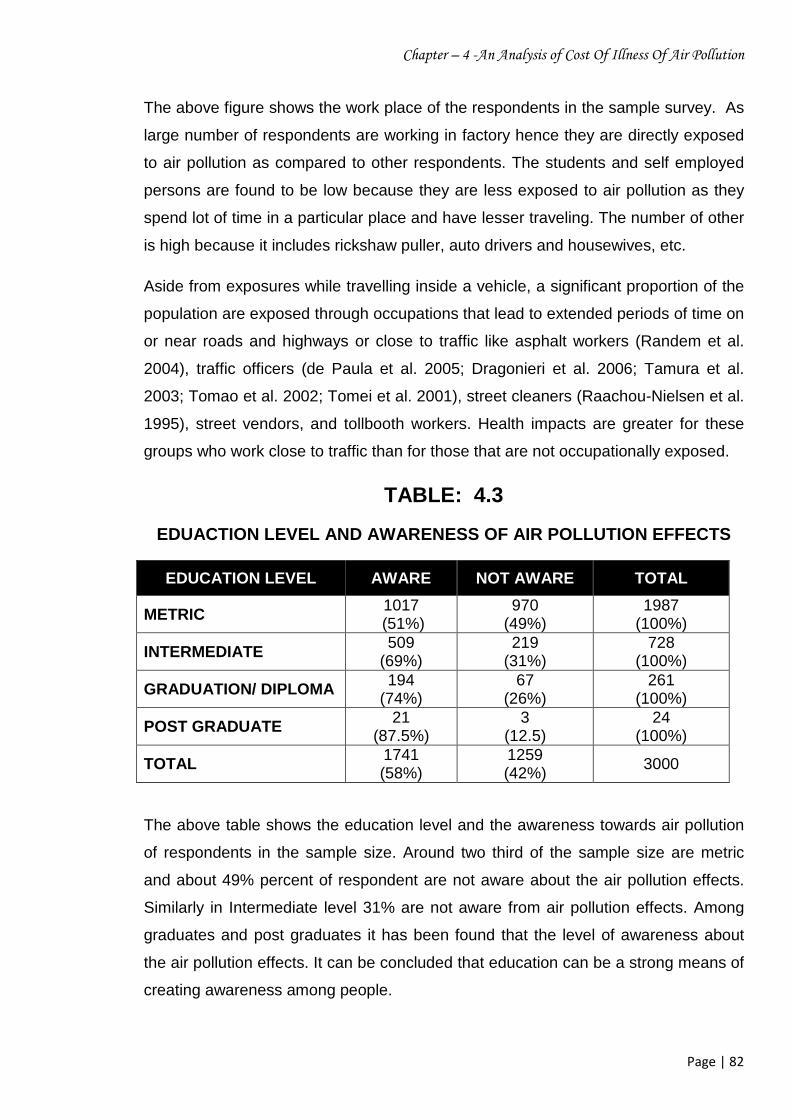
TABLE: 4.3
EDUACTION LEVEL AND AWARENESS OF AIR POLLUTION EFFECTS
EDUCATION LEVEL AWARE NOT AWARE TOTAL
METRIC 1017
(51%) 970
(49%) 1987
(100%)
INTERMEDIATE 509
(69%) 219
(31%) 728
(100%)
GRADUATION/ DIPLOMA 194 (74%)
67 (26%)
261 (100%)
POST GRADUATE 21 (87.5%)
3 (12.5)
24 (100%)
TOTAL 1741 (58%)
1259 (42%)
3000
The above table shows the education level and the awareness towards air pollution
of respondents in the sample size. Around two third of the sample size are metric
and about 49% percent of respondent are not aware about the air pollution effects.
Similarly in Intermediate level 31% are not aware from air pollution effects. Among
graduates and post graduates it has been found that the level of awareness about
the air pollution effects. It can be concluded that education can be a strong means of
creating awareness among people.
The above figure depicts
large number of respondent
compared to users of motor bikes/ Scooter
air pollution for a longer time
respondents using their own cars ar
more safe and less exposed to pollution during traveling. It is also evident that a
large number of respondent use public transport as a means of traveling. As these
public transports have to pass through th
stoppage time at traffic signals and
traveling by the means of this transport are exposed to greater vehicles emissions.
can also be concluded these public transport are
hence there is every chance of being
Number of Person
0
200
400
600
800
1000
1200
1400
Chapter – 4 -An Analysis of Cost Of Illness Of Air Pollution
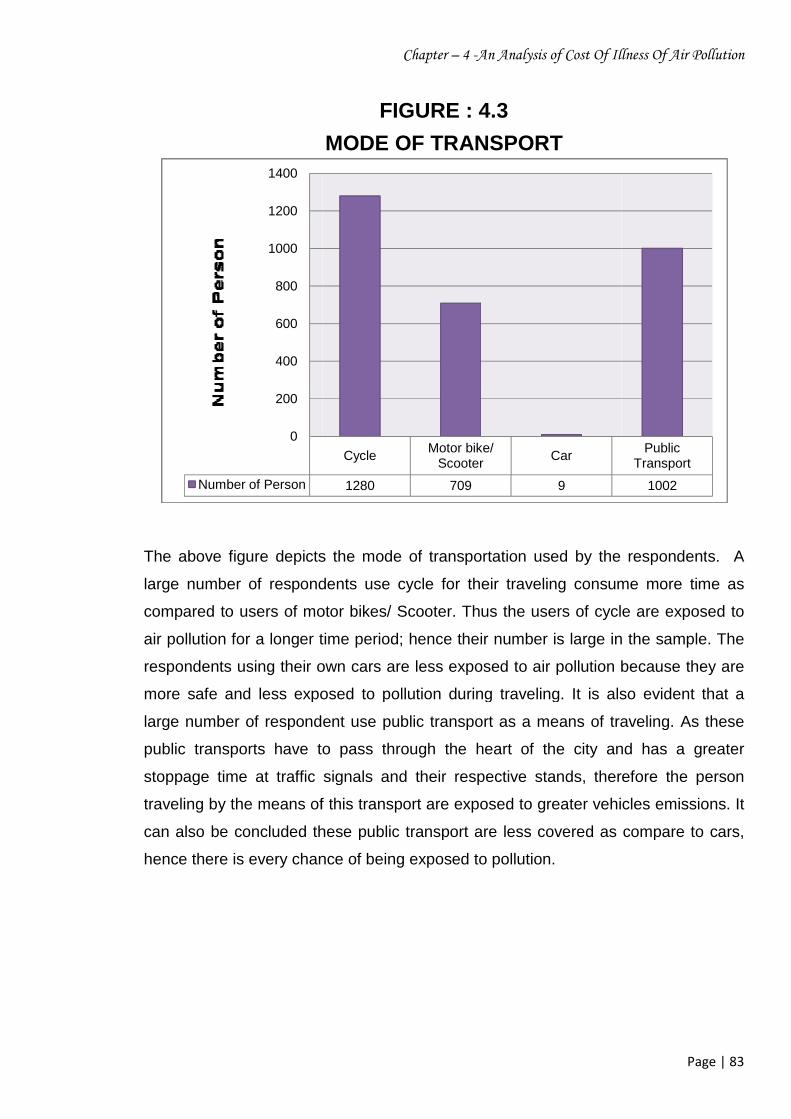
FIGURE : 4.3
MODE OF TRANSPORT
The above figure depicts the mode of transportation used by the respondent
large number of respondents use cycle for their traveling consume more
motor bikes/ Scooter. Thus the users of cycle are exposed to
air pollution for a longer time period; hence their number is large in the sample. The
respondents using their own cars are less exposed to air pollution because they are
more safe and less exposed to pollution during traveling. It is also evident that a
large number of respondent use public transport as a means of traveling. As these
have to pass through the heart of the city and has a greater
stoppage time at traffic signals and their respective stands, therefore the person
by the means of this transport are exposed to greater vehicles emissions.
can also be concluded these public transport are less covered as compare to cars,
there is every chance of being exposed to pollution.
CycleMotor bike/
ScooterCar
1280 709 9
f Cost Of Illness Of Air Pollution
Page | 83
used by the respondents. A
consume more time as
Thus the users of cycle are exposed to
hence their number is large in the sample. The
e less exposed to air pollution because they are
more safe and less exposed to pollution during traveling. It is also evident that a
large number of respondent use public transport as a means of traveling. As these
e heart of the city and has a greater
their respective stands, therefore the person
by the means of this transport are exposed to greater vehicles emissions. It
less covered as compare to cars,
Public Transport
1002
Chapter – 4 -An Analysis of Cost Of Illness Of Air Pollution
Page | 84
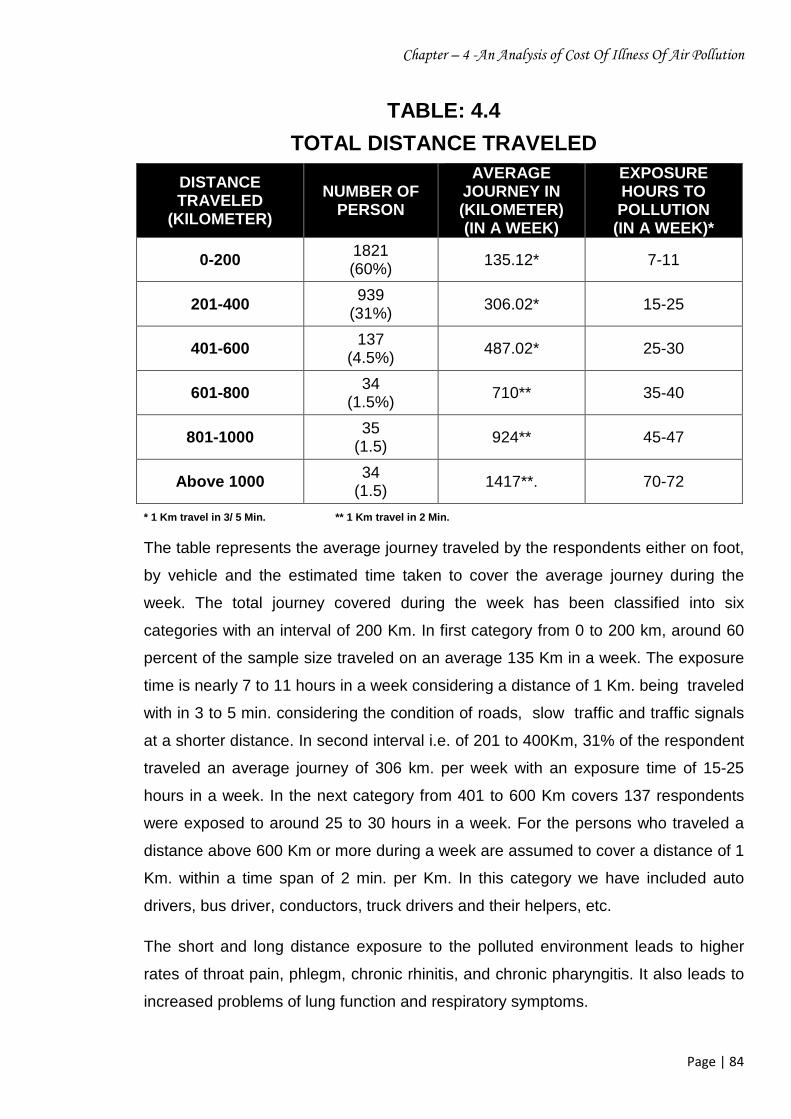
TABLE: 4.4
TOTAL DISTANCE TRAVELED
DISTANCE TRAVELED
(KILOMETER)
NUMBER OF PERSON
AVERAGE JOURNEY IN (KILOMETER) (IN A WEEK)
EXPOSURE HOURS TO POLLUTION (IN A WEEK)*
0-200 1821 (60%) 135.12* 7-11
201-400 939
(31%) 306.02* 15-25
401-600 137 (4.5%)
487.02* 25-30
601-800 34 (1.5%)
710** 35-40
801-1000 35 (1.5)
924** 45-47
Above 1000 34 (1.5)
1417**. 70-72
* 1 Km travel in 3/ 5 Min. ** 1 Km travel in 2 Min.
The table represents the average journey traveled by the respondents either on foot,
by vehicle and the estimated time taken to cover the average journey during the
week. The total journey covered during the week has been classified into six
categories with an interval of 200 Km. In first category from 0 to 200 km, around 60
percent of the sample size traveled on an average 135 Km in a week. The exposure
time is nearly 7 to 11 hours in a week considering a distance of 1 Km. being traveled
with in 3 to 5 min. considering the condition of roads, slow traffic and traffic signals
at a shorter distance. In second interval i.e. of 201 to 400Km, 31% of the respondent
traveled an average journey of 306 km. per week with an exposure time of 15-25
hours in a week. In the next category from 401 to 600 Km covers 137 respondents
were exposed to around 25 to 30 hours in a week. For the persons who traveled a
distance above 600 Km or more during a week are assumed to cover a distance of 1
Km. within a time span of 2 min. per Km. In this category we have included auto
drivers, bus driver, conductors, truck drivers and their helpers, etc.
The short and long distance exposure to the polluted environment leads to higher
rates of throat pain, phlegm, chronic rhinitis, and chronic pharyngitis. It also leads to
increased problems of lung function and respiratory symptoms.
Chapter – 4 -An Analysis of Cost Of Illness Of Air Pollution
Page | 85
The evidence supports an association between driving or being a passenger in a
vehicle and adverse health outcomes, there are several factors that influence the
degree and magnitude of this association. For example, different ages of vehicles
contribute differently to individual levels of exposure. Older and more poorly
maintained vehicles are typically associated with higher levels of emissions (White et
al. 2006). Time of day of travel also has an influencing effect on exposure to vehicle
emissions. There is evidence to suggest that exposure levels to CO and ultrafine
particle counts are highest during the morning and at lower levels later in the day,
increasing again in the early evening (Kaur et al. 2005b). However, it has been
suggested that this is due to the greater traffic density at this time of day, during
typical commute rush-hours resulting in a greater number of vehicles, possibly
travelling at a lower speed and emitting a higher concentration of pollutants. Longer
trip times have been associated with higher levels of exposure (Peace et al. 2004).
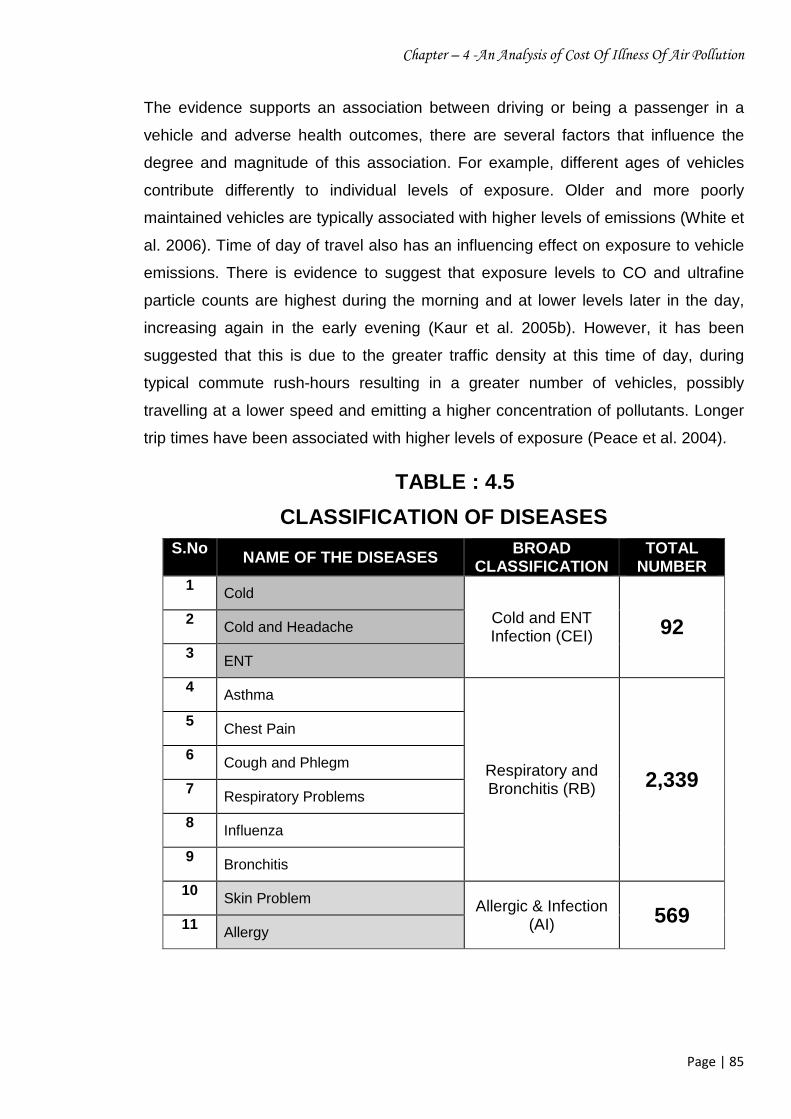
TABLE : 4.5
CLASSIFICATION OF DISEASES
S.No NAME OF THE DISEASES
BROAD CLASSIFICATION
TOTAL NUMBER
1 Cold
Cold and ENT Infection (CEI) 92 2 Cold and Headache
3 ENT
4 Asthma
Respiratory and Bronchitis (RB) 2,339
5 Chest Pain
6 Cough and Phlegm
7 Respiratory Problems
8 Influenza
9 Bronchitis
10 Skin Problem Allergic & Infection (AI) 569 11 Allergy
Chapter – 4 -An Analysis of Cost Of Illness Of Air Pollution
Page | 86
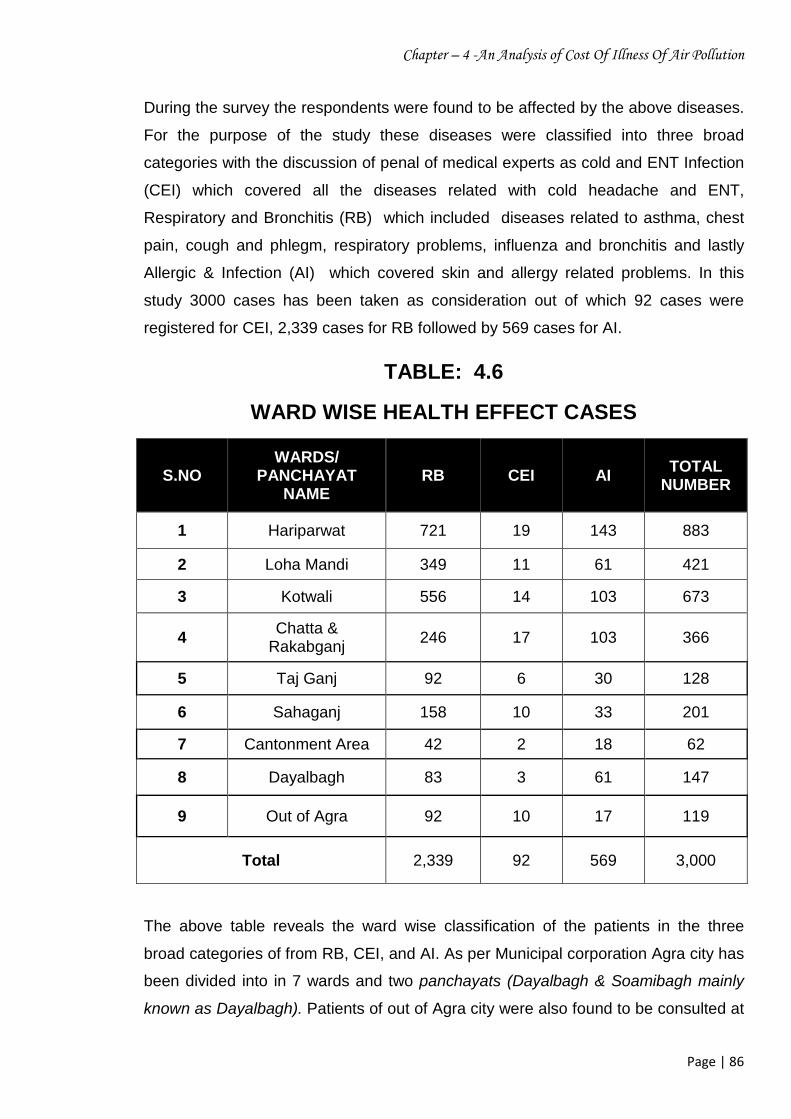
During the survey the respondents were found to be affected by the above diseases.
For the purpose of the study these diseases were classified into three broad
categories with the discussion of penal of medical experts as cold and ENT Infection
(CEI) which covered all the diseases related with cold headache and ENT,
Respiratory and Bronchitis (RB) which included diseases related to asthma, chest
pain, cough and phlegm, respiratory problems, influenza and bronchitis and lastly
Allergic & Infection (AI) which covered skin and allergy related problems. In this
study 3000 cases has been taken as consideration out of which 92 cases were
registered for CEI, 2,339 cases for RB followed by 569 cases for AI.
TABLE: 4.6
WARD WISE HEALTH EFFECT CASES
S.NO WARDS/
PANCHAYAT NAME
RB CEI AI TOTAL NUMBER
1 Hariparwat 721 19 143 883
2 Loha Mandi 349 11 61 421
3 Kotwali 556 14 103 673
4 Chatta &
Rakabganj 246 17 103 366
5 Taj Ganj 92 6 30 128
6 Sahaganj 158 10 33 201
7 Cantonment Area 42 2 18 62
8 Dayalbagh 83 3 61 147
9 Out of Agra 92 10 17 119
Total 2,339 92 569 3,000
The above table reveals the ward wise classification of the patients in the three
broad categories of from RB, CEI, and AI. As per Municipal corporation Agra city has
been divided into in 7 wards and two panchayats (Dayalbagh & Soamibagh mainly
known as Dayalbagh). Patients of out of Agra city were also found to be consulted at
Chapter – 4 -An Analysis of Cost Of Illness Of Air Pollution
Page | 87
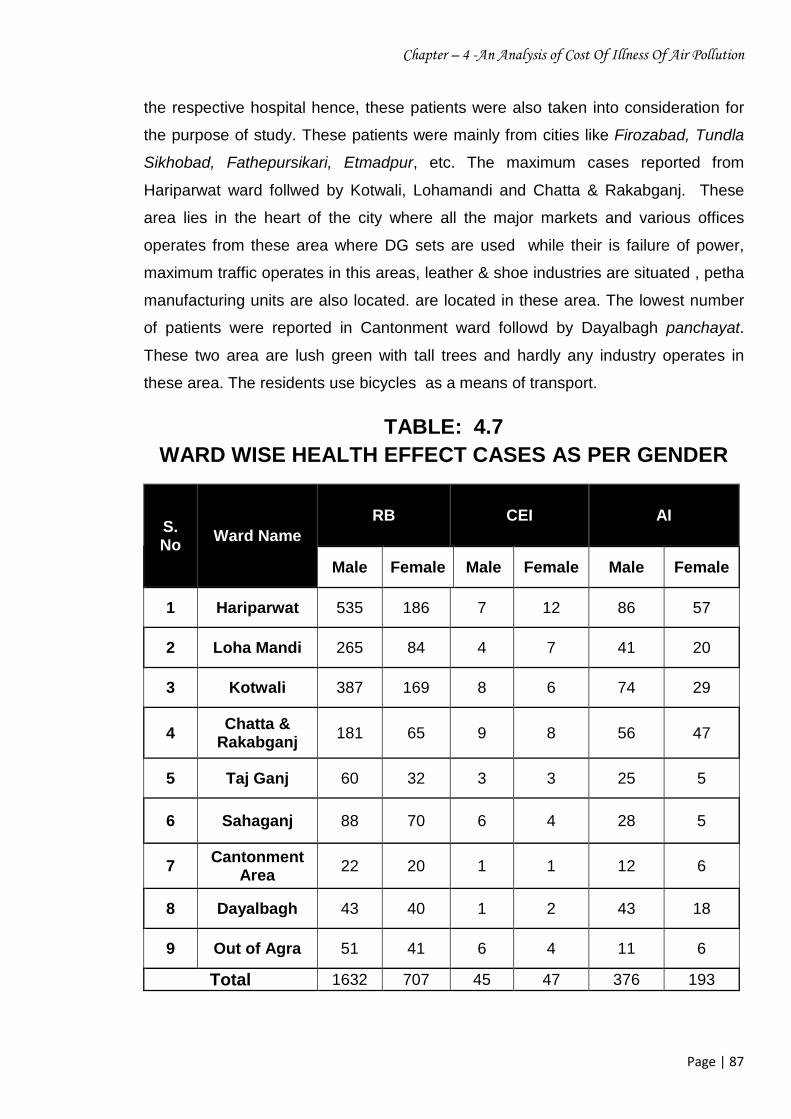
the respective hospital hence, these patients were also taken into consideration for
the purpose of study. These patients were mainly from cities like Firozabad, Tundla
Sikhobad, Fathepursikari, Etmadpur, etc. The maximum cases reported from
Hariparwat ward follwed by Kotwali, Lohamandi and Chatta & Rakabganj. These
area lies in the heart of the city where all the major markets and various offices
operates from these area where DG sets are used while their is failure of power,
maximum traffic operates in this areas, leather & shoe industries are situated , petha
manufacturing units are also located. are located in these area. The lowest number
of patients were reported in Cantonment ward followd by Dayalbagh panchayat.
These two area are lush green with tall trees and hardly any industry operates in
these area. The residents use bicycles as a means of transport.
TABLE: 4.7 WARD WISE HEALTH EFFECT CASES AS PER GENDER
S. No
Ward Name RB CEI AI
Male Female Male Female Male Female
1 Hariparwat 535 186 7 12 86 57
2 Loha Mandi 265 84 4 7 41 20
3 Kotwali 387 169 8 6 74 29
4 Chatta &
Rakabganj 181 65 9 8 56 47
5 Taj Ganj 60 32 3 3 25 5
6 Sahaganj 88 70 6 4 28 5
7 Cantonment Area
22 20 1 1 12 6
8 Dayalbagh 43 40 1 2 43 18
9 Out of Agra 51 41 6 4 11 6
Total 1632 707 45 47 376 193
Chapter – 4 -An Analysis of Cost Of Illness Of Air Pollution
Page | 88
The above table shows the gender wise classification of respondents in different
wards and panchayat. In all the wards the number of males are more than females,
which clearly shows that the males are more exposed to the polluted environment
than females. The highest number of males were registered in Haripawat followed by
Kotwali, Lohamandi and Chatta & Rakabganj were a large number of males from the
city live and are employed. In these wards the level of pollution is very high due to
the reason stated above.
POLLUTION AND HEALTH EFFECTS
The link between pollution and health is both a complex and contingent process. For
pollutants to have an effect on health, susceptible individuals must receive doses of
the pollutant, or its decomposition products, sufficient to trigger detectable
symptoms. For this to occur, these individuals must have been exposed to the
pollutant, often over relatively long periods of time or on repeated occasions. Such
exposures require that the susceptible individuals and pollutants shared the same
environments at the same time. For this to happen, the pollutants must not only be
released into the environment, but then be dispersed through it in media used by, or
accessible to, humans. Health consequences of environmental pollution are thus far
from inevitable, even for pollutants that are inherently toxic; they depend on the
coincidence of both the emission and dispersion processes that determine where
and when the pollutant occurs in the environment, and the human behaviours that
determine where and when they occupy those same locations (Briggs D, 2003)1.
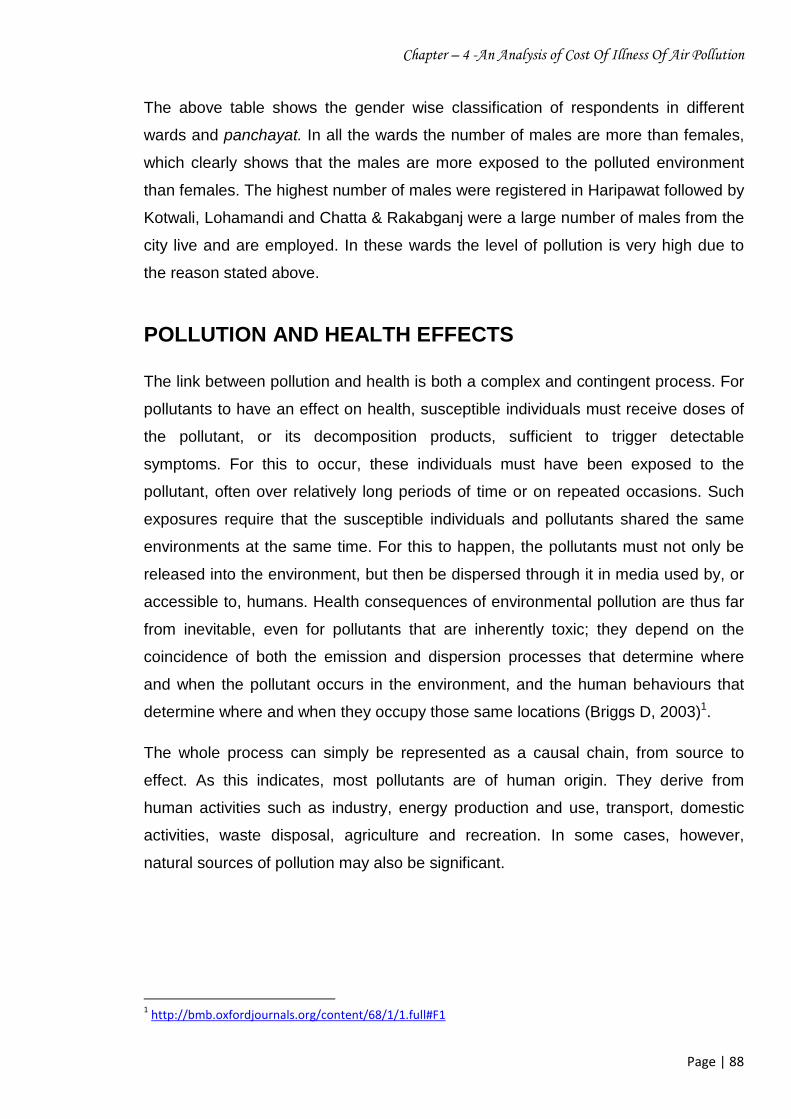
The whole process can simply be represented as a causal chain, from source to
effect. As this indicates, most pollutants are of human origin. They derive from
human activities such as industry, energy production and use, transport, domestic
activities, waste disposal, agriculture and recreation. In some cases, however,
natural sources of pollution may also be significant.
1 http://bmb.oxfordjournals.org/content/68/1/1.full#F1
SOURCE OF AIR POLLUTION AND ITS EFFECTS
Source: Br Med Bull (2003) 68
COST ANALYSIS OF
On the basis of the past studies
PM10 and TSPM on various diseases has been classified for the purpose of
under three broad categories of Cold and ENT Infection
Bronchitis (RB) and Allergic and
In order to assess the monetary burden of the illnesses the cost of illness (COI)
approach has been adopted which is based on accounting of cost. The cost
approach measures both direct and indirect cost of illness. The direct cost
represents direct medical cost and direct non medical cost. Direct medical cost
includes expenditure incurred on
hematology, radiology, cytology
consultation fees through not charged for the patients directly, but are assumed to be
Chapter – 4 -An Analysis of Cost Of Illness Of Air Pollution
FIGURE 4.4
SOURCE OF AIR POLLUTION AND ITS EFFECTS
68 (1): 1-24. doi: 10.1093/bmb/ldg019
COST ANALYSIS OF AIR POLLUTION ON HUMAN HEALTH
On the basis of the past studies the effect of the selected pollutant namely SO
and TSPM on various diseases has been classified for the purpose of
under three broad categories of Cold and ENT Infection (CEI), Respiratory and
ronchitis (RB) and Allergic and Infection (AI).
In order to assess the monetary burden of the illnesses the cost of illness (COI)
approach has been adopted which is based on accounting of cost. The cost
both direct and indirect cost of illness. The direct cost
represents direct medical cost and direct non medical cost. Direct medical cost
includes expenditure incurred on medicines and drugs, diagnostics test related to
hematology, radiology, cytology and pathology test and consultation fees. The
consultation fees through not charged for the patients directly, but are assumed to be
f Cost Of Illness Of Air Pollution
Page | 89
SOURCE OF AIR POLLUTION AND ITS EFFECTS
AIR POLLUTION ON HUMAN HEALTH
of the selected pollutant namely SO2, NO2,
and TSPM on various diseases has been classified for the purpose of the study
(CEI), Respiratory and
In order to assess the monetary burden of the illnesses the cost of illness (COI)
approach has been adopted which is based on accounting of cost. The cost of illness
both direct and indirect cost of illness. The direct cost
represents direct medical cost and direct non medical cost. Direct medical cost
medicines and drugs, diagnostics test related to
and pathology test and consultation fees. The
consultation fees through not charged for the patients directly, but are assumed to be
Chapter – 4 -An Analysis of Cost Of Illness Of Air Pollution
Page | 90
a burden to the government in form of salary being paid to the experts (doctors).
Hence half of the fees charged generally by private doctor medical practitioners has
been taken as the cost of treatment and has been included in direct medical cost,
medicines, etc. The cost of medicine and drugs was considered on the basis as
prescribed in the prescription and the prices of medicines and drugs as reported by
the retailer. The practitioners provided the list of the drugs and duration of the
treatment. The cost of laboratory was considered as the average cost of five test
centers near to the hospitals. Direct non medical cost includes expenditures incurred
on transportation, lodging, and meals during treatment and recovery. The direct non
medical cost was taken to be the approximate cost as stated by the patient. Indirect
costs represent cost for which no expenses were incurred but are associated with
illness. This can be defined as the value of production lost to society due to
temporary absence from work caused by illness. The cost of productivity lost has
been determined by considering as per day income and the number of day lost due
to sickness of the patient. For determining the number of days lost in the age group
of 0 to 25 and 60 and above, the number of days lost by the accompanying person
and their earnings (if any) has been taken into consideration.
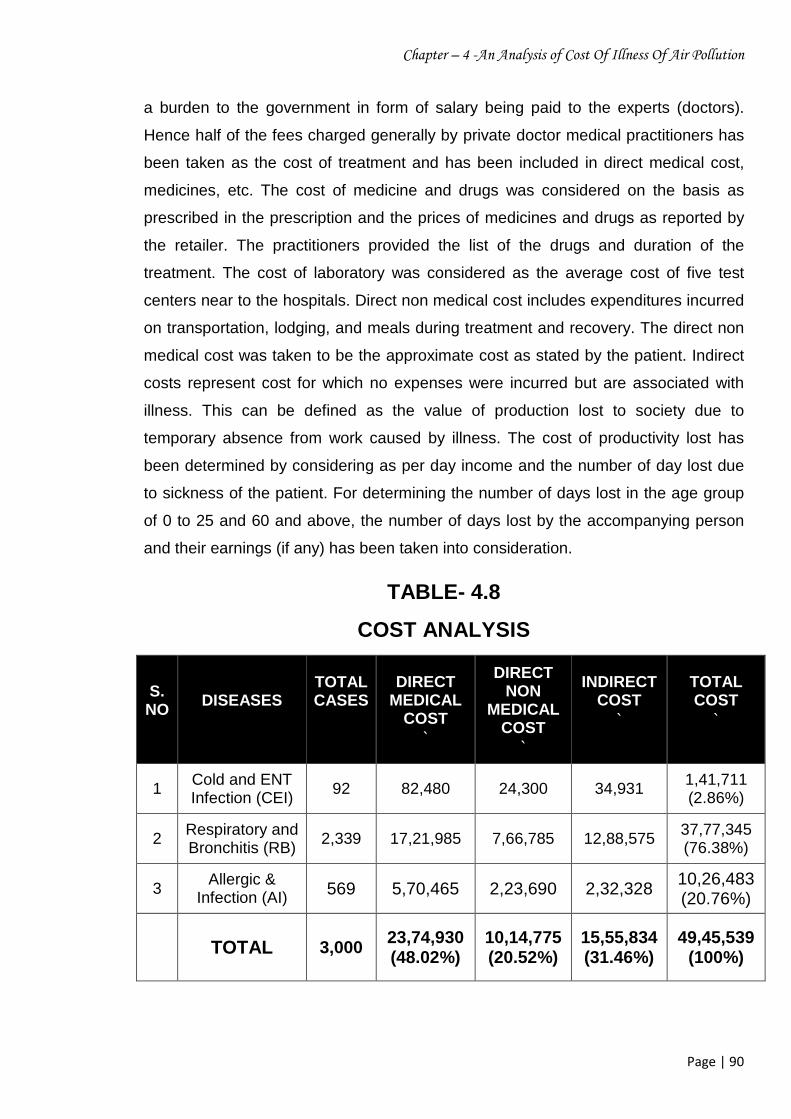
TABLE- 4.8
COST ANALYSIS
S. NO
DISEASES
TOTAL CASES
DIRECT MEDICAL
COST ` DIRECT
NON MEDICAL
COST ` INDIRECT
COST `
TOTAL COST `
1 Cold and ENT Infection (CEI)
92 82,480 24,300 34,931 1,41,711 (2.86%)
2 Respiratory and Bronchitis (RB)
2,339 17,21,985 7,66,785 12,88,575 37,77,345 (76.38%)
3 Allergic &
Infection (AI) 569 5,70,465 2,23,690 2,32,328 10,26,483 (20.76%)
TOTAL 3,000 23,74,930 (48.02%)
10,14,775 (20.52%)
15,55,834 (31.46%)
49,45,539 (100%)
Chapter – 4 -An Analysis of Cost Of Illness Of Air Pollution
Page | 91
The per episode total economic cost of the health affects during the period under the
study for all diseases resulted from the various pollutants is estimated to be INR ` 49,45,539/- On comparing the economic cost of air pollution of various diseases,
RB accounted for a higher economic cost INR ` 37,77,345/- being 76.38% of the
total cost. The economic cost of AI INR ` 10, 26,483/- as compared to RB are much
lower being 20.76% of the total cost. The economic cost of CEI INR ` 1,41,711/-
being 2.86% of the total cost which is very insignificant as compared to other
diseases.
On comparing the economic cost of the air pollution on the basis of direct and
indirect cost component of COI it has been found that the direct medical cost
estimated to be 48.02% of the total cost followed by indirect cost being 31.46% of
the total cost.
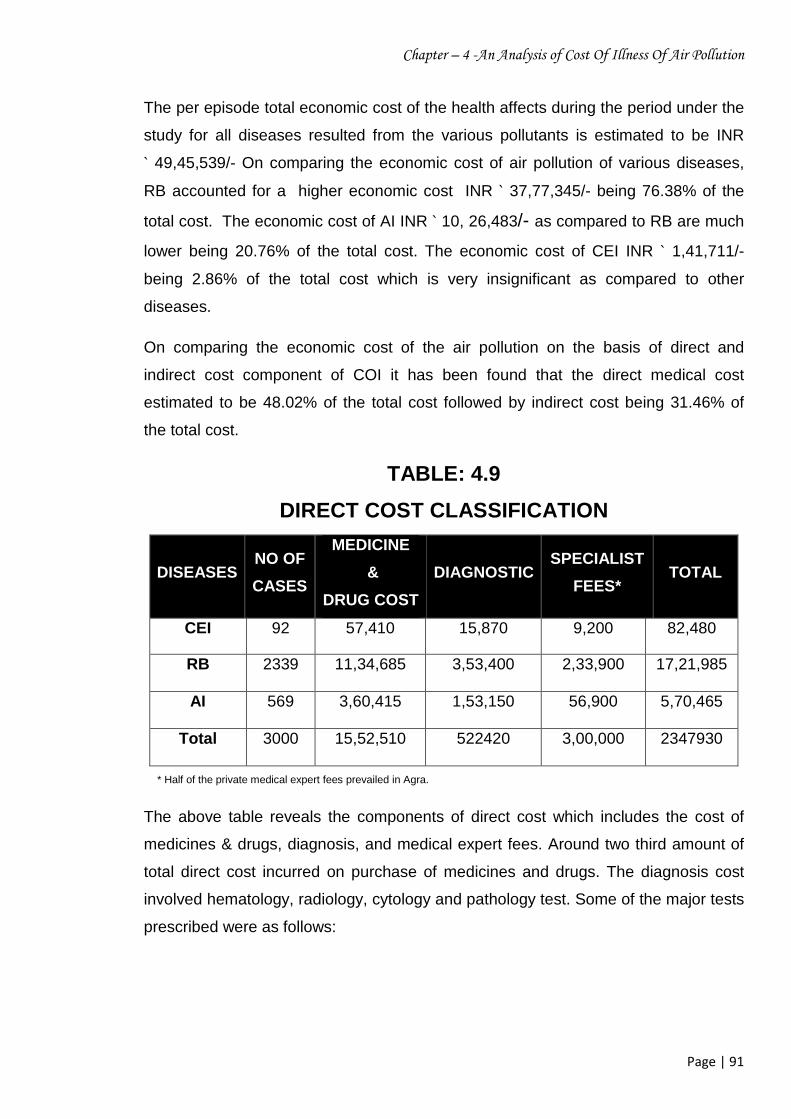
TABLE: 4.9
DIRECT COST CLASSIFICATION
DISEASES NO OF
CASES
MEDICINE
&
DRUG COST
DIAGNOSTIC SPECIALIST
FEES* TOTAL
CEI 92 57,410 15,870 9,200 82,480
RB 2339 11,34,685 3,53,400 2,33,900 17,21,985
AI 569 3,60,415 1,53,150 56,900 5,70,465
Total 3000 15,52,510 522420 3,00,000 2347930
* Half of the private medical expert fees prevailed in Agra.
The above table reveals the components of direct cost which includes the cost of
medicines & drugs, diagnosis, and medical expert fees. Around two third amount of
total direct cost incurred on purchase of medicines and drugs. The diagnosis cost
involved hematology, radiology, cytology and pathology test. Some of the major tests
prescribed were as follows:
Chapter – 4 -An Analysis of Cost Of Illness Of Air Pollution
Page | 92
· RB Spirometry (to asses lungs function),Peak flow meter test ( to asses lungs
function), Sputum examination(for Grams staining &A.F.B.) Echo-cardiograph.
Sleep Test (for snoring & apnoea)
· AI Skin allergy Tests(by multiple pricks over skin of fore arms)
· CEI, X-ray P.N.S.(for paranasal sinus), CT.Scan & MRI. (Chest PNS & Ears)
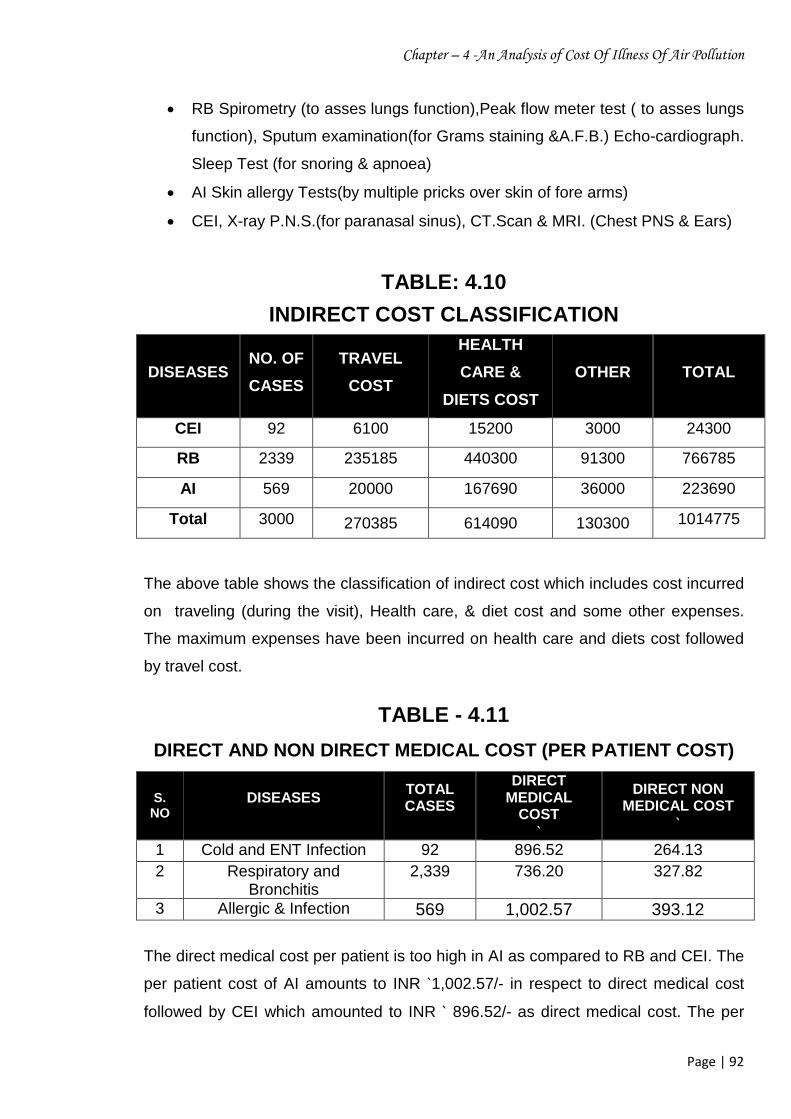
TABLE: 4.10
INDIRECT COST CLASSIFICATION
DISEASES NO. OF
CASES
TRAVEL
COST
HEALTH
CARE &
DIETS COST
OTHER TOTAL
CEI 92 6100 15200 3000 24300
RB 2339 235185 440300 91300 766785
AI 569 20000 167690 36000 223690
Total 3000 270385 614090 130300 1014775
The above table shows the classification of indirect cost which includes cost incurred
on traveling (during the visit), Health care, & diet cost and some other expenses.
The maximum expenses have been incurred on health care and diets cost followed
by travel cost.
TABLE - 4.11
DIRECT AND NON DIRECT MEDICAL COST (PER PATIENT COST)
The direct medical cost per patient is too high in AI as compared to RB and CEI. The
per patient cost of AI amounts to INR `1,002.57/- in respect to direct medical cost
followed by CEI which amounted to INR ` 896.52/- as direct medical cost. The per
S. NO
DISEASES
TOTAL CASES
DIRECT MEDICAL
COST ` DIRECT NON
MEDICAL COST ` 1 Cold and ENT Infection 92 896.52 264.13 2 Respiratory and
Bronchitis 2,339 736.20 327.82
3 Allergic & Infection 569 1,002.57 393.12
Chapter – 4 -An Analysis of Cost Of Illness Of Air Pollution
Page | 93
patient non medical cost was higher in AI which amounted to INR ` 393.12/- followed
by RB which accounted to INR ` 327.82/-. Thus the total direct cost of treatment of AI
diseases appears to be more costly as compared to other diseases due to costly
medicine and tests.
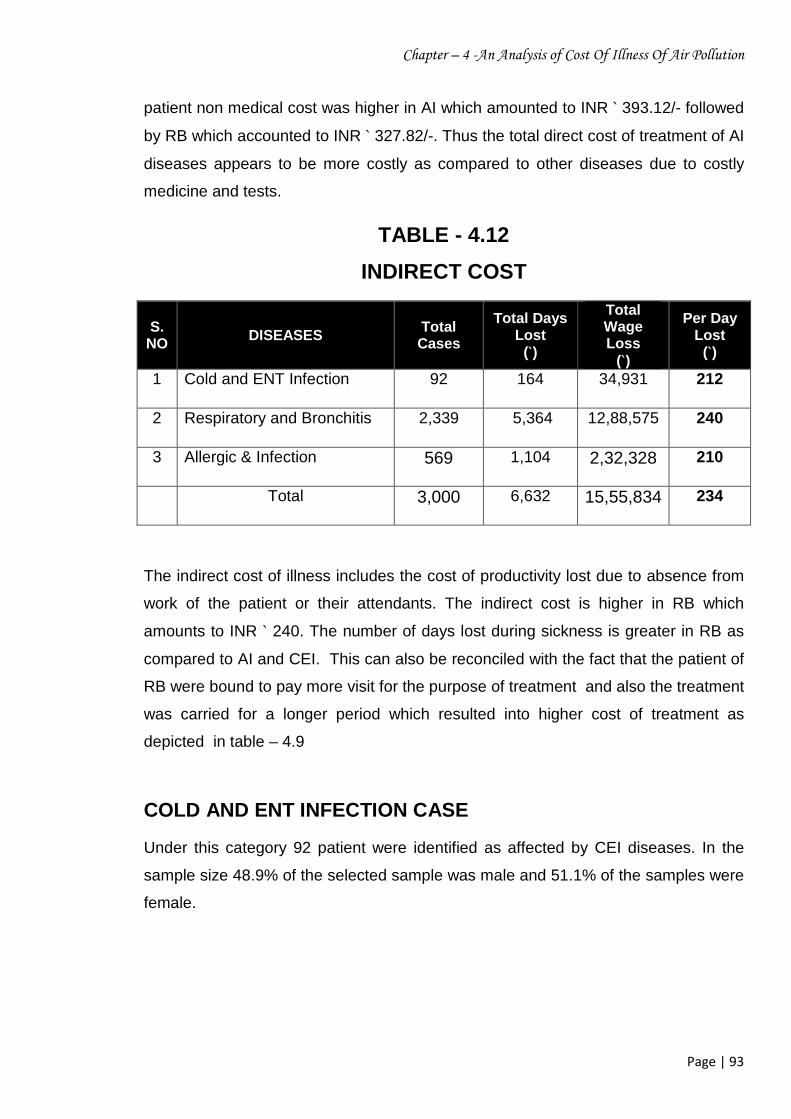
TABLE - 4.12
INDIRECT COST
The indirect cost of illness includes the cost of productivity lost due to absence from
work of the patient or their attendants. The indirect cost is higher in RB which
amounts to INR ` 240. The number of days lost during sickness is greater in RB as
compared to AI and CEI. This can also be reconciled with the fact that the patient of
RB were bound to pay more visit for the purpose of treatment and also the treatment
was carried for a longer period which resulted into higher cost of treatment as
depicted in table – 4.9
COLD AND ENT INFECTION CASE
Under this category 92 patient were identified as affected by CEI diseases. In the
sample size 48.9% of the selected sample was male and 51.1% of the samples were
female.
S. NO DISEASES
Total Cases
Total Days Lost
(`) Total Wage Loss
(`) Per Day
Lost (`)
1 Cold and ENT Infection 92 164 34,931 212
2 Respiratory and Bronchitis 2,339 5,364 12,88,575 240
3 Allergic & Infection 569 1,104 2,32,328 210
Total 3,000 6,632 15,55,834 234
Chapter – 4 -An Analysis of Cost Of Illness Of Air Pollution
Page | 94
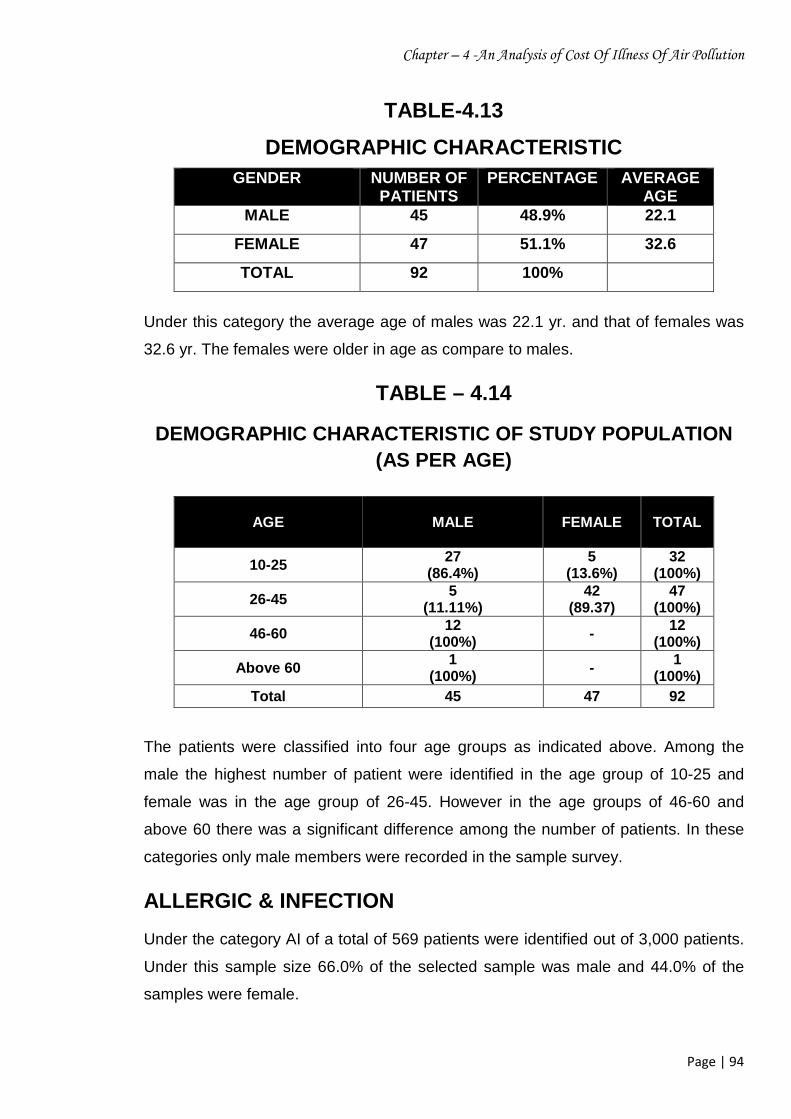
TABLE-4.13
DEMOGRAPHIC CHARACTERISTIC
Under this category the average age of males was 22.1 yr. and that of females was
32.6 yr. The females were older in age as compare to males.
TABLE – 4.14
DEMOGRAPHIC CHARACTERISTIC OF STUDY POPULATION (AS PER AGE)
The patients were classified into four age groups as indicated above. Among the
male the highest number of patient were identified in the age group of 10-25 and
female was in the age group of 26-45. However in the age groups of 46-60 and
above 60 there was a significant difference among the number of patients. In these
categories only male members were recorded in the sample survey.
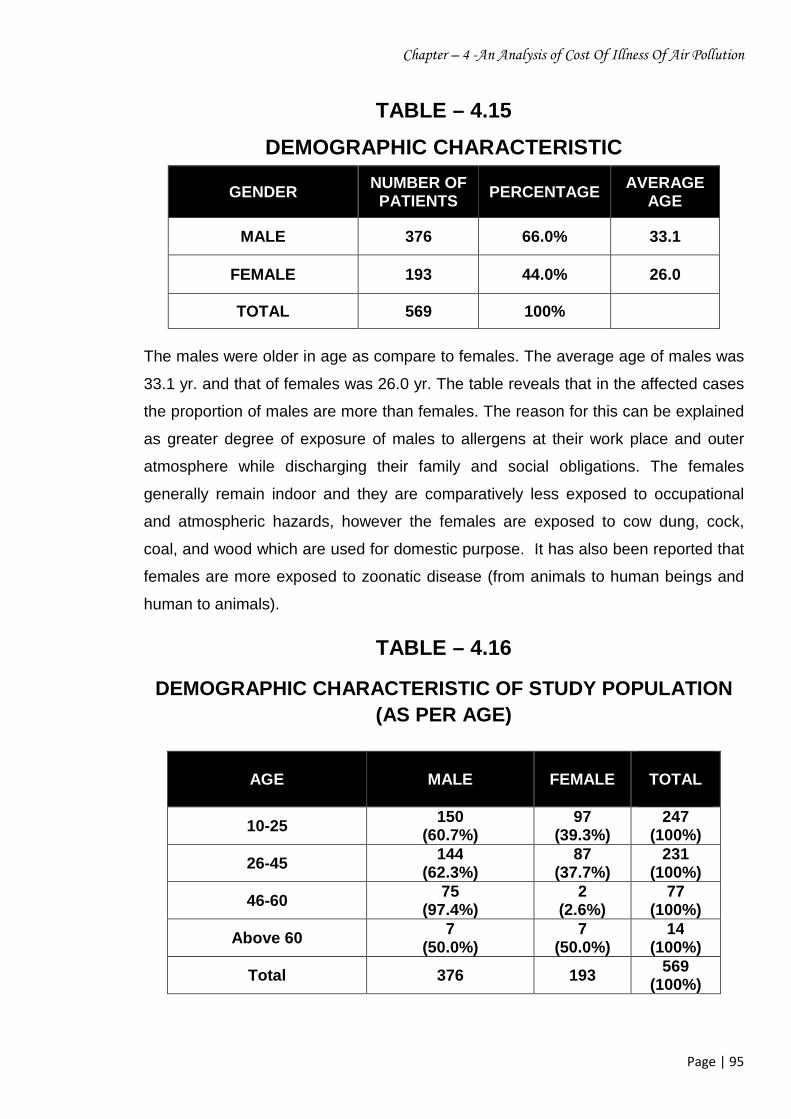
ALLERGIC & INFECTION
Under the category AI of a total of 569 patients were identified out of 3,000 patients.
Under this sample size 66.0% of the selected sample was male and 44.0% of the
samples were female.
GENDER NUMBER OF PATIENTS
PERCENTAGE AVERAGE AGE
MALE 45 48.9% 22.1
FEMALE 47 51.1% 32.6
TOTAL 92 100%
AGE MALE FEMALE
TOTAL
10-25 27
(86.4%) 5
(13.6%) 32
(100%)
26-45 5
(11.11%) 42
(89.37) 47
(100%)
46-60 12
(100%) - 12
(100%)
Above 60 1
(100%) - 1
(100%) Total 45 47 92
Chapter – 4 -An Analysis of Cost Of Illness Of Air Pollution
Page | 95
TABLE – 4.15
DEMOGRAPHIC CHARACTERISTIC
The males were older in age as compare to females. The average age of males was
33.1 yr. and that of females was 26.0 yr. The table reveals that in the affected cases
the proportion of males are more than females. The reason for this can be explained
as greater degree of exposure of males to allergens at their work place and outer
atmosphere while discharging their family and social obligations. The females
generally remain indoor and they are comparatively less exposed to occupational
and atmospheric hazards, however the females are exposed to cow dung, cock,
coal, and wood which are used for domestic purpose. It has also been reported that
females are more exposed to zoonatic disease (from animals to human beings and
human to animals).
TABLE – 4.16
DEMOGRAPHIC CHARACTERISTIC OF STUDY POPULATION (AS PER AGE)
GENDER NUMBER OF PATIENTS PERCENTAGE
AVERAGE AGE
MALE 376 66.0% 33.1
FEMALE 193 44.0% 26.0
TOTAL 569 100%
AGE MALE FEMALE
TOTAL
10-25 150
(60.7%) 97
(39.3%) 247
(100%)
26-45 144
(62.3%) 87
(37.7%) 231
(100%)
46-60 75
(97.4%) 2
(2.6%) 77
(100%)
Above 60 7 (50.0%)
7 (50.0%)
14 (100%)
Total 376 193 569 (100%)
Chapter – 4 -An Analysis of Cost Of Illness Of Air Pollution
Page | 96
Under this category the highest number of male patient were identified in the age
group of 10-25 similar was in the case of females. The next to follow were the
patients in the age group of 26- 45 for both male and females. However in the age
group of 46-60 there was a significant difference among the number of patients
affected due to pollution in the category of males and females. In this category
97.4% were males and 2.6% were females.
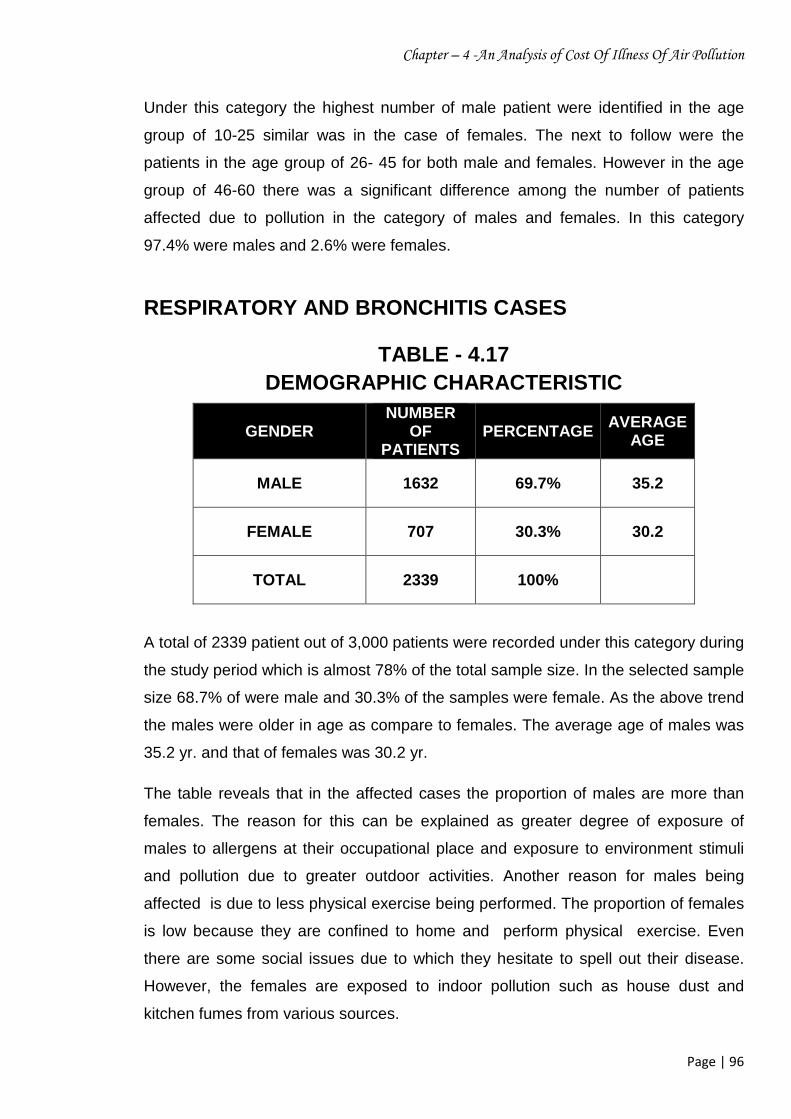
RESPIRATORY AND BRONCHITIS CASES
TABLE - 4.17 DEMOGRAPHIC CHARACTERISTIC
A total of 2339 patient out of 3,000 patients were recorded under this category during
the study period which is almost 78% of the total sample size. In the selected sample
size 68.7% of were male and 30.3% of the samples were female. As the above trend
the males were older in age as compare to females. The average age of males was
35.2 yr. and that of females was 30.2 yr.
The table reveals that in the affected cases the proportion of males are more than
females. The reason for this can be explained as greater degree of exposure of
males to allergens at their occupational place and exposure to environment stimuli
and pollution due to greater outdoor activities. Another reason for males being
affected is due to less physical exercise being performed. The proportion of females
is low because they are confined to home and perform physical exercise. Even
there are some social issues due to which they hesitate to spell out their disease.
However, the females are exposed to indoor pollution such as house dust and
kitchen fumes from various sources.
GENDER NUMBER
OF PATIENTS
PERCENTAGE AVERAGE
AGE
MALE 1632 69.7% 35.2
FEMALE 707 30.3% 30.2
TOTAL 2339 100%
Chapter – 4 -An Analysis of Cost Of Illness Of Air Pollution
Page | 97
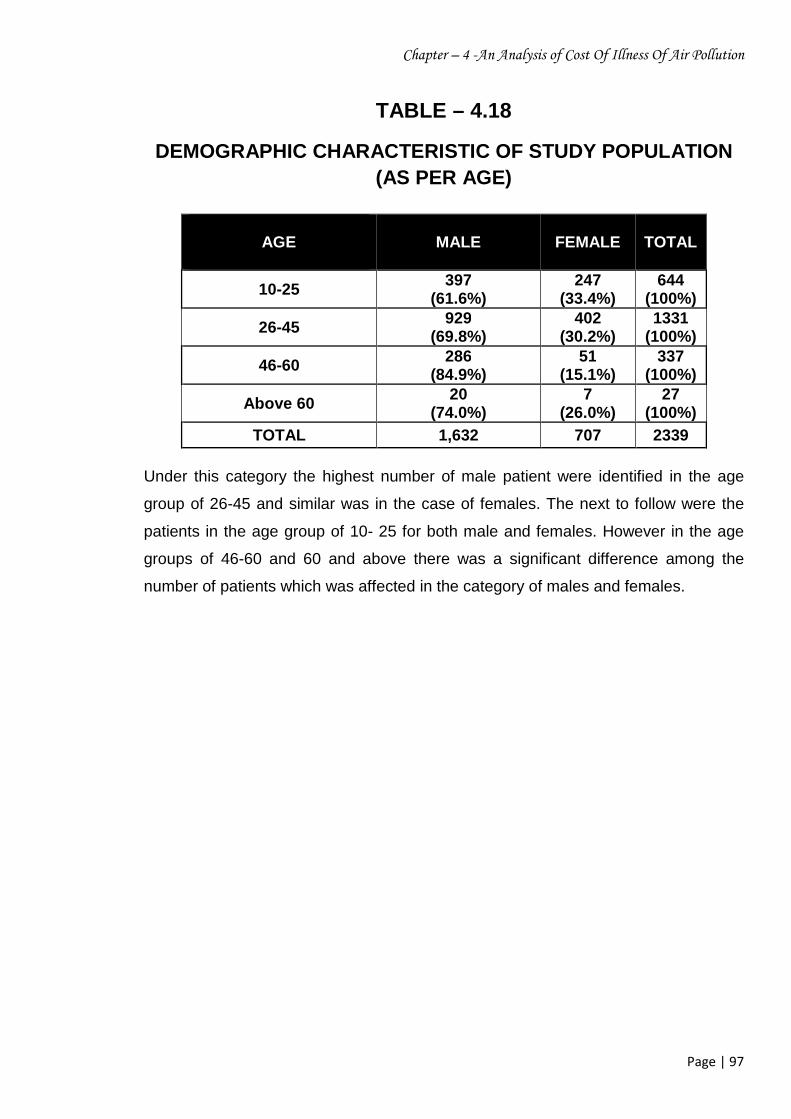
TABLE – 4.18
DEMOGRAPHIC CHARACTERISTIC OF STUDY POPULATION (AS PER AGE)
Under this category the highest number of male patient were identified in the age
group of 26-45 and similar was in the case of females. The next to follow were the
patients in the age group of 10- 25 for both male and females. However in the age
groups of 46-60 and 60 and above there was a significant difference among the
number of patients which was affected in the category of males and females.
AGE
MALE FEMALE TOTAL
10-25 397
(61.6%) 247
(33.4%) 644
(100%)
26-45 929
(69.8%) 402
(30.2%) 1331
(100%)
46-60 286 (84.9%)
51 (15.1%)
337 (100%)
Above 60 20
(74.0%) 7
(26.0%) 27
(100%) TOTAL 1,632 707 2339
Chapter – 4 -An Analysis of Cost Of Illness Of Air Pollution
Page | 98
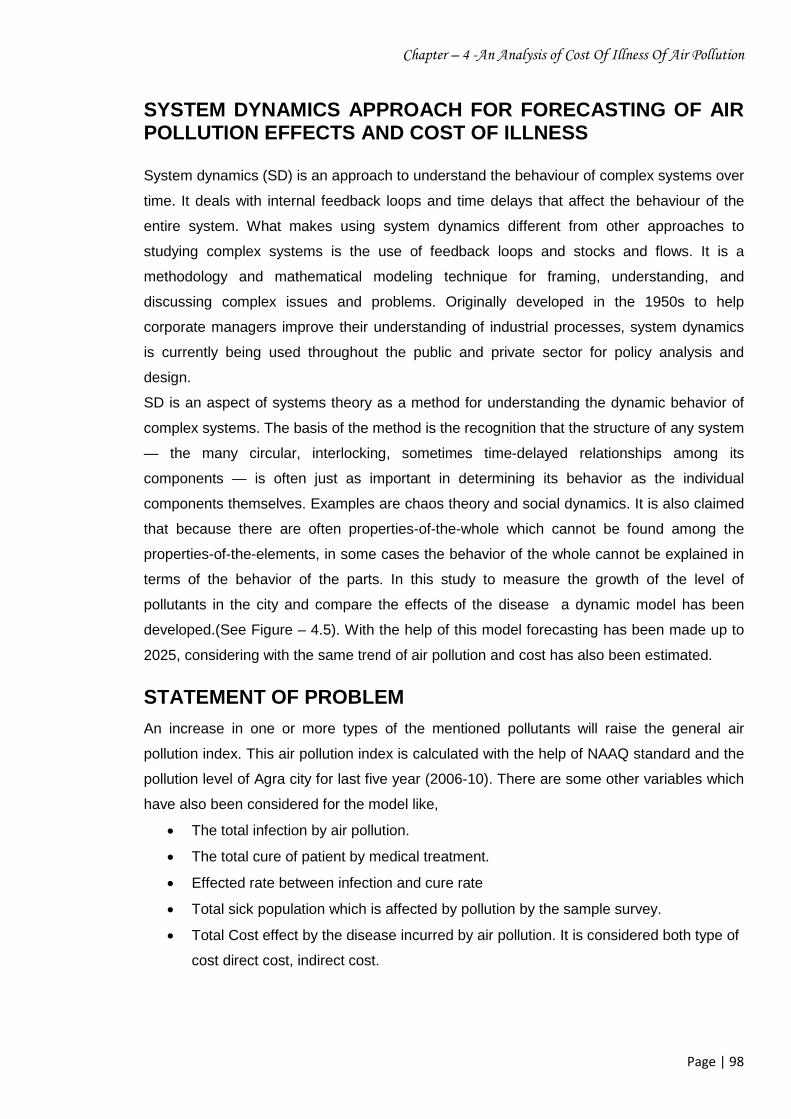
SYSTEM DYNAMICS APPROACH FOR FORECASTING OF AIR POLLUTION EFFECTS AND COST OF ILLNESS System dynamics (SD) is an approach to understand the behaviour of complex systems over
time. It deals with internal feedback loops and time delays that affect the behaviour of the
entire system. What makes using system dynamics different from other approaches to
studying complex systems is the use of feedback loops and stocks and flows. It is a
methodology and mathematical modeling technique for framing, understanding, and
discussing complex issues and problems. Originally developed in the 1950s to help
corporate managers improve their understanding of industrial processes, system dynamics
is currently being used throughout the public and private sector for policy analysis and
design.
SD is an aspect of systems theory as a method for understanding the dynamic behavior of
complex systems. The basis of the method is the recognition that the structure of any system
— the many circular, interlocking, sometimes time-delayed relationships among its
components — is often just as important in determining its behavior as the individual
components themselves. Examples are chaos theory and social dynamics. It is also claimed
that because there are often properties-of-the-whole which cannot be found among the
properties-of-the-elements, in some cases the behavior of the whole cannot be explained in
terms of the behavior of the parts. In this study to measure the growth of the level of
pollutants in the city and compare the effects of the disease a dynamic model has been
developed.(See Figure – 4.5). With the help of this model forecasting has been made up to
2025, considering with the same trend of air pollution and cost has also been estimated.
STATEMENT OF PROBLEM
An increase in one or more types of the mentioned pollutants will raise the general air
pollution index. This air pollution index is calculated with the help of NAAQ standard and the
pollution level of Agra city for last five year (2006-10). There are some other variables which
have also been considered for the model like,
· The total infection by air pollution.
· The total cure of patient by medical treatment.
· Effected rate between infection and cure rate
· Total sick population which is affected by pollution by the sample survey.
· Total Cost effect by the disease incurred by air pollution. It is considered both type of
cost direct cost, indirect cost.
Chapter – 4 -An Analysis of Cost Of Illness Of Air Pollution
Page | 76
SO2 Growth Rate NO2 Growth Rate PM10 Growth Rate TSPM Growth Rate
Total Cost
SO2 NO2 PM10 TSPM
SO2 Level NO2 Level PM10 Level TSPM Level
Air PollutionEffected
Rates-Cure Rates
Infection Rate+
Sick CaseCold &ENT
Sick CaseResp &Bronh.
Sick CaseAllergic &Infection
Initial case Cold& ENT
Initial caseResp. & Bronh
Initial CaseAllergic &Infection
Direct Cost Cold& ENT
Indirect CostCold & ENT
Direct CostResp& Bronh
Indirect CostResp& Bronh
Direct Cost Allergic& Infection
Indirect CostAllergic & Infection
Total CostCold & ENT
Total CostResp &Bronch.
Total Allergic& Infection
ProductivityLossCE
ProductivityLoss RB
ProductivityLoss AI
Chapter – 4 -An Analysis of Cost Of Illness Of Air Pollution
Page | 100
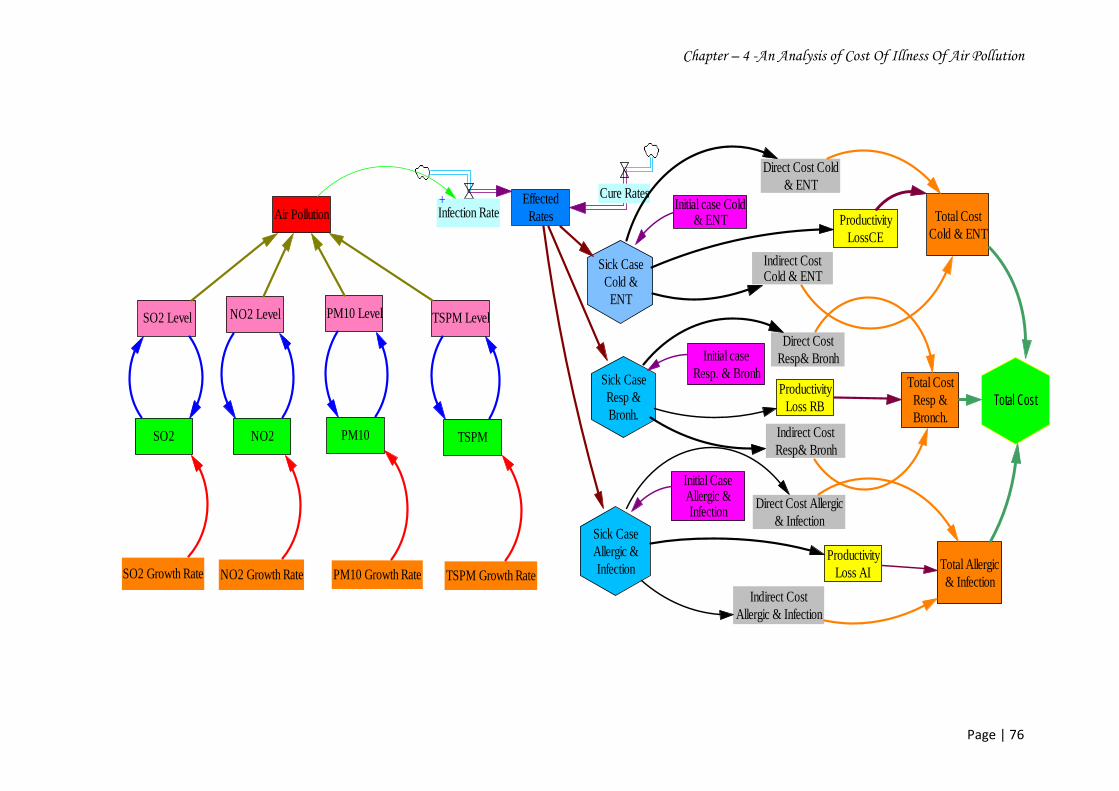
FIGURE 4.6 AIR POLLUTION LEVEL FROM 2011-2025
Air Pollution800
750
700
650
600
2011 2013 2015 2017 2019 2021 2023 2025Time (Month)
Ugm
3
Air Pollution : Current
SO2 Level7
6.25
5.5
4.75
42011 2013 2015 2017 2019 2021 2023 2025
Time (Month)
Ugm
3
SO2 Level : Current
PM10 Level300
250
200
150
100
2011 2013 2015 2017 2019 2021 2023 2025Time (Month)
Ug
m3
PM10 Level : Current
TSPM Level600
550
500
450
400
2011 2013 2015 2017 2019 2021 2023 2025Time (Month)
Ugm
3
TSPM Level : Current
NO2 Level24
23.5
23
22.5
22
2011 2013 2015 2017 2019 2021 2023 2025Time (Month)
Ug
m3
NO2 Level : Current
Chapter – 4 -An Analysis of Cost Of Illness Of Air Pollution
Page | 101
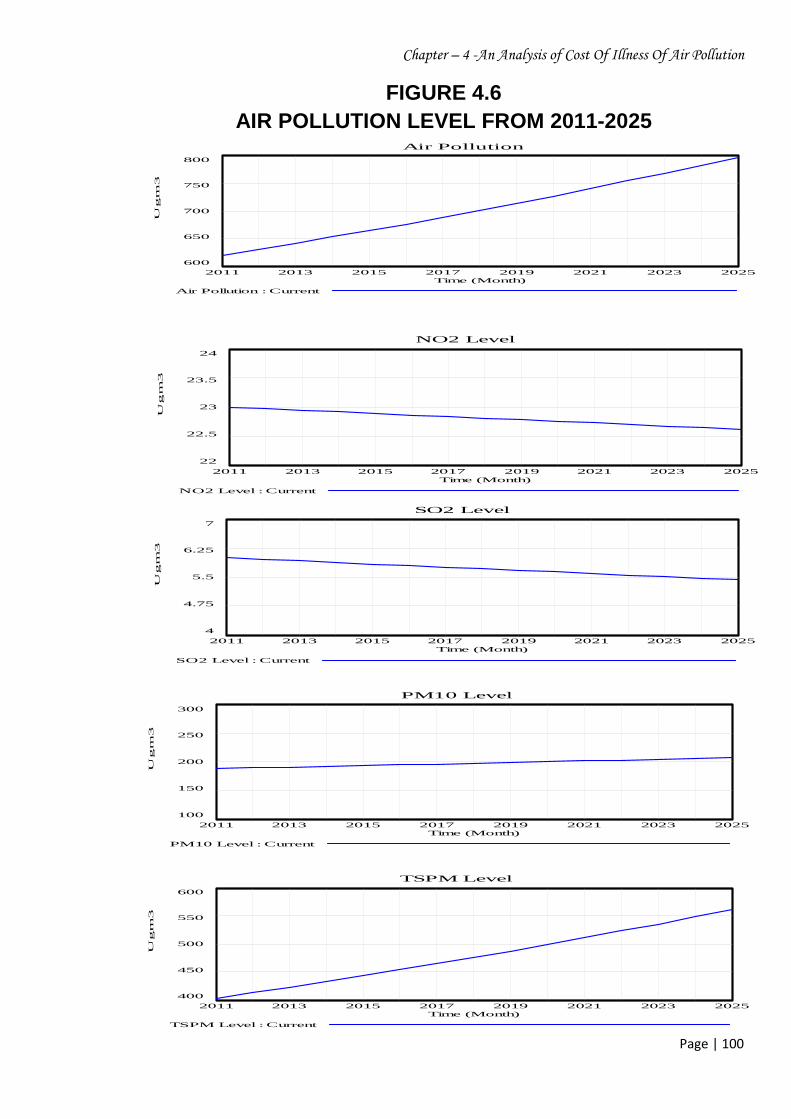
FIGURE 4.7 AIR POLLUTION EFFECT ON DIFFERENT DISEASES
Sick Case Cold & ENT200
175
150
125
100
2011 2013 2015 2017 2019 2021 2023 2025Time (Month)
peso
n
"Sick Case Cold & ENT" : Current
Sick Case Resp & Bronh.2,500
2,475
2,450
2,425
2,4002011 2013 2015 2017 2019 2021 2023 2025
Time (Month)
peso
n
"Sick Case Resp & Bronh." : Current
Sick Case Allergic & Infection700
675
650
625
600
2011 2013 2015 2017 2019 2021 2023 2025Time (Month)
pes
on
"Sick Case Allergic & Infection" : Current
Chapter – 4 -An Analysis of Cost Of Illness Of Air Pollution
Page | 102
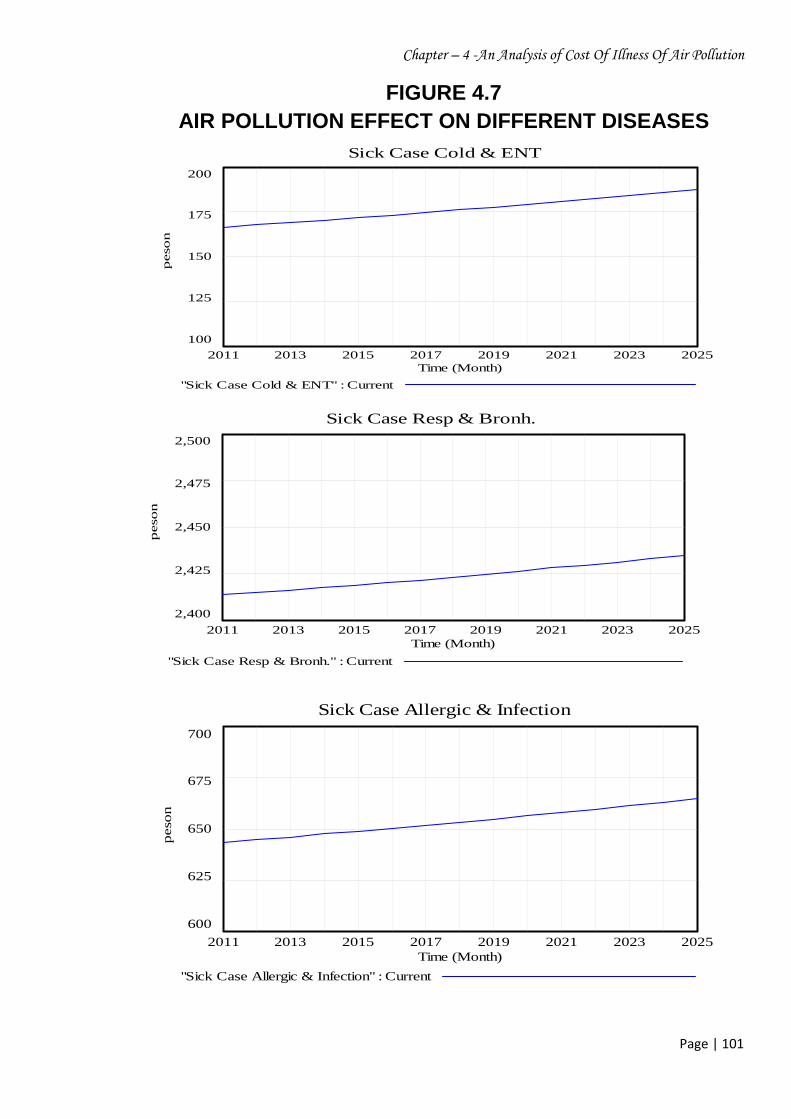
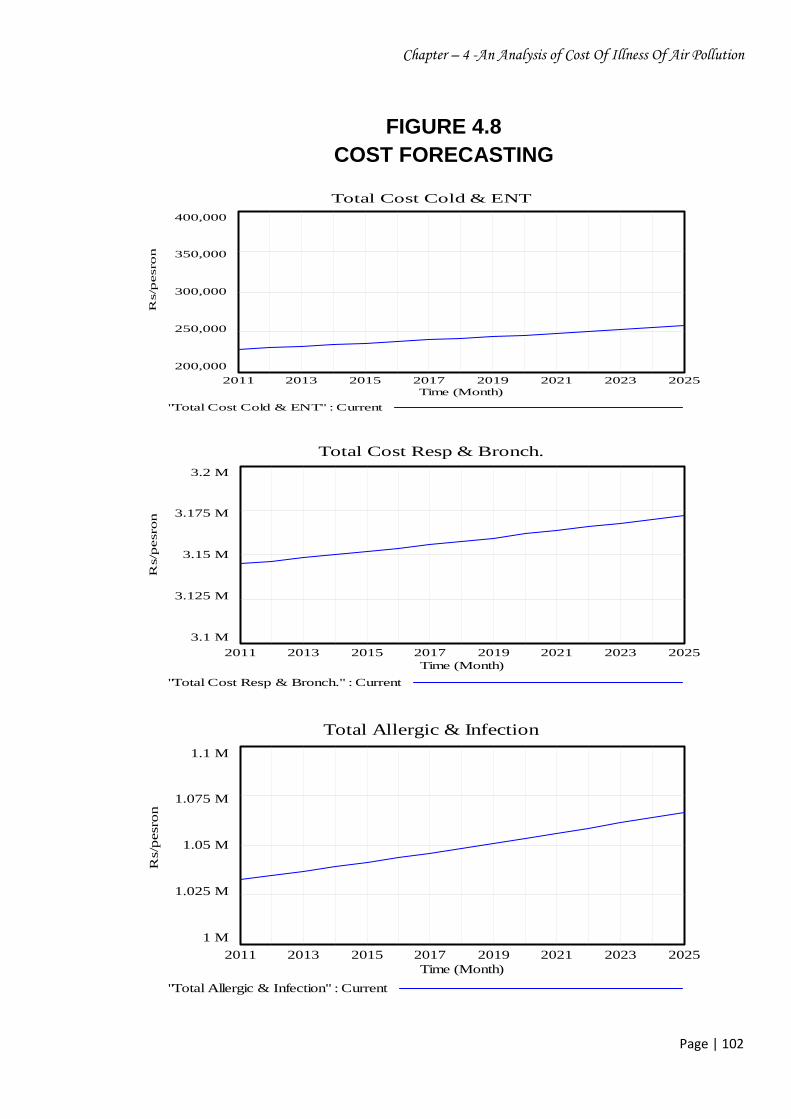
FIGURE 4.8 COST FORECASTING
Total Cost Cold & ENT400,000
350,000
300,000
250,000
200,000
2011 2013 2015 2017 2019 2021 2023 2025Time (Month)
Rs/p
esro
n
"Total Cost Cold & ENT" : Current
Total Cost Resp & Bronch.3.2 M
3.175 M
3.15 M
3.125 M
3.1 M2011 2013 2015 2017 2019 2021 2023 2025
Time (Month)
Rs/
pesr
on
"Total Cost Resp & Bronch." : Current
Total Allergic & Infection1.1 M
1.075 M
1.05 M
1.025 M
1 M2011 2013 2015 2017 2019 2021 2023 2025
Time (Month)
Rs/
pes
ron
"Total Allergic & Infection" : Current
Chapter – 4 -An Analysis of Cost Of Illness Of Air Pollution
Page | 103
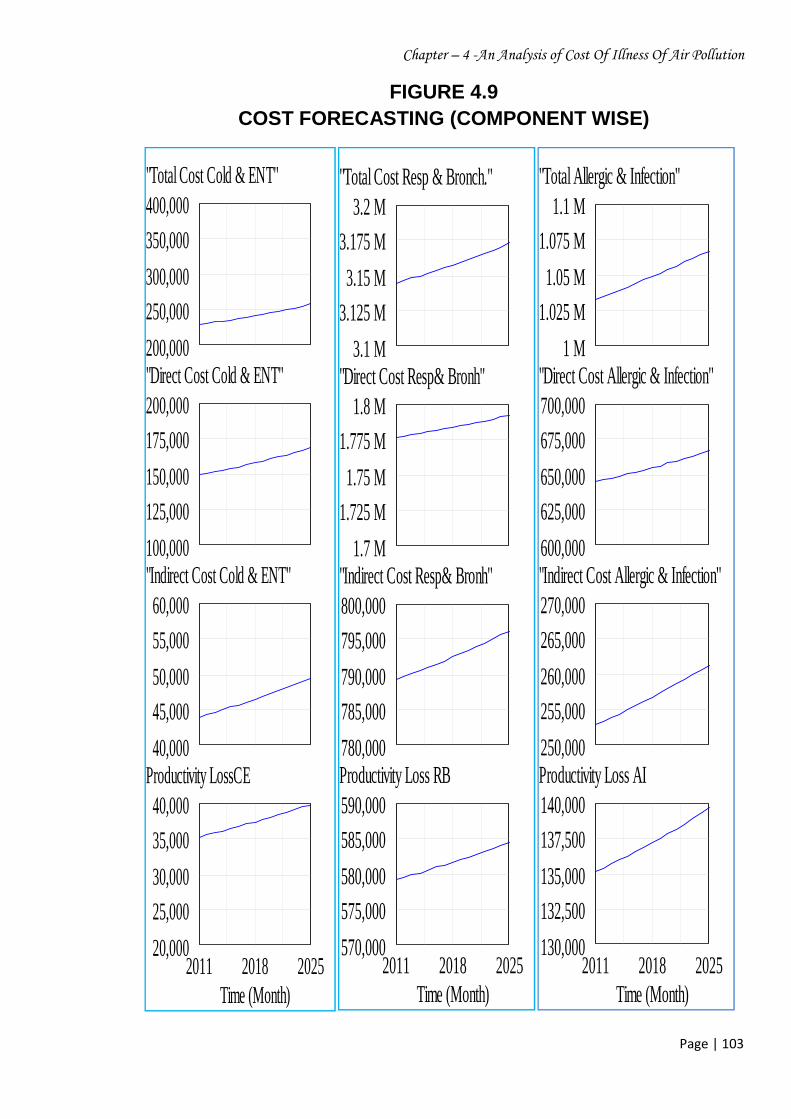
FIGURE 4.9 COST FORECASTING (COMPONENT WISE)
Current
"Total Cost Cold & ENT"400,000
350,000
300,000250,000
200,000"Direct Cost Cold & ENT"200,000175,000
150,000
125,000
100,000"Indirect Cost Cold & ENT"
60,000
55,000
50,00045,000
40,000Productivity LossCE
40,00035,000
30,00025,000
20,0002011 2018 2025
Time (Month)
Current
"Total Cost Resp & Bronch."3.2 M
3.175 M
3.15 M
3.125 M
3.1 M"Direct Cost Resp& Bronh"
1.8 M
1.775 M
1.75 M
1.725 M
1.7 M"Indirect Cost Resp& Bronh"800,000
795,000
790,000
785,000
780,000Productivity Loss RB590,000585,000
580,000
575,000
570,0002011 2018 2025
Time (Month)
Current
"Total Allergic & Infection"1.1 M
1.075 M
1.05 M
1.025 M
1 M"Direct Cost Allergic & Infection"700,000
675,000
650,000
625,000
600,000"Indirect Cost Allergic & Infection"270,000
265,000
260,000
255,000
250,000Productivity Loss AI140,000
137,500
135,000
132,500
130,0002011 2018 2025
Time (Month)
Chapter – 4 -An Analysis of Cost Of Illness Of Air Pollution
Page | 104
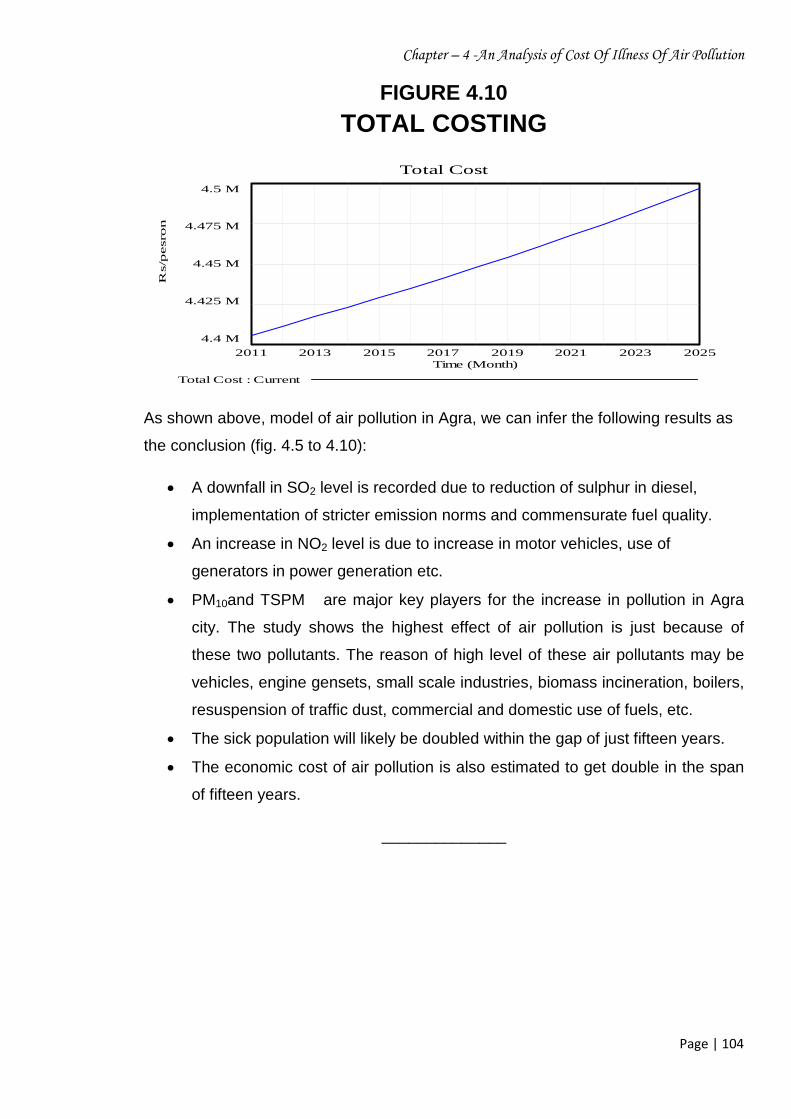
FIGURE 4.10
TOTAL COSTING
As shown above, model of air pollution in Agra, we can infer the following results as
the conclusion (fig. 4.5 to 4.10):
· A downfall in SO2 level is recorded due to reduction of sulphur in diesel,
implementation of stricter emission norms and commensurate fuel quality.
· An increase in NO2 level is due to increase in motor vehicles, use of
generators in power generation etc.
· PM10and TSPM are major key players for the increase in pollution in Agra
city. The study shows the highest effect of air pollution is just because of
these two pollutants. The reason of high level of these air pollutants may be
vehicles, engine gensets, small scale industries, biomass incineration, boilers,
resuspension of traffic dust, commercial and domestic use of fuels, etc.
· The sick population will likely be doubled within the gap of just fifteen years.
· The economic cost of air pollution is also estimated to get double in the span
of fifteen years.
______________
Total Cost4.5 M
4.475 M
4.45 M
4.425 M
4.4 M
2011 2013 2015 2017 2019 2021 2023 2025Time (Month)
Rs/p
esro
n
Total Cost : Current