Embed Size (px)
Citation preview

1 | P a g e
EC-316 MICROPROCESSORS LAB PROJECT
BASED ON INTEL 8085
AIR POLLUTION DETECTOR
SUBMITTED BY:
ROHAN ANAND (141/EC/13)
SAMEER BHARTI (152/EC/13)

2 | P a g e
ACKNOWLEDGEMENT
We would like to express our deepest gratitude and convey sincere thanks to
Prof. Dhananjay V. Gadre for providing us this opportunity and essential
resources for the completion of this project.
A special thanks to our friends who constantly motivated and helped us during
the process.
3 | P a g e
TABLE OF CONTENTS Page No.
1. Synopsis…………………………………………………………………….. 4
2. Introduction................................................................... 5
3. Project Description…………………………………………………….. 6
4. Schematic…………………………………………………………………… 9
5. Flowchart…………………………………………………………………… 11
6. Gist of Assembler………………………………………………………. 12
7. Gantt Chart………………………………………………………………… 13
8. Testing……………………………………………………………………….. 14
9. Conclusion………………………………………………………………….. 15
10. Bibliography………………………………………………………………. 16

4 | P a g e
SYNOPSIS
Air Pollution Detector consists of interfacing a dust sensor with INTEL 8085
microprocessor. The dust sensor has a digital output. The fraction of low time
(the time for which the sensor pin is low logic) to the sample time is
proportional to particulate matter concentration. The units of concentration
are particles (approximately greater than or equal to 1 micro meter) per 0.01
cubic feet.
Sensor Output Waveform
Low Pulse Occupancy Time: It is the fraction of low time to the sample time
(30seconds). The Low pulse occupancy time is converted into concentration
using the following characteristic curve.
5 | P a g e
INTRODUCTION
INTEL 8085 is an ideal tool to introduce the students to the world of
microprocessors, knowledge of which could be further applied in the field of
microcontrollers and other advanced technologies.
The source of motivation to build a project based on this microprocessor was
Prof. Dhananjay V. Gadre, who provided us with the opportunity and the
resources to come with unique ideas and apply the theoretical knowledge to
fruitful use.
The world has been baffling about the exponential rise in pollution and the
need of the hour is to develop emission free tech and tools that would help in
countering this global issue. The project AIR POLLUTION DETECTOR not only
aims at exploring the practical application of 8085 but is also an attempt to
create something useful.

6 | P a g e
PROJECT DESCRIPTION
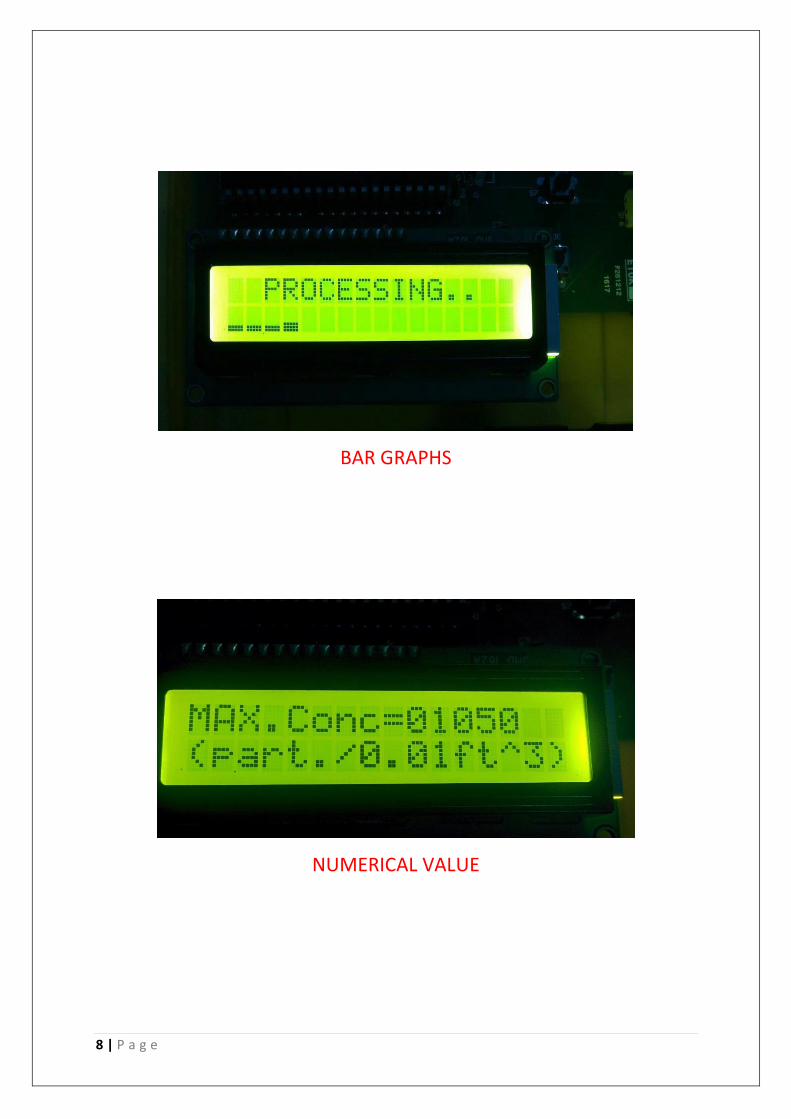
This project basically includes the interfacing of a dust sensor with 8085 and
the output of which is displayed on a 16x2 LCD in the form of Bar Graphs. This
sensor is to create Digital (Lo Pulse) output to Particulate Matters (PM). Lo
Pulse Occupancy time (LPO time) is in proportion to PM concentration.
The LPO time is calculated by measuring the ratio of the low time – the time
for which the output pin of the sensor is at low logic – to that of the sample
time, 27 seconds in this case. The sensor has a digital output.
The sample time is created using the 555 timer. The timer is triggered to
generate the sample time and the output is observed. If the 555 output is high,
the sensor output is checked and the low time is calculated. If the 555 output
is low, the procedure to calculate the various concentration begins.
The 555, sensor and LCD are all interfaced using the 8255, as shown in the
block diagram below.
BLOCK DIAGRAM

7 | P a g e
The sensor takes about a minute to stabilize before it starts to produce
readings. Once the low pulse occupancy ratio (low time/sample time) is
converted to concentration using the characteristic curve, the average value of
concentration is used to create bar graphs of different heights for specific
range of values. The graphs are displayed at regular intervals, which is equal to
the sample time. Also the minimum and maximum value is calculated among
the readings and stored in a specific ram location.
Meanwhile, the push button at the SID pin of the microprocessor is checked
every time a bar is displayed and as soon as it is pressed the graphs are
replaced by the numerical values of minimum and maximum concentration.
The graphs are being stored in memory locations and are restored
automatically after the numerical values.
It also has provisions to shift the bars after 16 reading have been displayed.
THE ENTIRE SETUP
8 | P a g e
BAR GRAPHS
NUMERICAL VALUE

9 | P a g e
SCHEMATIC AND BOARD FILE

10 | P a g e

11 | P a g e
FLOWCHART

12 | P a g e
GIST OF ASSEMBLER

13 | P a g e
GANTT CHART EXPECTED ACTUAL

14 | P a g e
TESTING
After the fabrication of the board and soldering all the required components it
was time to test and debug the hardware as well as the software.
Firstly, each IC was tested individually. Following which a simple assembly code
was burnt in the EEPROM to test for input on the SID pin and output at the
SOD pin. A red LED was used to indicate the output. This code insured proper
functioning and synchronisation of 8085, RAM, ROM, decoder, address latch
and NOT gate IC.
Next, 8255 IC was tested by writing a code to take input from one of the
switches connected to 8255 and outputting the logic of switch to the LED
connected on SOD pin of 8085.
Further, the sensor and the LCD were tested. Sensor was tested by interfacing
it to Arduino Uno Board and plotting its instantaneous output. LCD was first
tested by printing ASCII characters on it. Then, bar graphs were printed on LCD
by making custom characters using CGRAM.
On confirming the proper functioning of each component, the code was burnt
in the ROM and then tested on the board. The results were not satisfactory
initially. This was followed by rigorous debugging of the code in which each
subroutine was tested separately. The red LED at the SOD was used to check
whether the compiler was reaching to a certain point in the code.
This way, the code was debugged and expected output was obtained.

15 | P a g e
CONCLUSION
The project works similar to what was planned and the process of completing
it gave a good insight on how hardware and software can be brought together
to produce something worthy. The readings might vary from the actual
concentration due to slight approximations used during calculations but they
give a pretty fair idea about the level of dust particles around the Sensor.
It was an enriching and satisfying experience that helped in exploring the world
of microprocessors.
Here’s the link to the project video -
https://www.youtube.com/watch?v=kp1H5uGwcPI

16 | P a g e
BIBLIOGRAPHY
For reference, the following sources were used:
Microprocessor Architecture, Programming and Applications with the 8085, Fifth Edition by Ramesh Gaonkar.
http://mil.ufl.edu/3744/docs/lcdmanual/commands.html http://www.circuitvalley.com/2012/02/lcd-custom-character-hd44780-
16x2.html http://www.electronics-tutorials.ws/waveforms/555_timer.html http://www.seeedstudio.com/wiki/images/4/4c/Grove_-_Dust_sensor.pdf http://takingspace.org/wp-
content/uploads/ShinyeiPPD42NS_Deconstruction_TracyAllen.pdf http://www.howmuchsnow.com/arduino/airquality/grovedust/ https://github.com/selfbuilt/ppd42ns-example-
code/blob/master/particle_meter/particle_meter.ino