Embed Size (px)
Citation preview

DEGREE PROJECT IN VEHICLE ENGINEERING, SECOND CYCLE, 30 CREDITS STOCKHOLM, SWEDEN 2016
Air Induction System (AIS)
Optimization
CHENG WEI
KTH ROYAL INSTITUTE OF TECHNOLOGY SCHOOL OF ENGINEERING SCIENCES

TRITA 2016:31 ISSN 1651-7660

iii
Air Induction System (AIS)
Optimization
July 10, 2016
Cheng Wei
Royal Institute of Technology
School of Electrical Engineering
Supervisors:
Annika Stensson Trigell, KTH
Christoffer Henriksson, CEVT
Examiner:
Annika Stensson Trigell, KTH

Air Induction System (AIS) Optimization 10 July 2016
iv
Acknowledgement
First of all, I would like to express my sincere appreciation to my supervisor Christoffer
Henriksson from CEVT and Annika Stensson Trigell from KTH for their continuous
support of my Master thesis work, for their patience, time and immense knowledge.
I would also like to say that I enjoyed the working time when I was working at the Air
Induction & Cooling Module Team and it was a great pleasure for me to work with so
many nice colleagues, especially Knut Rasmussen and Jan Hedeen who helped me
whenever I needed help. I am grateful to all those professors and friends who made my
time in Gothenburg unforgettable.
Last but not the least, I would like to thank my family, whose love and dedication carried
me through my thesis project.

Air Induction System (AIS) Optimization 10 July 2016
v
Abstract
Air intake system (AIS) plays an important role on affecting the performance of the
engine and the vehicle. The design and optimization of the structures and materials of
AIS contributes to producing a quality reliable system, reducing noise, cost and weight at
the same time, which are significant to improve the performance of engine and vehicle.
Fresh air hoses/pipes are intended to transport, in air cleaner purified, air from the air
cleaner to the throttle fitted on the inlet manifold or to the compressor fitted to the
exhaust manifold. Air cleaner box is responsible for filtering out the dust and impurities
in the air. The charge air pipes are intended to transport purified compressed air from the
compressor to the charge air cooler and then to the throttle fitted on the inlet pipe.
For the air cleaner box optimization, through the benchmarking and the innovation ideas
from the daily life, two alternative optimized designs were introduced to reduce the cost
and weight. The first is four clips connectors and the other is spring clamps. For the hose
clamps, another innovation design was introduced to replace the previous hose clamps,
which is called friction connector on the inner side of the bellow hose, the outer side of
the air cleaner box lid and the clean side duct. For the material of the charge air ducts,
TPEE was selected to replace the previous EACM rubber hoses. Further tests and
prototypes should be conducted and produced to verify the effect of the optimization.
Keywords: AIS, Cost, Weight, Air cleaner box, Hose clamps, Charge air ducts,
Optimization

Air Induction System (AIS) Optimization 10 July 2016
vi
Abbreviations
Abbreviation Description
AIS Air Induction System
CEVT China Euro Vehicle Technology
NVH Noise, Vibration and Harshness
EEC Electronic Control System
CMA Compact Modular Architecture
CPE Chlorinated Polyethylene
NBR Nitrile Butadiene Rubber
ECO Epichloro-hydrin Rubber
CR Chloroprene Rubber
PVC PolyVinyl Chloride
HT-ACM High Temperature Advanced Composites Materiales
TPEE Thermoplastic Polyester Elastomer
FKM Fluoroelastomer
VMQ Vinyl Methyl Silicone
FVMQ Fluorosilicone Rubber
OEM Original Equipment Manufacturer
CATIA Computer Aided Three-dimensional Interactive Application
PLM Product Lifecycle Management
SOA Service-oriented Architecture
GEP Global Engine Petrol
VEP Volvo Engine Petrol
VED Volvo Engine Diesel

Air Induction System (AIS) Optimization 10 July 2016
vii
Contents
1 Introduction ............................................................................................................... 1
1.1 Background .......................................................................................................... 1
1.2 Thesis Scope ......................................................................................................... 2
1.3 Thesis Outline ...................................................................................................... 2
2 Literature Study
2.1 AIS - Air Induction System .................................................................................. 3
2.1.1 Inlet Performance .......................................................................................... 5
2.1.2 Intake Noise .................................................................................................. 5
2.1.3 Cost and Weight ............................................................................................ 6
2.2 Dirty/Clean Side Duct .......................................................................................... 8
2.2.1 Dirty Side Duct ............................................................................................. 8
2.2.2 Clean Side Duct ............................................................................................ 8
2.2.3 Transmission Loss......................................................................................... 9
2.3 Air Cleaner Box ................................................................................................. 12
2.3.1 Equation of Mass Conservation ................................................................. 14
2.3.2 Equation of Momentum Conservation ....................................................... 14
2.3.3 General form of Control Equation .............................................................. 16
2.4 Charge Air System ............................................................................................. 18
2.4.1 HT-ACM ..................................................................................................... 19
2.4.2 TPEE ........................................................................................................... 22
2.5 Cost and Weight Optimization ........................................................................... 26
3 Structure Optimized Design ................................................................................... 29
3.1 Software Introduction ......................................................................................... 29
3.1.1 CATIA V5 .................................................................................................. 29
3.1.2 TeamCenter ................................................................................................. 29
3.2 Air Cleaner Box Optimized Design ................................................................... 30
3.2.1 Four Clips Connectors ............................................................................... 32
3.2.2 Spring Clamps ............................................................................................. 33
3.3 Hose Clamps Optimized Design ........................................................................ 35
3.3.1 Friction Connector Optimized Design ........................................................ 37
3.4 Charge Air Ducts Material Optimized Design ................................................... 41
4 Analysis ..................................................................................................................... 45

Air Induction System (AIS) Optimization 10 July 2016
viii
4.1 Air Cleaner Box Optimized Design ................................................................... 45
4.2 Hose Clamps Optimized Design ........................................................................ 45
4.3 Charge Air Ducts Material Optimized Design ................................................... 46
5 Conclusions .............................................................................................................. 48
5.1 Air Cleaner Box Optimized Design ................................................................... 48
5.2 Hose Clamps Optimized Design ........................................................................ 48
5.3 Charge Air Ducts Material Optimized Design ................................................... 49
6 Future Work ............................................................................................................ 49
7 References ................................................................................................................. 51
Air Induction System (AIS) Optimization 10 July 2016
ix
List of Figures
Figure 1: PSS 40 Air Induction System [1] ........................................................................ 3
Figure 2: Air flow path [3] .................................................................................................. 4
Figure 3: Dirty side duct [6] ............................................................................................... 8
Figure 4 : Clean side duct bellow connector [7] ................................................................. 9
Figure 5: Clean side duct with resonator [8] ....................................................................... 9
Figure 6: Connection hoses with material HT-ACM [20] ................................................ 19
Figure 7: TPEE (Thermoplastic polyester elastomer) copolymer [23] ............................. 23
Figure 8: TPEE hoses with bellows [26] .......................................................................... 26
Figure 9: Air cleaner box lid in GEP [29]......................................................................... 31
Figure 10: Air cleaner box lid in GEP [30]....................................................................... 31
Figure 11: Air cleaner box lid in GEP [31]....................................................................... 32
Figure 12: Optimized four clips connection on the air cleaner box [32] .......................... 32
Figure 13: Distance between the clip and the corner point [33] ....................................... 33
Figure 14: The structure of the spring clamp in CATIA [34] ........................................... 34
Figure 15: Four spring clamps on the air cleaner house [35]............................................ 35
Figure 16: Existing hose clamp on the clean side duct [36] ............................................. 36
Figure 17: Bellow hose connected with the clean side duct [37]...................................... 36
Figure 18: Friction connector on the bellow hose [38] ..................................................... 37
Figure 19: Cutaway view of the friction connector on the bellow hose [39] .................... 38
Figure 20: Cutaway view of the friction connector on the air cleaner lid [40] ................. 38
Figure 21: Friction connector on the outer side of the air cleaner box lid hose [41] ........ 39
Figure 22: Friction connector on the outer side of the outer surface of the clean side duct
[42] ............................................................................................................................ 40
Figure 23: Quick connector on the charge air rubber hose [43] ....................................... 41
Figure 24: Rubber hose material properties analysis in CATIA [44] ............................... 42
Figure 25: TPEE material properties analysis in CATIA [45].......................................... 44

Air Induction System (AIS) Optimization 10 July 2016
x
List of Tables
Table 1: Specific forms of symbols in general governing equations ................................ 17
Table 2: Common hose material applied on synthetic oil, oil and lubricants resistant
products ..................................................................................................................... 18
Table 3: Experimental formula of HT-ACM product [22] ............................................... 21
Table 4: The cost comparison between the EACM and HT-ACM ................................... 43
Table 5: Cost comparison between the clips and the screws design ................................. 45
Table 6: Cost comparison between the friction connectors and the previous hose clamps
................................................................................................................................... 46
Table 7: Cost comparison between the EACM and TPEE ............................................... 47
Table 8: Test method for ageing the air cleaner assembly [46] ........................................ 49

Air Induction System (AIS) Optimization 10 July 2016
1
1 Introduction
1.1 Background
With the development of society and the progress of science and technology,
the requirement for the performance of the vehicles is higher and higher.
Vehicle dynamics, fuel economy and NVH performance have gradually become
several key measurement factors of the vehicle performance. These properties
are closely related to the engine as well as the powertrain accessories parts. As
one of the main components of powertrain accessories, air induction system
(AIS) plays an important role on affecting the performance of the engine and
the vehicle. Therefore, the design and optimization of the structures and
materials of AIS contributes to producing a quality reliable system, reducing
noise, cost and weight at the same time, which is significant to improve the
performance of engine and vehicle.
Engine is the heart of the vehicle and the air intake system is the portal of the
engine. The basic functions of the AIS are filtering the combustion air to the
engine, cleaning the air from dust and dirt, preventing snow and water coming
into the engine cylinders. AIS is composed of air cleaner system (including
dirty side duct, air cleaner box assembly and clean side duct) and charge air
system (including charge air duct hot side and cold side).
Since the results of the Fluent simulation of Geely AIS, also are considering the
manufacturing and service according to the benchmarking compared to other
products from other companies, the AIS product now needs to find an
optimized design to reduce the cost and weight without compromising the
system performance.

Air Induction System (AIS) Optimization 10 July 2016
2
1.2 Thesis Scope
The thesis is focused on the cost and weight reduction of the air induction
system without compromising the performances. The main goal of the thesis is
to reduce the cost and weight of the air induction system by optimizing the air
cleaner box, hose clamps and charge air ducts. In order to compare the effect of
the optimization, the cost and weight estimation was conducted by the cost
estimator from CEVT.
1.3 Thesis Outline
To reduce the cost and weight of the air induction system, the literature study is
presented in Chapter 2, which also introduces some basic theories and methods.
Chapter 3 illustrates the optimized design on the air induction system, along
with the comparison between the optimized design and the previous products.
The validation, analysis and conclusions are presented in the Chapter 4, which
includes the cost and weight estimation from the cost estimator from CEVT.
Future work is presented in the Chapter 5.

Air Induction System (AIS) Optimization 10 July 2016
3
2 Literature Study
2.1 AIS - Air Induction System
Air is one of the most important ingredients during combustion. Air goes into
the engine cylinders from the intake system, mixed with the fuel. After ignition,
the fuel releases chemical energy after burning in the air, and chemical energy
transfers into heat, finally into mechanical energy. The more the air goes into
the cylinder, the higher the efficiency of combustion is. There are two ways to
increase the intake air: the first is to reduce the intake resistance, another is to
reduce the back pressure of the intake system.
Figure 1: PSS 40 Air Induction System [1]
The air induction system is an important part of the engine and the air intake
system performance directly determines the performance of the engine and
vehicle. Air is sucked from the dirty side duct to the air cleaner box. The dust
and impurities in the air are filtered by the air cleaner box and the clean air
flows into the clean side duct. After the compressor, the clean air flows into the
hot side of the charge air duct. Finally after the charge air cooler and the cold
side of the charge air duct, air is mixed with fuel in the engine cylinders through
the intake valves [2].

Air Induction System (AIS) Optimization 10 July 2016
4
Figure 2: Air flow path [3]
In conclusion, the main functions of AIS were listed as follows.
(1) Adjusting the ratio between air and fuel. Controlling the amount of air
intake makes it best the air amount into the engine cylinder. Adjusting the
gas leakage amount from the camshaft and entering the AIS again.
(2) Preventing external impurities and dusts from the damage to the engine. Air
filter prevents the external impurities going into the cylinders as well as the
engine wearing and tearing, which will improve the reliability of the engine.
The air inlet is also designed to ensure that water and snow cannot enter the
AIS.
(3) Measurement of the air intake. The ratios between air and fuel are not the
same under different working conditions. There is an air control valve
installed in the clean side duct, which is connected with the engine
electronic control system (EEC) to control the fuel quantity injected into the
cylinders as well as the best air quantity into the engine and rational air
distribution.
(4) Decreasing the noise. AIS is one of the most important sources of noise on
vehicles, there is normally a resonator installed on the clean side duct.
To evaluate the performance of AIS, the following performances were
considered to estimate the properties.

Air Induction System (AIS) Optimization 10 July 2016
5
2.1.1 Inlet Performance
In the same air intake condition, if the cylinders with the same volume size suck
more fresh air, then it will allow more fuel injected and achieve more available
work in the same combustion conditions. Therefore, the increase of the intake
efficiency is an important way to improve the dynamic and economic
performance of the engine. The intake efficiency of the engine can be increased
at certain speed by using the pressure fluctuation in the air inlet pipe which is
caused by the discontinuous air intake, which was applied on a lot of vehicles.
The formation and propagation of the pressure wave in the air inlet pipes is
closely related to the geometry parameters such as the length of the intake pipe
and the rotating speed of the engine. Thus, it is very significant to fully
understand the characteristics of the gas flow in the intake port, as well as
master the influence on the intake performance affected by the components of
the intake system.
2.1.2 Intake Noise
The aerodynamic noise is the main noise source of the engine, air dynamic
noise includes the intake noise and the exhaust noise. Experimental study shows
that if the exhaust noise can be effectively controlled, the intake noise will be
one of the main noise sources. The intake noise is sometimes 5-10dB higher
than engine noise (combustion noise, mechanical noise) itself. The research
illustrates that the intake noise has not only great effect on the noise outside the
car, but when the vehicle noise is largely caused by the intake noise when the
car is under low speed. So in order to meet the strict noise emission standards
and improve the quality and the market competitiveness strength of the vehicles,
there is important practical significance to control the intake noise.

Air Induction System (AIS) Optimization 10 July 2016
6
2.1.3 Cost and Weight
For the establishment of the CMA platform in CEVT, the cost and weight
control of the AIS plays an important role on performance and profits of the
vehicle production. If the air intake system, as part of the powertrain system,
could find a solution with decreased weight on the air cleaner box, dirty/clean
side ducts and charger air ducts, as well as easy for manufacturing, there will be
better optimization effect on weight and performance of the engine. If there are
some cost savings in the structure optimization design and material selection,
while not compromising the technical regulations, there will be brought huge
benefits on the vehicle platform building as well as the profits of the company.
The research on the performance of the intake system is not simple and isolated,
and it will affect other performances when improving another specific
performance. Such as the air filter box and the intake muffler will be generally
used to achieve the intake noise control, but the certain extent changes will
occur on the air flow after installing muffler, which changes the original engine
intake conditions and leads to the performance changes on the power of the
engines under different engine speeds. As a result, the processing improvements
will cause other performance issues and it is necessary to synthetically consider
the optimization design.
No matter how complicated the flow problem is, it is governed by the three
basic laws of physics, which are conservation of mass, conservation of
momentum and conservation of energy. The fluid flow in air cleaner box is
quite complex, in order to be able to conduct the numerical simulation and
application in the engineering field, the model was assumed and simplified as
follows:
(1) The density of the fluid changes little, which is considered as
incompressible single-phase Newtonian fluid;
(2) The fluid in the air cleaner box is assumed steady flow and matches the
Boussinesq hypothesis [4];
(3) When the air cleaner box works under the stable condition, temperature
remains substantially constant.
Based on these assumptions, the mass conservation and momentum
conservation equations of fluid flow are established as follows [5].
(1) Mass conservation equation
According to the fluid continuity hypothesis, fluid occupies the entire flow
space continuously and seamlessly by the fluid particle. The mass of the fluid
will neither generate nor disappear, which means the increase or decrease of the
mass of the fluid in the internal control body equals the mass of the fluid flows
in or out of the control body surface. The mathematical expression is the fluid

Air Induction System (AIS) Optimization 10 July 2016
7
continuity equation, which is the expression form of the mass conservation in
fluid mechanics. The continuous equation is shown as follows:
( )
0j
j
u
t x
(2.1)
Where is the density of the fluid; ( 1,2,3)ju j is the velocity component
of three directions of ( 1,2,3)jx j ; jx represents the unit vector
( 1,2,3)je j of the three coordinates respectively.
(2) Momentum conservation equation
Momentum conservation equation is one of the fundamental requirements that
any flow must meet, and the essence is Newton's second law, which means that
fluid momentum of time change rate in the micro body equals to the sum of
outside force on the element. Momentum equation (i.e. Navier - Stokes
equation, abbreviated N-S equation) is shown as below:
( )( ) i j iji
i
j j
u uuF
t x x
(2.2)
Whereij , viscous stress tensor, is expressed as follows.
( )ji k
ij ij ij
j i k
uu up
x x x
(2.3)
Where p is thermodynamic pressure of fluid, ij is unit tensor (if i j , =1ij ;
if i j , =0ij ), is fluid viscosity coefficient and it is defined:
2
3 (2.4)
iF is a component of mass force in the i direction, and it could be represented
by tensor:
2 ( ) ( )i ijk j k n n i m m iF u x x x (2.5)
Where ijk is transformation tensor, when the even time transformation
(123, 231,312) , =1ijk ; when the odd time transformation (321,132, 213) ,
= 1ijk , and =0ijk under other conditions. j is the component of rotation
speed vector in the j direction.

Air Induction System (AIS) Optimization 10 July 2016
8
2.2 Dirty/Clean Side Duct
2.2.1 Dirty Side Duct
Dirty side ducts are intended to transport air from the outside of the vehicle to
the air cleaner fitted inside the engine bay. The dirty side deflector is placed in
connection to the dirty side duct and intends to reduce the amount of snow
and/or rain that is taken in through the dirty side duct and that reaches the air
cleaner. The dirty side duct and deflector are connected with clips and/or
screws and they are subjected to internal and external temperatures,
underpressure and movements according to specification on the respective
drawing.The dirty side duct and deflector are also subjected to degreasing agent,
salt from roads, and water. The dirty side duct and deflector shall withstand this
environment.
Figure 3: Dirty side duct [6]
2.2.2 Clean Side Duct
Fresh air hoses/pipes are intended to transport, in air cleaner purified, air from
the air cleaner to the throttle fitted on the inlet manifold or to the compressor
fitted to the exhaust manifold. The hose/pipe is connected with clamps. Plastic
pipes, to which other parts are fixed with hose clamps, must be provided with a
steel insert or similar. The hose/pipe is subjected to underpressure movements
as well as internally and externally to temperature. The hose/pipe is also
subjected to degreasing agent, oil, grease, salt from roads, and water. The
current design of clean side duct bellow connector and clean side duct with
resonator are shown in Figures 4 and 5, respectively.

Air Induction System (AIS) Optimization 10 July 2016
9
Figure 4 : Clean side duct bellow connector [7]
Figure 5: Clean side duct with resonator [8]
2.2.3 Transmission Loss
Transmission loss shows the energy decay of the sound after muffling elements,
which is the difference between the incident sound power level WiL and the
transmission sound power level WtL . The transmission loss [9] could be
expressed as follows.

Air Induction System (AIS) Optimization 10 July 2016
10
10lg iWi Wt
t
WTL L L
W (2.6)
Where:
iW is the power of incident wave coming towards a defined area (or structure);
tW is the power of transmitted wave going away from the defined area (or
structure).
It is assumed that sound wave propagates in an infinitely long pipe, if there is
the same medium, the sound wave will be transferred forever. But when the
acoustic impedance of the pipeline changes, the incident sound will be blocked
and a part of the sound wave will be reflected back. Both the change of the
media and the change of the pipe section will cause the changes of the acoustic
impedance [10].
The sound wave propagates in the pipeline, the acoustic impedance of which is
1Z . But the section area of the pipeline changes when the pipeline acoustic
impedance is 2Z . A part of the sound wave was reflected back to the pipe with
the acoustic impedance 1Z , generating the reflection sound wave. The other part
of the incident acoustic wave continues to propagate in the pipeline with an
impedance of 2Z to form a transmission sound wave. These two acoustic
impedances are expressed as:
1 1 1Z S z (2.7)
2 2 2Z S z (2.8)
Where 1 1 1z u and 2 2 2z u are the acoustic impedance ratios of the two
media respectively.
The sound pressure of the three kinds of waves is shown respectively [11]:
Incident sound pressure: 1( )j t k x
i ip Pe (2.9)
Reflected sound pressure: 1( )j t k x
r rp Pe
(2.10)
Transmission sound pressure: 2( )j t k x
t tp Pe
(2.11)
Where is the frequency, 1k and 2k is the coefficient respectively.
The pressure on both sides of the cross section are the same at the varying
section, therefore, the incident sound pressure on the left side of the interface

Air Induction System (AIS) Optimization 10 July 2016
11
and the reflected sound pressure should be equal to the transmission sound
pressure on the right side of the cross section. The volume velocity of the
acoustic wave is the same at any point in the pipeline, so the difference between
the incident wave velocity at the left side of the interface and the velocity of the
reflected wave should be equal to the velocity of the transmission wave at the
right side of the interface.
Conservation of pressure: i r tp p p (2.12)
Conservation of velocity: i r tU U U (2.13)
Or 1 1 2
1 1 2
i trp pp
S S Sz z z (2.14)
From the two conservation equations above, the following equation could be
conducted.
1 2
1 2
( )
( )
i r
i r
z p p z
S p p S
(2.15)
The ratio between the amplitude of the reflected sound pressure of the reflected
wave and the amplitude of the sound pressure of the incident wave is defined as
the reflection coefficient R [9].
= r
i
pR
p (2.16)
Or 1 2 2 1
1 2 2 1
=S z S z
RS z S z
The ratio between the amplitude of the transmission sound pressure and the
amplitude of the incident sound pressure is defined as the transmission
coefficient T :
= t
i
pR
p (2.17)
1 2
1 2 2 1
2=
S zT
S z S z (2.18)
In the air induction system, the inside medium is air and the acoustic impedance
of the two sides of the variable cross sections are the same, namely
1 2z z c . Therefore, the reflection coefficient and the transmission
coefficient could be simplified as follows.

Air Induction System (AIS) Optimization 10 July 2016
12
1 2
1 2
=S S
RS S
(2.19)
1
1 2
2=
ST
S S (2.20)
By combining equations (2.21), (2.22), (2.23), (2.24) and (2.25), the
Transmission loss is simplified as:
2
1 2
1 2
(1 / )=10lg
4 /
S STL
S S
(2.26)
Thus, the transmission loss only depends on the ratio of the section areas, while
it is independent from the order of the area of the two hoses, which means that
as long as the ratio between the areas are the same, the transmission loss is the
same. The transmission loss is independent from the frequency [13].
The acoustic characteristics of the sound source and the end of the pipe are not
included in transmission loss, which is only related to its own structure. When
evaluating the performance of a single resonator element or preliminary
evaluating the acoustic attenuation performance of the system, the transmission
loss is usually adopted as the evaluation criteria. Transmission loss is one of the
simplest methods to evaluate the effect of noise elimination.
Compared to the insertion loss, the transmission loss is always positive, which
means there is always silencing effect. However, the insertion loss can be
positive or negative. The positive value indicates that after adding the resonator
elements, the sound was weakened; while negative value illustrates that after
adding the resonator elements, the sound is amplified. The transmission loss is
only determined by the structure, the impedance ratio and the cross-sectional
area of the medium of the noise elimination element, and it is independent from
the sound source and the acoustic characteristics of the outlet. While the
insertion loss depends on the acoustic properties of the sound source and the
outlet.
2.3 Air Cleaner Box
Air cleaner box is responsible for filtering out the dust and impurities in the air.
Therefore, the clean air is sent into the engine and it will effectively reduce the
wear between the cylinder, piston and piston ring. With the stricter emission
and technical regulations, the requirement of the air filter is higher and higher,
and the internal irregular gas flow is also the important factor affecting the
performance of the air cleaner box. The inhomogeneity of internal gas flow in
the air cleaner box will produce vortex and the separation of airflow, which will

Air Induction System (AIS) Optimization 10 July 2016
13
increase the flow resistance, lower filtration efficiency as well as shorter
lifecycle time. In addition, the pressure drop caused by the resistance of the air
flow through the filter will affect the dynamic and economic performance of the
engine. Therefore, the key structural design of the air cleaner box is of
importance to reduce the inhomogeneity of gas flow velocity distribution and
the pressure drop through the filter.
At present, there are mainly two methods to research and analyze the internal
flow field of air cleaner box, experiment and numerical simulation. The
experimental results from the test methods are reliable are the basis for analysis
of the validity of theoretical analysis and numerical simulation. In recent years,
due to the international test methods and benchmarking with other companies,
more accurate test data could be obtained and the comparable verification for
the development of the air cleaner box could verify the requirements. However,
tests are often limited by the model size, flow disturbance, staff safety and
accuracy constraints. It can be sometimes difficult to manage to achieve the
results by tests. For example, for the complex gas-solid two-phase flow, it is
difficult to accurately measure by the test method and display the internal
airflow and particle flow velocity field, which affects the research in some way.
But it is quite simple to solve these problems with the numerical simulation
method, by which can be achieved the distribution of basic physical quantities
(such as velocity, pressure, temperature, concentration) in different locations in
complex flow fields. Numerical simulation can reproduce the flow situation and
the physical quantities change with the function of time, then the results are
displayed on the screen by calculation. It could be seen all the details of the
flow field, determine the vortex distribution characteristics, cavitation, shock
wave velocity and strength, flow separation, surface pressure distribution as
well as stress. Therefore, it could be qualitative analyzed the merits of the
performance, which has high practical value for the structure optimization
design and the enhancement of the performance on the air cleaner box.
To better evaluate the performances of the AIS, the mathematical model is
essential to build to carry out the simulation and calculation. Model is a
generalization and abstract of the real system, it is a kind of method to highlight
the main process and omit secondary phenomenon by the assumption
conditions, refer to the known laws of physics, and eventually use mathematical
equations to describe and express system characteristics.
Fluid flow is a physical phenomenon and it needs to follow the laws of mass
conservation, momentum conservation, energy conservation and other physical
laws. The control equation is the mathematical description of these physical
laws. In this work, only the gas flow characteristic was considered, and it is
assumed the air to be an incompressible fluid. Without considering the heat
transfer problems, energy conservation equation, ideal gas equation of state

Air Induction System (AIS) Optimization 10 July 2016
14
dependent from energy and temperature were not introduced in the research
[14].
2.3.1 Equation of Mass Conservation
Any flow problem must meet the law of mass conservation. The law could be
expressed as: the mass increase in fluid element per unit time equals to the net
mass flowing into the infinitesimal body in the same time interval. According to
law above, the mass conservation equation could be shown as follows.
( ) ( ) ( )
0u v w
t x y z
(2.27)
With the vector symbol ( )yx z
aa adiv a
x y z
, the equation above could
be written as:
( ) 0div Ut
(2.28)
Where t is time; is density; U is velocity vector; , ,u v w is the velocity
vector component in the , ,x y z direction respectively.
For incompressible fluid, the density is constant. Therefore, the equation of
mass conservation could be simplified as follows.
( ) 0div U
2.3.2 Equation of Momentum Conservation
Any flow system also must meet the law of momentum conservation. The law
could be expressed as: the change rate of the momentum versus the time equals
to all the forces on the infinitesimal body. The equation of momentum
conservation is essentially Newton's Second Law. According to law above, the
mass conservation equation of the direction , ,x y z could be shown as follows.
( ) ( )( )
yxxx zxx
u pdiv uU F
t x x y z
( ) ( )
( )xy yy zy
y
v pdiv vU F
t y x y z
(2.29)

Air Induction System (AIS) Optimization 10 July 2016
15
( ) ( )( )
yzxz zzz
w pdiv wU F
t z x y z
Where p is the pressure on the infinitesimal fluid body; is the viscous stress;
, ,x y zF F F is the force on the infinitesimal body.
The functions above are momentum conservation equations which meet for any
type of fluid (including non-Newtonian fluids). For Newtonian fluid, viscous
stress is proportional to the deformation rate of the fluid, and the equations
are as follows.
( )2 ( )xx
udiv U
x
( )2 ( )yy
vdiv U
y
( )2 ( )zz
wdiv U
z
( )xy yx
u v
y x
(2.30)
( )xz zx
u w
z x
( )yz zy
v w
z y
Where is dynamic viscosity coefficient; is the second viscosity, which is
normally equals to 2
3 .
Combining (2.30) with (2.29), the following equations could be calculated.
( )( ) ( ) u
u pdiv uU div gradu S
t x
( )
( ) ( ) v
v pdiv vU div gradv S
t y
(2.31)
( )( ) ( ) w
w pdiv wU div gradw S
t z

Air Induction System (AIS) Optimization 10 July 2016
16
Where, () () ()
()gradx y z
, , ,u v wS S S are generalized source items,
=u x xS F s , =v y yS F s , =w z zS F s , and , ,x y zs s s could be expressed as
follows.
x
u v ws divU
x x y x z x x
y
u v ws divU
x y y y z y y
(2.32)
z
u v ws divU
x z y z z z z
In this research, the air was considered as incompressible fluid with constant
viscosity and = = =0x y zs s s at this time [15].
2.3.3 General form of Control Equation
In order to facilitate the analysis of the control equations, two basic control
equations were compared to each other. Although the dependent variables in the
two equations are not identical, they illustrate the conservative properties of
physical quantities per unit volume. If is general variable, the two equations
above could be expressed as the following general form.
( )
( ) ( )div U div grad St
(2.33)
Where is general variable, is generalized diffusion coefficient, S is
generalized source item. The transient terms, convection terms, diffusion terms
and source terms were shown in the equation above respectively. For different
control equations, , and S stand for different forms and they were shown
in the Table 1.

Air Induction System (AIS) Optimization 10 July 2016
17
Table 1: Specific forms of symbols in general governing equations
S
Continuous equation 1 0 0
Momentum equation iu
i
i
pS
x
The air filter has two main functions, filter the air and eliminate the noise of the
air inlet. Air filter is equivalent to an expansion muffler, where the transmission
loss and the center frequency are determined by volume and dimensions.
Normally, if the volume of the air cleaner box is more than three times than that
of the engine, there will be a better effect on the noise elimination. Generally
speaking, the larger the volume, the better the noise elimination effect. There
are two main factors which will affect the transmission loss, the expansion ratio
and the length of the air cleaner box. Sometimes, the air inlet pipe and the
exhaust insertion pipe could be used on the air cleaner box, which can improve
the transmission loss of the air cleaner box. It is assumed that only the intake
pipe structure was taken into account, and the length of the insertion tube is aL ,
the transmission loss can be expressed as:
2
22
sin( )1
10lg 1 0.252
cos( )a
L
TL mLm
(2.34)
The intake pipe structure is equivalent to adding a 1
4 wavelength tube in the
system, which can be used to adjust the transmission loss at a certain frequency
[16]. When2
cos( ) 0aL
, the transmission loss reaches the maximum value,
and the corresponding frequency is: 4 a
cf
L [17].
Thus, in order to optimize a kind of higher filtration efficiency, lower pressure
drop air cleaner box structure, it is important to optimize the structure
parameters and weight without compromising better manufacturing and service
performance. Considering the structural manufacturing cost, selecting reliable
Air Induction System (AIS) Optimization 10 July 2016
18
and cheaper optimization design is also an important aspect in AIS of the cost
control for the company.
2.4 Charge Air System
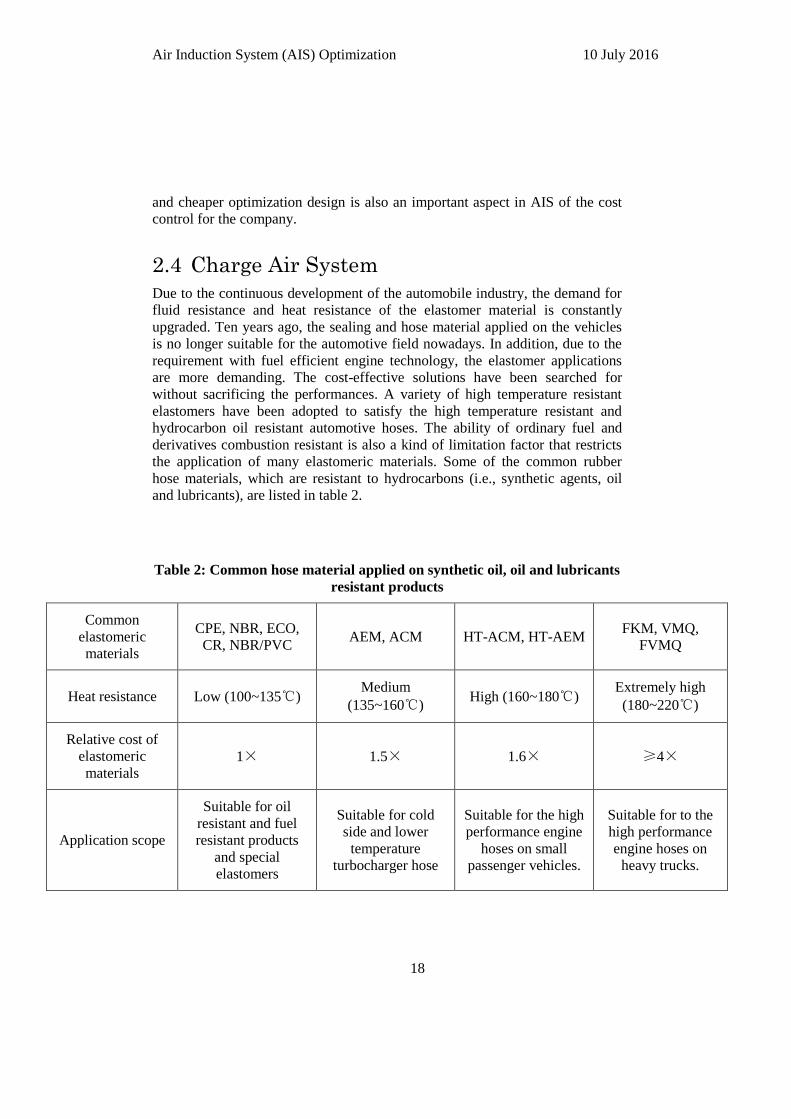
Due to the continuous development of the automobile industry, the demand for
fluid resistance and heat resistance of the elastomer material is constantly
upgraded. Ten years ago, the sealing and hose material applied on the vehicles
is no longer suitable for the automotive field nowadays. In addition, due to the
requirement with fuel efficient engine technology, the elastomer applications
are more demanding. The cost-effective solutions have been searched for
without sacrificing the performances. A variety of high temperature resistant
elastomers have been adopted to satisfy the high temperature resistant and
hydrocarbon oil resistant automotive hoses. The ability of ordinary fuel and
derivatives combustion resistant is also a kind of limitation factor that restricts
the application of many elastomeric materials. Some of the common rubber
hose materials, which are resistant to hydrocarbons (i.e., synthetic agents, oil
and lubricants), are listed in table 2.
Table 2: Common hose material applied on synthetic oil, oil and lubricants
resistant products
Common
elastomeric
materials
CPE, NBR, ECO,
CR, NBR/PVC AEM, ACM HT-ACM, HT-AEM
FKM, VMQ,
FVMQ
Heat resistance Low (100~135℃) Medium
(135~160℃) High (160~180℃)
Extremely high
(180~220℃)
Relative cost of
elastomeric
materials 1× 1.5× 1.6× ≥4×
Application scope
Suitable for oil
resistant and fuel
resistant products
and special
elastomers
Suitable for cold
side and lower
temperature
turbocharger hose
Suitable for the high
performance engine
hoses on small
passenger vehicles.
Suitable for to the
high performance
engine hoses on
heavy trucks.

Air Induction System (AIS) Optimization 10 July 2016
19
For the hose material under the working temperature 100~135℃, chlorinated
polyethylene (CPE), nitrile rubber (NBR), epichlorohydrin - ethylene oxide
copolymer (ECO) and chloroprene rubber (CR). For these materials mentioned
above, each of them has their own advantages and disadvantages, however, in
most of the engine application, changes of environmental factors restrict the use
of application on the fuel resistant and oil resistant (while high temperature
resistant performance is not important in these applications). For the moderate
resistance to high temperature performance (135~160℃), the eethylene acrylic
elastomers and acrylate elastomer could be used. Due to the AEM is greatly
affected by high filler, AEM is widely used in moderate heat resistant hose
products [18].
2.4.1 HT-ACM
As it is mentioned above, ACM is widely applied on the hoses that are long-
term exposed in 160~180℃ high temperature environment as well as contacting
with various types of oil and fuel. AEM is composed of ethylene and acrylic
acid monomer, while ACM is only composed of acrylic acid monomer.
Ethylene is the weak part in heat resistance and oil resistance of AEM [19]. The
final result is that the technology of AEM limits its heat resistance, leading to
the heat resistance worse than HT-ACM. Therefore, AEM could only be
applied on the lower heat resistance rubber hose products. In the previous
research, the ethylene in the AEM can not only make the product achieve high
strength at room temperature, but also increase the extrusion speed and improve
the surface degree of finish of the product.
Figure 6: Connection hoses with material HT-ACM [20]
With the introduction of new products HyTemp AR212XP improved the
extrusion performance, the processing advantage of AEM better than HT-ACM
no longer existed. In recent years, outstanding technology achievement in the

Air Induction System (AIS) Optimization 10 July 2016
20
AEM leads to the successful development of increasing high and low
temperature resistance performance, fluid resistance and processing properties
of the monomer / polymer structure. This thesis compares and demonstrates the
existing HT-ACM with extrusion technology as well as several performance
advantages HyTemp AR212XP of Zeon chemical company. Zeon chemical
company has been successfully applied HyTemp AR212XP elastomer on the
turbocharger for a long time. Although most of the data in the research were
measured in the laboratory, many processing advantages presented by HyTemp
AR212XP have been validated in laboratory and extrusion production
assessments [21]. At present, the commercial usage of this new type of
elastomer has been found to produce the fuel hose and deliver high temperature
gas, as well as petroleum base oil. Since HyTemp AR212XP has a relative high
tear resistance and can increase the surface degree of finish on the product, it
would provide OEM (original equipment manufacturers) products with better
dynamic performances.

Air Induction System (AIS) Optimization 10 July 2016
21
Table 3: Experimental formula of HT-ACM product [22]
ACM-212HR ACM-212XP
ACM-212HR/serving 100.00 -
ACM-212XP/serving - 100.00
N550/serving 55.00 55.00
Vanox CDPA/Naugard 445/serving 2.00 2.00
Stearic acid/serving 1.00 1.00
Vanfre VAM/serving 0.50 0.50
Paraplex G-50/serving 1.50 1.50
DIAK#1/serving 0.50 0.50
RHENOGRAN XLA-60/serving 2.00 2.00
Total/serving 162.50 162.50
Secondary vulcanization (hour/℃) 4/175 4/175
The initial vulcanization and secondary vulcanization
Shore A hardness/HA 62 57
10% tensile stress at defined
elongation/MPa 3.5 2.3
Tensile strength/MPa 11.2 10.7
Air Induction System (AIS) Optimization 10 July 2016
22
Elongation/% 293 352
Tear strength and break elongation are the key properties of the hose. ACM-
212XP materials are specifically designed for those products with more
requirements on tearing strength than ACM-212HR materials. Since ACM-
212XP has higher tear resistance and higher initial elongation, it is quite
suitable for those high temperature hoses that are subjected to dynamic impact
under working conditions. The experiment shows that ACM-212XP material
has relative high tear strength after aging in air and engine standard oil both at
room temperature and test temperature conditions [21].
Even under the high temperature environment, ACM is also an ideal material
for manufacturing sealing, sealing gaskets and transporting hydrocarbon
lubricants, hot air hose material. In recent years, the scientific development of
acrylate chemical industry has improved the performance of ACM. There are
many characteristics on HyTemp AR212XP, including increasing extrusion rate,
improving surface degree of finish, smaller extrusion expansion ratio and
higher tear strength, which are better than HyTemp AR212HR. In addition,
HyTemp AR212XP can achieve the same hardness by increasing the amount of
filler, which will improve the economic performance and keep the dynamic
performance at the same time. The application of HT-ACM elastomer not only
provides ideal engineering solutions for low temperature and high temperature
hoses, but also reduces the material cost of the application silicone rubber or
fluorine rubber [21].
2.4.2 TPEE
TPEE (Thermoplastic polyester elastomer) is a copolymer of PET
(Polyethylene terephthalate) and polyether. The United States DuPont
Company firstly realized the industrial production of TPEE and so far, DuPont
Company remains the world’s largest production and the best quality products.

Air Induction System (AIS) Optimization 10 July 2016
23
Figure 7: TPEE (Thermoplastic polyester elastomer) copolymer [23]
TPEE is a block copolymer containing polyester hard block and polyether
segment. Among them, the amorphous phase is formed by the polyether soft
segment and the non-crystalline polyester, the hard part of the polyester is
crystallized to form a crystalline micro region, which is functioning as the
physical cross-linking point. TPEE has the elasticity of rubber and the strength
of the engineering plastics, the soft segment gives it the flexibility to make it
like a rubber, while the hard segment gives it the processing performance,
making it like the plastic. Compared to rubber, TPEE has a better processing
performance and longer service life. Compared to the engineering plastics, it
also has the better characteristics of high strength, flexibility and dynamic
mechanical properties. In recent years, the application of TPEE is developing
rapidly, and it is a new type of thermoplastic elastomer with much attention,
which is mainly used in automobile air induction system, sealing components
and some other high demanding products. Compared to other hose materials,
the characteristics of TPEE were concluded as follows [24].
2.4.2.1 Mechanical Property
TPEE has a very wide range of hardness. By adjusting the ratio of hard and soft
segments, the hardness can be in the range of 32 ~ 82 (D). TPEE has an
extremely high modulus. Compared to TPU, TPEE has much higher
compression modulus and tensile modulus, which means products of the same
parts with the same hardness of TPEE and TPU respectively, the former could
withstand greater load.
Under low strain conditions, the modulus of TPEE is higher than that of other
thermoplastic elastomers with the same hardness. When the modulus is an
important factor of design, the cross section area of the product could be
Air Induction System (AIS) Optimization 10 July 2016
24
reduced with TPEE, and the amount of material could be reduced. Above the
room temperature, there is a high bending modulus of polyether ester elastomer,
and it is not as too hard as TPU at low temperature. Therefore, TPEE is suitable
for the production of cantilever beam or torque type parts, especially suitable
for the production of high temperature components.
In addition, the polyether ester elastomer has excellent resistance to fatigue as
well as the small hysteresis loss. Combining the characteristic with the high
elasticity, the properties make it ideal material under the condition of several
cycle times.
2.4.2.2 Thermal Property
Polyether ester elastomer has excellent heat resistance, the higher the hardness,
the better the heat resistance. Reported in the literature, there is almost no
weight loss of polyether ester elastomer at 110 and 140 degrees with continuous
heating 10h [25]. Even at 160 degrees and 180 degrees with 10h heating, the
loss was only 0.05 and 0.10% respectively. The constant temperature heating
curve indicates that the polyether ester elastomer starts the weight loss at 250
degrees, the cumulative weight loss 5% until 300 degrees, while there is
obviously weight loss at 400 degrees. Therefore, polyether ester elastomer has a
high limit temperature, and there is small mechanical properties loss under the
high and low temperature. The tensile strength of polyether ester elastomer is
much higher than that of TPU when the temperature is over 120 degrees.
In addition, polyether ester elastomer has decent performance of resistance to
low temperature. The brittle point of polyether ester elastic is lower than -70
degrees, and the lower the hardness, the better the low temperature resistance.
Most of polyether ester elastomer could be used for a long time at -40 degrees.
Since the polyether ester elastic shows excellent performance both at high and
low temperatures, there is a wide range of the available working temperature
from 70 to 200 degrees.
2.4.2.3 Chemical resistance
Polyether ester elastomer has superior oil resistance, with the ability of the
resistance to most polar liquid chemical medium (such as acid, alkali, amine
and diol compounds) at room temperature. The ability of resistance to
chemicals increases with the increasing hardness. The anti-swelling properties
and anti-permeability performance of polyether ester elastomer to most organic
solvents, fuel and gas is decent. The fuel penetration is only 1/300 ~ 1/3
compared to CSM, NBR and other oil-resistance rubbers.

Air Induction System (AIS) Optimization 10 July 2016
25
2.4.2.4 High resilience
TPEE has high resilience, the damping blocks can be used for railway damping,
to help the train start, accelerate, decelerate and stop smoothly. Compared with
metal damping spring, TPEE damping blocks will not rust, nor deterioration in
the natural environment, or leading to the elastic fracture and loss. While
compared to rubber materials, TPEE has greater reproducibility and keeps good
elasticity as well. Compared with TPU, TPEE has higher resilience, under the
effect of alternating stress, the hysteretic rebound is small and generates less
heat, which leads to a longer service life.
2.4.2.5 Weather resistance and aging resistance
When adding additives such as antioxidants, TPEE has excellent chemical
stability under water mist, ozone, atmospheric aging conditions. Similar to most
of thermoplastic elastomers, TPEE is degraded under ultraviolet light.
Therefore, there should be ultraviolet protective agent added to the formula in
terms of outdoor application or sunshine exposure conditions of the products.
2.4.2.6 Processing formability
TPEE has excellent melt stability and thermoplasticity, making it better
processability. Therefore, a variety of thermoplastic processing could be used,
such as extrusion, injection, blow molding, rotational molding and melt casting
molding and so on.

Air Induction System (AIS) Optimization 10 July 2016
26
Figure 8: TPEE hoses with bellows [26]
2.5 Cost and Weight Optimization
Some relevant research data illustrate that if the weight of the vehicle decreases
10%, fuel consumption will decrease 6%~8%.; if rolling resistance decreases
10%, fuel consumption will decrease 3%; if the transmission efficiency of the
axle and the transmission mechanism improves 10%, the fuel consumption will
increase 7%. From the data above, it could be concluded that the fuel
consumption decrease of the vehicle influenced by lighter weight is affected
more than other factors. So the lightweight design plays an important role to
improve the vehicle's fuel economy. [27] On the other hand, the light weight
design of the car will improve the handling stability and the collision safety of
the vehicle, leading to the optimized performance of the vehicle at the same
time. Vehicle road surface roughness excitation will be also relieved by the
engine and body lightweight, which will improve the vehicle driving stability.
The absorption of lightweight materials (Aluminum alloy, plastic, carbon fiber,
etc.) on the impact of the buffer and collision energy will improve the passive
safety of the vehicle. At present, the lightweight design of automobile has
become the key research topic in the continuous development of the automotive
industry.
Air Induction System (AIS) Optimization 10 July 2016
27
Lightweight design on automobile is a kind of optimized design on automotive
products and components with modern design methods, or with large amount of
new materials as much as possible to reduce the weight of the vehicle without
compromising the automobile comprehensive performance, to achieve the
purpose on weight loss, low fuel consumption, environmental protection and
safety performances. Lightweight automobile is never simply about to minimize
the size, it is necessary to reduce the weight and the cost of the vehicle, but also
ensuring the driving safety, crashworthiness, vibration resistance and comfort
performance. At present, the lightweight optimization design methods mainly
include the following technical routes, which are optimized design of the
component structure and the application of lightweight materials [28].
(1) Improving the design level of components on the vehicle. The design
theory of the optimized components is that the traditional design
philosophy goes towards to the direction of lightweight (higher fuel
economy), higher security (higher passive safety), comfortable, higher
quality (corrosion resistance candle) as well as lower cost.
(2) Innovation and optimization of materials on the automotive parts.
According to the working characteristics and following the part design
regulations, several aspects could be considered to realize the lightweight.
The lightweight innovative design could be conducted on the basis of
existing materials. The previous materials could be replaced by some light
or lower density materials. The application of high strength materials can
reduce the thickness of the thin parts, resulting in lightweight structure.
(3) Advanced manufacturing technologies on vehicles parts. Based on parts
optimization design and application of new materials, lightweight
components could also be optimized from the manufacturing processes and
tools. Different materials and different parts have different manufacturing
processes. At present, some advanced manufacturing technology mainly
includes light material forming, nonmetallic materials forming technology
and high strength steel forming.
(4) Modularization of vehicle parts. Vehicle parts are a pile of discrete
components, which could be integrated and modularized, leading to reduce
the weight of the vehicle. Modularization not only streamlines the
mechanism and the composition of vehicle components, but also increases
vehicle integrated degree and production efficiency, improving the
automobile space arrangement as well.
In the air induction system, if the existing structure is optimized without
compromising the vehicle performance, the application of lightweight and
simple structure, the cost will be significantly reduced. For example, in the air
induction system, the existing air cleaner box is connected by seven screws, the
manufacturing process of which is not only complicated, but the installation is
not convenient. The weight of the seven metal screws increases the weight of

Air Induction System (AIS) Optimization 10 July 2016
28
the overall air induction system as well. For the clean side ducts, the existing
hose clamp is a kind of conventional metal clamp. It is necessary to operate the
special tool for installation, and metal material also increases the cost and
weight. For charge air ducts, the original rubber hoses greatly increase the
weight of the overall AIS. If they are replaced by plastic or polymer materials,
they will also play an important role on reducing the weight and cost.

Air Induction System (AIS) Optimization 10 July 2016
29
3 Structure Optimized Design
3.1 Software Introduction
3.1.1 CATIA V5
CATIA (Computer Aided Three-dimensional Interactive Application) is a
flagship product solution developed by the French company Dassault. As an
important part of the solution together with PLM, it can help manufacturers
design their future products, and support the pre-stage of the project, the
specific design, analysis, simulation, assembly, maintenance as well as all the
industrial design processes.
Modular CATIA series products provide product style and shape design,
mechanical design, equipment and systems engineering, management digital
prototype, mechanical processing, analysis and simulation. By enabling
enterprises to reuse product design knowledge, decrease the development cycle
time, CATIA products accelerate the response to the demand of the market.
Since 1999, the digital prototype has been widely used in the market, so that it
has become the most popular product development system in the world. CATIA
series products provide 3D design and simulation solutions mainly in eight
areas: automotive, aerospace, shipbuilding, plant design (mainly steel plant),
construction, electricity and electronics, consumer goods and general machinery
manufacturing.
3.1.2 TeamCenter
Teamcenter is first integrated PLM solutions which transfers the single software
application to multi-disciplinary, cross project stage and plan solutions
established on the basis of SOA in the industry. Teamcenter provides platform
extensibility, diversity of application and configuration.
The collaborative application systems of the Teamcenter support your general
enterprise to improve the efficiency of the entire product life cycle from
beginning to the end. From the beginning of the planning of product
requirements, to customer service oriented scattered around the world,
Teamcenter always covers the whole life cycle of the product and supports the
various aspects of the product life cycle. In the early stages of the product life
cycle, many product manufacturers are trying to optimize product requirements
definition, conceptual design and design verification process to reduce the cost
as well as improve the productivity of the product life cycle. In the middle
stages of the product life cycle, enterprises wish to make use of their existing
intellectual assets to carry out the product variant, extended and improved, so as

Air Induction System (AIS) Optimization 10 July 2016
30
to prolong the life cycle of the product. And in the later stages of the product
life cycle (such as marketing, sales or customer service support), companies are
often concerned about how to get the maximum benefit. Teamcenter is the most
widely used PLM system in the world.
3.2 Air Cleaner Box Optimized Design
In the establishment of CMA (Compact modular architecture) platform in
CEVT, there are mainly two series of vehicle engines, which is GEP (Global
Engine Petrol) and VEP/VED (Volvo Engine Petrol/Diesel) respectively. GEP
is the engine with three cylinders and the displacement is 1.5L, while
VEP/VED is 4-cylinder engine and the displacement is 2L. The previous air
cleaner box design in the GEP engine is composed of three parts, air cleaner lid,
air filter and air cleaner house, which were shown in figures 9 to 11
respectively. And the air cleaner lid and the air cleaner house were connected
by seven screws.

Air Induction System (AIS) Optimization 10 July 2016
31
Figure 9: Air cleaner box lid in GEP [29]
Figure 10: Air cleaner box lid in GEP [30]

Air Induction System (AIS) Optimization 10 July 2016
32
Figure 11: Air cleaner box lid in GEP [31]
According to the theory analysis in the literature study, it is necessary to
optimize the seven screws connectors in order to reduce cost and weight
without compromising the filter performance.
In the previous design, screws are made of metal, which will increase the total
weight compared to plastic connectors. In addition, it is not convenient to finish
the installation of the connection between the air cleaner lid and the air cleaner
house, which will directly increase the manufacturing and processing cost.
Through the benchmarking and the innovation ideas from the daily life, two
alternative optimized designs were introduced to reduce the cost and weight.
The first is four clips connectors and the other is spring clamps.
3.2.1 Four Clips Connectors
The idea of clip connectors is from the lunch box in our daily life. Clips are
quite common connectors in our daily life and it is a kind of stable and simple
connector if the connection force requirement is not high enough. From the
weight aspect, the clips are made of plastic, which may have lower weight than
the metal screws. Also considering the cost, the plastic material is cheaper than
the metal material and it is easier to install the air cleaner lid on the air cleaner
house by hand, which means lower cost on the manufacturing and processing
part.
Figure 12: Optimized four clips connection on the air cleaner box [32]
This kind of solution can increase the spring force of the connection and make
the whole design more stable. To achieve better sealing performance and
balance sealing force on four directions on the air cleaner lid, the four clips
were chosen to be designed in the middle of the edge and the distances between
the clip and the corner point are all 95mm.

Air Induction System (AIS) Optimization 10 July 2016
33
Figure 13: Distance between the clip and the corner point [33]
3.2.2 Spring Clamps
The idea of the spring clamps comes from the benchmarking. This kind of
clamp is composed of four metal clamps, which can rotate along the axles fixed
on the air cleaner house. The spring clamps will hook the bead on the air
cleaner lid by friction. Due to the better stability and higher spring force of the
connection, four spring forces were designed near the four corners of the air
cleaner box. The corner clamps will significantly increase the sealing
performance and the spring force of the air cleaner box connection compared to
the clamps fixed in the middle of the edge.

Air Induction System (AIS) Optimization 10 July 2016
34
Figure 14: The structure of the spring clamp in CATIA [34]
Air Induction System (AIS) Optimization 10 July 2016
35
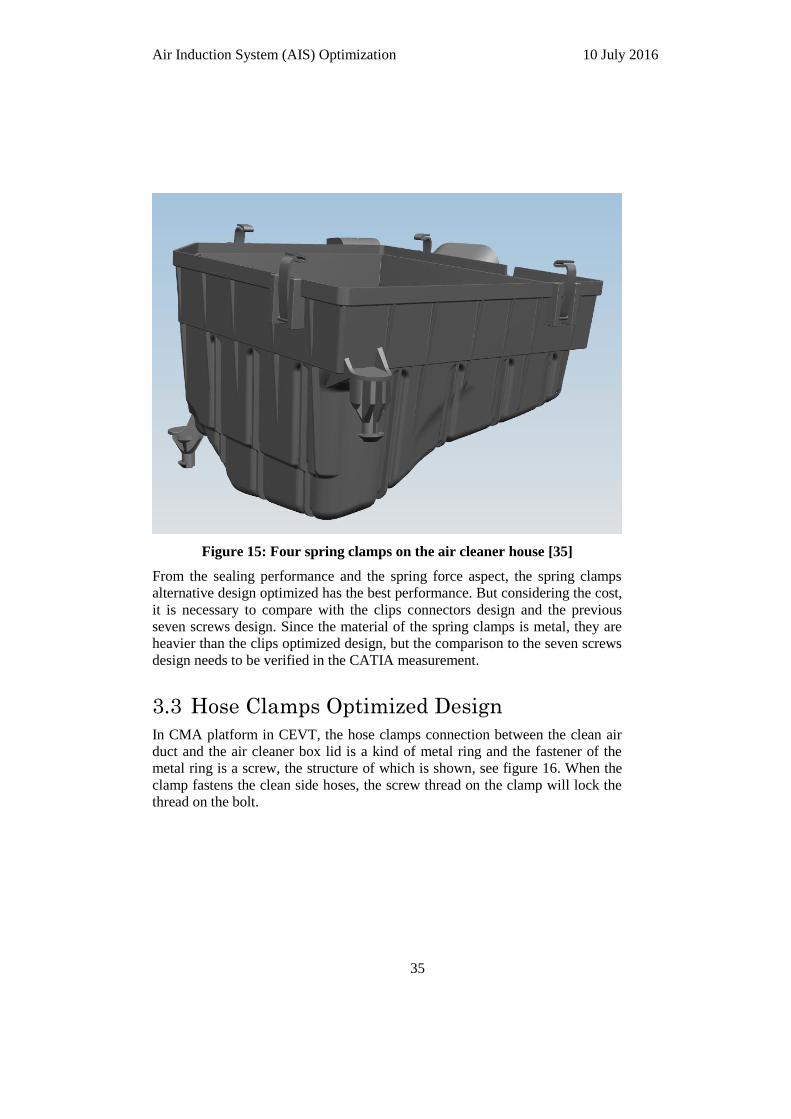
Figure 15: Four spring clamps on the air cleaner house [35]
From the sealing performance and the spring force aspect, the spring clamps
alternative design optimized has the best performance. But considering the cost,
it is necessary to compare with the clips connectors design and the previous
seven screws design. Since the material of the spring clamps is metal, they are
heavier than the clips optimized design, but the comparison to the seven screws
design needs to be verified in the CATIA measurement.
3.3 Hose Clamps Optimized Design
In CMA platform in CEVT, the hose clamps connection between the clean air
duct and the air cleaner box lid is a kind of metal ring and the fastener of the
metal ring is a screw, the structure of which is shown, see figure 16. When the
clamp fastens the clean side hoses, the screw thread on the clamp will lock the
thread on the bolt.

Air Induction System (AIS) Optimization 10 July 2016
36
Figure 16: Existing hose clamp on the clean side duct [36]
Figure 17: Bellow hose connected with the clean side duct [37]
From the weight aspect for the previous hose clamp, the whole clamp is made
of metal, which increases the weight of the fasteners. Even the steel bolt is
heavier than the clamp ring, which greatly increases the weight of the air
induction system.

Air Induction System (AIS) Optimization 10 July 2016
37
In addition, the cost of this kind of hose clamp is higher than the plastic
products. It is necessary to manufacture and install the clamps with specific
tools, which will increase the processing and the manufacturing cost as well.
Therefore, some new innovation design was introduced to solve these problems.
3.3.1 Friction Connector Optimized Design
There are normally two directions to conduct the structure optimization design,
changing the previous structures or replace the previous products. The hose
clamp product now was provided by the supplier, and there is not available
alternative better product to replace the clamps now or change the structure of
the clamps. Therefore, another innovation design was introduced to replace the
previous hose clamps, which is called friction connector on the inner side of the
bellow hose, the outer side of the air cleaner box lid and the clean side duct,
shown in figures 18 to 20.
Figure 18: Friction connector on the bellow hose [38]

Air Induction System (AIS) Optimization 10 July 2016
38
Figure 19: Cutaway view of the friction connector on the bellow hose [39]
Figure 20: Cutaway view of the friction connector on the air cleaner lid [40]

Air Induction System (AIS) Optimization 10 July 2016
39
The sketch of the friction connector zigzag was shown in the Figure 20, and
from the two sketches in the two figures respectively. When installing two
hoses together, there will be little friction force, but the zigzag will lock up one
by one. In that case, this kind of structure friction between the two hoses makes
the connection stable.
Figure 21: Friction connector on the outer side of the air cleaner box
lid hose [41]

Air Induction System (AIS) Optimization 10 July 2016
40
Figure 22: Friction connector on the outer side of the outer surface of
the clean side duct [42]
As is shown in figures 20 to 22, there is no extra product to connect the hoses
and the friction part was just manufactured on the hoses. Compared to the
previous hose clamps, the friction connector has much lower weight, due to the
plastic material (same as the hoses) and smaller size than the metal clamps.
Considering the installation aspect, special installation tool is not necessary for
this design and the hoses could be just connected by hand. However, there
could be a small cost increase on the manufacturing of the hoses. But further
cost comparison will be verified with the previous metal clamps.

Air Induction System (AIS) Optimization 10 July 2016
41
3.4 Charge Air Ducts Material Optimized
Design
The charge air ducts are intended to transport purified compressed air from the
compressor to the charge air cooler and then to the throttle fitted on the inlet
pipe.
The pipes and the hoses are connected with clamps. The rubber hoses are
connected by the quick connectors, shown in the Figure 23.
Figure 23: Quick connector on the charge air rubber hose [43]
The pipes and hoses are subjected internally and externally to the temperatures,
pressure and movements specified on the respective drawing. The pipes and the
hoses are also subjected to degreasing agent, oil, grease, salt from roads, and
water. The pipes and the hoses shall withstand this engine bay environmental.
According to the literature study and researches, generally the EACM rubber
hose has higher density than the plastic material. In the existing rubber hose in
the charge air ducts, the properties set in the CATIA material library were
shown in Figure 24.

Air Induction System (AIS) Optimization 10 July 2016
42
Figure 24: Rubber hose material properties analysis in CATIA [44]
From the Figure 24: Rubber hose material properties analysis in
CATIAFigure 24, the density of the EACM rubber material is 3 31.40 10 /kg m , which is relative higher than the general plastic materials
and leads to the weight increase on the charge air system.

Air Induction System (AIS) Optimization 10 July 2016
43
Therefore, alternative materials were chosen from the TPEE and HT-ACM,
although HT-ACM has better application performance, the density of the HT-
ACM (3 31.26 10 /kg m ) is slightly lower than the previous EACM rubber
material. And the cost of the HT-ACM ( 67 /RMB kg ) is higher than the
EACM rubber (55 /RMB kg ). Assuming the volume of the hose material is the
same the total estimated price is shown in Table 4.
Table 4: The cost comparison between the EACM and HT-ACM
EACM rubber HT-ACM
Density (3/kg m )
3 31.40 10 /kg m
3 31.26 10 /kg m
Unit price ( RMB ) 55 /RMB kg
67 /RMB kg
Volume (3m ) V V
Total price ( RMB ) 77000V 84420V
From the cost estimation and the comparison between these two materials, it
could be analyzed that EACM rubber has much more advantage on the cost
aspect instead of the HT-ACM material. Therefore, the HT-ACM was not
selected as the optimized design and the TPEE polyester elastomer will be
chosen as the replaced material of the EACM rubber. The properties analysis of
TPEE in CATIA material library is shown in Figure 25.

Air Induction System (AIS) Optimization 10 July 2016
44
Figure 25: TPEE material properties analysis in CATIA [45]
From the properties analysis, the density of the TPEE material is concluded to
be much lower than the EACM rubber material. However, the performance and
the total cost comparison needs to be validated according to the technical
regulation.

Air Induction System (AIS) Optimization 10 July 2016
45
4 Analysis
The optimization work was conducted mainly from three aspects, air cleaner
box optimized design, hose clamps optimized design and charge air ducts
material optimized design.
4.1 Air Cleaner Box Optimized Design
The brief cost and weight estimation was provided by the cost estimator in
CEVT. The comparison data between the clips and the screws design is shown
in Table 5.
Table 5: Cost comparison between the clips and the screws design
Operation/component/material Quantity
(Piece)
Purchase
part (€)
Material
cost (€)
Labor
cost
(€)
Process
cost (€)
Scarp
cost
(€)
Overhead
cost (€)
Profit
(€)
Part
price
(€)
Air cleaner box old version
Screw 7 0.175 0.009 0.184
Screw assembly 0.067 0.02348 0.001 0.007 0.004 0.103
Air cleaner box new version
Clip 4 0.040 0.002 0.042
Clip assembly 0.033 0.01327 0.001 0.004 0.002 0.053
Delta cost
0.192
4.2 Hose Clamps Optimized Design
The brief cost and weight estimation was provided by the cost estimator in
CEVT. The comparison data between the friction connectors and the previous
hose clamps is shown in Table 6.

Air Induction System (AIS) Optimization 10 July 2016
46
Table 6: Cost comparison between the friction connectors and the previous
hose clamps
Operation/component/material Quantity
(Piece)
Purchase
part (€)
Material
cost (€)
Labor
cost
(€)
Process
cost (€)
Scarp
cost
(€)
Overhead
cost (€)
Profit
(€)
Part
price
(€)
Hose clamps old version
Hose clamps 2 0.193 0.180 0.373
Hose clamps assembly 0.080 0.290 0.001 0.008 0.005 0.384
Friction connector new
version
Friction connector 2 0.093 0.089 0.182
Friction connector assembly 0.008 0.214 0.001 0.004 0.002 0.229
Delta cost
0.346
4.3 Charge Air Ducts Material Optimized
Design
Based on the optimization design process and analysis of the charge air ducts
material selection, TPEE has more advantages than the EACM rubber material
and the HT-ACM material. According to the cost estimator and the price from
the material supplier Dupont, the price of the TPEE is 65 /RMB kg , and the
cost comparison between the EACM and TPEE is shown in

Air Induction System (AIS) Optimization 10 July 2016
47
Table 7.
Table 7: Cost comparison between the EACM and TPEE
EACM rubber TPEE
Density (3/kg m )
3 31.40 10 /kg m
3 31.145 10 /kg m
Unit price ( RMB ) 55 /RMB kg
65 /RMB kg
Volume (3m ) V V
Total price ( RMB ) 77000V 74425V

Air Induction System (AIS) Optimization 10 July 2016
48
5 Conclusions
5.1 Air Cleaner Box Optimized Design
From Table 5, the cost of each design includes the part cost and the part
assembly cost. For each design, the part price is composed of the purchase part
cost and the material cost, while the assembly cost includes the labor cost,
process cost, scarp cost, overhead cost and the profit. The delta cost is the cost
difference between the two kinds of design. From the data, it could be
concluded that the clips has much more advantages on cost aspect. Considering
the weight aspect as well, seven metal screws have higher weight than the
plastic clips. In addition, according to the feedback from the cost estimator and
the advice from the supervisor, the spring clamps optimized design only has
minor cost saving than the screws and the advantage on weight is not that
obvious. According to the analysis above, the clips optimized design achieved
the best effect on the decrease of cost and weight.
5.2 Hose Clamps Optimized Design
Similar to the Table 5, the cost of each design includes the part cost and the part
assembly cost in Table 6. The delta cost between the hose clamps and the
friction connectors is 0.346, which illustrates the optimized alternative design
significantly decreases the cost of the system. Also for the weight, there is no
extra component on the friction connectors but only plastic friction part
manufactured on the hoses, which has much lower weight than the previous
hose clamps and the expected result has been achieved.

Air Induction System (AIS) Optimization 10 July 2016
49
5.3 Charge Air Ducts Material Optimized
Design
It could be seen from the
Table 7, TPEE has lower cost than the EACM rubber. In addition, according to
the cost estimator, for the same charge air hose, the EACM rubber production
weight is 0.34 /kg hose , while the hose weight made of TPEE is 0.24 /kg hose .
From both weight and cost aspects, the charger air ducts with TPEE material
will be the best alternative optimized design to replace the EACM rubber hose.
6 Future Work
The optimization design on the air induction system has been finished in three
aspects, and the CATIA files have been created. In the future time, if the
optimized designs were applied on the products, the prototypes will be
produced by the suppliers and there will be some changes on the optimized
products as well. The prototypes will be tested according to the technical
regulations for different parts.
For the air clean box, the relevant test for the connection is the resistance to
leakage due to ageing of the air cleaner assembly. The method for ageing the air
cleaner assembly in question is to place the air cleaner assembly in an oven
with to the following temperature cycles:
Table 8: Test method for ageing the air cleaner assembly [46]

Air Induction System (AIS) Optimization 10 July 2016
50
Test parameter
Component Temperature
Ageing
duration Equivalent to
Inlet pipe 100℃ 1200h 20 years
Filter cover 100℃ and
thereafter 85℃
100h and
thereafter
1100h
20 years
Filter housing +filter
element
100℃ and
thereafter 85℃
100h and
thereafter
1100h
20 years
Testing of leakage for the air cleaner is performed in two different test
procedures, one before the ageing process and one after the ageing process.
Testing for leakage through the air cleaner shall be carried out with the air filter
subjected to a positive pressure of 2.0kPa at which point the total amount of
leakage on the fresh air side of the air cleaner is measured.
For the clean side ducts, the resistance to pressure from hose clamps need to be
further analysed. The hose shall not be damaged when hose clamps are
tightened. The hose/pipe shall be fitted with the relevant clamps according to
the assembly design. The requirements are that cracks are not allowed in the
hose/pipe and breakage or crushing is not allowed in the material.
In addition, the diameter/shape change during negative pressure needs to be
validated. The hose is subjected to sufficient internal negative pressure so that it
collapses at its weakest point. This point is marked, after which the pressure is
first released, then altered to specified pressure, and maintained for 5 minutes.
The hose is then pressed together at the marked point from the outside so that
the hose walls touch each other at the marked point for five seconds [47].
For the charge air ducts, the leakage during positive pressure on aged parts
should be tested. The pipe, hose or the system shall withstand an age test with
specific requirements regarding leakage. The parts are subjected to heat and
they are thereafter held at room temperature ( 23 3 ℃) for around four hours
before the temperature cycling. Then parts should be placed in a cold chamber
with the temperature 30 3 ℃ for four hours. It is then immediately moved to
a cold bath at a temperature of 30 3 ℃ . The cold bath fluid shall be
composed of equal parts of water and anti-freeze according to the current VCC
specification. Air is used to test the hose for leakage in the cold bath, at
maximum pressure for five minutes. Any leakage is ascertained by air escaping
from the hose. The hose is pressurized before it is immersed in the cold bath.
Air Induction System (AIS) Optimization 10 July 2016
51
The pipe, the hose or the system must meet the requirements that leakage dur-
ing positive pressure exceeding less than 25% [48].
7 References
[1] Thomas Petersson, “Volvo Air Introduction,” in Air Induction System,
Sweden, 2009, p. 2.
[2] Y. Nishio, New Approach to Low-noise Air Intake System Development,
SAE Transactions, 1991.
[3] Thomas Petersson, “Volvo Air Introduction,” in Air Induction System,
Sweden, 2009, p. 5.
[4] "Wikipedia," [Online]. Available:
https://en.wikipedia.org/wiki/Boussinesq_approximation.
[5] A. A.D.Gosman., Measurement and Multimensional Prediction of Flow in
An Axisymmetric Port/Valve Assembly., SAE, 1987, p. 649-661.
[6] C. Henriksson, Dirty Side Duct, CEVT.
[7] C. Henriksson, Clean Side Duct Bellow Connector, CEVT.
[8] C. Henriksson, Clean Side Duct with Resonator, CEVT.

Air Induction System (AIS) Optimization 10 July 2016
52
[9] “WIKIPEDIA,” [Online]. Available:
https://en.wikipedia.org/wiki/Transmission_loss.
[10] I. Y. Ohata A, Dynamic Inlet Pressure and Volumetric Efficiency of Four-
Cylinder Engine, SAE Paper 820407.
[11] M. N. R. O Connor J F, “CFD Simulation of Intake Port Flow Using
Automstic Mesh Generation: Comparison with Laser Sheet, Swirl and
LDA measurements for Steady Flow Conditions,” SAE Paper, no.
900255, 1998.
[12] Inguard.U., On The Theory and Design of Acoustic Resonators, Journal of
the Acoustical Society of America, 1953, p. 1037-1061.
[13] Alster.M., Improved Calculation of Resonant Frequencies of Helmholtz
Resonators., Journal of Sound and Vibration , 1972.
[14] F. Al-Sarkhi, Optimization Technique for Design of Automotive Air Filter
Housing with Improved Fluid Dynamics Performance and Filtration.,
Particulate Science and Technology, 2004, p. 235-252.
[15] R. &. F. Sabins, Diagnosis of The Flow Fields in A Housing for Air Filter
Performance Testing, American Instistute of Aeronautics and
Astronautics, 1994.
[16] Sugiura, “Numerical Analysis of Flow in The Induction System of An
Internal Combustion Using A New Method of Lines,” SAE Paper, no.
900255, 1990.
[17] V. R. Gurumoorthy, Prediction of Pressure Drop Performance in
Automotive Air Induction Systems, Washington,D.C.: In Proceeding of
the Third Annual Meeting of the American Filtration Society, 1990.
[18] L.A.Utracki, History of Commercial Polymer Alloys and Blends, Polymer
Engineering and Science, 1995.
[19] J. R. Kelley, “An Advanced Alternative to Ethylene Acrylic (AEM)
Elastomers for High-Temperature, Oil Resistant Hoses,” 14th Brazilian
Congress of Rubber Technology of ABTB, 11-12 April 2012.
[20] “High Temperature Polyacrylate,” goodflexrubber, 2014. [Online].
Available:
http://goodflexrubber.com/wiki/High+Temperature+Polyacrylate.
[Accessed 2016].
[21] J. R. K. J. D. F. e. Peter J. Abraham, “A New HT-ACM Elastomer for
Enhanced Extrusion Processing in High-temperature Oil Resistant Hose
Applications,” KAUSCHUK GUMMI KUNSTSTOFFE, vol. 10, pp. 26-
31, 2013.
[22] Z. Chemicals, “HyTemp AR212HR Product Specification,” Zeon , Zeon
Chemicals, 2014.

Air Induction System (AIS) Optimization 10 July 2016
53
[23] “Hytrel HTR8223 TPEE,” Google, 2012. [Online]. Available:
https://www.google.se/search?q=TPEE&espv=2&biw=1366&bih=623&t
bm=isch&imgil=tfMd9WKy_II3NM%253A%253B-fK5E-
JlqCYLoM%253Bhttp%25253A%25252F%25252Fwww.dmplas.com%2
5252Fproductshow_12837088.htm&source=iu&pf=m&fir=tfMd9WKy_I
I3NM%253A%252C-fK5E-JlqCYLoM%252C_&us. [Accessed 2016].
[24] S. Mowry, A High-Performance TEEE Surround Materail, Voice Coil,
2006.
[25] A. p. m. R. &. D. Center, “TRIEL Thermoplastic Polyether Ester
Elastomer (TPEE),” 27 6 2007. [Online]. Available: http://www.dk-
kunststoffe.de/dk/0/DF87A087F8796999C12579E500378C6E/$File/TRI
EL_Uebersicht.pdf.
[26] “TPEE specification for air intake hoses,” Google, 2011. [Online].
Available:
https://www.google.se/search?q=TPEE&espv=2&biw=1366&bih=623&t
bm=isch&imgil=tfMd9WKy_II3NM%253A%253B-fK5E-
JlqCYLoM%253Bhttp%25253A%25252F%25252Fwww.dmplas.com%2
5252Fproductshow_12837088.htm&source=iu&pf=m&fir=tfMd9WKy_I
I3NM%253A%252C-fK5E-JlqCYLoM%252C_&us. [Accessed 2016].
[27] B. Hoseph C, Light Metal in Automotive Applications, Light Metal Age,
2000.
[28] M. B. Arno Jambor, New Cars-new Materials, Material & Design, 1997.
[29] C. Wei, Air Cleaner Box Lid in GEP, CEVT, 2016.
[30] C. Wei, Air Cleaner Box Lid in GEP, CEVT, 2016.
[31] C. Wei, Air Cleaner Box Lid in GEP, CEVT, 2016.
[32] C. Wei, Optimized Four Clips Connection on The Air Cleaner Box,
CEVT, 2016.
[33] C. Wei, Distance Between The Clip and The Corner Point, CEVT, 2016.
[34] C. Wei, The Structure of The Spring Clamp in CATIA, CEVT, 2016.
[35] C. Wei, Four Spring Clamps on The Air Cleaner House, CEVT, 2016.
[36] C. Henriksson, Existing Hose Clamp on The Clean Side Duct, CEVT.
[37] C. Henriksson, Bellow Hose Connected with The Clean Side Duct, CEVT.
[38] C. Wei, Friction Connector on The Bellow Hose, CEVT, 2016.
[39] C. Wei, Cutaway View of The Friction Connector on The Bellow Hose,
CEVT, 2016.
[40] C. Wei, Cutaway View of The Friction Connector on The Air Cleaner Lid,
CEVT, 2016.

Air Induction System (AIS) Optimization 10 July 2016
54
[41] C. Wei, Friction Connector on The Outer Side of The Air Cleaner Box Lid
Hose, CEVT, 2016.
[42] C. Wei, Friction Connector on The Outer Side of The Outer Surface of
The Clean Side Duct, CEVT, 2016.
[43] CEVT, Quick Connector on The Charge Air Rubber Hose, CEVT.
[44] C. Wei, Rubber Hose Material Properties Analysis in CATIA, CEVT,
2016.
[45] C. Wei, IPEE Material Properties Analysis in CATIA, CEVT, 2016.
[46] CEVT, Technical Regulation Air Cleaner, CEVT, 2016.
[47] CEVT, Technical Regulation Clean Side Duct, CEVT, 2016.
[48] CEVT, Technical Regulation Charge Air System, CEVT, 2016.