Embed Size (px)
Citation preview
AIR CURTAINS USED FOR SEPARATING SMOKE FREE ZONES IN CASE OF
FIRE
Grzegorz Krajewski1, Grzegorz Sztarbala1 1Building Research Institute, Fire Research Department, Warsaw, Poland
ABSTRACT The aim of thise paper is to take the advantage of CFD application in calculating, optimising, and designing air curtains used to separate smoke free zones in case of fire. Properly designed air curtain produces a pressure drop which forbids transversal flow through the opening. Most air curtains are tested on scaled down models which are difficult to extrapolate. The intention of this paper is to present the possibilities of CFD while designing air curtains used in fire safety engineering.
INTRODUCTION To avoid standstill and facilitate the flow of vehicles and people through doorways of buildings and other enclosures, solid doors are often replaced or supplemented by air curtains (air screens, air planes). Simultaneously, the air screen eliminates or reduces the transfer of heat and mass through the opening. Air curtains have become popular in the 60’s of the 20th century; nevertheless, the principles of the air planes dates back to 1904. The concept of air screens was founded by Theophilus van Kennel and his idea has become a forerunner of modern air curtains. The flow of air across the doors is caused by: the difference of pressure between two volumes of fluid, the dissimilar temperature values, and the presence of ventilation system. Air curtain devices are often used in the entrances to the public buildings, cooling rooms and refrigerators, as well in chemical and electronic industry. The knowledge that a direct exposure to fire is not the most immediate threat to people’s lives, has been displayed by previous experience and research. A vast majority of fatalities connected with fire are triggered by the smoke-inhalation. Therefore, to decrease the number of fatalities air curtain devices can be used as virtual screens to stop smoke spreading in a building object. Safe evacuation of people and secure intervention of fire fighters are of significant importance and need to be taken into consideration, as mentioned in the article of Sztarbala and Krajewski (2009). Air screens can be used to obstruct or reduce the movement of toxic smoke while enabling full access to emergency exits. Properly designed air curtains produce a pressure
drop which forbids transversal flow through the opening. The main criterion for the air curtain is its efficiency which is the rate of mass and heat transfer while crossing it, in comparison with the same opening without the curtain. Furthermore, air- curtains designing is considered relatively difficult. It is essential to know the conditions on both sides of the air curtain to chose its parameters correctly. If the outlet velocity is too high and blowing angle is not optimal, the air curtain can increase the heat and mass transfer through itself. In other case, if the jet velocity is too low, air curtain will not be tight enough. Currently, most of the installations are experimentally set up on scaled down or full scale physical models. Nonetheless, it is hard to extrapolate results from the scaled down model to the real geometrical dimensions because the Euler number similitude is unavailable. As it is written in published literature that kind of extrapolation provides an over-efficient results. To study the performance of air curtains the application of computational fluid dynamics (CFD) is immensely useful. It is critical to properly define initial and boundary conditions and compare gained results from simulations with analytical equations.
AIR CURTAIN DESCRIPTION Velocity distribution There are numerous publications involving experimental data and mathematical analysis presenting the theory of a free stream jet as velocity profile and deflection of the centreline axis. Significantly in this subject, publications of Abramovich (1963) and Rajaratnam (1976) offer the most fundamental piece of information. Particularly, depending on the height and the stream of an air, a jet shows two, three or four regions. It is possible to distinguish the potential core zone, the transition zone, and the developed zone or the impinging zone (Fig.1):
Proceedings of Building Simulation 2011: 12th Conference of International Building Performance Simulation Association, Sydney, 14-16 November.
- 2773 -
Potential core zone - characteristic for this region is that the centreline velocity is almost constant and equal to the outlet velocity U0. Transition zone – this region starts with the velocity decay and the amplification of the jet expansion. It generally starts after approximately 5 e from the nozzle. Analytical solution of the velocity can be described by:
Eqs. 1
Developed zone – in this region velocity decay remains constant. Velocity decay expressed with non-dimensional quantities. It generally starts after approximately 20 e from the nozzle. Analytical solution of the velocity can be described by (Schlichting 1968):
Eqs. 2
Eqs. 3
C1 and C2 depends on the nozzle shape and on the boundary conditions. They are in the range 1.9 < C1 < 3.0 and -8 < C2 < 10 Impinging zone - this region is in the vicinity of the floor. The flow in that zone is very complex and still not well known. Thickness of that zone is approximately 15% of total height.
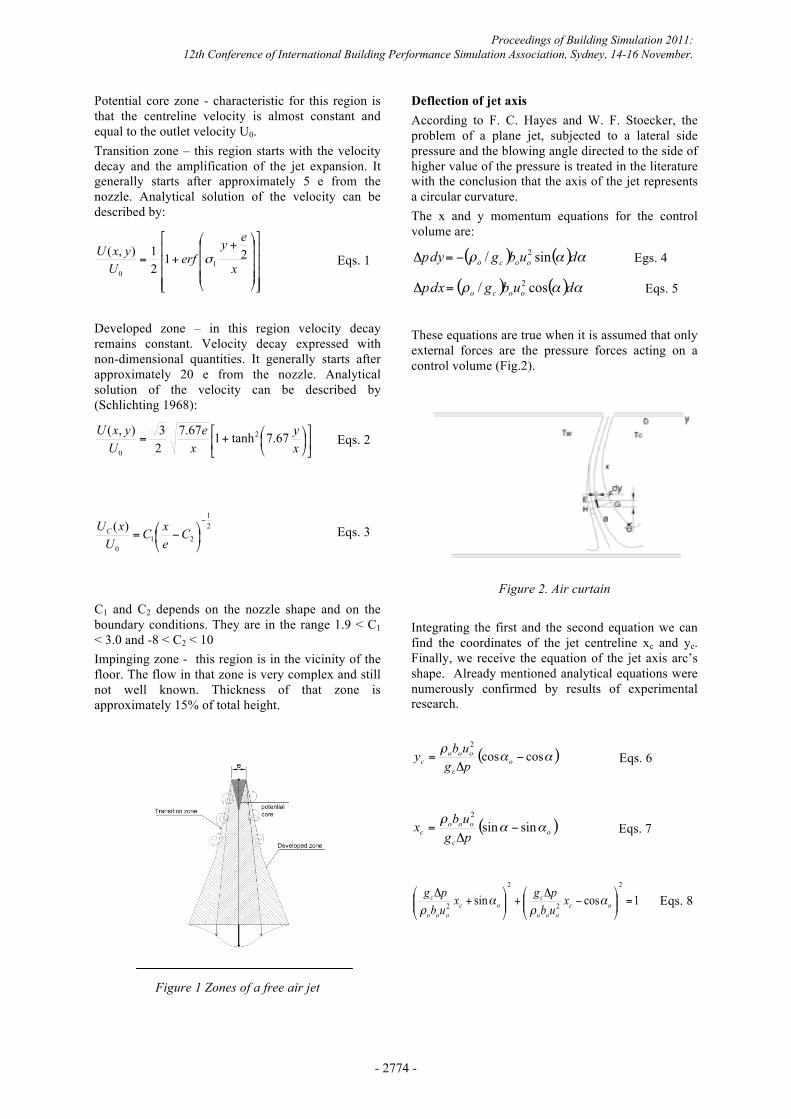
Figure 1 Zones of a free air jet
Deflection of jet axis According to F. C. Hayes and W. F. Stoecker, the problem of a plane jet, subjected to a lateral side pressure and the blowing angle directed to the side of higher value of the pressure is treated in the literature with the conclusion that the axis of the jet represents a circular curvature. The x and y momentum equations for the control volume are:
Egs. 4
Eqs. 5
These equations are true when it is assumed that only external forces are the pressure forces acting on a control volume (Fig.2).
Figure 2. Air curtain
Integrating the first and the second equation we can find the coordinates of the jet centreline xc and yc. Finally, we receive the equation of the jet axis arc’s shape. Already mentioned analytical equations were numerously confirmed by results of experimental research.
Eqs. 6
Eqs. 7
Eqs. 8
Proceedings of Building Simulation 2011: 12th Conference of International Building Performance Simulation Association, Sydney, 14-16 November.
- 2774 -
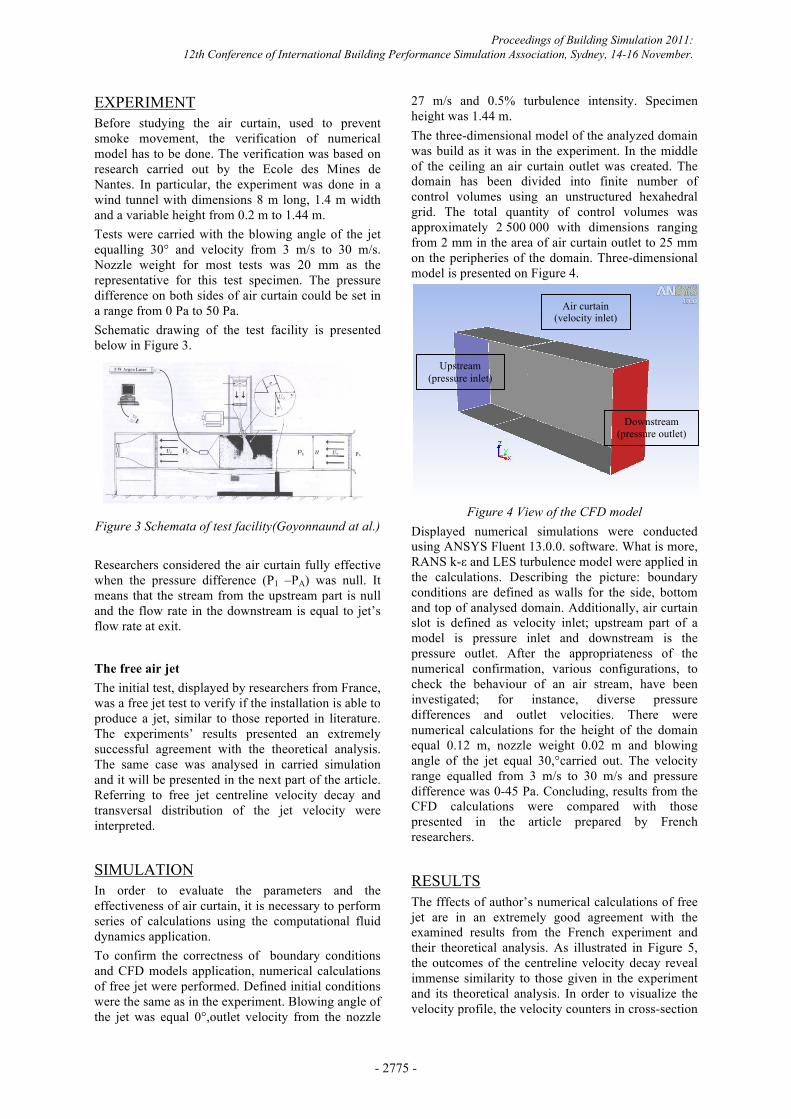
EXPERIMENT Before studying the air curtain, used to prevent smoke movement, the verification of numerical model has to be done. The verification was based on research carried out by the Ecole des Mines de Nantes. In particular, the experiment was done in a wind tunnel with dimensions 8 m long, 1.4 m width and a variable height from 0.2 m to 1.44 m. Tests were carried with the blowing angle of the jet equalling 30° and velocity from 3 m/s to 30 m/s. Nozzle weight for most tests was 20 mm as the representative for this test specimen. The pressure difference on both sides of air curtain could be set in a range from 0 Pa to 50 Pa. Schematic drawing of the test facility is presented below in Figure 3.
Figure 3 Schemata of test facility(Goyonnaund at al.) Researchers considered the air curtain fully effective when the pressure difference (P1 –PA) was null. It means that the stream from the upstream part is null and the flow rate in the downstream is equal to jet’s flow rate at exit.
The free air jet The initial test, displayed by researchers from France, was a free jet test to verify if the installation is able to produce a jet, similar to those reported in literature. The experiments’ results presented an extremely successful agreement with the theoretical analysis. The same case was analysed in carried simulation and it will be presented in the next part of the article. Referring to free jet centreline velocity decay and transversal distribution of the jet velocity were interpreted.
SIMULATION In order to evaluate the parameters and the effectiveness of air curtain, it is necessary to perform series of calculations using the computational fluid dynamics application. To confirm the correctness of boundary conditions and CFD models application, numerical calculations of free jet were performed. Defined initial conditions were the same as in the experiment. Blowing angle of the jet was equal 0°,outlet velocity from the nozzle
27 m/s and 0.5% turbulence intensity. Specimen height was 1.44 m. The three-dimensional model of the analyzed domain was build as it was in the experiment. In the middle of the ceiling an air curtain outlet was created. The domain has been divided into finite number of control volumes using an unstructured hexahedral grid. The total quantity of control volumes was approximately 2 500 000 with dimensions ranging from 2 mm in the area of air curtain outlet to 25 mm on the peripheries of the domain. Three-dimensional model is presented on Figure 4.
Figure 4 View of the CFD model
Displayed numerical simulations were conducted using ANSYS Fluent 13.0.0. software. What is more, RANS k-ε and LES turbulence model were applied in the calculations. Describing the picture: boundary conditions are defined as walls for the side, bottom and top of analysed domain. Additionally, air curtain slot is defined as velocity inlet; upstream part of a model is pressure inlet and downstream is the pressure outlet. After the appropriateness of the numerical confirmation, various configurations, to check the behaviour of an air stream, have been investigated; for instance, diverse pressure differences and outlet velocities. There were numerical calculations for the height of the domain equal 0.12 m, nozzle weight 0.02 m and blowing angle of the jet equal 30,°carried out. The velocity range equalled from 3 m/s to 30 m/s and pressure difference was 0-45 Pa. Concluding, results from the CFD calculations were compared with those presented in the article prepared by French researchers.
RESULTS The fffects of author’s numerical calculations of free jet are in an extremely good agreement with the examined results from the French experiment and their theoretical analysis. As illustrated in Figure 5, the outcomes of the centreline velocity decay reveal immense similarity to those given in the experiment and its theoretical analysis. In order to visualize the velocity profile, the velocity counters in cross-section
Upstream (pressure inlet)
Downstream (pressure outlet)
Air curtain (velocity inlet)
Proceedings of Building Simulation 2011: 12th Conference of International Building Performance Simulation Association, Sydney, 14-16 November.
- 2775 -
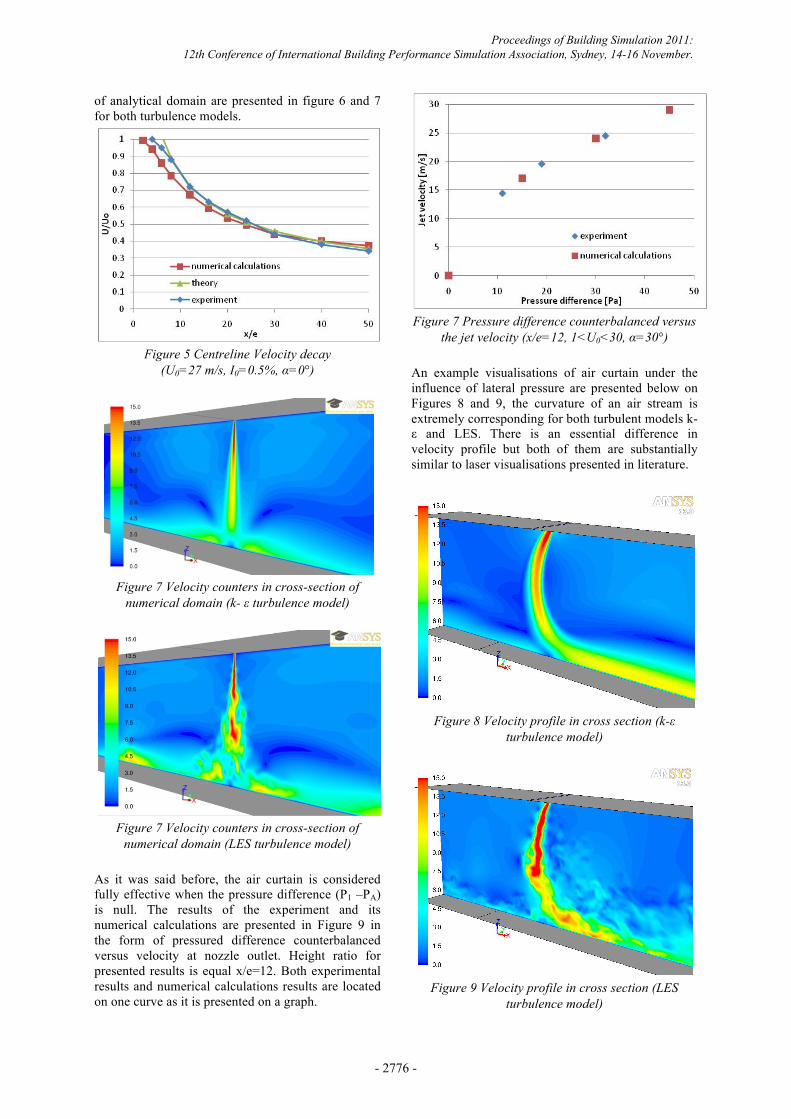
of analytical domain are presented in figure 6 and 7 for both turbulence models.
Figure 5 Centreline Velocity decay
(U0=27 m/s, I0=0.5%, α=0°)
Figure 7 Velocity counters in cross-section of
numerical domain (k- ε turbulence model)
Figure 7 Velocity counters in cross-section of
numerical domain (LES turbulence model)
As it was said before, the air curtain is considered fully effective when the pressure difference (P1 –PA) is null. The results of the experiment and its numerical calculations are presented in Figure 9 in the form of pressured difference counterbalanced versus velocity at nozzle outlet. Height ratio for presented results is equal x/e=12. Both experimental results and numerical calculations results are located on one curve as it is presented on a graph.
Figure 7 Pressure difference counterbalanced versus
the jet velocity (x/e=12, 1<U0<30, α=30°)
An example visualisations of air curtain under the influence of lateral pressure are presented below on Figures 8 and 9, the curvature of an air stream is extremely corresponding for both turbulent models k-ε and LES. There is an essential difference in velocity profile but both of them are substantially similar to laser visualisations presented in literature.
Figure 8 Velocity profile in cross section (k-ε
turbulence model)
Figure 9 Velocity profile in cross section (LES
turbulence model)
Proceedings of Building Simulation 2011: 12th Conference of International Building Performance Simulation Association, Sydney, 14-16 November.
- 2776 -
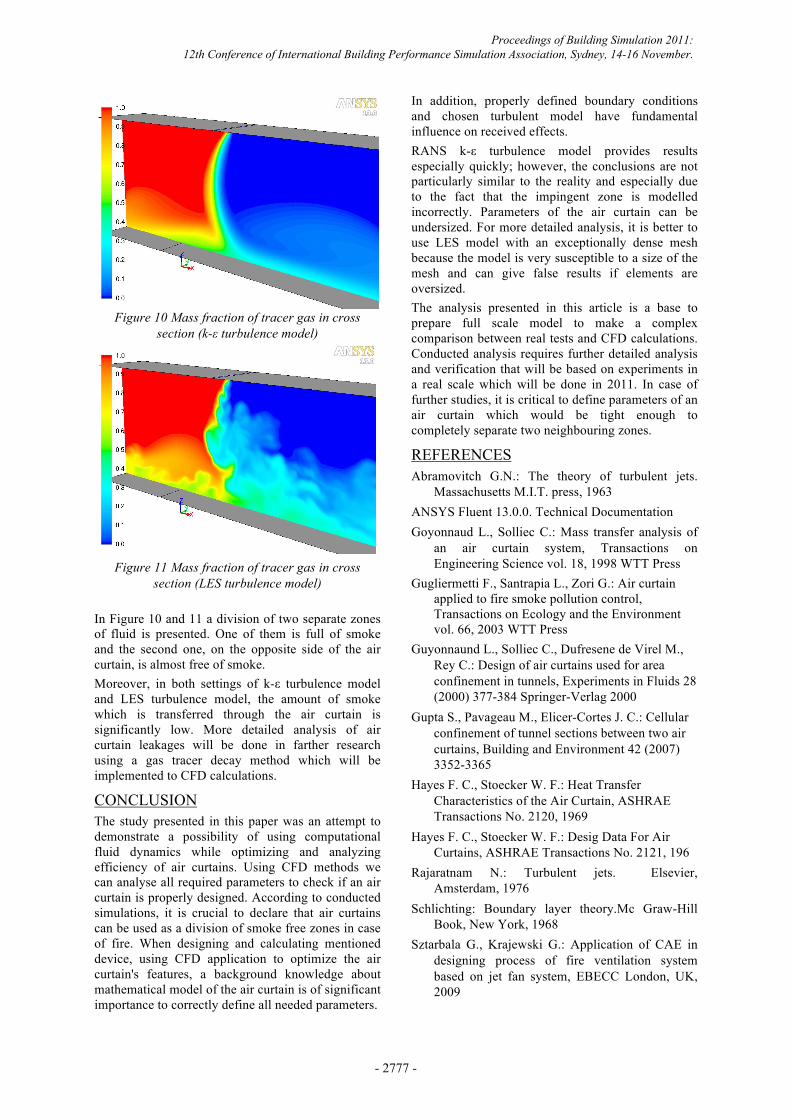
Figure 10 Mass fraction of tracer gas in cross
section (k-ε turbulence model)
Figure 11 Mass fraction of tracer gas in cross
section (LES turbulence model)
In Figure 10 and 11 a division of two separate zones of fluid is presented. One of them is full of smoke and the second one, on the opposite side of the air curtain, is almost free of smoke. Moreover, in both settings of k-ε turbulence model and LES turbulence model, the amount of smoke which is transferred through the air curtain is significantly low. More detailed analysis of air curtain leakages will be done in farther research using a gas tracer decay method which will be implemented to CFD calculations.
CONCLUSION The study presented in this paper was an attempt to demonstrate a possibility of using computational fluid dynamics while optimizing and analyzing efficiency of air curtains. Using CFD methods we can analyse all required parameters to check if an air curtain is properly designed. According to conducted simulations, it is crucial to declare that air curtains can be used as a division of smoke free zones in case of fire. When designing and calculating mentioned device, using CFD application to optimize the air curtain's features, a background knowledge about mathematical model of the air curtain is of significant importance to correctly define all needed parameters.
In addition, properly defined boundary conditions and chosen turbulent model have fundamental influence on received effects. RANS k-ε turbulence model provides results especially quickly; however, the conclusions are not particularly similar to the reality and especially due to the fact that the impingent zone is modelled incorrectly. Parameters of the air curtain can be undersized. For more detailed analysis, it is better to use LES model with an exceptionally dense mesh because the model is very susceptible to a size of the mesh and can give false results if elements are oversized. The analysis presented in this article is a base to prepare full scale model to make a complex comparison between real tests and CFD calculations. Conducted analysis requires further detailed analysis and verification that will be based on experiments in a real scale which will be done in 2011. In case of further studies, it is critical to define parameters of an air curtain which would be tight enough to completely separate two neighbouring zones.
REFERENCES Abramovitch G.N.: The theory of turbulent jets.
Massachusetts M.I.T. press, 1963 ANSYS Fluent 13.0.0. Technical Documentation Goyonnaud L., Solliec C.: Mass transfer analysis of
an air curtain system, Transactions on Engineering Science vol. 18, 1998 WTT Press
Gugliermetti F., Santrapia L., Zori G.: Air curtain applied to fire smoke pollution control, Transactions on Ecology and the Environment vol. 66, 2003 WTT Press
Guyonnaund L., Solliec C., Dufresene de Virel M., Rey C.: Design of air curtains used for area confinement in tunnels, Experiments in Fluids 28 (2000) 377-384 Springer-Verlag 2000
Gupta S., Pavageau M., Elicer-Cortes J. C.: Cellular confinement of tunnel sections between two air curtains, Building and Environment 42 (2007) 3352-3365
Hayes F. C., Stoecker W. F.: Heat Transfer Characteristics of the Air Curtain, ASHRAE Transactions No. 2120, 1969
Hayes F. C., Stoecker W. F.: Desig Data For Air Curtains, ASHRAE Transactions No. 2121, 196
Rajaratnam N.: Turbulent jets. Elsevier, Amsterdam, 1976
Schlichting: Boundary layer theory.Mc Graw-Hill Book, New York, 1968
Sztarbala G., Krajewski G.: Application of CAE in designing process of fire ventilation system based on jet fan system, EBECC London, UK, 2009
Proceedings of Building Simulation 2011: 12th Conference of International Building Performance Simulation Association, Sydney, 14-16 November.
- 2777 -