Embed Size (px)
Citation preview

AHRTI Report No. 9008
HOT SURFACE IGNITION OF A2L REFRIGERANTS
Final Report
Date Published – November, 2017
Michael Cundy, Ph.D., P.E., C.F.E.I.
Prepared for
AIR-CONDITIONING, HEATING AND REFRIGERATION TECHNOLOGY
INSTITUTE, INC
2111 Wilson Boulevard, Suite 500, Arlington, Virginia 22201-3001
©2017 AHRTI
ASHRAE has the right to publish, reproduce, duplicate and use such report provided that the
AHRTI copyright notice is included on all copies of the report distributed by AHRTI.
ii
DISCLAIMER
This report was prepared as an account of work sponsored by the Air-Conditioning, Heating and
Refrigeration Technology Institute, Inc. (AHRTI). Neither AHRTI, its research program financial
supporters, or any agency thereof, nor any of their employees, contractors, subcontractors or
employees thereof - makes any warranty, expressed or implied; assumes any legal liability or
responsibility for the accuracy, completeness, any third party’s use of, or the results of such use
of any information, apparatus, product, or process disclosed in this report; or represents that its
use would not infringe privately owned rights. Reference herein to any specific commercial
product, process, or service by trade name, trademark, manufacturer, or otherwise, does not
necessarily constitute nor imply its endorsement, recommendation, or favoring by AHRTI, its
sponsors, or any agency thereof or their contractors or subcontractors. The views and opinions of
authors expressed herein do not necessarily state or reflect those of AHRTI, its program sponsors,
or any agency thereof.
Funding for this project was provided by (listed alphabetically):
- Air-Conditioning, Heating and Refrigeration Institute (AHRI)
- American Society of Heating, Refrigerating, and Air-Conditioning Engineers (ASHRAE)

1
Executive Summary
Exponent was retained by the Air-Conditioning, Heating, and Refrigeration Technology
Institute (AHRTI) to carry out work related to hot surface ignition of A2L refrigerants. The
scope of the study was to develop a test methodology and use the method to conduct hot surface
ignition temperature (HSIT) testing for three A2L refrigerants under specific conditions
prescribed by the AHRTI subcommittee. The test methodology was developed to assist in the
evaluation of the propensity of A2L refrigerants (R32, R1234ze, and R452B) to ignite on hot
surfaces. After multiple conversations with AHRTI, Exponent designed and constructed a test
apparatus to discharge a 5 g charge of refrigerant or refrigerant/oil mixture out of a tube and
onto a hot, flat plate. Five replicate tests were performed for each test condition. None of the
pure refrigerants tested ignited at hot plate temperatures up to 850°C (1562°F), and none of the
refrigerants mixtures with 3% oil by mass ignited with the hot plate temperatures up to 800°C
(1472°F). However, it must be emphasized that the propensity for hot surface ignition is
significantly dependent upon several factors including surface temperature, surface geometry
and roughness, contact time with surface, ambient environment, and mixture uniformity.
Therefore, it may be possible to achieve hot surface ignition at lower temperatures under
different conditions with the same refrigerants tested.
The results presented in this report are valid for the specific test conditions used here which
simulated releasing a refrigerant onto a flat hot surface heated by an electric heating element
inside warm ductwork. Because the HSIT is dependent on many factors, consideration of
additional testing with different hot surface geometries that may be found in actual heating
systems (e.g. heating coils in HVAC) is recommended. The characteristics of the leak are also
expected to influence the HSIT and this report did not consider testing or attempt to quantify the
sensitivity of HSIT to different spray characteristics such as those encountered by cracked lines,
pinholes, braze failures (with different spray velocities and dispersion characteristics) and
temperatures. For these reasons, the test results may not adequately address the needs of other
users of this report, or quantify the HSIT for specific HVAC equipment configurations. For

2
purposes of developing standards related to HSIT, due consideration to equipment geometry and
leak characteristics is recommended.

3
Contents
Page
List of Figures 4
Introduction 5
Test Setup 10
Test Results 18
Summary 24

4
List of Figures
Page
Figure 1 ASTM E 659 test apparatus used for determining the AIT. 6
Figure 2 Fuel vapor pressure vs. surface temperature plot illustrating the forced
ignition region and the hot surface ignition region, along with the AIT and
flammability limits. 7
Figure 3 Schematic of the test setup. 10
Figure 4 Test apparatus. 11
Figure 5 Photograph showing the interior of the test setup. 12
Figure 6 Photographs showing the fan assembly as viewed through the front viewing
panel (left) and as viewed through the side hatch (right). 12
Figure 7 Screenshot of a video showing the heated hot plate with 0.15 m (6.0”)
square box channel integrated into the test chamber. 13
Figure 8 Photograph of the hot plate at approximately room temperature showing
locations of the embedded thermocouples. Note that this photograph shows
cartridge heaters that were used in test ID1 and ID2. The red dots indicate
the insertion depth of the thermocouples. Since the plate is 0.20 m x 0.20 m
(8” x 8” and a 0.15 m x 0.15 m (6” x 6”) box channel was placed on top of
it, the lower left thermocouple is beneath an exposed surface. 14
Figure 9 Refrigerant charge assembly. 16
Figure 10 Test to verify that applying a vacuum to the cylinder did not pull POE oil
out of the cylinder. 17
Figure 11 Test ID15 data. 20
Figure 12 Screenshots of ejection in 3/120s increments for test ID15 with pure R-
1234ze refrigerant and with a target hot plate temperature of 850°C
(1562°F). 21
Figure 13 Test ID36 data. 22
Figure 14 Screenshots of ejection in 3/120s increments for test ID36 with R452B
refrigerant mixed with 3% POE oil by mass, and with a hot plate
temperature of 800°C (1472°F). 23

5
Introduction
The AHRTI issued a request for proposals (RFP) to investigate the hot surface ignition
temperature (HSIT) of three A2L refrigerants. Current heating, ventilation, and air-conditioning
& refrigeration (HVAC&R) equipment standards relating to hot surface temperatures are
primarily based on the auto-ignition temperature (AIT), minus 100°C (∆180°F). In general,
A2L refrigerants have a lower AIT than non-flammable refrigerants which may limit their use in
some HVAC&R products if the same criteria are used. However, limiting the maximum
temperature of some components in HVAC&R systems to the AIT minus 100°C (∆180°F) may
be overly conservative as the minimum ignition energies (MIE) of the A2L refrigerants can be
considerably higher than known common residential ignition sources. In addition, the burning
velocities of A2L refrigerants are lower than class A2 and A3 refrigerants.
In the US, the AIT is typically determined using the ASTM E 6591 test method and apparatus,
as shown in Figure 1, although other methods are also used (EN 14522,2 IEC 60079-20-13). The
ASTM E 659 test setup involves a 500 ml borosilicate round-bottom, short-necked boiling flask,
whereby the chemical to be characterized is added to the flask in a specific quantity (100 µl for
liquids, and 100 mg for gases and solids) and the temperature is uniformly raised until ignition
is achieved. At each temperature set point the test apparatus is observed for 10 minutes,
allowing the gases and vapors to mix with the air before the sample at that concentration is
considered nonflammable or flammable. Different concentrations of the chemical of interest are
then tested.
1 ASTM E 659-78, Standard Test Method for Autoignition Temperature of Liquid Chemicals, ASTM, West
Conshohocken, PA 1994.
2 EN 14522, Determination of the autoignition temperature of gases and vapours, 2005.
3 IEC 60079-20-1, Material characteristics for gas and vapour classification – Test methods and data, 2012.

6
Figure 1 ASTM E 659 test apparatus used for determining the AIT.
However, the environment in the ASTM E 659 test apparatus where the lowest ignition
temperature occurred for a particular chemical is not typically encountered in products and
systems in use for various reasons. For example, there may be non-ideal and/or non-uniform
concentrations. The effect of mole fraction (or vapor pressure) and temperature is qualitatively
illustrated in Figure 2. 4,5,6,7 The lowest temperature at which hot surface ignition may occur is
at a specific, spatially uniform fuel vapor pressure. If the mole fraction is higher or lower, a
higher surface temperature is required. The fuel mole fractions where hot surface ignition may
occur do not reach all the way to the flammability limits primarily because of heat losses to the
4D. Drysdale, An Introduction to Fire Dynamics, 2nd edition, Chichester: John Wiley & Sons, 2002.
5A.M. Kanury, Ignition of Liquid Fuels, SFPE Handbook of Fire Protection Engineering, 3rd edition, Quincy, MA:
National Fire Protection Association, 2002, Section 2, Chapter 8, pg. 2-189-2-190
6 M.G. Zabetakis, Flammability Characteristics of Combustible Gases and Vapors, Bulletin 627, U.S. Department
of the Interior, Bureau of Mines, Washington D.C., 1965.
7 Colwell, J., and Reza, A., Hot Surface Ignition of Automotive and Aviation Fluids, Fire Technology, 41, p 105-
123, 2005.

7
surfaces or due to convection. The region between the hot surface ignition region and the
flammability limits is the forced ignition region, where a higher external energy source is
required to raise the temperature of reactants high enough to initiate sustained combustion.
Figure 2 Fuel vapor pressure vs. surface temperature plot illustrating the forced ignition region and the hot surface ignition region, along with the AIT and flammability limits.8
The potential for hot surface ignition to occur in real-world systems and products is also
dependent, among other factors, upon the surface shapes, roughness,9 and characteristics, as
well as the uniformity of the surface temperatures, both of which are linked to the ambient
environment by heat transfer and fluid flow. Surfaces may be concave, convex, flat, or have
various contours and shapes. In an ideal case, such as in the ASTM E 659 test apparatus, the
surface is a round-bottom, short-necked boiling flask, where the hot surface will heat the
adjacent mixture evenly (see the AIT in Figure 2). In the case of a flat surface or a surface with
contours such as an electric coil heater, the ambient temperatures will have gradients, and there
will be fluid flow associated with natural and potentially forced convection.
8 Colwell, J., and Reza, A., Hot Surface Ignition of Automotive and Aviation Fluids, Fire Technology, 41, p 105-
123, 2005.
9 Bennett, J. M., Ignition of Combustible Fluids by Heated Surfaces, Process Safety Progress 20, 29-36 (2001).

8
HSIT is also dependent upon the local environment. The local environment is coupled to the
hot surface and the surroundings by heat transfer and fluid flow, including both natural and
convective heat and mass transfer mechanisms and radiation. The refrigerant temperature, as it
leaves the hot surface area after making contact, is influenced by the charge storage temperature
and pressure, release mechanism (or test apparatus characteristics), time in close proximity to
the hot surface, hot surface temperature, and the local environment with which the heated
refrigerant mixes, all of which will affect the propensity for ignition.
A literature review of published hot surface ignition studies of some liquids can be found in an
article by Colwell and Reza.10 In summary, many of the studies reviewed tested a large number
of test configurations including different surface geometries, air flows, and chemical application
methods (sprays, streams, and different flow rates), and as a result, a range of HSITs were
recorded for the tested chemicals. Colwell and Reza utilized a flat plate with no cross flow to
facilitate reproducibility of tests involving liquid fuels. In this work, they dropped single
droplets of fluid onto a flat, hot plate.
Another literature review by Babrauskas discusses hot surface ignition competency for gases,
vapors, liquid sprays, aerosols, and other forms of ignitable liquids dispersed in the atmosphere.
11 This review shows that the quantity of turbine oil dropped onto a hot surface can change the
HSIT (450°C at 2 drops to 315°C at 30-60 mL).12 Babrauskas also noted an inverse
relationship between HSIT and the flash point of the fuel, discussing how gasoline is difficult to
ignite on a hot surface. Babrauskas suggested that detailed modeling could be performed to
better understand the mixing process and temperature fields to understand this behavior.
Babrauskas’ article notes that for most, but not all of the hydrocarbon/air mixtures studied,
ignitions were more easily achieved at the LFL. For the fuels studied, flow velocity was found
to have only a small effect on ignitions unless the velocity is large, in which case ignitions were
more difficult. Studies have also observed that larger surfaces facilitate ignition of
10 Colwell and Reza, Hot Surface Ignition of Automotive and Aviation Fluids, Fire Technology, 41, pg. 105-123,
2005.
11 Babrauskas, V., Ignition of gases, vapors, and liquids by hot surfaces, Proceedings of the 3rd International
Symposium on Fire Investigation Science and Technology, 2008.
12 Knowles, R. E., Discussion, Institute of Marine Engineers Trans. (London) 77, 137-138 (1965).

9
hydrocarbon/air, diethyl ether/air, hydrogen/air, and town gas/air mixtures.13 This is likely true
for non-uniform mixture concentrations, as is the case in the current study.
Hot surface ignition testing of R-32 and R-410A refrigerants have been performed using a flat,
hot plate by Boussouf at the University of Maryland, who selected the flat plate geometry based
on testing of liquid automotive fuels.14 The test developed in this work also utilized a flat plate
for consistency and to also facilitate reproducibility.
In this report, the development of the test setup and test procedure is described. The results of
the tests are then presented with screenshots of video and data from selected tests. A table with
details on all tests is shown in Appendix A, and plots of the recorded data are shown in
Appendix B.
13 Babrauskas, V., Ignition Handbook, Fire Science and Technology, p87-88, 2003
14 Boussouf, A., Hot Surface Ignition of R-32 and R-410A Refrigerant Mixtures with Lubricating Oil, Master of
Science Thesis, University of Maryland, College Park, 2014.

10
Test Setup
A schematic of the test setup can be found in Figure 3. The AHRTI subcommittee requested a
test setup which could simulate a HVAC ductwork to study HSIT. Therefore, the test setup was
designed such that the dimensions around the hot surface were similar to those that may be
encountered in a typical HVAC ductwork. The AHRTI subcommittee also requested that the
test setup be capable of generating an air flow with a uniform velocity of up to 50 fpm in a
region upstream of the hot plate in order to study the effect of ventilation on ignition propensity.
In order to achieve this specification, a recirculation chamber was developed. The recirculation
chamber is 0.750 m tall, 0.750 m deep, and 1.50 m long (29.5” x 29.5” x 59.0”) as viewed from
the side. A divider panel, which defines the circulation path, is 0.500 m (19.7”) above the floor
and runs from the front to the back of the chamber (see the lateral panel in Figure 3).
Figure 3 Schematic of the test setup.
A photograph of the test setup is shown in Figure 4. Fresh air is introduced into the chamber
through a quick-release plexiglass front panel and a hinged panel on the right side of the

11
chamber. After introducing fresh air and purging gases from the previous test, the plexiglass
panel is then reinstalled. For tests with higher absolute humidity, a water mist was sprayed
using a metered spray nozzle towards the fans above the divider table through the hinged panel
on the right side, and the panel was then closed (see Figure 3 and Figure 6).
Insulation panels were adhered to the outside of the chamber to facilitate reaching higher
ambient temperatures within the chamber.
Figure 4 Test apparatus.
A photograph of the interior of the test setup is shown in Figure 5. Four nickel chromium
electric heaters were installed above the divider table and to the left side of the chamber. Air
was pushed across these heaters using three 0.2 m (8”) diameter fan blades. Since testing
conditions required a target air temperature of 93°C (200°F), the fan motor was installed outside
of the test chamber, and a miter gear and chain and sprocket system was developed to drive the
fan blades (see Figure 6). Combined air and relative humidity sensors (Dwyer 657-1) were
installed at the mid-height level of the flow path, upstream of the hot plate, and were
approximately 0.2 m (9”) from the side walls of the chamber.
Fan motor Front hot wire
probes
Cutout for heater
Front air temp and
RH probe

12
Figure 5 Photograph showing the interior of the test setup.
Figure 6 Photographs showing the fan assembly as viewed through the front viewing panel (left) and as viewed through the side hatch (right).
To achieve uniform airflow in the section that houses the hot plate,a perforated panel was used
with 1.59 mm (0.0625”) holes allowing for 23% open space on the leading edge of the divider
table followed by 6.4 mm (0.25”) honeycomb channels 2.54 cm (1.00”) long, and a 30% open
space perforated panel (1.59 mm, 0.0625” hole size) on the trailing edge of the divider table.
Air flow rates were measured with calibrated Dwyer 641RM-12 hot wire anemometers at 4
locations in the air flow path. Two of the hot wire anemometers can be seen in Figure 5, and the
other two are installed symmetrically on the plexiglass panel (see Figure 4). Each anemometer
Heaters Fans
Honeycomb
Hot wire probes
Air T, RH probe
Refrigerant
charge assy.
Water Mist

13
was approximately 25 cm (10”) from the nearest side wall (1/3 width) and approximately 17 cm
(6.5”) from the nearest lateral surface (1/3 height).
An 0.22 m x 0.22 m (8.5” x 8.5”) hole was cut into the bottom of the recirculation chamber to
allow for the insertion of a hot plate. A hot plate was developed for the testing. A custom
Kanthal A-1 heating element was fabricated and installed below a 0.20 m x 0.20 m x 1.9 cm
(8.0” x 8.0” x ¾”) copper block, and the supplied voltage was adjusted with a variable
transformer. A (0.15 m) 6.0” square box channel with rounded edges, with a 1.3 cm (0.50”)
depth, was placed on top of the hot plate, and ceramic fiber board was placed on the outside to
reduce the required heat load on the heating element and to reduce the heat load on the chamber.
A screenshot of a video showing the hot plate with the box channel integrated into the bottom of
the chamber can be seen in Figure 7. Two K-type thermocouples (Omega TJ36-CAIN-18U-6-
CC-XCIB) were embedded in the copper block (see Figure 8; note that this photograph shows
the hot plate with cartridge heaters used in test ID1 and ID2). The thermocouples had an
outside diameter of 0.318 cm (1/8”) and were inserted into a hole such that the top edge of the
thermocouples were approximately 0.159 cm (1/16”) from the surface of the copper block. This
approach was selected so that oil did not accumulate on fiberglass thermocouple wire insulation
and ignite, which then introduces a more competent ignition source (open flame). The location
of the thermocouple bead below the surface is indicated by the red dots in Figure 8.
Figure 7 Screenshot of a video showing the heated hot plate with 0.15 m (6.0”) square box channel integrated into the test chamber.

14
Figure 8 Photograph of the hot plate at approximately room temperature showing locations of the embedded thermocouples. Note that this photograph shows cartridge heaters that were used in test ID1 and ID2. The red dots indicate the insertion depth of the thermocouples. Since the plate is 0.20 m x 0.20 m (8” x 8” and a 0.15 m x 0.15 m (6” x 6”) box channel was placed on top of it, the lower left thermocouple is beneath an exposed surface.
Hot plate temperature (2 channels), air temperature (2 channels), air relative humidity (2
channels), refrigerant ejection trigger, air velocity (4 channels), and chamber pressure were
measured. Data was collected with a calibrated Graphtec GL-series data acquisition systems,
running at 5 Hz. Video was recorded at 120 fps.
The AHRTI subcommittee requested that 5 g refrigerant charges be ejected onto the hot plate
with a 1/8” outside diameter stainless steel tube. One of the refrigerant charge assemblies can
be seen in Figure 9. The charge assembly was installed onto a refrigerant cylinder, and the
contents of the charge assembly and fittings were evacuated with a vacuum pump. The valve
where the vacuum pump line connected to the system was then closed, and the refrigerant
cylinder valve was opened allowing refrigerant to fill the charge assembly. The valve on the
charge assembly was then closed, and the assembly was removed via a quick-disconnect fitting
and placed on the scale which had been previously tared with the charge assembly on-board.
The charge assemblies typically had between 7-10 g of refrigerant in them at this point. The

15
precision needle valve was then opened slightly, allowing refrigerant to escape, and the weight
was observed to slowly decrease. When the scale reached c.a. 5 g, the valve was closed and a
photograph was taken to record the weight of the charge. The assembly was then installed into
the recirculation chamber using a quick disconnect fitting. Note that the refrigerant cylinders
were rotated in a small concrete mixer at 30 rpm for approximately one hour prior to testing in
order to mix the refrigerant. The repeatability of the weight of the empty charge assemblies was
evaluated by removing the assembly from the scale and placing it down in a different orientation
several times, both before and during testing. All measurements were within 0.2 g of one
another (standard deviation of 0.08 g on four measurements prior to testing). Following
charging of discharge assembly, the assembly was installed into the chamber, and the front
panel was reinstalled. A photograph showing the charge assembly installed in the test fixture
can be seen in Figure 5. The nozzle exit was approximately 3.8 ± 0.8 cm (1.5 ± 0.3”) above the
hot plate. The discharge assembly solenoid was plugged in, air heaters were turned on, water
mist was sprayed into the test setup, and the refrigerant was discharged onto the hot plate.

16
Figure 9 Refrigerant charge assembly. Note that the weight of the assembly has been tared, and the scale display is showing the charge of refrigerant in the chamber.
Testing was also done with mixtures of refrigerant and oil that were prepared by Exponent. A
refrigerant recovery cylinder was acquired for each of the refrigerants. 90 g of polyol ester
(POE) oil (RL32-3MAF) was added to each of the recovery cylinders, and the air and any gases
inside the cylinders were evacuated using a vacuum pump. When the vacuum pump line was
disconnected, a paper towel was pushed into the fitting and pulled out to verify that the
application of a vacuum did not pull out oil (see Figure 10). After evacuation of the gaseous
contents in each recovery cylinder, 3 kg of refrigerant was added to the cylinder. Each of these
cylinders was mixed for at least one hour prior to testing, creating a mixture with 3% oil by
mass.

17
Figure 10 Test to verify that applying a vacuum to the cylinder did not pull POE oil out of the cylinder.

18
Test Results
Table 1 shows a summary of the tests with test conditions. A more comprehensive table with a
list of all tests can be seen in Appendix A, and the data associated with all of the tests can be
found in Appendix B. No ignitions were observed in testing with either the pure refrigerant
charges or the refrigerant charges with 3% POE oil by mass. All tests were run with a target
ambient air temperature of 200°F and with a target humidity ratio of 0.023 kg/kg (approximately
6% RH @ 200°F). For tests at 850°C (1562°F), the center plate temperatures at the time of
ejection ranged from 842°C to 860°C (1548°F to 1580°F), with the average for each of the three
refrigerants over 850°C (1562°F). For all tests at 700°C (1292°F), the center plate temperatures
ranged from 701°C to 716°C (1294°F to 1321°F), and for all tests at 800°C (1472°F), the center
plate temperatures ranged from 800°C to 824°C (1472°F to 1515°F).
Table 1 Summary of the test conditions and results.
Refrigerant Oil Target Plate
Temp. (°C/°F)
Target Chamber Air
Temp. (°C/°F)
Humidity Ratio
(kg/kg or lb/lb))
Ignition
R32 None 850/1562 93/200 0.023 0/5 R-452B None 850/1562 93/200 0.023 0/5
R-1234ze None 850/1562 93/200 0.023 0/5
R32 3% 700/1292 93/200 0.023 0/5
R-452B 3% 700/1292 93/200 0.023 0/5
R-1234ze 3% 700/1292 93/200 0.023 0/5
R32 3% 800/1472 93/200 0.023 0/5
R-452B 3% 800/1472 93/200 0.023 0/5
R-1234ze 3% 800/1472 93/200 0.023 0/5
The wind tunnel capability was not utilized in the present work, even though a wind tunnel
capability with uniform flow was added to the test specifications. This is because the
subcommittee assumed that the refrigerants will not be ignited at a certain hot surface
temperature with forced airflow across the plate if the refrigerant is not ignited under such a
temperature with no forced airflow crossing the plate. Because of the limited resources, tests
associated with higher plate temperature with forced airflow crossing the plate were not
conducted. It should be noted that natural convective currents did occur even though there was

19
no forced airflow across the hot plate for these tests. It may be of interest to increase the
surface temperature to ensure ignitions and determine if adding forced airflow decreases
ignition potential.
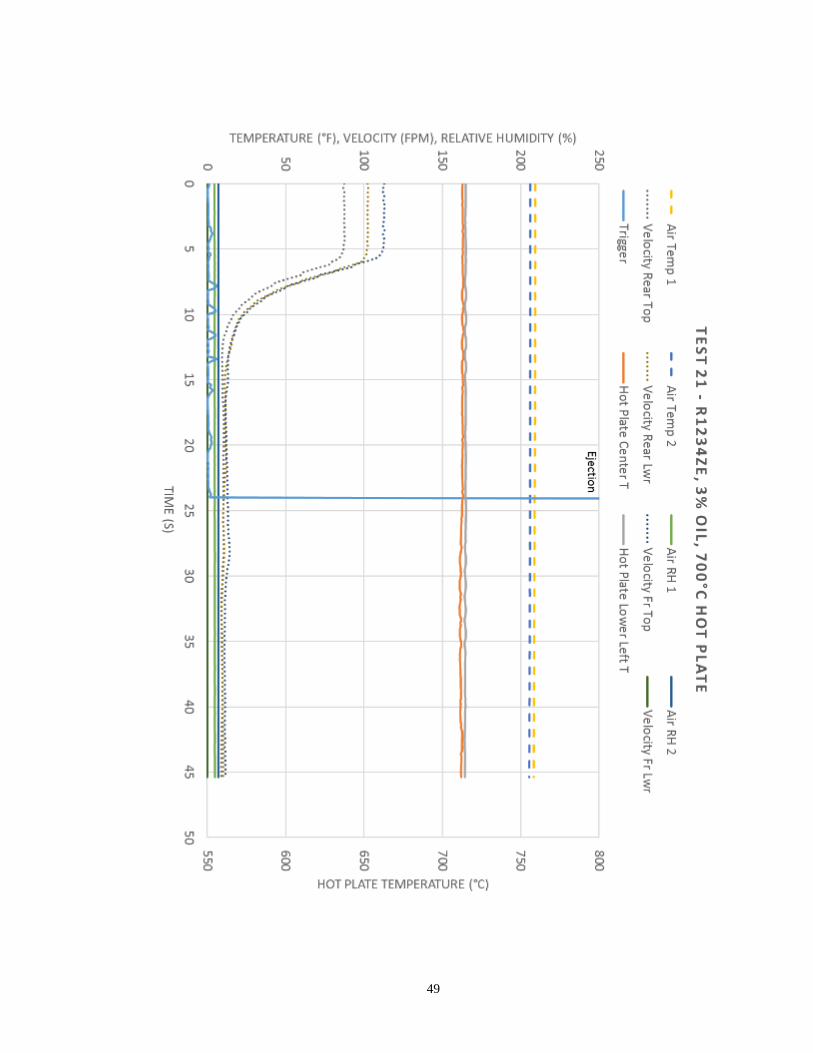
In this section, two tests are described in detail; one without oil and one with oil. In test ID15,
R-1234ze was tested with no oil added at a hot plate temperature of 850°C (1562°F). The data
associated with test ID15 is shown in Figure 11. Data collection began when the fans were
running, which were used to assist in achieving a uniform air temperature and humidity
upstream of the hot plate. The fans were then turned off, and the ejection was triggered when
the measured flows stabilized at approximately 2.5 – 5.0 cm/s (5.0-10 fpm). After ejection, the
hot plate center thermocouple temperature drops by approximately 7°C (∆13°F) as a result of
cooling by the refrigerant jet. The embedded thermocouple would tend to measure smaller
temperature drops because of its distance to the surface, but the high thermal conductivity of the
copper would counteract this effect. Analysis of the video footage of several tests indicates that
the refrigerant ejection typically takes place over approximately 0.07 s, which corresponds to an
average flow rate of approximately 71 g/s (0.16 lb/s). Screenshots of the video at 3/120s
intervals, starting with the first frame the ejection is visible can be seen in Figure 12. The flow
appears multiphase as it leaves the ejection tube.

20
Figure 11 Test ID15 data.

21
Figure 12 Screenshots of ejection in 3/120s increments for test ID15 with pure R-1234ze refrigerant and with a target hot plate temperature of 850°C (1562°F).

22
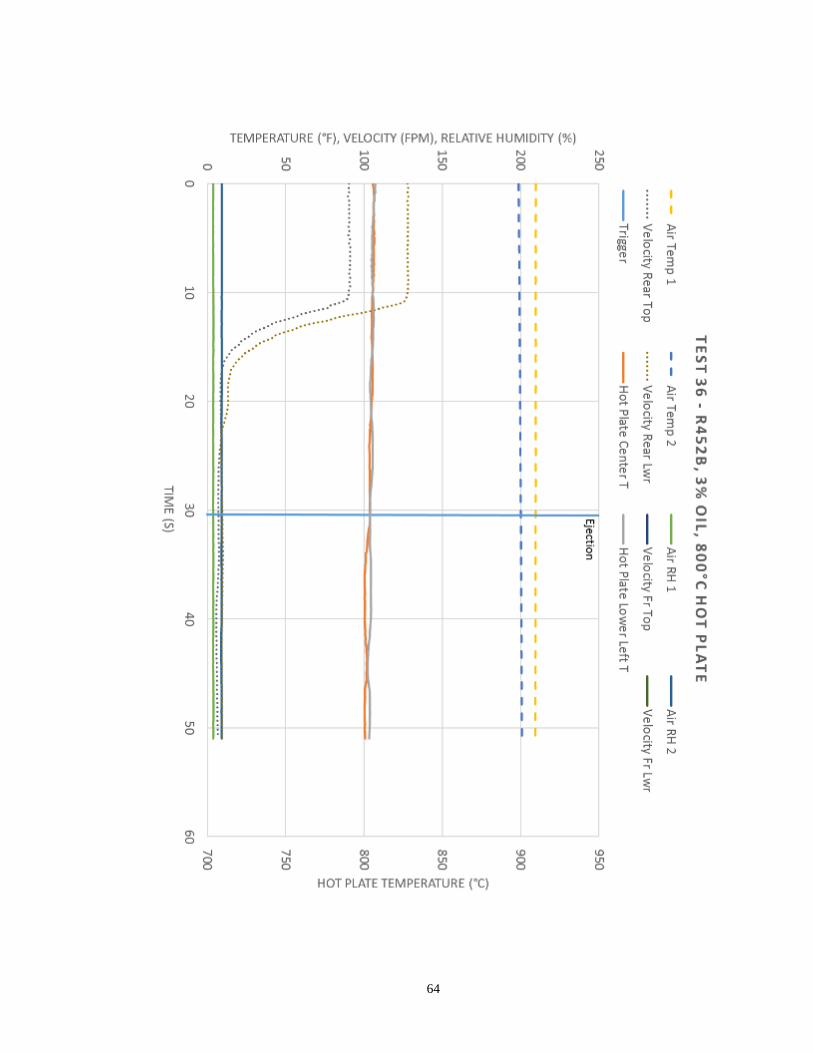
Test ID36 was a test with R452B mixed with 3% POE oil by mass and with a target hot plate
temperature of 800°C (1472°F). The data for this test can be seen in Figure 13. The refrigerant
and oil test data is substantially similar to the pure refrigerant test data, except that the central
surface temperature does not decrease as much in these tests, if it decreases at all. This is
evident in all of the tests with refrigerant and oil mixtures. Screenshots of the video at 3/120s
intervals, starting with the first frame the ejection is visible can be seen in Figure 14. The flow
appears multiphase as it leaves the ejection tube. The haze associated with atomized oil is
clearly visible in these tests.
Figure 13 Test ID36 data.

23
Figure 14 Screenshots of ejection in 3/120s increments for test ID36 with R452B refrigerant mixed with 3% POE oil by mass, and with a hot plate temperature of 800°C (1472°F).

24
Summary
Hot surface ignition did not occur with pure R32, R1234ze, and R452B refrigerants on a flat,
hot plate for hot plate temperatures up to 850°C (1562°F), ambient air temperatures of 93°C
(200°F), humidity ratios of 0.023 kg/kg (0.023 lb/lb), and with the specific refrigerant ejection
characteristics and natural convection flow characteristics in the chamber. Each refrigerant was
tested 5 times in each test condition. Additionally, hot surface ignition did not occur with R32,
R1234ze, and R452B refrigerants mixed with 3% POE oil by mass on a flat, hot plate for hot
plate temperatures up to 800°C (1472°F), ambient air temperatures of 93°C (200°F), humidity
ratios of 0.023 kg/kg (0.023 lb/lb), and with the specific refrigerant ejection characteristics and
natural convection flow characteristics in the chamber.
In addition to the basic laboratory tests performed in this study, consideration of testing with
actual equipment for further validation purposes is recommended. The hot surface ignition of
refrigerants is a complex phenomenon which depends on surface geometry and temperature;
ambient air temperature gradients and flow patterns; ambient air humidity; and the refrigerant
delivery mechanism, including flow rate, flow duration, phase, temperature and pressure, and
mixing with ambient air.
Potential future work in this area may include detailed modeling of the system in the current
work to better understand the magnitude of natural convection currents associated with the flat,
hot plate, the refrigerant release and mixing with the air, and any effects of a cross flow on the
mixing process. The modeling may also provide a better understanding of the mixing process at
all phases of the ejection process so that the size, location, mixture composition, and evolution
of regions between the UFL and LFL can be identified. Modeling of the temperature field can
be used to compare the temperatures with the AIT and assess the likelihood of ignition, and
modeling of the velocity field can be used to estimate if forced and natural convective currents
are high enough relative to the burning velocity of the refrigerant to inhibit ignition.
Future work may also consider a detailed survey of designs of HVAC&R units that may utilize
A2L refrigerants, noting locations where a leak could be problematic, fluid characteristics in
that location in the system (e.g. temperature, pressure, oil accumulation), and proximity to hot

25
surfaces in the system. That review could guide the design of testing in a test apparatus such as
the one described in this work, or in in-situ testing, so that one may create a realistic
refrigerant/oil/air mixture in the vicinity of a heater or hot surface that is the same or similar to
one found in a production unit. Different variables could then be probed based on the result of
that survey. It may be difficult to determine the surface temperatures of heaters or hot surfaces
in production units accurately. One possibility is to develop a representative coil heater where
the resistivity of the wire/coil is correlated to a temperature. Titanium wire may be a good
candidate given its high change in resistivity.

26
Appendix A. List of Tests
Test ID
Refrigerant Charge (g/oz)
Oil Target
Velocity (cm/s / fpm)
Target Plate Temperature
(C/°F) Ignition
1 R32 5.02/0.177 None <1 / <2 850/15621 N 2 R32 4.92/0.174 None 25/50 850/15621 N 3 R32 5.35/0.189 None <1 / <2 850/1562 N2 4 R32 5.21/0.184 None <1 / <2 850/1562 N 5 R32 5.16/0.182 None <1 / <2 850/1562 N 6 R32 5.19/0.183 None <1 / <2 790/1454 N 7 R32 5.05/0.178 None <1 / <2 850/1562 N 8 R32 4.65/0.164 None <1 / <2 850/1562 N 9 R-452B 5.32/0.188 None <1 / <2 850/1562 N
10 R-452B 5.11/0.180 None <1 / <2 850/1562 N 11 R-452B 5.3/0.187 None <1 / <2 850/1562 N 12 R-452B 5.21/0.184 None <1 / <2 850/1562 N 13 R-452B 5.33/0.188 None <1 / <2 850/1562 N 14 R-1234ze 5.3/0.187 None <1 / <2 850/1562 N 15 R-1234ze 5.28/0.186 None <1 / <2 850/1562 N 16 R-1234ze 5.31/0.187 None <1 / <2 850/1562 N 17 R-1234ze 5.05/0.178 None <1 / <2 850/1562 N 18 R-1234ze 5.31/0.187 None <1 / <2 850/1562 N 19 R-1234ze 5.11/0.180 3% <1 / <2 700/1292 N 20 R-1234ze 5.04/0.178 3% <1 / <2 700/1292 N 21 R-1234ze 4.81/0.170 3% <1 / <2 700/1292 N 22 R-1234ze 5.09/0.180 3% <1 / <2 700/1292 N 23 R-1234ze 5.26/0.186 3% <1 / <2 700/1292 N 24 R32 5.14/0.181 3% <1 / <2 700/1292 N 25 R32 5.11/0.180 3% <1 / <2 700/1292 N 26 R32 5.23/0.184 3% <1 / <2 700/1292 N 27 R32 4.81/0.170 3% <1 / <2 700/1292 N 28 R32 4.81/0.170 3% <1 / <2 700/1292 N 29 R-452B 5.18/0.183 3% <1 / <2 700/1292 N 30 R-452B 5.17/0.182 3% <1 / <2 700/1292 N 31 R-452B 5.14/0.181 3% <1 / <2 700/1292 N3 32 R-452B 4.89/0.172 3% <1 / <2 700/1292 N 33 R-452B 4.62/0.163 3% <1 / <2 700/1292 N 34 DR55 4.64/0.164 3% <1 / <2 800/1472 N 35 DR55 5.34/0.188 3% <1 / <2 800/1472 N 36 DR55 5.45/0.192 3% <1 / <2 800/1472 N 37 DR55 5.54/0.195 3% <1 / <2 800/1472 N 38 DR55 5.22/0.184 3% <1 / <2 800/1472 N 39 R32 5.38/0.190 3% <1 / <2 800/1472 N 40 R32 5.07/0.179 3% <1 / <2 800/1472 N 41 R32 4.45/0.157 3% <1 / <2 800/1472 N 42 R32 5.39/0.190 3% <1 / <2 800/1472 N 43 R32 5.43/0.192 3% <1 / <2 800/1472 N 44 R-1234ze 5.17/0.182 3% <1 / <2 800/1472 N 45 R-1234ze 5.28/0.186 3% <1 / <2 800/1472 N 46 R-1234ze 5.52/0.195 3% <1 / <2 800/1472 N 47 R-1234ze 4.45/0.157 3% <1 / <2 800/1472 N 48 R-1234ze 5.53/0.195 3% <1 / <2 800/1472 N
1 Hot plate was 8” x 8” 2 Hot plate had 4” diameter planchet. Ignition in enclosed area between insulation, hot plate, and planchet. See Figure A1. 3 Ignition near enclosed area between hot plate and chamber interface.

27
Figure A1 Screenshots from test ID3 showing a momentary ignition in the region between the hot plate, insulation, and planchet.

28
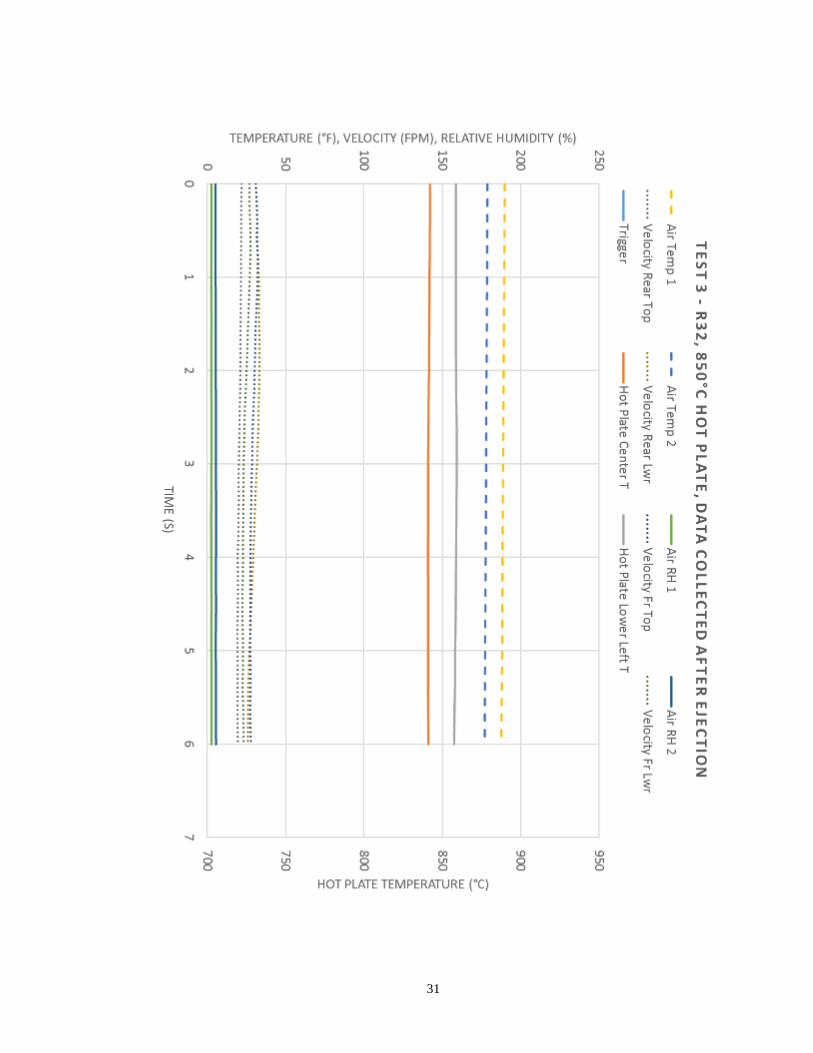
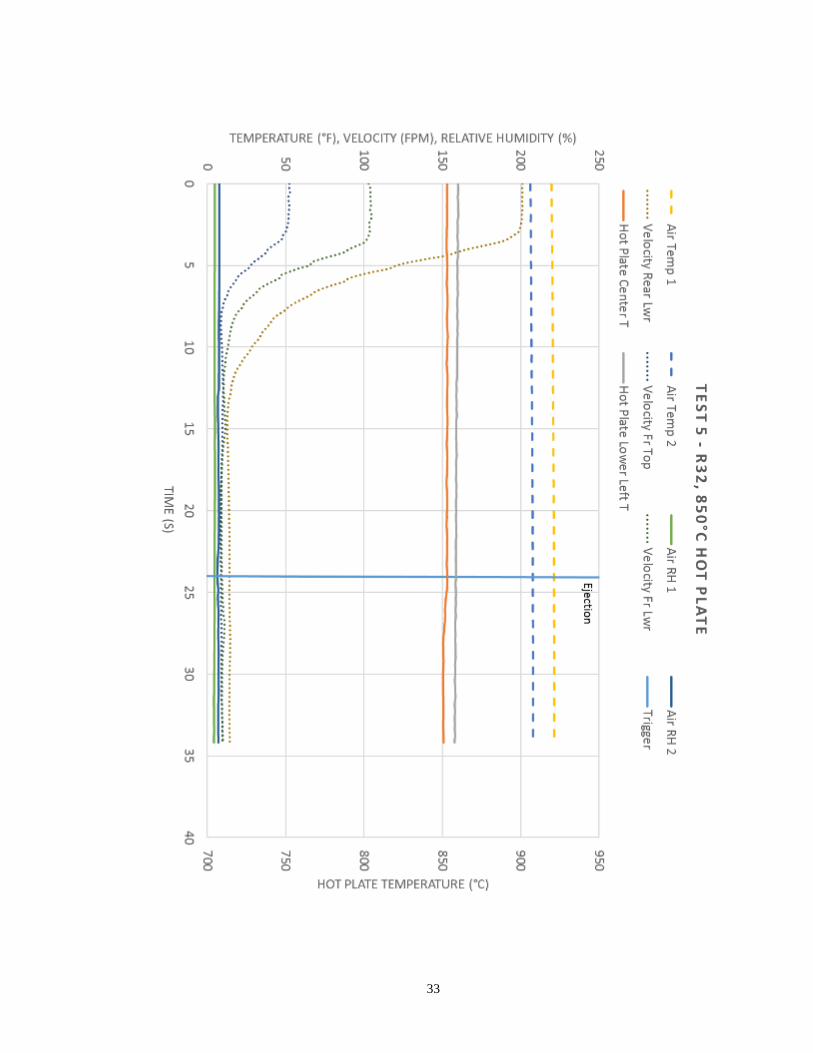
Appendix B. Test Data

29

30
31

32
33

34

35

36

37

38

39
No
te: Airflo
w m
an
ually
adju
sted aro
und
18
s to
facilitate mix
ing

40

41

42

43
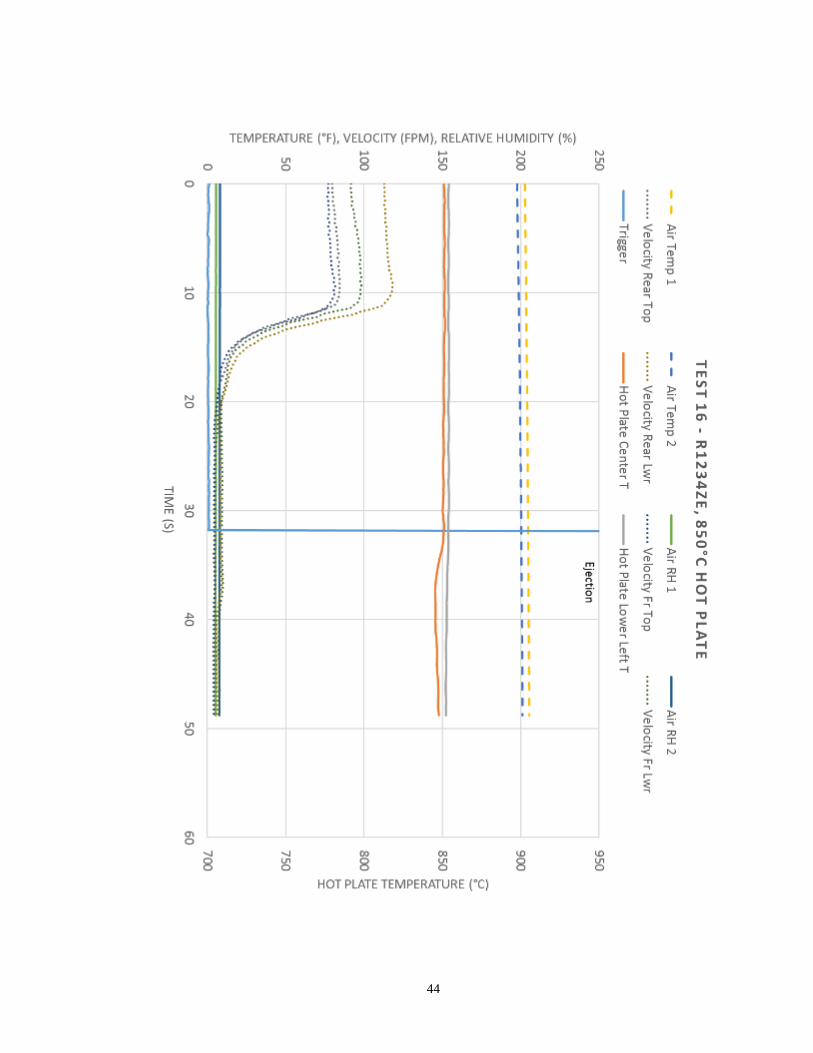
44

45

46

47

48
49

50

51

52

53

54

55

56

57

58

59

60

61

62

63
64

65

66

67

68

69

70

71

72

73

74

75

76