Embed Size (px)
Citation preview
Air ConditioningClinic
Air Conditioning FansOne of the Equipment Series
TRG-TRC013-EN
85667_Cvr.fm Page 1 Friday, October 8, 1999 10:05 AM
NO POSTAGENECESSARYIF MAILEDIN THEUNITED STATES
BUSINESS REPLY MAILFIRST-CLASS MAIL PERMIT NO. 11 LA CROSSE, WI
POSTAGE WILL BE PAID BY ADDRESSEE
THE TRANE COMPANYAttn: Applications Engineering3600 Pammel Creek RoadLa Crosse WI 54601-9985
NO POSTAGENECESSARYIF MAILEDIN THEUNITED STATES
BUSINESS REPLY MAILFIRST-CLASS MAIL PERMIT NO. 11 LA CROSSE, WI
POSTAGE WILL BE PAID BY ADDRESSEE
THE TRANE COMPANYAttn: Applications Engineering3600 Pammel Creek RoadLa Crosse WI 54601-9985
Perforation 5.625” from top
Perforation 3.25” from left edge
Comment Card
We want to ensure that our educational materials meet your ever-changing resource development needs.Please take a moment to comment on the effectiveness of this Air Conditioning Clinic.
Air Conditioning Fans Level of detail (circle one) Too basic Just right Too difficult
One of the Equipment Series Rate this clinic from 1–Needs Improvement to 10–Excellent…TRG-TRC013-EN Content 1 2 3 4 5 6 7 8 9 10
Booklet usefulness 1 2 3 4 5 6 7 8 9 10
Slides/illustrations 1 2 3 4 5 6 7 8 9 10
Presenter’s ability 1 2 3 4 5 6 7 8 9 10
Training environment 1 2 3 4 5 6 7 8 9 10
Other comments? _______________________________________________________________________________________________________________________________________________________________________________________________________________________
About me … Type of business _________________________________________________________Job function _________________________________________________________Optional: name _________________________________________________________
phone _________________________________________________________address _________________________________________________________
Give the completed card to thepresenter or drop it in the mail.Thank you!
The Trane Company • Worldwide Applied Systems Group3600 Pammel Creek Road • La Crosse, WI 54601-7599www.trane.com
An American-Standard Company
Response Card
We offer a variety of HVAC-related educational materials and technical references, as well as software toolsthat simplify system design/analysis and equipment selection. To receive information about any of theseitems, just complete this postage-paid card and drop it in the mail.
Education materials ❏❏ Air Conditioning Clinic series About me…
❏❏ Engineered Systems Clinic series Name ___________________________________________
❏ Trane Air Conditioning Manual Title ___________________________________________
❏ Trane Systems Manual Business type ___________________________________________
Software tools ❏ Equipment Selection Phone/fax _____________________ ____________________
❏ System design & analysis E-mail address ___________________________________________
Periodicals ❏ Engineers Newsletter Company ___________________________________________
Other? ❏ _____________________________ Address _________________________________________________________________________________________________________________________________
Thank you for your interest!
The Trane Company • Worldwide Applied Systems Group3600 Pammel Creek Road • La Crosse, WI 54601-7599www.trane.com
An American-Standard Company
Air Conditioning FansOne of the Equipment Series
A publication ofThe Trane Company—Worldwide Applied Systems Group
Preface
© 1999 American Standard Inc. All rights reservedTRG-TRC013-ENii
The Trane Company believes that it is incumbent on manufacturers to serve the industry by regularly disseminating information gathered through laboratory research, testing programs, and field experience.
The Trane Air Conditioning Clinic series is one means of knowledge sharing. It is intended to acquaint a nontechnical audience with various fundamental aspects of heating, ventilating, and air conditioning.
We’ve taken special care to make the clinic as uncommercial and straightforward as possible. Illustrations of Trane products only appear in cases where they help convey the message contained in the accompanying text.
This particular clinic introduces the concept of air conditioning fans.
A Trane Air Conditioning Clinic
Air Conditioning Fans
Figure 1
TRG-TRC013-EN iii
Contents
Introduction ........................................................... 1
period one Fan Performance .................................................. 2
Fan Performance Curves ....................................... 11System Resistance Curve ...................................... 17Fan – System Interaction ....................................... 19
period two Fan Types .............................................................. 27
Forward Curved (FC) Fans ..................................... 28Backward Inclined (BI) Fans ................................... 30Airfoil (AF) Fans ..................................................... 33Vaneaxial Fans ...................................................... 35
period three Fan Capacity Control ......................................... 39
“Riding the Fan Curve” ......................................... 40Discharge Dampers ............................................... 44Inlet Vanes ............................................................ 46Fan-Speed Control ................................................. 48Variable-Pitch Blade Control ................................... 49
period four Application Considerations ............................. 52
System Static-Pressure Control ............................. 53System Effect ....................................................... 55Acoustics .............................................................. 56Effect of Actual (Nonstandard) Conditions .............. 58Equipment Certification Standards ......................... 59
period five Review ................................................................... 60
Quiz ......................................................................... 64
Answers ................................................................ 66
Glossary ................................................................ 67
iv TRG-TRC013-EN
TRG-TRC013-EN 1
notes
Introduction
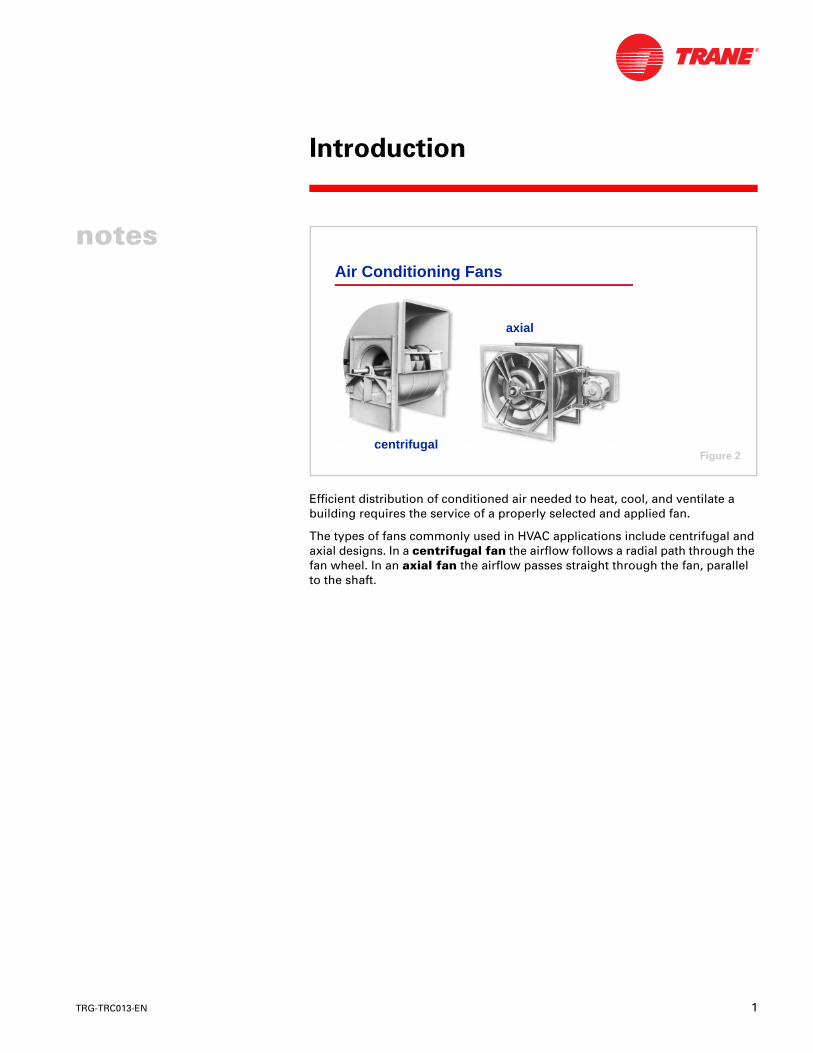
Efficient distribution of conditioned air needed to heat, cool, and ventilate a building requires the service of a properly selected and applied fan.
The types of fans commonly used in HVAC applications include centrifugal and axial designs. In a centrifugal fan the airflow follows a radial path through the fan wheel. In an axial fan the airflow passes straight through the fan, parallel to the shaft.
centrifugal
axial
Air Conditioning Fans
Figure 2
2 TRG-TRC013-EN
notes
period oneFan Performance
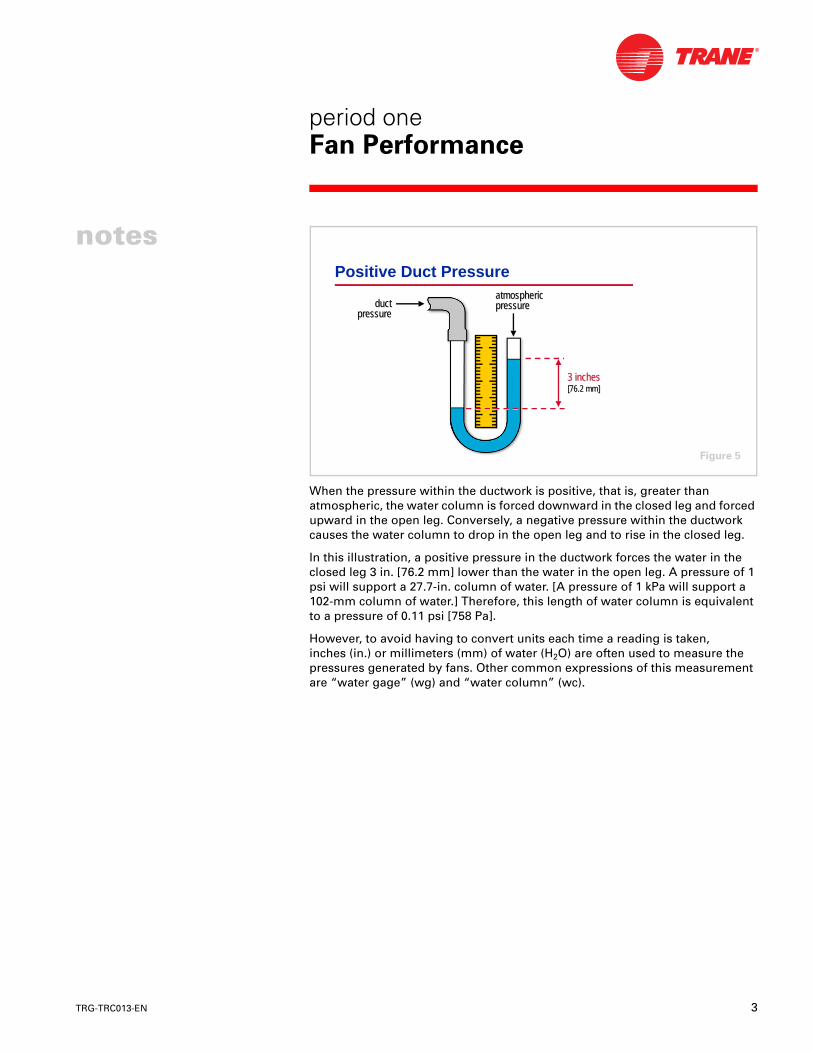
Compared to compressors, the pressures generated by these air-moving devices within the ductwork of HVAC systems are relatively small. The measurement of these pressures is, however, essential to the determination of fan performance.
One instrument that is available to measure these small pressures is a U-tube that contains a quantity of water. One end of the tube is open to the atmosphere (open leg), while the other end is connected to the ductwork (closed leg).
Air Conditioning Fans
period one
Figure 3
Measuring Pressureatmospheric atmospheric pressurepressureductduct
pressurepressure
Figure 4
TRG-TRC013-EN 3
period oneFan Performance
notes
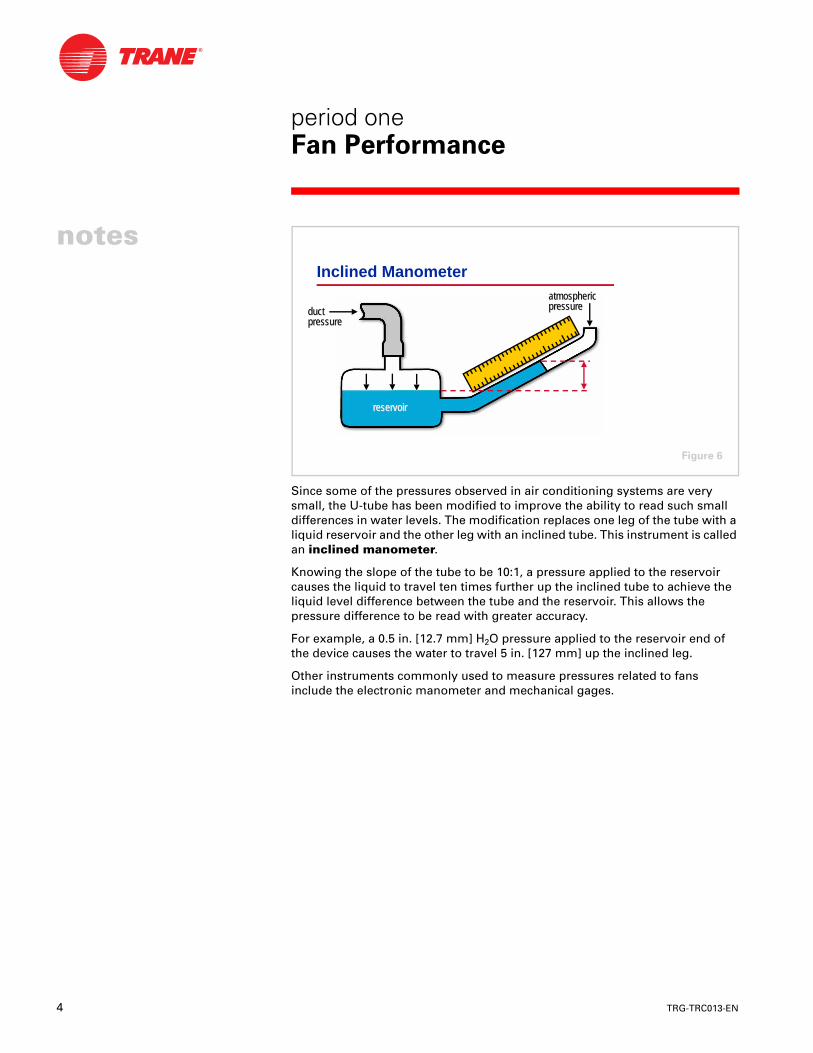
When the pressure within the ductwork is positive, that is, greater than atmospheric, the water column is forced downward in the closed leg and forced upward in the open leg. Conversely, a negative pressure within the ductwork causes the water column to drop in the open leg and to rise in the closed leg.
In this illustration, a positive pressure in the ductwork forces the water in the closed leg 3 in. [76.2 mm] lower than the water in the open leg. A pressure of 1 psi will support a 27.7-in. column of water. [A pressure of 1 kPa will support a 102-mm column of water.] Therefore, this length of water column is equivalent to a pressure of 0.11 psi [758 Pa].
However, to avoid having to convert units each time a reading is taken,inches (in.) or millimeters (mm) of water (H2O) are often used to measure the pressures generated by fans. Other common expressions of this measurement are “water gage” (wg) and “water column” (wc).
Positive Duct Pressure
ductductpressurepressure
atmospheric atmospheric pressurepressure
3 inches3 inches[76.2 mm][76.2 mm]
Figure 5
4 TRG-TRC013-EN
notes
period oneFan Performance
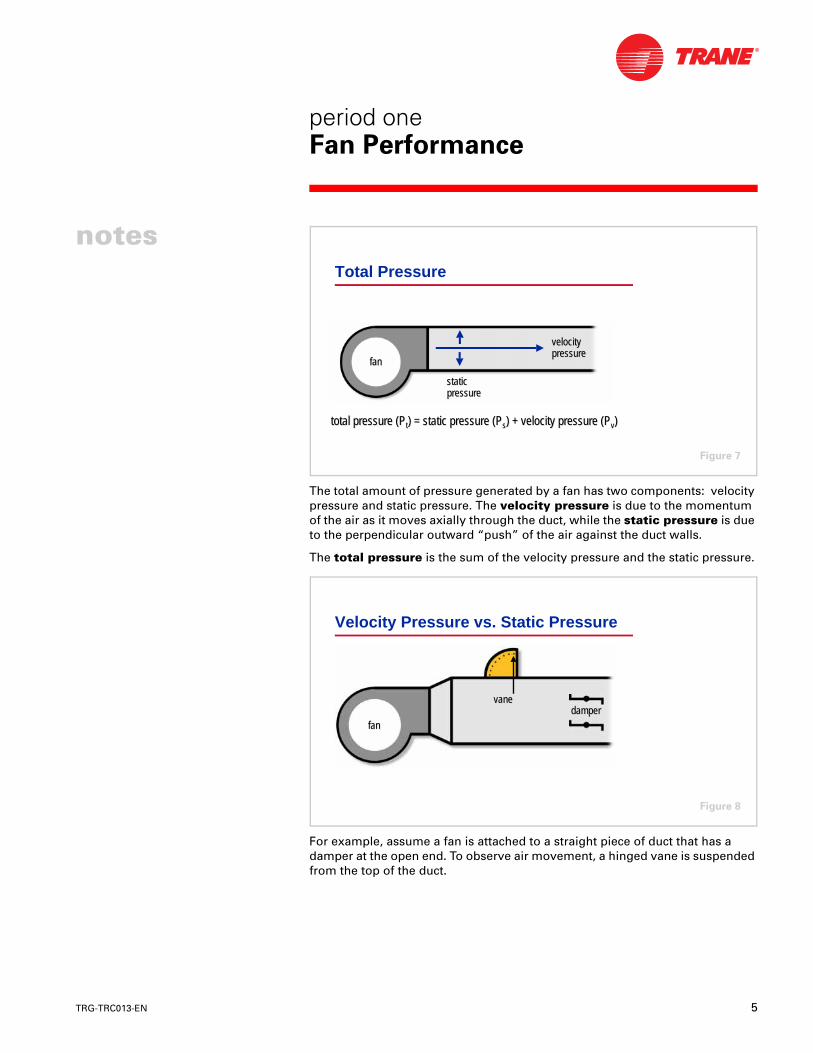
Since some of the pressures observed in air conditioning systems are very small, the U-tube has been modified to improve the ability to read such small differences in water levels. The modification replaces one leg of the tube with a liquid reservoir and the other leg with an inclined tube. This instrument is called an inclined manometer.
Knowing the slope of the tube to be 10:1, a pressure applied to the reservoir causes the liquid to travel ten times further up the inclined tube to achieve the liquid level difference between the tube and the reservoir. This allows the pressure difference to be read with greater accuracy.
For example, a 0.5 in. [12.7 mm] H2O pressure applied to the reservoir end of the device causes the water to travel 5 in. [127 mm] up the inclined leg.
Other instruments commonly used to measure pressures related to fans include the electronic manometer and mechanical gages.
Inclined Manometer
reservoirreservoir
ductductpressurepressure
atmospheric atmospheric pressurepressure
Figure 6
TRG-TRC013-EN 5
period oneFan Performance
notes
The total amount of pressure generated by a fan has two components: velocity pressure and static pressure. The velocity pressure is due to the momentum of the air as it moves axially through the duct, while the static pressure is due to the perpendicular outward “push” of the air against the duct walls.
The total pressure is the sum of the velocity pressure and the static pressure.
For example, assume a fan is attached to a straight piece of duct that has a damper at the open end. To observe air movement, a hinged vane is suspended from the top of the duct.
Total Pressure
velocityvelocitypressurepressure
staticstaticpressurepressure
total pressure (Ptotal pressure (Ptt) = static pressure (P) = static pressure (Pss) + velocity pressure () + velocity pressure (PPvv))
fanfan
Figure 7
Velocity Pressure vs. Static Pressure
damperdampervanevane
fanfan
Figure 8
6 TRG-TRC013-EN
notes
period oneFan Performance
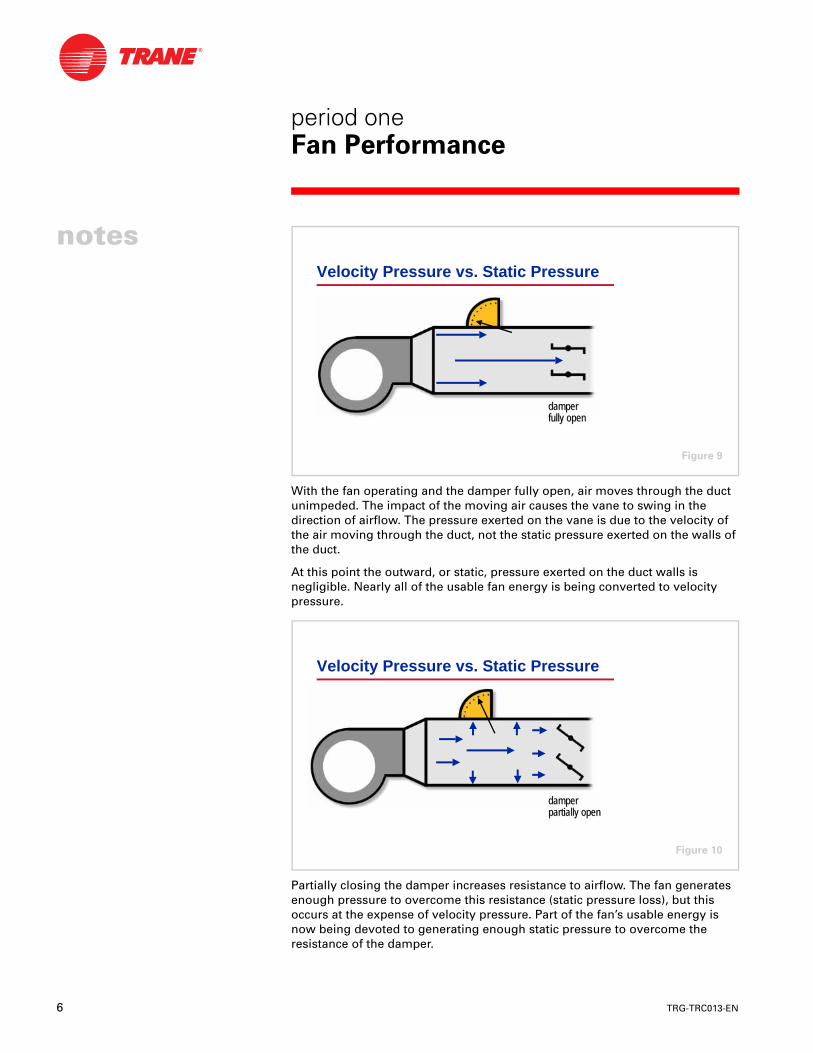
With the fan operating and the damper fully open, air moves through the duct unimpeded. The impact of the moving air causes the vane to swing in the direction of airflow. The pressure exerted on the vane is due to the velocity of the air moving through the duct, not the static pressure exerted on the walls of the duct.
At this point the outward, or static, pressure exerted on the duct walls is negligible. Nearly all of the usable fan energy is being converted to velocity pressure.
Partially closing the damper increases resistance to airflow. The fan generates enough pressure to overcome this resistance (static pressure loss), but this occurs at the expense of velocity pressure. Part of the fan’s usable energy is now being devoted to generating enough static pressure to overcome the resistance of the damper.
damperdamperfully openfully open
Velocity Pressure vs. Static Pressure
Figure 9
damperdamperpartially openpartially open
Velocity Pressure vs. Static Pressure
Figure 10
TRG-TRC013-EN 7
period oneFan Performance
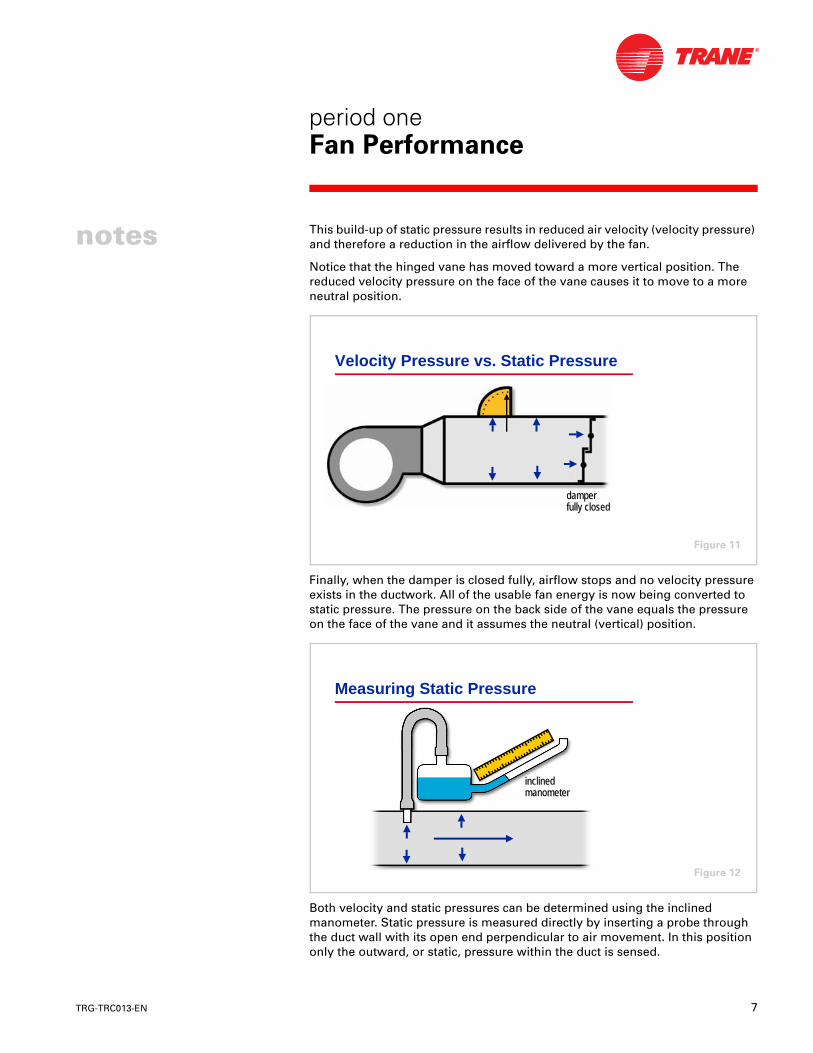
notes This build-up of static pressure results in reduced air velocity (velocity pressure) and therefore a reduction in the airflow delivered by the fan.
Notice that the hinged vane has moved toward a more vertical position. The reduced velocity pressure on the face of the vane causes it to move to a more neutral position.
Finally, when the damper is closed fully, airflow stops and no velocity pressure exists in the ductwork. All of the usable fan energy is now being converted to static pressure. The pressure on the back side of the vane equals the pressure on the face of the vane and it assumes the neutral (vertical) position.
Both velocity and static pressures can be determined using the inclined manometer. Static pressure is measured directly by inserting a probe through the duct wall with its open end perpendicular to air movement. In this position only the outward, or static, pressure within the duct is sensed.
damperdamperfully closedfully closed
Velocity Pressure vs. Static Pressure
Figure 11
Measuring Static Pressure
inclinedinclinedmanometermanometer
Figure 12
8 TRG-TRC013-EN
notes
period oneFan Performance
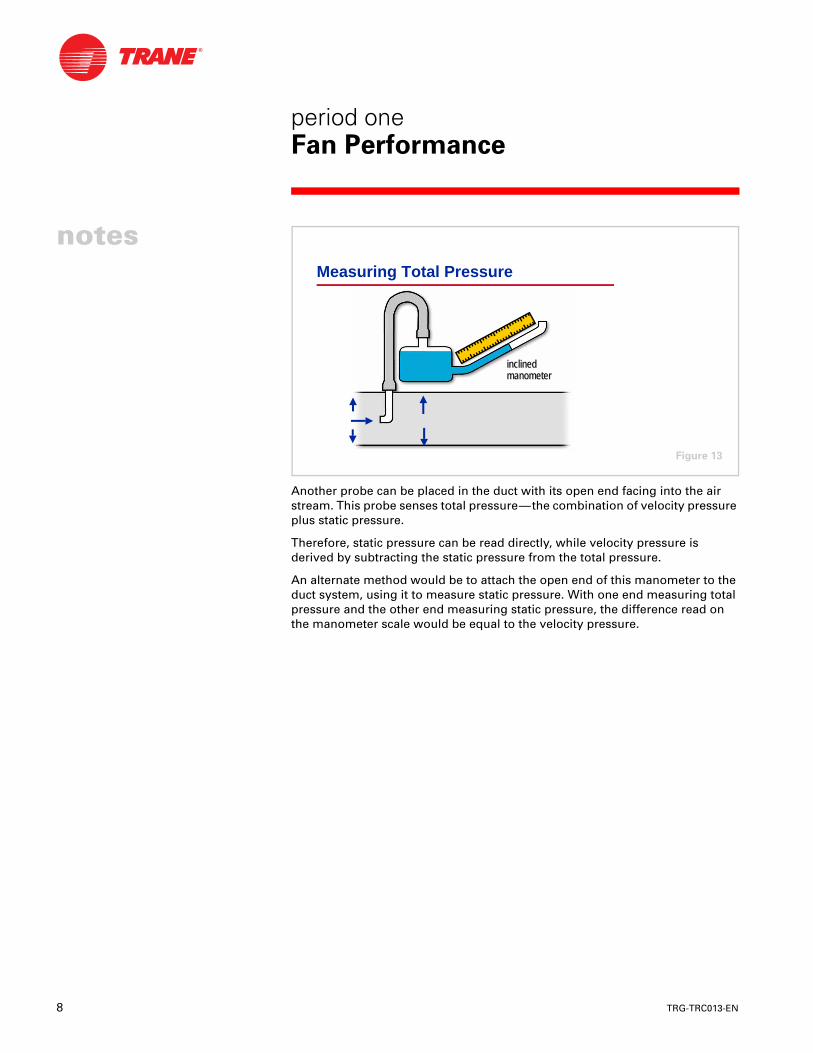
Another probe can be placed in the duct with its open end facing into the air stream. This probe senses total pressure—the combination of velocity pressure plus static pressure.
Therefore, static pressure can be read directly, while velocity pressure is derived by subtracting the static pressure from the total pressure.
An alternate method would be to attach the open end of this manometer to the duct system, using it to measure static pressure. With one end measuring total pressure and the other end measuring static pressure, the difference read on the manometer scale would be equal to the velocity pressure.
Measuring Total Pressure
inclinedinclinedmanometermanometer
Figure 13
TRG-TRC013-EN 9
period oneFan Performance
notes
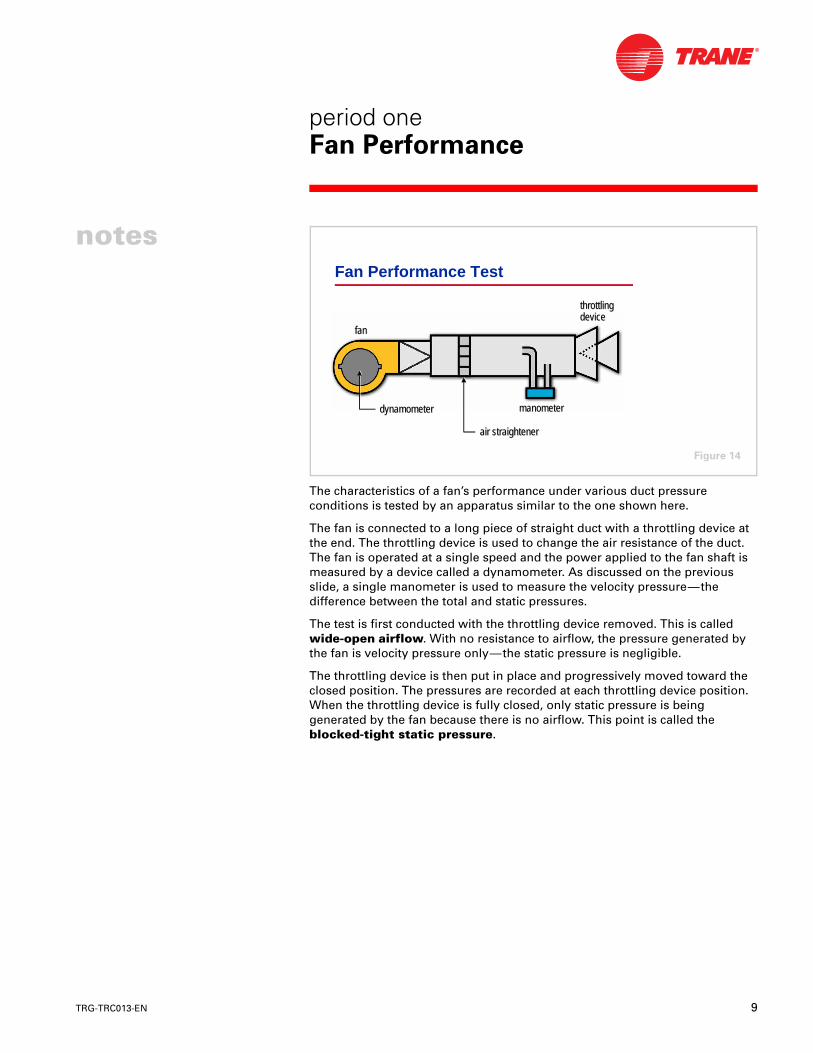
The characteristics of a fan’s performance under various duct pressure conditions is tested by an apparatus similar to the one shown here.
The fan is connected to a long piece of straight duct with a throttling device at the end. The throttling device is used to change the air resistance of the duct. The fan is operated at a single speed and the power applied to the fan shaft is measured by a device called a dynamometer. As discussed on the previous slide, a single manometer is used to measure the velocity pressure—the difference between the total and static pressures.
The test is first conducted with the throttling device removed. This is called wide-open airflow. With no resistance to airflow, the pressure generated by the fan is velocity pressure only—the static pressure is negligible.
The throttling device is then put in place and progressively moved toward the closed position. The pressures are recorded at each throttling device position. When the throttling device is fully closed, only static pressure is being generated by the fan because there is no airflow. This point is called the blocked-tight static pressure.
Fan Performance Test
dynamometerdynamometer
air air straightenerstraightener
manometermanometer
throttlingthrottlingdevicedevice
fanfan
Figure 14
10 TRG-TRC013-EN
notes
period oneFan Performance
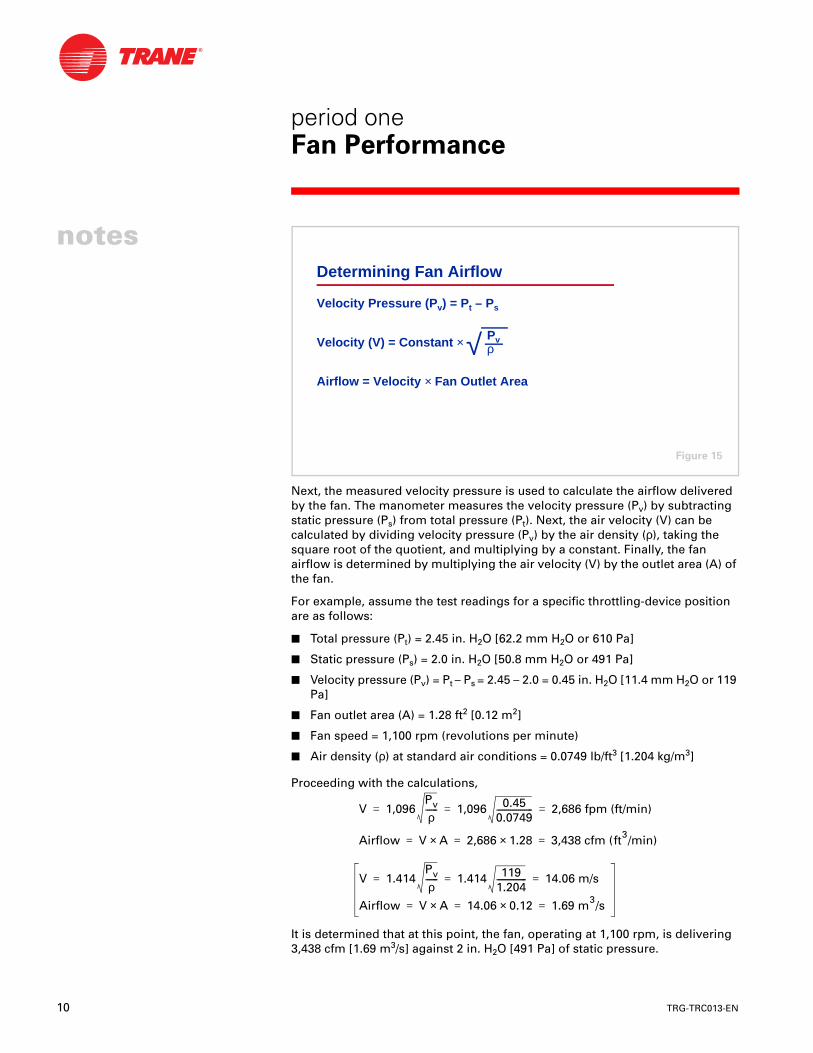
Next, the measured velocity pressure is used to calculate the airflow delivered by the fan. The manometer measures the velocity pressure (Pv) by subtracting static pressure (Ps) from total pressure (Pt). Next, the air velocity (V) can be calculated by dividing velocity pressure (Pv) by the air density (ρ), taking the square root of the quotient, and multiplying by a constant. Finally, the fan airflow is determined by multiplying the air velocity (V) by the outlet area (A) of the fan.
For example, assume the test readings for a specific throttling-device position are as follows:
■ Total pressure (Pt) = 2.45 in. H2O [62.2 mm H2O or 610 Pa]
■ Static pressure (Ps) = 2.0 in. H2O [50.8 mm H2O or 491 Pa]
■ Velocity pressure (Pv) = Pt – Ps = 2.45 – 2.0 = 0.45 in. H2O [11.4 mm H2O or 119 Pa]
■ Fan outlet area (A) = 1.28 ft2 [0.12 m2]
■ Fan speed = 1,100 rpm (revolutions per minute)
■ Air density (ρ) at standard air conditions = 0.0749 lb/ft3 [1.204 kg/m3]
Proceeding with the calculations,
It is determined that at this point, the fan, operating at 1,100 rpm, is delivering 3,438 cfm [1.69 m3/s] against 2 in. H2O [491 Pa] of static pressure.
Determining Fan Airflow
Velocity Pressure (Pv) = Pt – Ps
Velocity (V) = Constant ×
Airflow = Velocity × Fan Outlet Area
√ Pvρ
Figure 15
V 1,096Pv
ρ------ 1,096 0.45
0.0749------------------ 2,686 fpm (ft/min)= = =
Airflow V A× 2,686 1.28× 3,438 cfm (ft3/min)= = =
V 1.414Pv
ρ------ 1.414 119
1.204--------------- 14.06 m/s= = =
Airflow V A× 14.06 0.12× 1.69 m3/s= = =
TRG-TRC013-EN 11
period oneFan Performance
notes
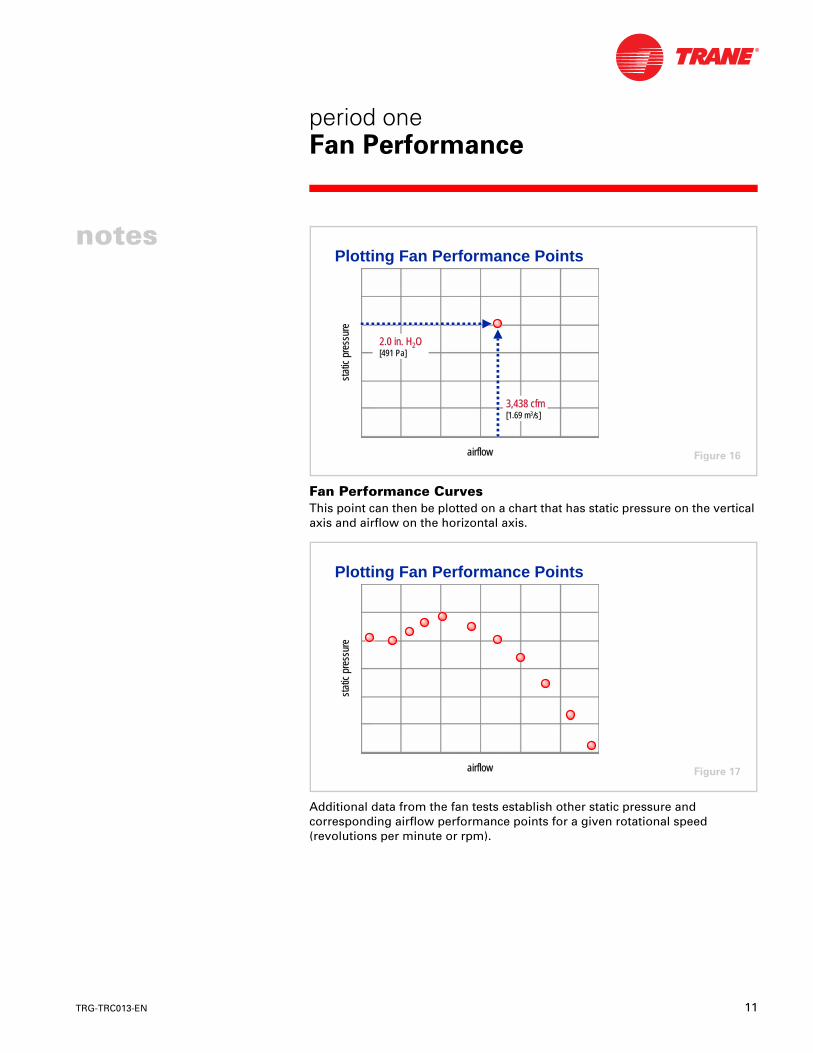
Fan Performance CurvesThis point can then be plotted on a chart that has static pressure on the vertical axis and airflow on the horizontal axis.
Additional data from the fan tests establish other static pressure and corresponding airflow performance points for a given rotational speed (revolutions per minute or rpm).
airflowairflow
stat
ic p
ress
ure
stat
ic p
ress
ure
3,438 cfm3,438 cfm[1.69 m[1.69 m33/s]/s]
2.0 in. H2.0 in. H22OO[491 Pa][491 Pa]
Plotting Fan Performance Points
Figure 16
airflowairflow
stat
ic p
ress
ure
stat
ic p
ress
ure
Plotting Fan Performance Points
Figure 17
12 TRG-TRC013-EN
notes
period oneFan Performance
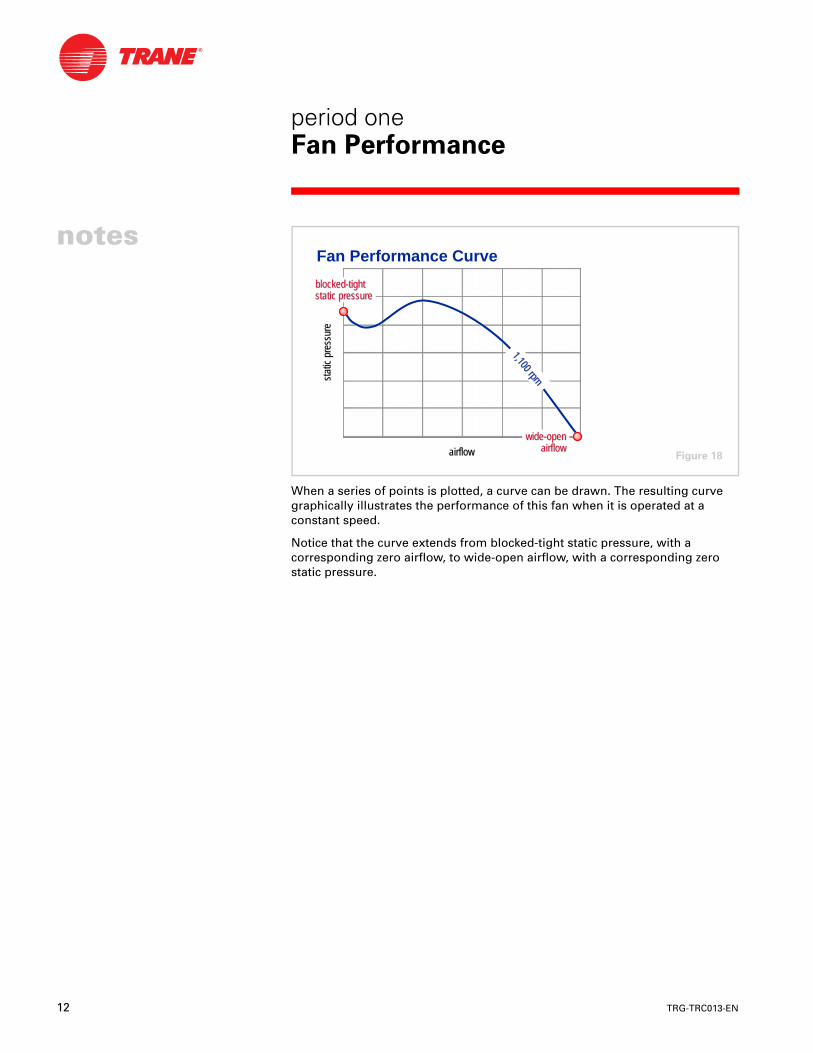
When a series of points is plotted, a curve can be drawn. The resulting curve graphically illustrates the performance of this fan when it is operated at a constant speed.
Notice that the curve extends from blocked-tight static pressure, with a corresponding zero airflow, to wide-open airflow, with a corresponding zero static pressure.
blocked-tightblocked-tightstatic pressurestatic pressure
wide-openwide-openairflowairflow
1,100 rpm
1,100 rpm
airflowairflow
stat
ic p
ress
ure
stat
ic p
ress
ure
Fan Performance Curve
Figure 18
TRG-TRC013-EN 13
period oneFan Performance
notes
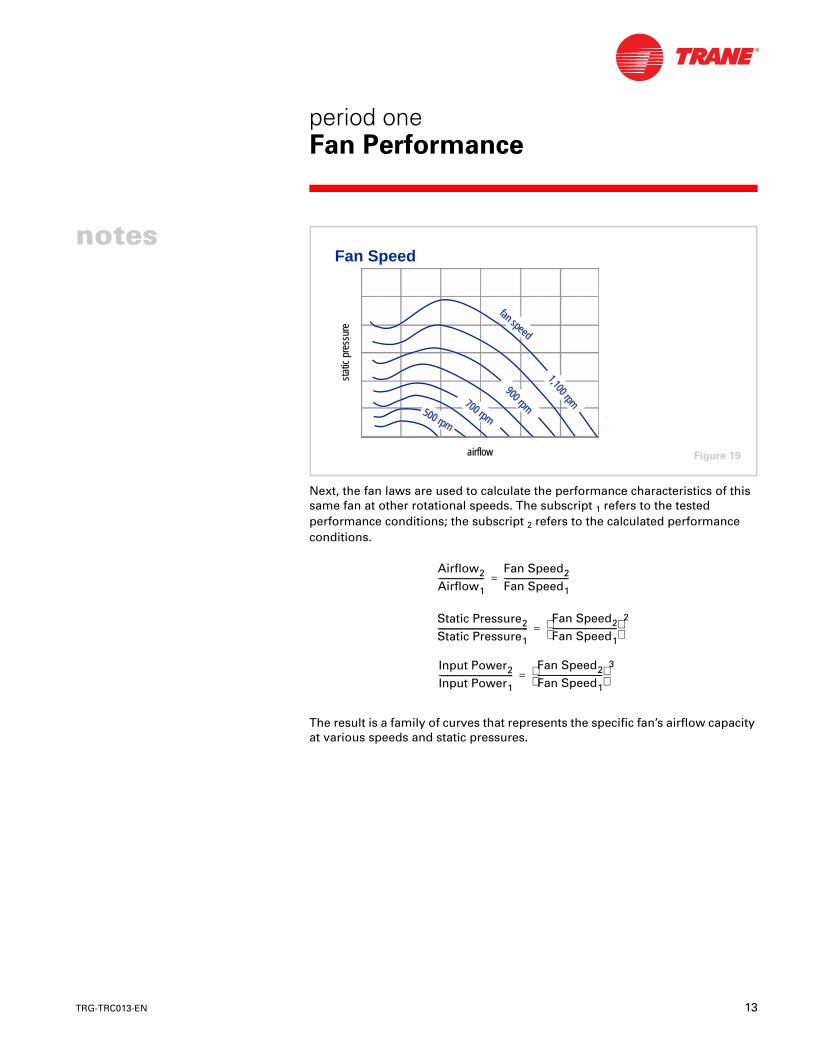
Next, the fan laws are used to calculate the performance characteristics of this same fan at other rotational speeds. The subscript 1 refers to the tested performance conditions; the subscript 2 refers to the calculated performance conditions.
The result is a family of curves that represents the specific fan’s airflow capacity at various speeds and static pressures.
airflowairflow
stat
ic p
ress
ure
stat
ic p
ress
ure
fan speed
fan speed
1,100 rpm
1,100 rpm
900 rpm
900 rpm700 rpm
700 rpm500 rpm500 rpm
Fan Speed
Figure 19
Airflow2
Airflow1-----------------------
Fan Speed2
Fan Speed1--------------------------------=
Static Pressure2
Static Pressure1---------------------------------------------
Fan Speed2
Fan Speed1--------------------------------
2
=
Input Power2
Input Power1-------------------------------------
Fan Speed2
Fan Speed1--------------------------------
3
=
14 TRG-TRC013-EN
notes
period oneFan Performance
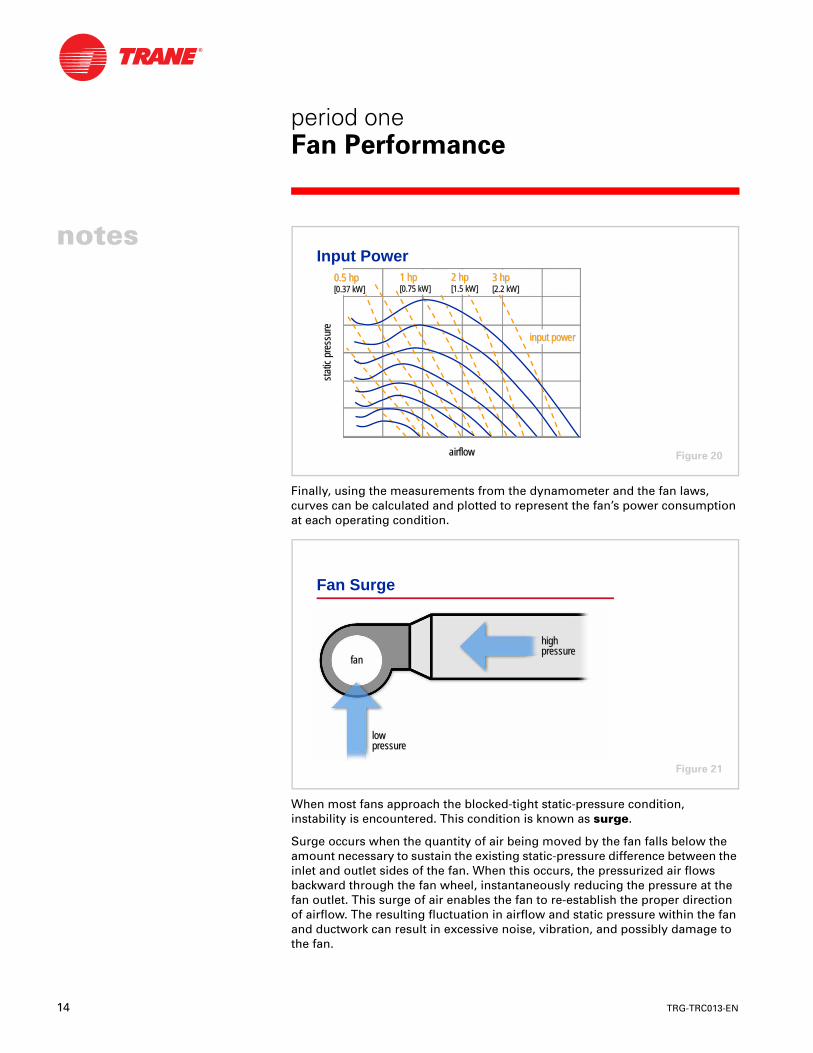
Finally, using the measurements from the dynamometer and the fan laws, curves can be calculated and plotted to represent the fan’s power consumption at each operating condition.
When most fans approach the blocked-tight static-pressure condition, instability is encountered. This condition is known as surge.
Surge occurs when the quantity of air being moved by the fan falls below the amount necessary to sustain the existing static-pressure difference between the inlet and outlet sides of the fan. When this occurs, the pressurized air flows backward through the fan wheel, instantaneously reducing the pressure at the fan outlet. This surge of air enables the fan to re-establish the proper direction of airflow. The resulting fluctuation in airflow and static pressure within the fan and ductwork can result in excessive noise, vibration, and possibly damage to the fan.
airflowairflow
stat
ic p
ress
ure
stat
ic p
ress
ure
2 hp2 hp[1.5 kW][1.5 kW]
3 hp3 hp[2.2 kW][2.2 kW]
0.5 hp0.5 hp[0.37 kW][0.37 kW]
1 hp1 hp[0.75 kW][0.75 kW]
input powerinput power
Input Power
Figure 20
Fan Surge
highhighpressurepressure
low low pressurepressure
fanfan
Figure 21
TRG-TRC013-EN 15
period oneFan Performance
notes
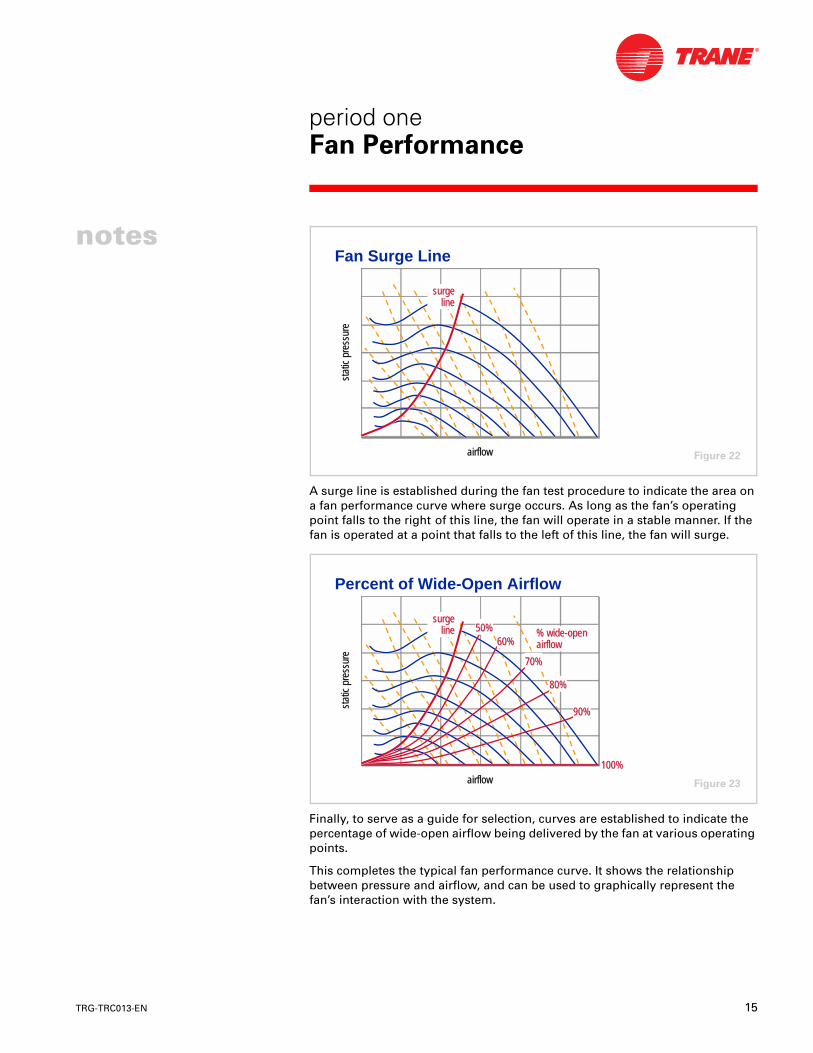
A surge line is established during the fan test procedure to indicate the area on a fan performance curve where surge occurs. As long as the fan’s operating point falls to the right of this line, the fan will operate in a stable manner. If the fan is operated at a point that falls to the left of this line, the fan will surge.
Finally, to serve as a guide for selection, curves are established to indicate the percentage of wide-open airflow being delivered by the fan at various operating points.
This completes the typical fan performance curve. It shows the relationship between pressure and airflow, and can be used to graphically represent the fan’s interaction with the system.
airflowairflow
stat
ic p
ress
ure
stat
ic p
ress
ure
surgeline
surgesurgelineline
Fan Surge Line
Figure 22
airflowairflow
stat
ic p
ress
ure
stat
ic p
ress
ure
50%50%60%60%
70%70%
80%80%
90%90%
% wide-openairflow% wide-open% wide-openairflowairflow
100%100%
Percent of Wide-Open Airflow
surgeline
surgesurgelineline
Figure 23
16 TRG-TRC013-EN
notes
period oneFan Performance
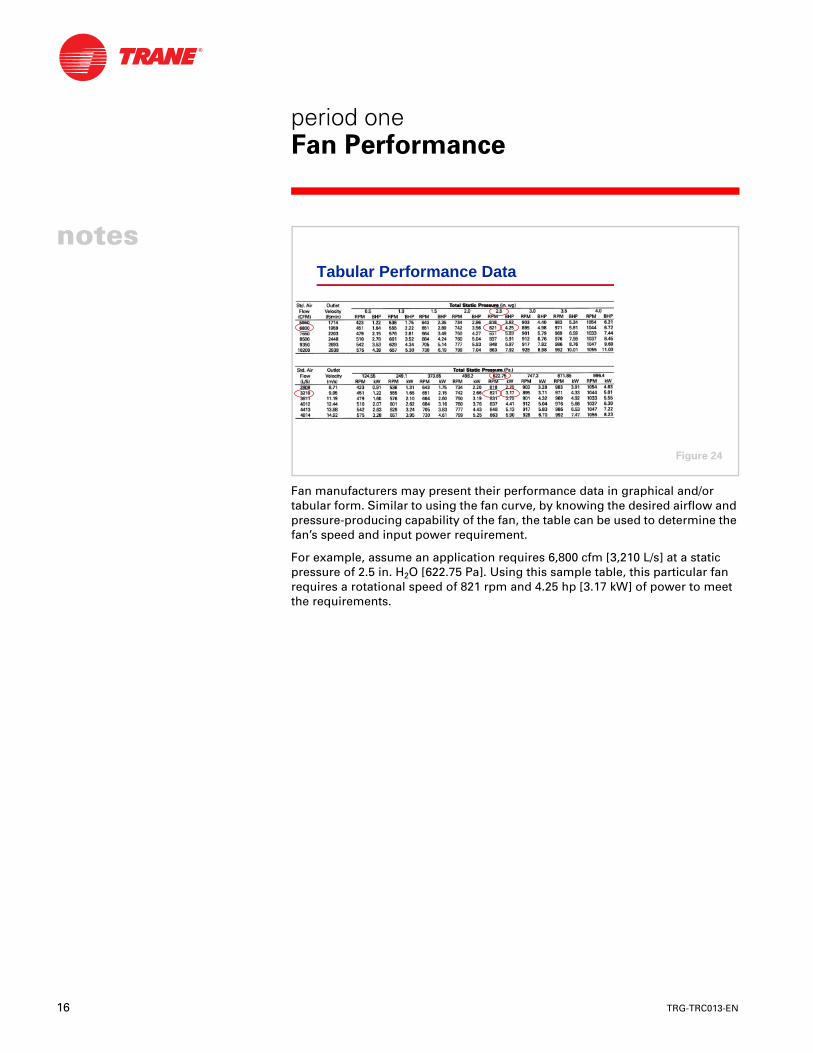
Fan manufacturers may present their performance data in graphical and/or tabular form. Similar to using the fan curve, by knowing the desired airflow and pressure-producing capability of the fan, the table can be used to determine the fan’s speed and input power requirement.
For example, assume an application requires 6,800 cfm [3,210 L/s] at a static pressure of 2.5 in. H2O [622.75 Pa]. Using this sample table, this particular fan requires a rotational speed of 821 rpm and 4.25 hp [3.17 kW] of power to meet the requirements.
Tabular Performance Data
Figure 24
TRG-TRC013-EN 17
period oneFan Performance
notes
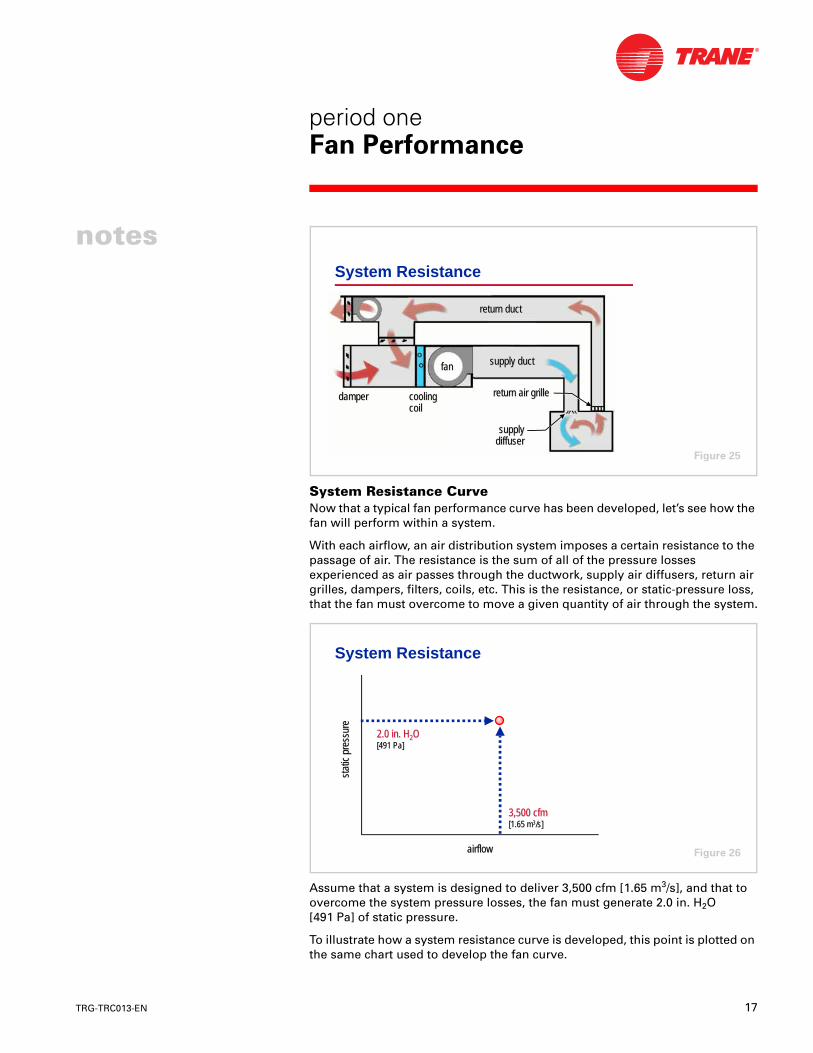
System Resistance CurveNow that a typical fan performance curve has been developed, let’s see how the fan will perform within a system.
With each airflow, an air distribution system imposes a certain resistance to the passage of air. The resistance is the sum of all of the pressure losses experienced as air passes through the ductwork, supply air diffusers, return air grilles, dampers, filters, coils, etc. This is the resistance, or static-pressure loss, that the fan must overcome to move a given quantity of air through the system.
Assume that a system is designed to deliver 3,500 cfm [1.65 m3/s], and that to overcome the system pressure losses, the fan must generate 2.0 in. H2O[491 Pa] of static pressure.
To illustrate how a system resistance curve is developed, this point is plotted on the same chart used to develop the fan curve.
System Resistance
fanfan
coolingcoolingcoilcoil
supply ductsupply duct
supplysupplydiffuserdiffuser
return air grillereturn air grille
return ductreturn duct
damperdamper
Figure 25
stat
ic p
ress
ure
stat
ic p
ress
ure
airflowairflow
3,500 cfm3,500 cfm[1.65 m[1.65 m33/s]/s]
2.0 in. H2.0 in. H22OO[491 Pa][491 Pa]
System Resistance
Figure 26
18 TRG-TRC013-EN
notes
period oneFan Performance
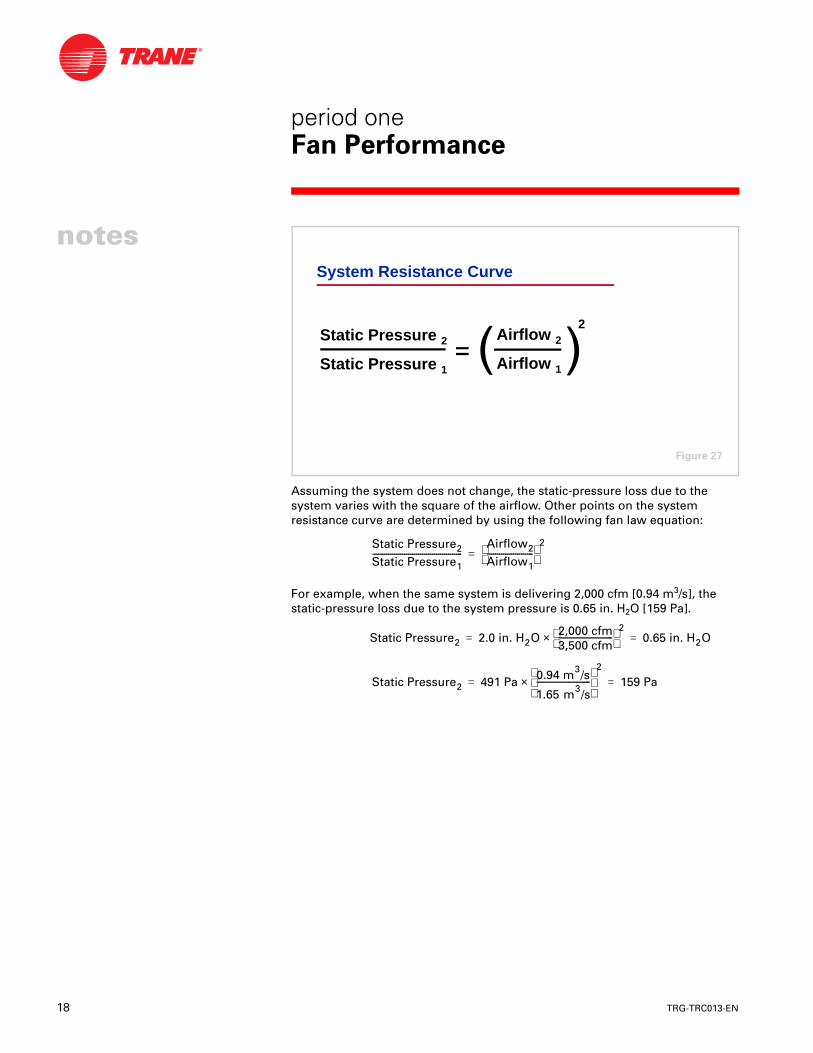
Assuming the system does not change, the static-pressure loss due to the system varies with the square of the airflow. Other points on the system resistance curve are determined by using the following fan law equation:
For example, when the same system is delivering 2,000 cfm [0.94 m3/s], the static-pressure loss due to the system pressure is 0.65 in. H2O [159 Pa].
System Resistance Curve
Static Pressure 2
Static Pressure 1
Airflow 2
Airflow 1
Airflow 2
Airflow 1
22
Figure 27
Static Pressure2
Static Pressure1---------------------------------------------
Airflow2
Airflow1-----------------------
2
=
Static Pressure2 2.0 in. H2O 2,000 cfm3,500 cfm---------------------------
2× 0.65 in. H2O= =
Static Pressure2 491 Pa 0.94 m3/s
1.65 m3/s---------------------------
2
× 159 Pa= =
TRG-TRC013-EN 19
period oneFan Performance
notes
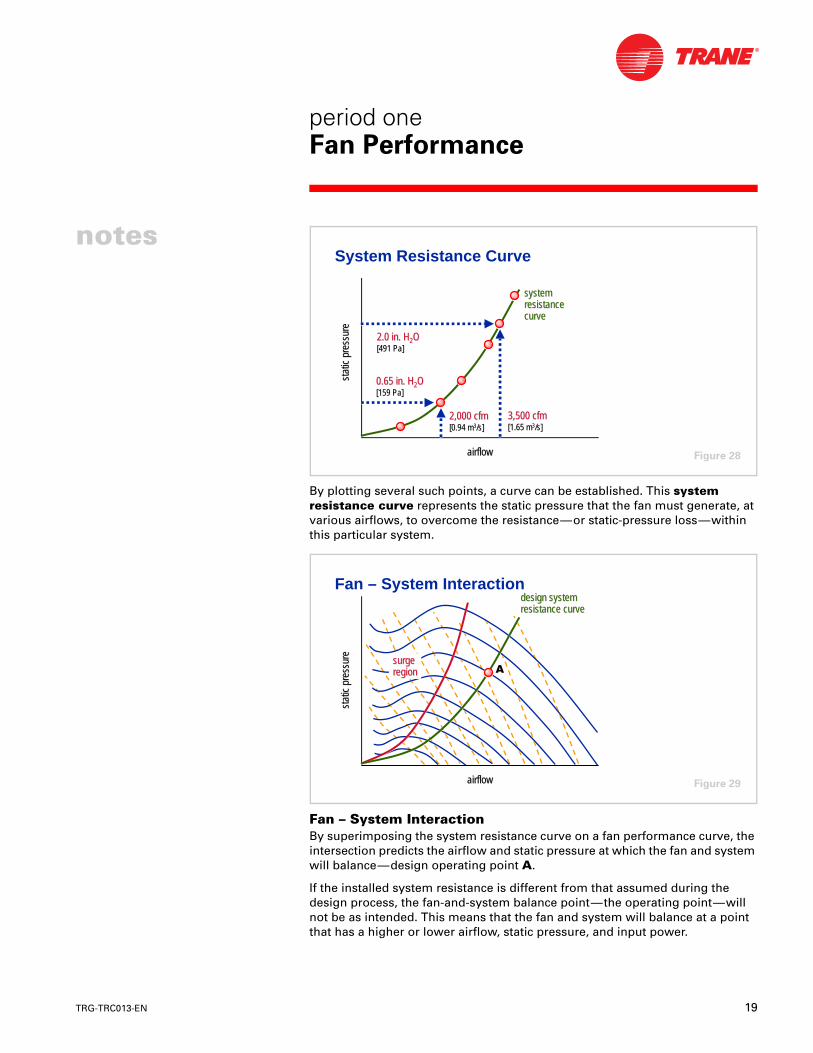
By plotting several such points, a curve can be established. This system resistance curve represents the static pressure that the fan must generate, at various airflows, to overcome the resistance—or static-pressure loss—within this particular system.
Fan – System InteractionBy superimposing the system resistance curve on a fan performance curve, the intersection predicts the airflow and static pressure at which the fan and system will balance—design operating point A.
If the installed system resistance is different from that assumed during the design process, the fan-and-system balance point—the operating point—will not be as intended. This means that the fan and system will balance at a point that has a higher or lower airflow, static pressure, and input power.
airflowairflow
stat
ic p
ress
ure
stat
ic p
ress
ure
3,500 cfm3,500 cfm[1.65 m[1.65 m33/s]/s]
0.65 in. H0.65 in. H22OO[159 Pa][159 Pa]
2,000 cfm2,000 cfm[0.94 m[0.94 m33/s]/s]
2.0 in. H2.0 in. H22OO[491 Pa][491 Pa]
systemresistancecurve
systemsystemresistanceresistancecurvecurve
System Resistance Curve
Figure 28
airflowairflow
stat
ic p
ress
ure
stat
ic p
ress
ure
design systemresistance curvedesign systemdesign systemresistance curveresistance curve
$
Fan – System Interaction
surgeregionsurgesurgeregionregion
Figure 29
20 TRG-TRC013-EN
notes
period oneFan Performance
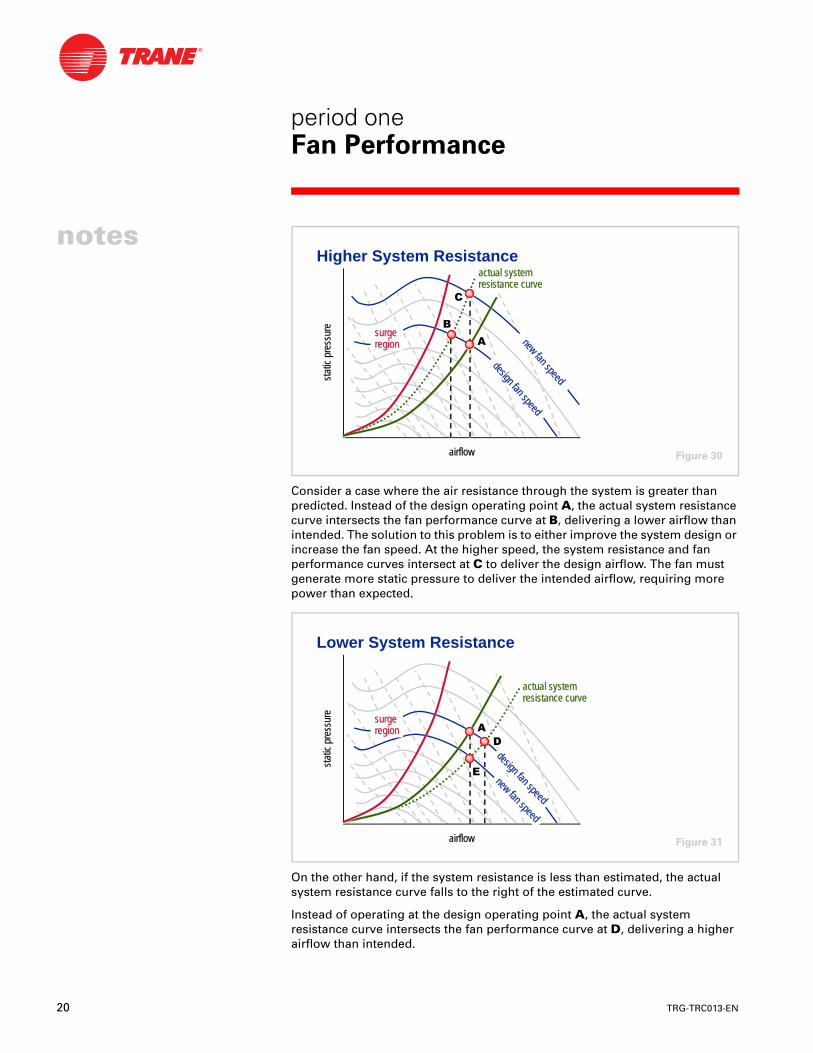
Consider a case where the air resistance through the system is greater than predicted. Instead of the design operating point A, the actual system resistance curve intersects the fan performance curve at B, delivering a lower airflow than intended. The solution to this problem is to either improve the system design or increase the fan speed. At the higher speed, the system resistance and fan performance curves intersect at C to deliver the design airflow. The fan must generate more static pressure to deliver the intended airflow, requiring more power than expected.
On the other hand, if the system resistance is less than estimated, the actual system resistance curve falls to the right of the estimated curve.
Instead of operating at the design operating point A, the actual system resistance curve intersects the fan performance curve at D, delivering a higher airflow than intended.
airflowairflow
stat
ic p
ress
ure
stat
ic p
ress
ure
surgeregionsurgesurgeregionregion
%
&
design fan speed
design fan speednew fan speed
new fan speed
$
actual systemresistance curveactual systemactual systemresistance curveresistance curve
Higher System Resistance
Figure 30
airflowairflow
stat
ic p
ress
ure
stat
ic p
ress
ure
'
(
new fan speed
new fan speed
actual systemresistance curveactual systemactual systemresistance curveresistance curve
$surgeregionsurgesurgeregionregion
design fan speed
design fan speed
Lower System Resistance
Figure 31
TRG-TRC013-EN 21
period oneFan Performance
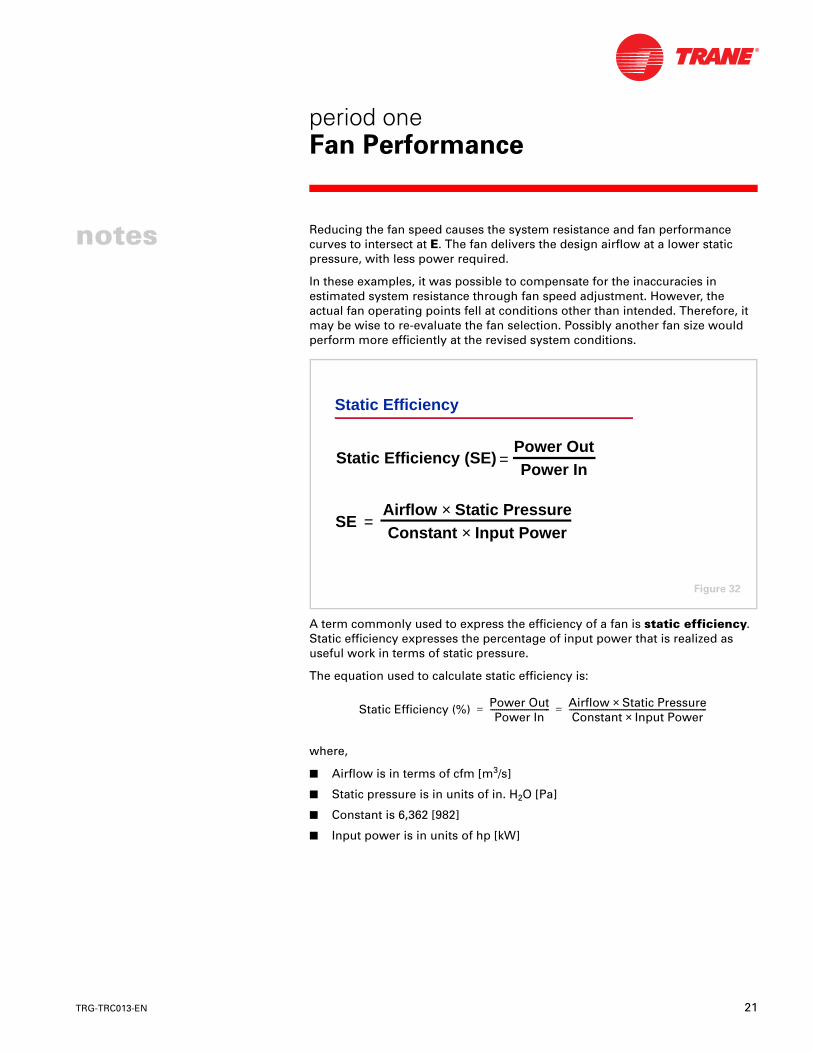
notes Reducing the fan speed causes the system resistance and fan performance curves to intersect at E. The fan delivers the design airflow at a lower static pressure, with less power required.
In these examples, it was possible to compensate for the inaccuracies in estimated system resistance through fan speed adjustment. However, the actual fan operating points fell at conditions other than intended. Therefore, it may be wise to re-evaluate the fan selection. Possibly another fan size would perform more efficiently at the revised system conditions.
A term commonly used to express the efficiency of a fan is static efficiency. Static efficiency expresses the percentage of input power that is realized as useful work in terms of static pressure.
The equation used to calculate static efficiency is:
where,
■ Airflow is in terms of cfm [m3/s]
■ Static pressure is in units of in. H2O [Pa]
■ Constant is 6,362 [982]
■ Input power is in units of hp [kW]
Static Efficiency
Static Efficiency (SE) =Power OutPower In
Airflow × Static PressureConstant × Input Power
=SESE
Figure 32
Static Efficiency (%) Power OutPower In
------------------------------ Airflow Static Pressure×Constant Input Power×
---------------------------------------------------------------------= =
22 TRG-TRC013-EN
notes
period oneFan Performance
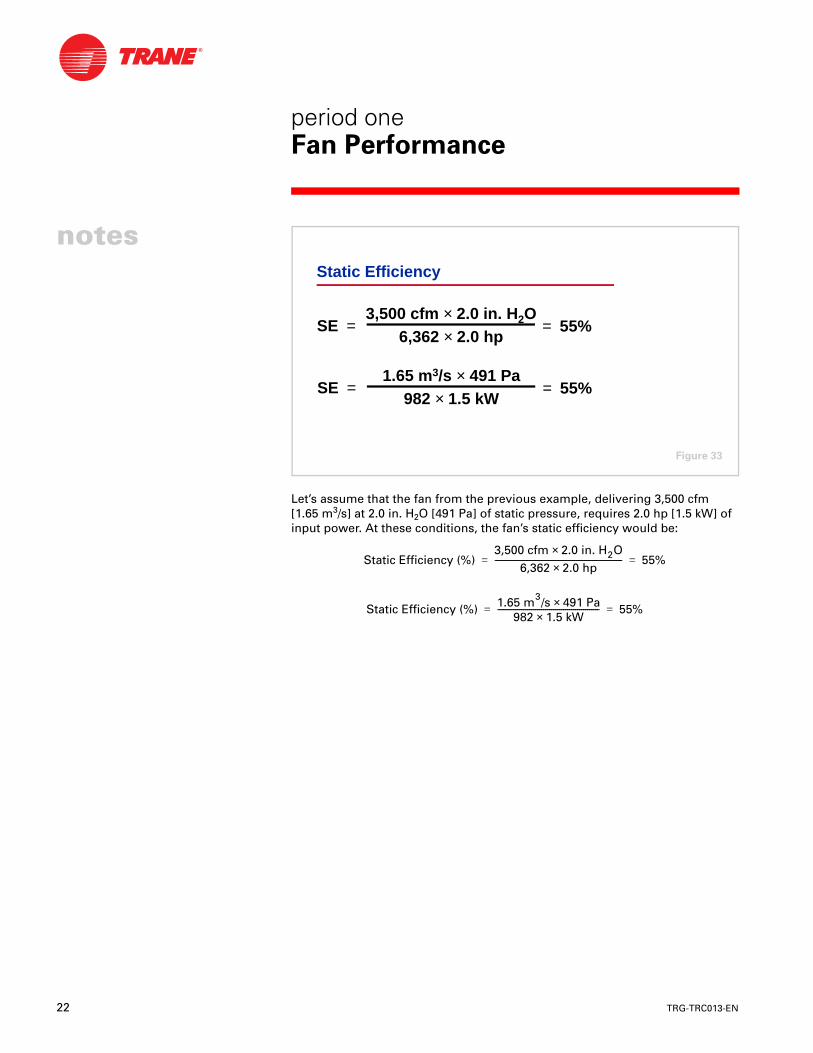
Let’s assume that the fan from the previous example, delivering 3,500 cfm[1.65 m3/s] at 2.0 in. H2O [491 Pa] of static pressure, requires 2.0 hp [1.5 kW] of input power. At these conditions, the fan’s static efficiency would be:
Static Efficiency
3,500 cfm × 2.0 in. H2O6,362 × 2.0 hp
3,500 cfm × 2.0 in. H2O6,362 × 2.0 hp
SESE == == 55%55%
1.65 m3/s × 491 Pa982 × 1.5 kW
1.65 m3/s × 491 Pa982 × 1.5 kW
SESE == == 55%55%
Figure 33
Static Efficiency (%)3,500 cfm 2.0 in. H2O×
6,362 2.0 hp×---------------------------------------------------------------- 55%= =
Static Efficiency (%) 1.65 m3/s 491 Pa×982 1.5 kW×
--------------------------------------------------- 55%= =
TRG-TRC013-EN 23
period oneFan Performance
notes
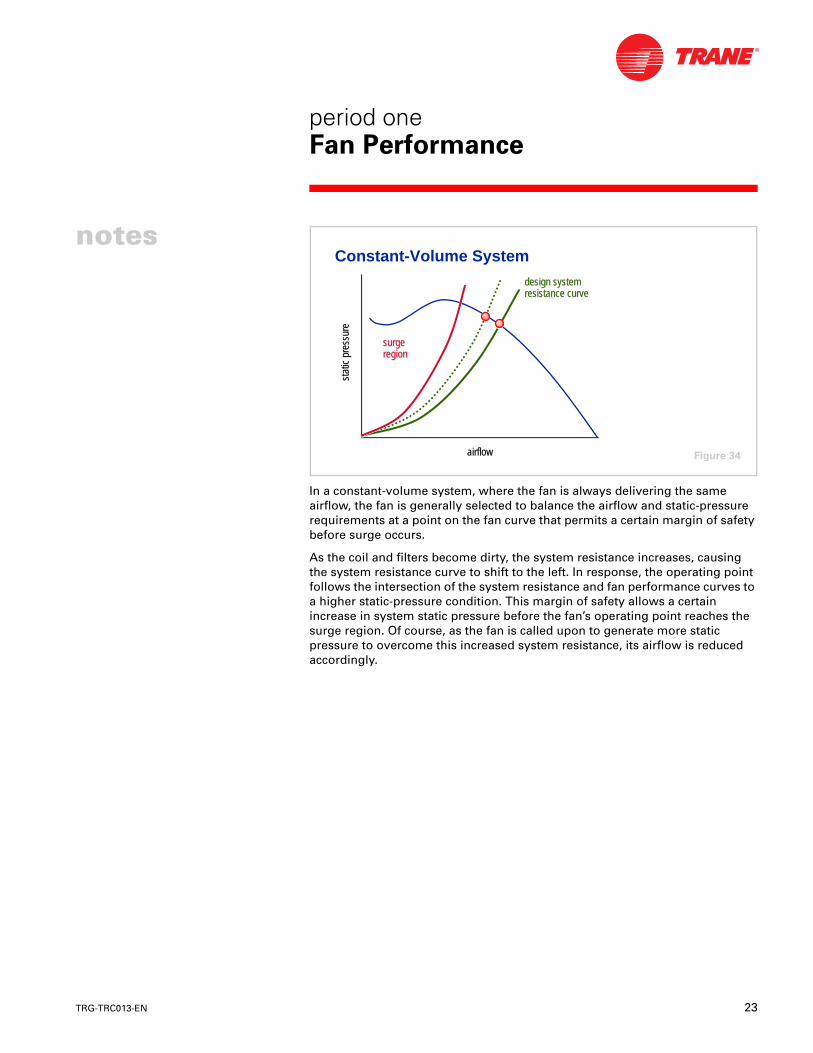
In a constant-volume system, where the fan is always delivering the same airflow, the fan is generally selected to balance the airflow and static-pressure requirements at a point on the fan curve that permits a certain margin of safety before surge occurs.
As the coil and filters become dirty, the system resistance increases, causing the system resistance curve to shift to the left. In response, the operating point follows the intersection of the system resistance and fan performance curves to a higher static-pressure condition. This margin of safety allows a certain increase in system static pressure before the fan’s operating point reaches the surge region. Of course, as the fan is called upon to generate more static pressure to overcome this increased system resistance, its airflow is reduced accordingly.
airflowairflow
stat
ic p
ress
ure
stat
ic p
ress
ure
surgeregionsurgesurgeregionregion
design systemresistance curvedesign systemdesign systemresistance curveresistance curve
Constant-Volume System
Figure 34
24 TRG-TRC013-EN
notes
period oneFan Performance
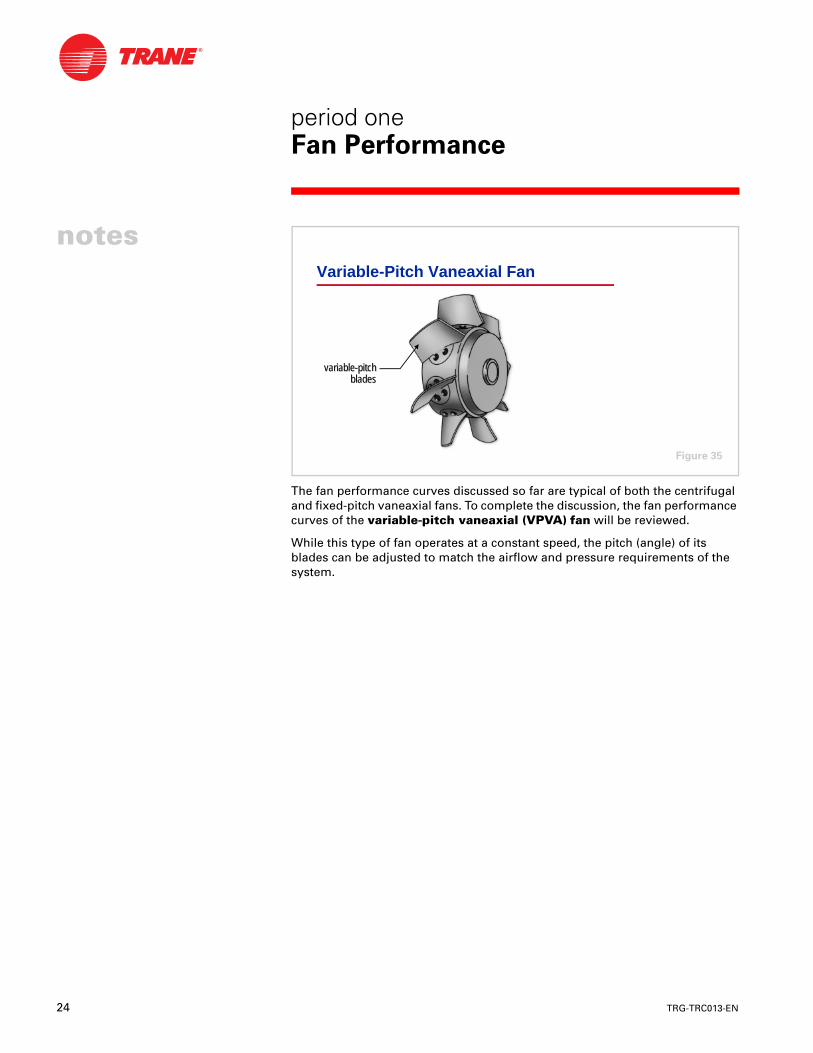
The fan performance curves discussed so far are typical of both the centrifugal and fixed-pitch vaneaxial fans. To complete the discussion, the fan performance curves of the variable-pitch vaneaxial (VPVA) fan will be reviewed.
While this type of fan operates at a constant speed, the pitch (angle) of its blades can be adjusted to match the airflow and pressure requirements of the system.
Variable-Pitch Vaneaxial Fan
variable-pitchvariable-pitchbladesblades
Figure 35
TRG-TRC013-EN 25
period oneFan Performance
notes
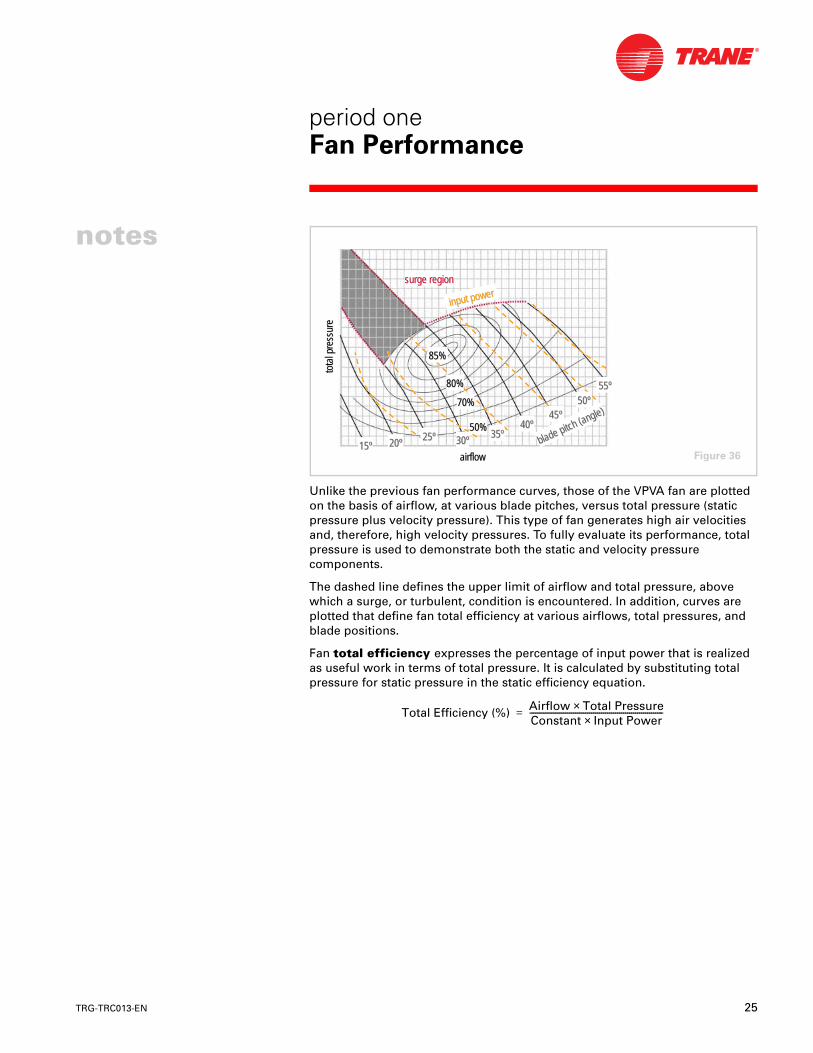
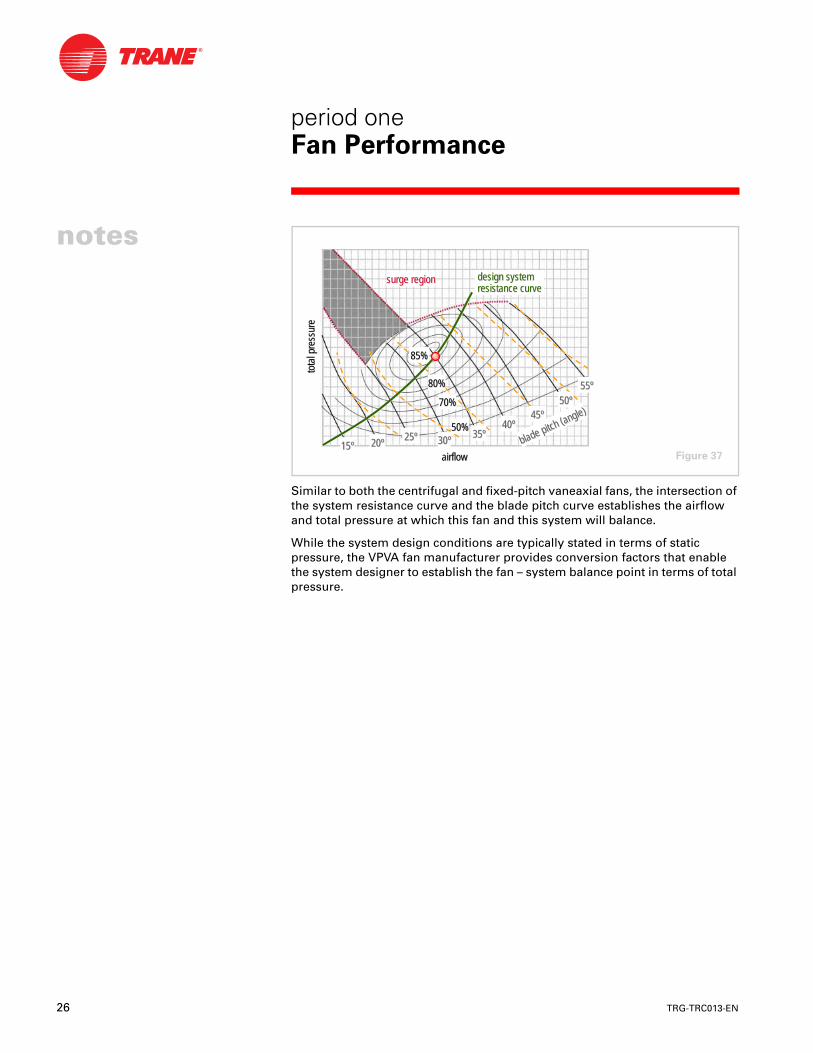
Unlike the previous fan performance curves, those of the VPVA fan are plotted on the basis of airflow, at various blade pitches, versus total pressure (static pressure plus velocity pressure). This type of fan generates high air velocities and, therefore, high velocity pressures. To fully evaluate its performance, total pressure is used to demonstrate both the static and velocity pressure components.
The dashed line defines the upper limit of airflow and total pressure, above which a surge, or turbulent, condition is encountered. In addition, curves are plotted that define fan total efficiency at various airflows, total pressures, and blade positions.
Fan total efficiency expresses the percentage of input power that is realized as useful work in terms of total pressure. It is calculated by substituting total pressure for static pressure in the static efficiency equation.
airflowairflow
tota
l pre
ssur
eto
tal p
ress
ure
blade pitch (angle)
blade pitch (angle)
50%50%
70%70%
80%80%
85%85%
50º50º
40º40º35º35º
30º30º20º20º15º15º
55º55º
45º45º
25º25º
input powerinput power
surge regionsurge region
Figure 36
Total Efficiency (%) Airflow Total Pressure×Constant Input Power×-------------------------------------------------------------------=
26 TRG-TRC013-EN
notes
period oneFan Performance
Similar to both the centrifugal and fixed-pitch vaneaxial fans, the intersection of the system resistance curve and the blade pitch curve establishes the airflow and total pressure at which this fan and this system will balance.
While the system design conditions are typically stated in terms of static pressure, the VPVA fan manufacturer provides conversion factors that enable the system designer to establish the fan – system balance point in terms of total pressure.
surge regionsurge region
airflowairflow
tota
l pre
ssur
eto
tal p
ress
ure
design systemresistance curvedesign systemdesign systemresistance curveresistance curve
50%50%
70%70%
80%80%
85%85%
50º50º
40º40º35º35º
30º30º20º20º15º15º
55º55º
45º45º
25º25º blade pitch (angle)
blade pitch (angle)
Figure 37
TRG-TRC013-EN 27
notes
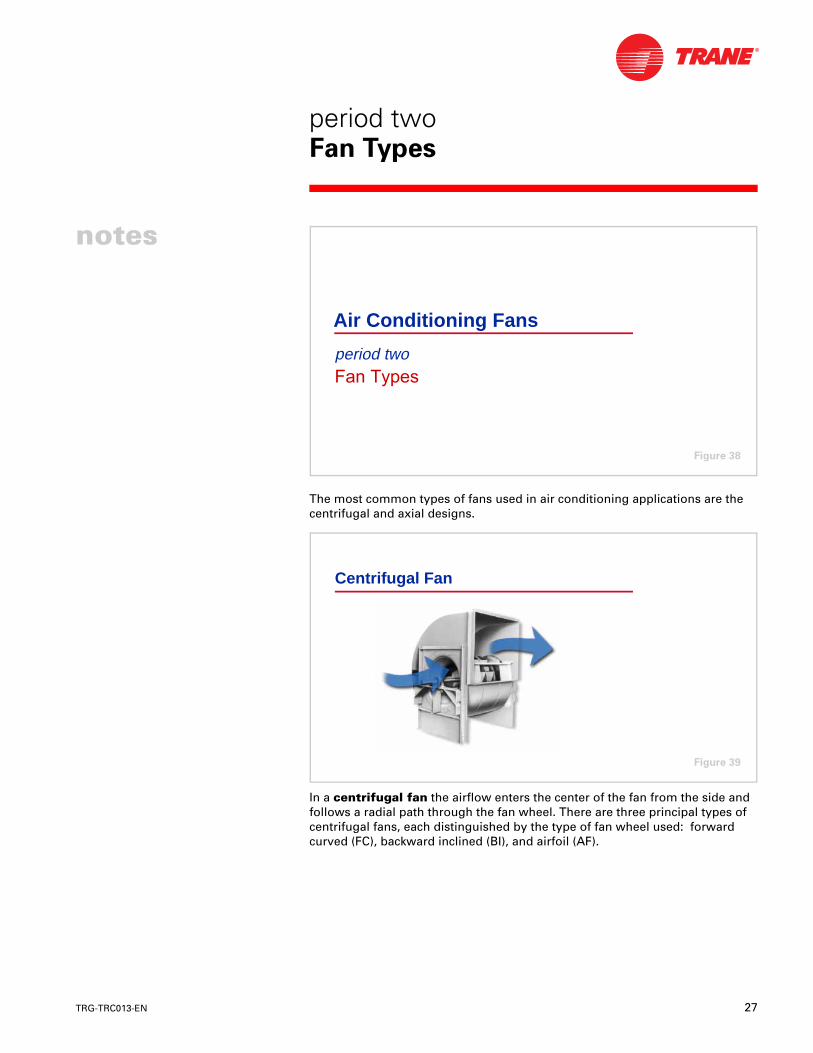
The most common types of fans used in air conditioning applications are the centrifugal and axial designs.
In a centrifugal fan the airflow enters the center of the fan from the side and follows a radial path through the fan wheel. There are three principal types of centrifugal fans, each distinguished by the type of fan wheel used: forward curved (FC), backward inclined (BI), and airfoil (AF).
Air Conditioning Fans
period two
Figure 38
Centrifugal Fan
Figure 39
period twoFan Types
28 TRG-TRC013-EN
notes
period twoFan Types
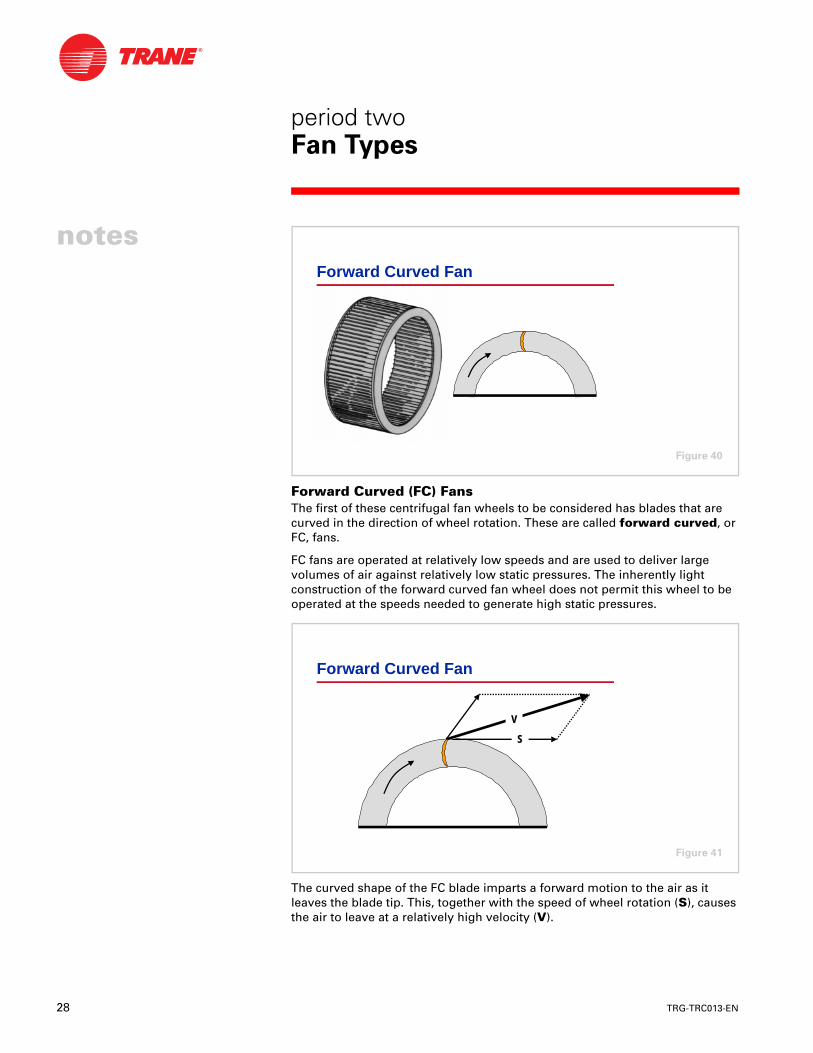
Forward Curved (FC) FansThe first of these centrifugal fan wheels to be considered has blades that are curved in the direction of wheel rotation. These are called forward curved, or FC, fans.
FC fans are operated at relatively low speeds and are used to deliver large volumes of air against relatively low static pressures. The inherently light construction of the forward curved fan wheel does not permit this wheel to be operated at the speeds needed to generate high static pressures.
The curved shape of the FC blade imparts a forward motion to the air as it leaves the blade tip. This, together with the speed of wheel rotation (S), causes the air to leave at a relatively high velocity (V).
Forward Curved Fan
Figure 40
Forward Curved Fan
SS
VV
Figure 41
TRG-TRC013-EN 29
period twoFan Types
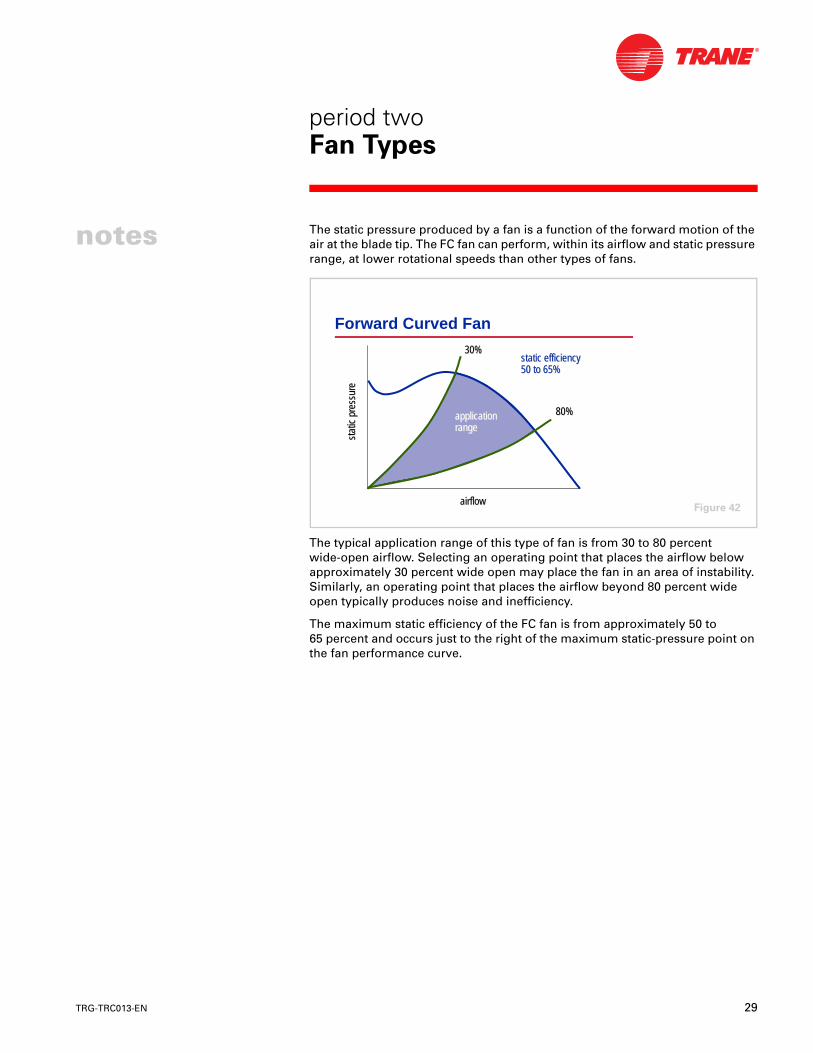
notes The static pressure produced by a fan is a function of the forward motion of the air at the blade tip. The FC fan can perform, within its airflow and static pressure range, at lower rotational speeds than other types of fans.
The typical application range of this type of fan is from 30 to 80 percentwide-open airflow. Selecting an operating point that places the airflow below approximately 30 percent wide open may place the fan in an area of instability. Similarly, an operating point that places the airflow beyond 80 percent wide open typically produces noise and inefficiency.
The maximum static efficiency of the FC fan is from approximately 50 to65 percent and occurs just to the right of the maximum static-pressure point on the fan performance curve.
applicationapplicationrangerange
30%30%
80%80%
airflowairflow
stat
ic p
ress
ure
stat
ic p
ress
ure
Forward Curved Fan
static efficiencystatic efficiency50 to 65%50 to 65%
Figure 42
30 TRG-TRC013-EN
notes
period twoFan Types
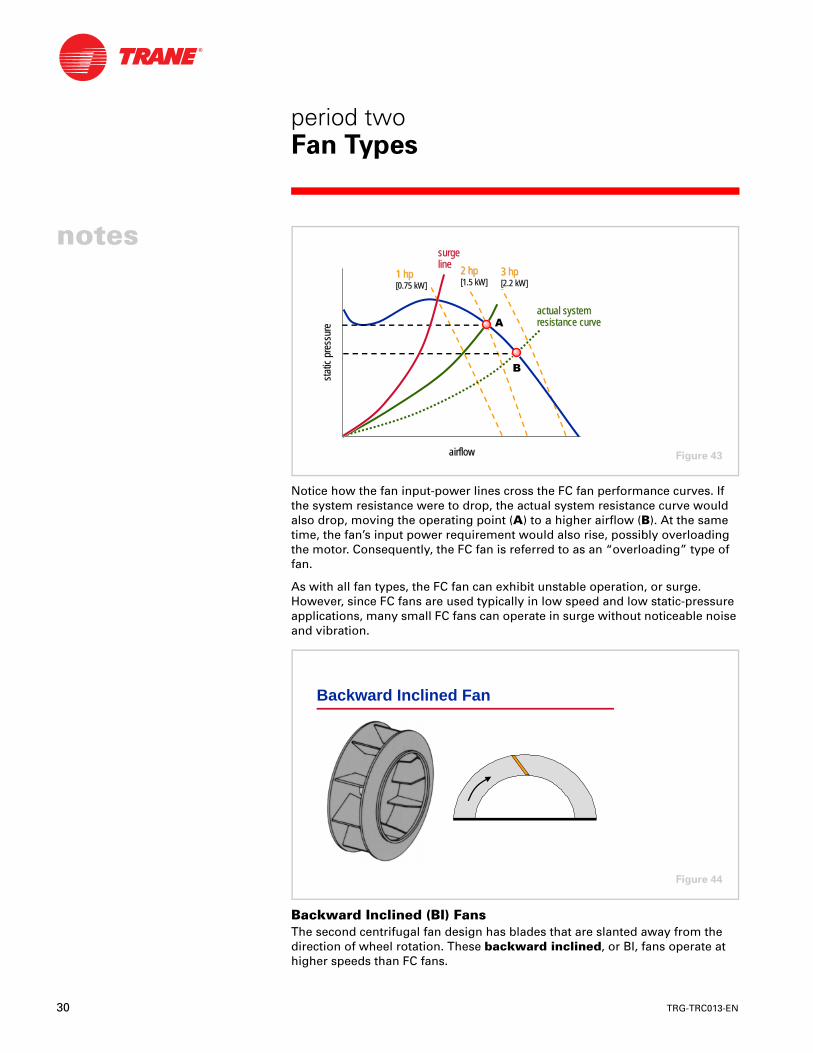
Notice how the fan input-power lines cross the FC fan performance curves. If the system resistance were to drop, the actual system resistance curve would also drop, moving the operating point (A) to a higher airflow (B). At the same time, the fan’s input power requirement would also rise, possibly overloading the motor. Consequently, the FC fan is referred to as an “overloading” type of fan.
As with all fan types, the FC fan can exhibit unstable operation, or surge. However, since FC fans are used typically in low speed and low static-pressure applications, many small FC fans can operate in surge without noticeable noise and vibration.
Backward Inclined (BI) FansThe second centrifugal fan design has blades that are slanted away from the direction of wheel rotation. These backward inclined, or BI, fans operate at higher speeds than FC fans.
airflowairflow
stat
ic p
ress
ure
stat
ic p
ress
ure
actual systemresistance curveactual systemactual systemresistance curveresistance curve
surgelinesurgesurgelineline
2 hp2 hp[1.5 kW][1.5 kW]
3 hp3 hp[2.2 kW][2.2 kW]
1 hp1 hp[0.75 kW][0.75 kW]
$
%
Figure 43
Backward Inclined Fan
Figure 44
TRG-TRC013-EN 31
period twoFan Types
notes
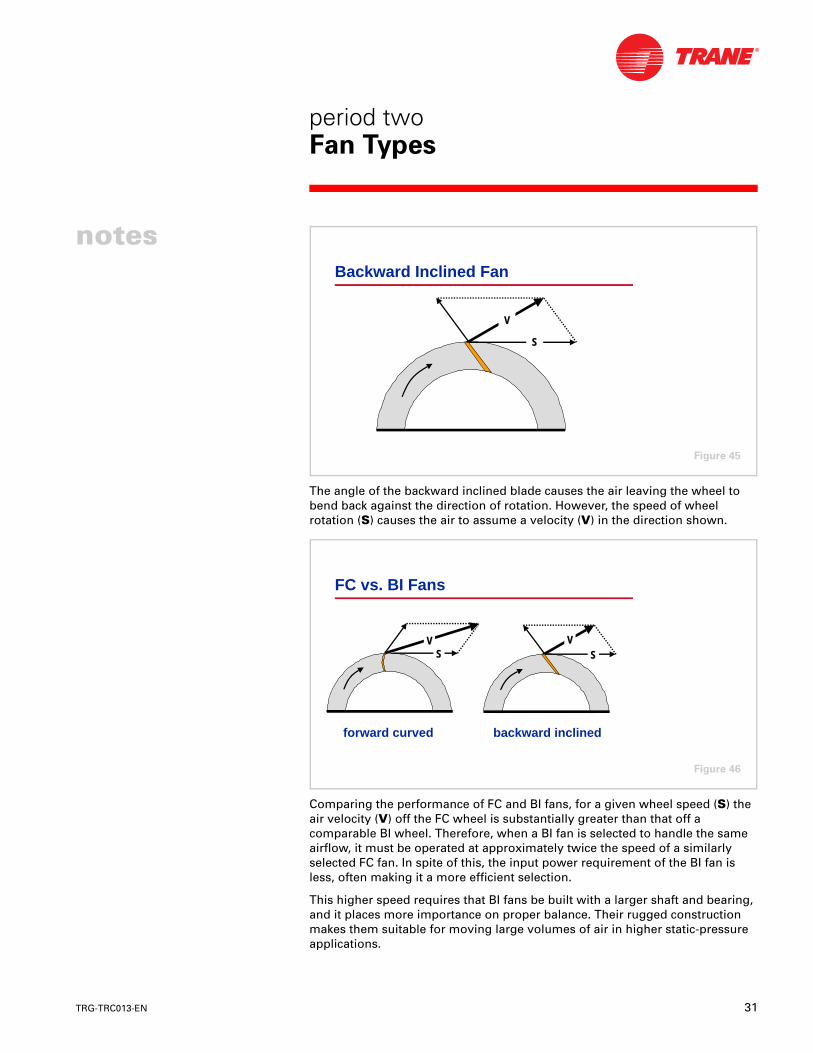
The angle of the backward inclined blade causes the air leaving the wheel to bend back against the direction of rotation. However, the speed of wheel rotation (S) causes the air to assume a velocity (V) in the direction shown.
Comparing the performance of FC and BI fans, for a given wheel speed (S) the air velocity (V) off the FC wheel is substantially greater than that off a comparable BI wheel. Therefore, when a BI fan is selected to handle the same airflow, it must be operated at approximately twice the speed of a similarly selected FC fan. In spite of this, the input power requirement of the BI fan is less, often making it a more efficient selection.
This higher speed requires that BI fans be built with a larger shaft and bearing, and it places more importance on proper balance. Their rugged construction makes them suitable for moving large volumes of air in higher static-pressure applications.
Backward Inclined Fan
SS
VV
Figure 45
forward curved backward inclined
SSVV
SSVV
FC vs. BI Fans
Figure 46
32 TRG-TRC013-EN
notes
period twoFan Types
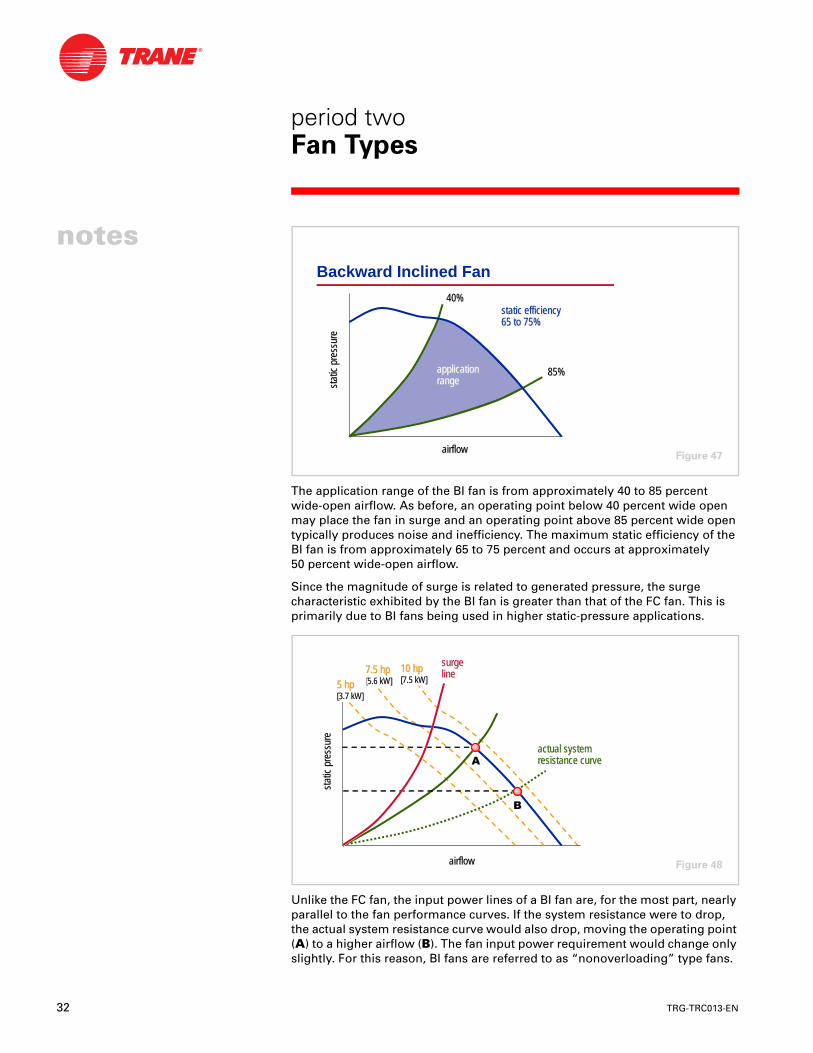
The application range of the BI fan is from approximately 40 to 85 percentwide-open airflow. As before, an operating point below 40 percent wide open may place the fan in surge and an operating point above 85 percent wide open typically produces noise and inefficiency. The maximum static efficiency of the BI fan is from approximately 65 to 75 percent and occurs at approximately50 percent wide-open airflow.
Since the magnitude of surge is related to generated pressure, the surge characteristic exhibited by the BI fan is greater than that of the FC fan. This is primarily due to BI fans being used in higher static-pressure applications.
Unlike the FC fan, the input power lines of a BI fan are, for the most part, nearly parallel to the fan performance curves. If the system resistance were to drop, the actual system resistance curve would also drop, moving the operating point (A) to a higher airflow (B). The fan input power requirement would change only slightly. For this reason, BI fans are referred to as “nonoverloading” type fans.
40%40%
85%85%
airflowairflow
stat
ic p
ress
ure
stat
ic p
ress
ure
Backward Inclined Fan
applicationapplicationrangerange
static efficiencystatic efficiency65 to 75%65 to 75%
Figure 47
airflowairflow
stat
ic p
ress
ure
stat
ic p
ress
ure
actual systemresistance curveactual systemactual systemresistance curveresistance curve
surgelinesurgesurgelineline7.5 hp7.5 hp
[5.6 kW][5.6 kW]10 hp10 hp[7.5 kW][7.5 kW]5 hp5 hp
[3.7 kW][3.7 kW]
$
%
Figure 48
TRG-TRC013-EN 33
period twoFan Types
notes
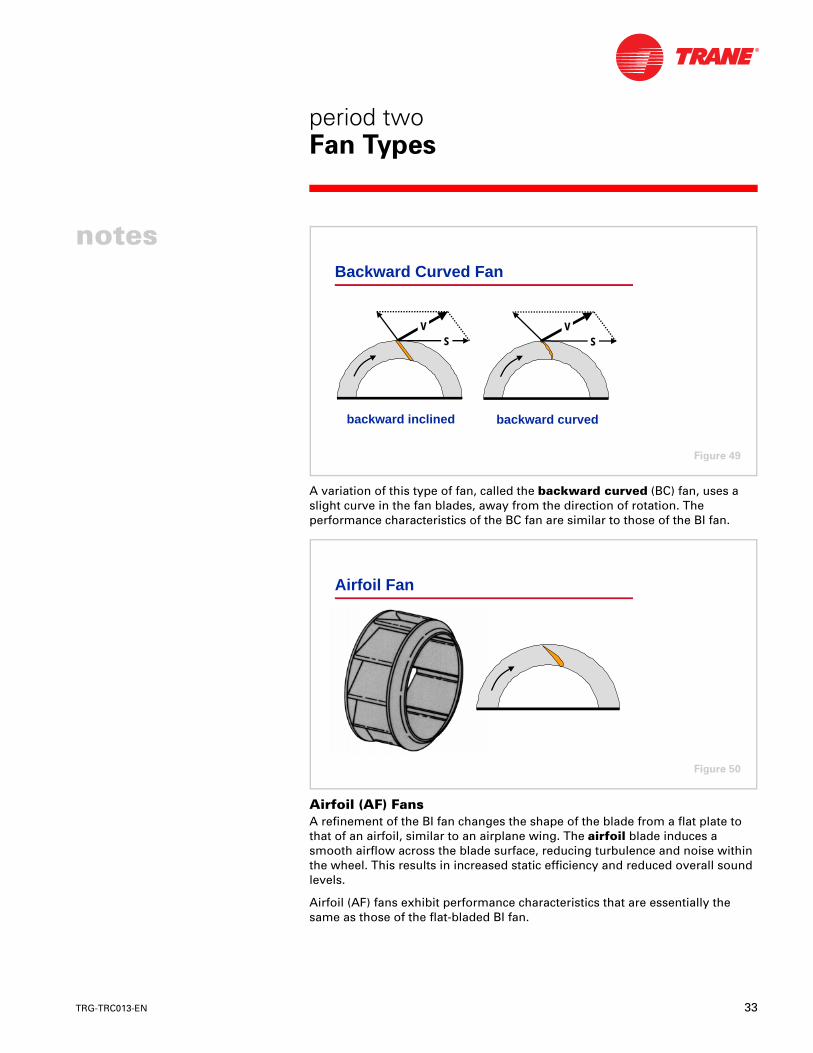
A variation of this type of fan, called the backward curved (BC) fan, uses a slight curve in the fan blades, away from the direction of rotation. The performance characteristics of the BC fan are similar to those of the BI fan.
Airfoil (AF) FansA refinement of the BI fan changes the shape of the blade from a flat plate to that of an airfoil, similar to an airplane wing. The airfoil blade induces a smooth airflow across the blade surface, reducing turbulence and noise within the wheel. This results in increased static efficiency and reduced overall sound levels.
Airfoil (AF) fans exhibit performance characteristics that are essentially the same as those of the flat-bladed BI fan.
backward curved
SSVV
Backward Curved Fan
backward inclined
SSVV
Figure 49
Airfoil Fan
Figure 50
34 TRG-TRC013-EN
notes
period twoFan Types
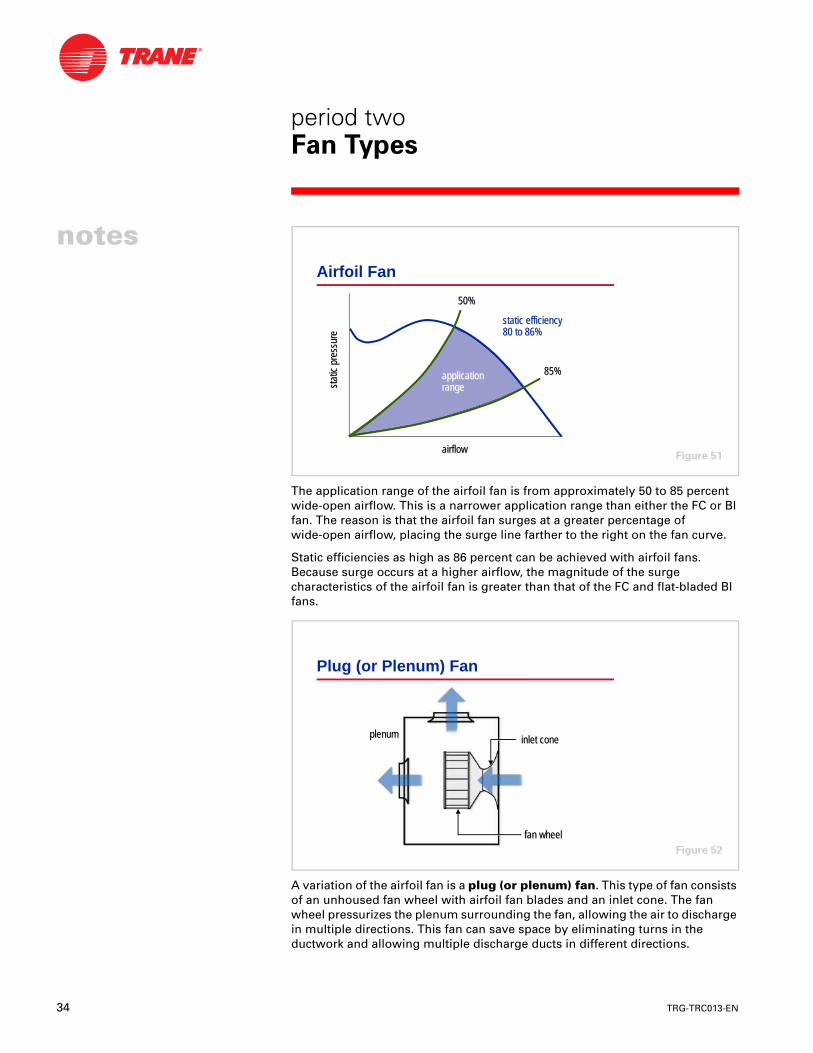
The application range of the airfoil fan is from approximately 50 to 85 percent wide-open airflow. This is a narrower application range than either the FC or BI fan. The reason is that the airfoil fan surges at a greater percentage ofwide-open airflow, placing the surge line farther to the right on the fan curve.
Static efficiencies as high as 86 percent can be achieved with airfoil fans. Because surge occurs at a higher airflow, the magnitude of the surge characteristics of the airfoil fan is greater than that of the FC and flat-bladed BI fans.
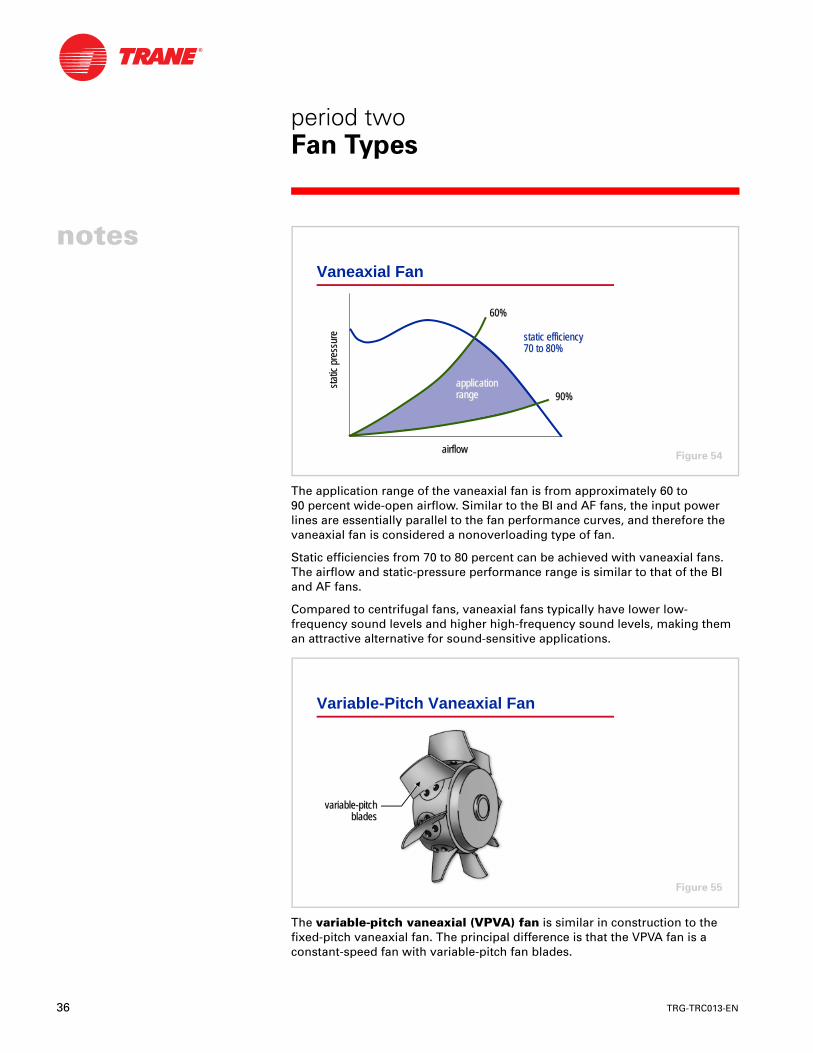
A variation of the airfoil fan is a plug (or plenum) fan. This type of fan consists of an unhoused fan wheel with airfoil fan blades and an inlet cone. The fan wheel pressurizes the plenum surrounding the fan, allowing the air to discharge in multiple directions. This fan can save space by eliminating turns in the ductwork and allowing multiple discharge ducts in different directions.
50%50%
85%85%
airflowairflow
stat
ic p
ress
ure
stat
ic p
ress
ure
Airfoil Fan
applicationapplicationrangerange
static efficiencystatic efficiency80 to 86%80 to 86%
Figure 51
Plug (or Plenum) Fan
fan wheelfan wheel
inlet coneinlet coneplenumplenum
Figure 52

TRG-TRC013-EN 35
period twoFan Types
notes
Vaneaxial FansIn an axial fan, the airflow passes straight through the fan, parallel to the shaft. There are three common axial fan types: propeller, tubeaxial, and vaneaxial.
Propeller fans are well suited for high volumes of air, but have little or nostatic-pressure generating capability.
Tubeaxial and vaneaxial fans are simply propeller fans mounted in a cylinder. They are similar except for the vane-type straighteners used in the vaneaxial design. Since a propeller fan inherently produces a spiral air stream, these vanes are installed at the leaving side of the fan to remove much of the swirl from the air and straighten the airflow path. These vanes improve efficiency, and reduce turbulence and the resulting sound generated in the downstream ductwork. Because a vaneaxial fan is more efficient than a tubeaxial fan, it can handle larger volumes of air at higher pressures.
Vaneaxial Fan
straightening vanes straightening vanes
fan wheel or impellerfan wheel or impeller
Figure 53
36 TRG-TRC013-EN
notes
period twoFan Types
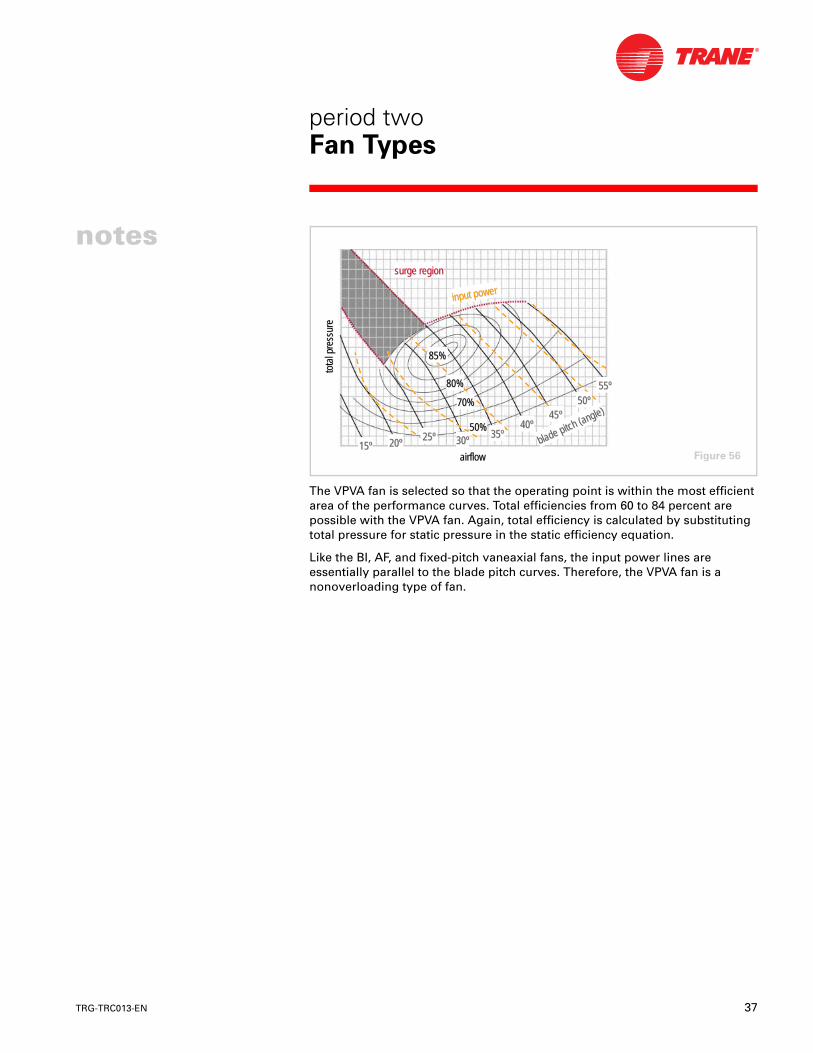
The application range of the vaneaxial fan is from approximately 60 to90 percent wide-open airflow. Similar to the BI and AF fans, the input power lines are essentially parallel to the fan performance curves, and therefore the vaneaxial fan is considered a nonoverloading type of fan.
Static efficiencies from 70 to 80 percent can be achieved with vaneaxial fans. The airflow and static-pressure performance range is similar to that of the BI and AF fans.
Compared to centrifugal fans, vaneaxial fans typically have lower low-frequency sound levels and higher high-frequency sound levels, making them an attractive alternative for sound-sensitive applications.
The variable-pitch vaneaxial (VPVA) fan is similar in construction to the fixed-pitch vaneaxial fan. The principal difference is that the VPVA fan is a constant-speed fan with variable-pitch fan blades.
60%60%
90%90%
airflowairflow
stat
ic p
ress
ure
stat
ic p
ress
ure
Vaneaxial Fan
applicationapplicationrangerange
static efficiencystatic efficiency70 to 80%70 to 80%
Figure 54
Variable-Pitch Vaneaxial Fan
variable-pitchvariable-pitchbladesblades
Figure 55
TRG-TRC013-EN 37
period twoFan Types
notes
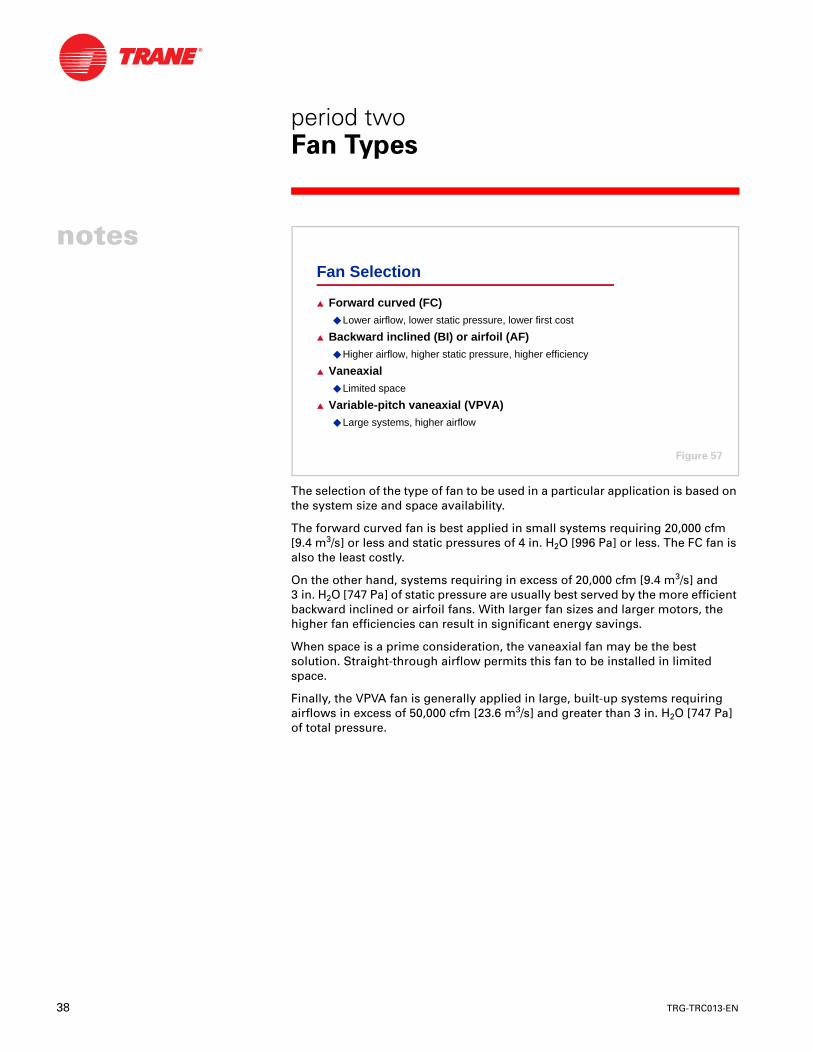
The VPVA fan is selected so that the operating point is within the most efficient area of the performance curves. Total efficiencies from 60 to 84 percent are possible with the VPVA fan. Again, total efficiency is calculated by substituting total pressure for static pressure in the static efficiency equation.
Like the BI, AF, and fixed-pitch vaneaxial fans, the input power lines are essentially parallel to the blade pitch curves. Therefore, the VPVA fan is a nonoverloading type of fan.
airflowairflow
tota
l pre
ssur
eto
tal p
ress
ure
surge regionsurge region
50%50%
70%70%
80%80%
85%85%
input powerinput power
blade pitch (angle)
blade pitch (angle)50º50º
40º40º35º35º
30º30º20º20º15º15º
55º55º
45º45º
25º25º
Figure 56
38 TRG-TRC013-EN
notes
period twoFan Types
The selection of the type of fan to be used in a particular application is based on the system size and space availability.
The forward curved fan is best applied in small systems requiring 20,000 cfm [9.4 m3/s] or less and static pressures of 4 in. H2O [996 Pa] or less. The FC fan is also the least costly.
On the other hand, systems requiring in excess of 20,000 cfm [9.4 m3/s] and 3 in. H2O [747 Pa] of static pressure are usually best served by the more efficient backward inclined or airfoil fans. With larger fan sizes and larger motors, the higher fan efficiencies can result in significant energy savings.
When space is a prime consideration, the vaneaxial fan may be the best solution. Straight-through airflow permits this fan to be installed in limited space.
Finally, the VPVA fan is generally applied in large, built-up systems requiring airflows in excess of 50,000 cfm [23.6 m3/s] and greater than 3 in. H2O [747 Pa] of total pressure.
Fan Selection
▲ Forward curved (FC)◆ Lower airflow, lower static pressure, lower first cost
▲ Backward inclined (BI) or airfoil (AF)◆ Higher airflow, higher static pressure, higher efficiency
▲ Vaneaxial◆ Limited space
▲ Variable-pitch vaneaxial (VPVA)◆ Large systems, higher airflow
Figure 57
TRG-TRC013-EN 39
notes
period threeFan Capacity Control
The previous discussions assumed that the fan would perform at a single operating point, located by the intersection of the system resistance and fan performance curves, in a constant-volume system. This type of system provides a constant volume of variable-temperature air to control the environment of a building.
A variable-air-volume (VAV) system, however, controls the environment by varying the volume of constant-temperature air. This places additional demands on fan performance and brings up the subject of fan capacity control.
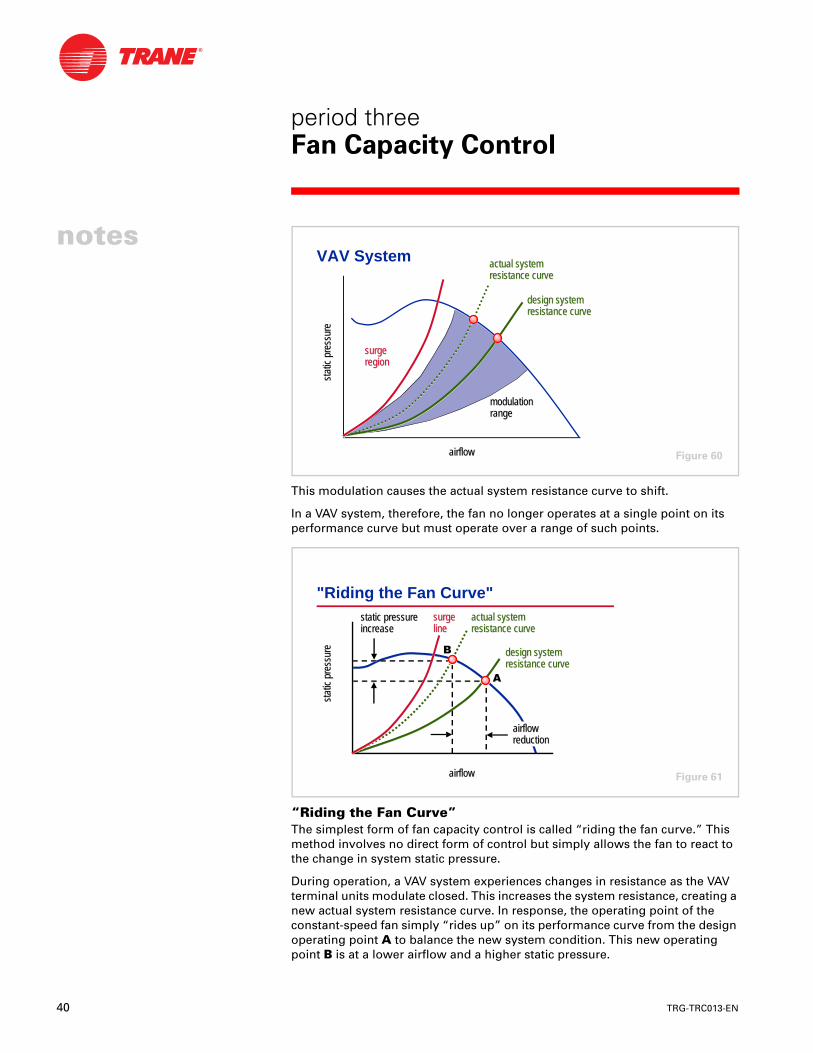
In a VAV system, the quantity of air being delivered to each space is controlled by a modulating device (a blade damper or an air valve) that is contained within a VAV terminal unit (box). This device is controlled by a thermostat to provide only the quantity of conditioned air needed to balance the space load. As the device modulates, the overall system resistance changes.
Air Conditioning Fans
period three
Figure 58
VAV System
supplysupplyfanfan
thermostatthermostat
VAVVAVboxbox
Figure 59
40 TRG-TRC013-EN
notes
period threeFan Capacity Control
This modulation causes the actual system resistance curve to shift.
In a VAV system, therefore, the fan no longer operates at a single point on its performance curve but must operate over a range of such points.
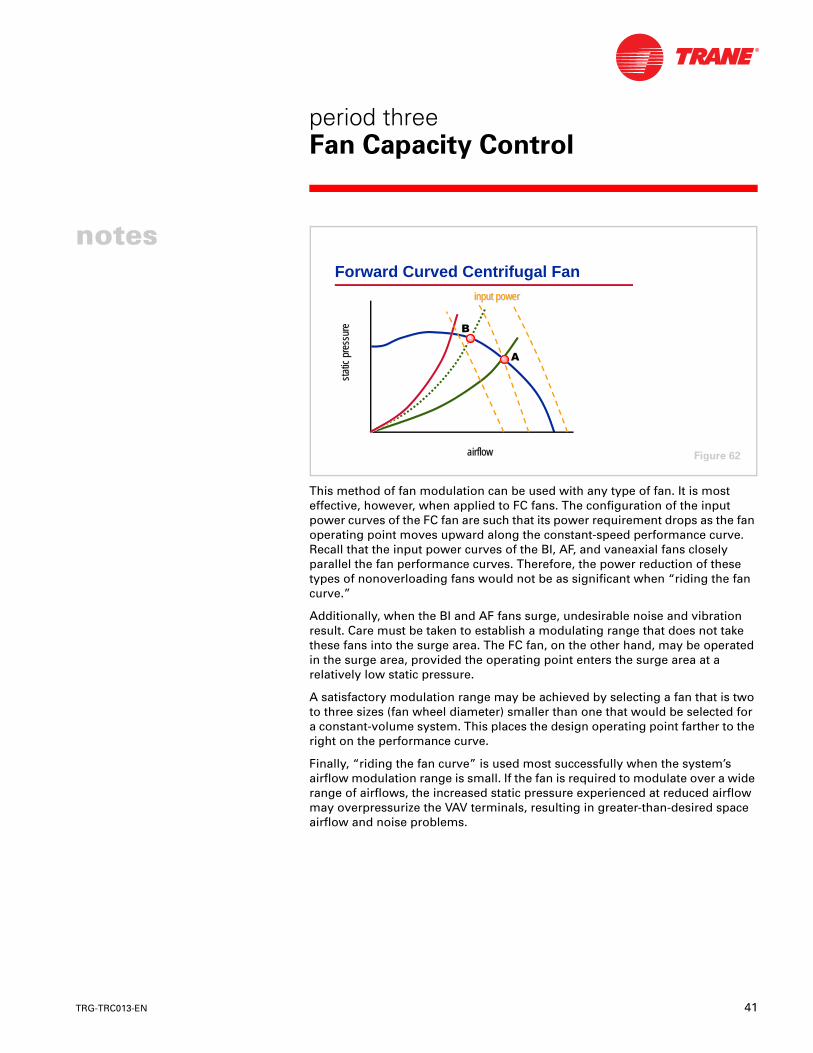
“Riding the Fan Curve”The simplest form of fan capacity control is called “riding the fan curve.” This method involves no direct form of control but simply allows the fan to react to the change in system static pressure.
During operation, a VAV system experiences changes in resistance as the VAV terminal units modulate closed. This increases the system resistance, creating a new actual system resistance curve. In response, the operating point of the constant-speed fan simply “rides up” on its performance curve from the design operating point A to balance the new system condition. This new operating point B is at a lower airflow and a higher static pressure.
airflowairflow
stat
ic p
ress
ure
stat
ic p
ress
ure
surgeregionsurgesurgeregionregion
design systemresistance curvedesign systemdesign systemresistance curveresistance curve
modulationmodulationrangerange
actual systemresistance curveactual systemactual systemresistance curveresistance curve
VAV System
Figure 60
"Riding the Fan Curve"static pressurestatic pressureincreaseincrease
airflowairflowreductionreduction
%
airflowairflow
stat
ic p
ress
ure
stat
ic p
ress
ure
surgelinesurgesurgelineline
$
design systemresistance curvedesign systemdesign systemresistance curveresistance curve
actual systemresistance curveactual systemactual systemresistance curveresistance curve
Figure 61
TRG-TRC013-EN 41
period threeFan Capacity Control
notes
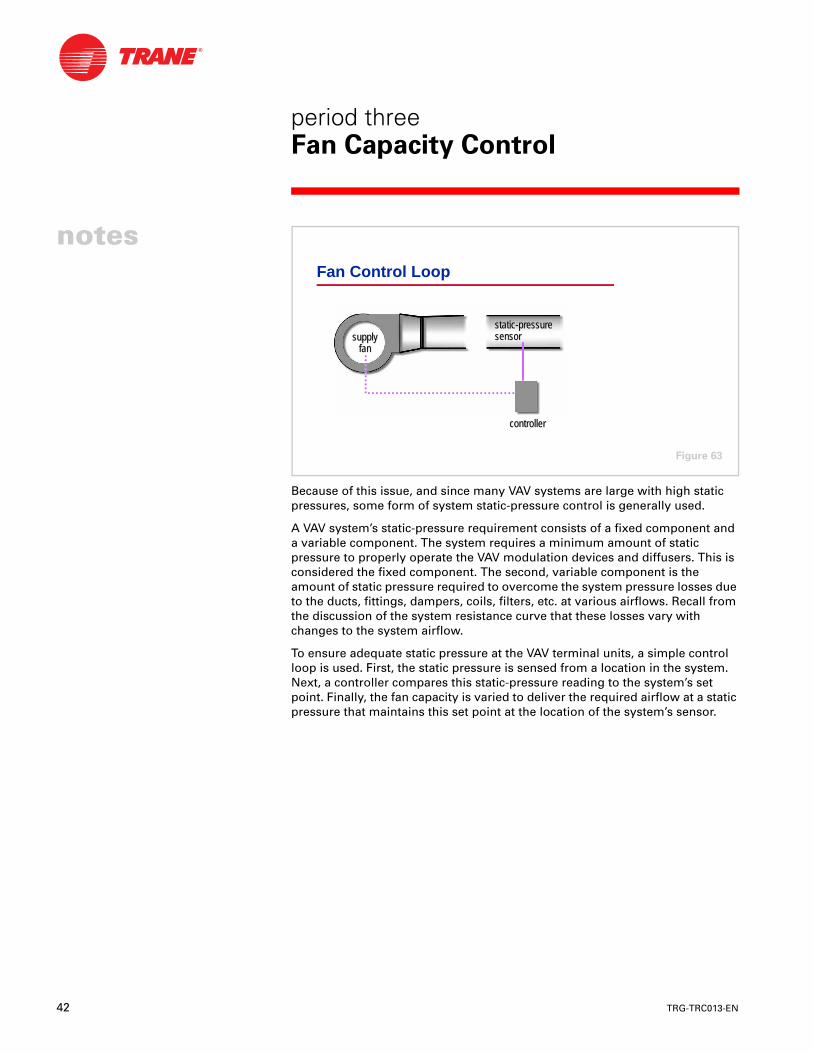
This method of fan modulation can be used with any type of fan. It is most effective, however, when applied to FC fans. The configuration of the input power curves of the FC fan are such that its power requirement drops as the fan operating point moves upward along the constant-speed performance curve. Recall that the input power curves of the BI, AF, and vaneaxial fans closely parallel the fan performance curves. Therefore, the power reduction of these types of nonoverloading fans would not be as significant when “riding the fan curve.”
Additionally, when the BI and AF fans surge, undesirable noise and vibration result. Care must be taken to establish a modulating range that does not take these fans into the surge area. The FC fan, on the other hand, may be operated in the surge area, provided the operating point enters the surge area at a relatively low static pressure.
A satisfactory modulation range may be achieved by selecting a fan that is two to three sizes (fan wheel diameter) smaller than one that would be selected for a constant-volume system. This places the design operating point farther to the right on the performance curve.
Finally, “riding the fan curve” is used most successfully when the system’s airflow modulation range is small. If the fan is required to modulate over a wide range of airflows, the increased static pressure experienced at reduced airflow may overpressurize the VAV terminals, resulting in greater-than-desired space airflow and noise problems.
Forward Curved Centrifugal Fan
$
%
airflowairflow
stat
ic p
ress
ure
stat
ic p
ress
ure
input powerinput power
Figure 62
42 TRG-TRC013-EN
notes
period threeFan Capacity Control
Because of this issue, and since many VAV systems are large with high static pressures, some form of system static-pressure control is generally used.
A VAV system’s static-pressure requirement consists of a fixed component and a variable component. The system requires a minimum amount of static pressure to properly operate the VAV modulation devices and diffusers. This is considered the fixed component. The second, variable component is the amount of static pressure required to overcome the system pressure losses due to the ducts, fittings, dampers, coils, filters, etc. at various airflows. Recall from the discussion of the system resistance curve that these losses vary with changes to the system airflow.
To ensure adequate static pressure at the VAV terminal units, a simple control loop is used. First, the static pressure is sensed from a location in the system. Next, a controller compares this static-pressure reading to the system’s set point. Finally, the fan capacity is varied to deliver the required airflow at a static pressure that maintains this set point at the location of the system’s sensor.
Fan Control Loop
static-pressurestatic-pressuresensorsensor
controllercontroller
supplysupplyfanfan
Figure 63
TRG-TRC013-EN 43
period threeFan Capacity Control
notes
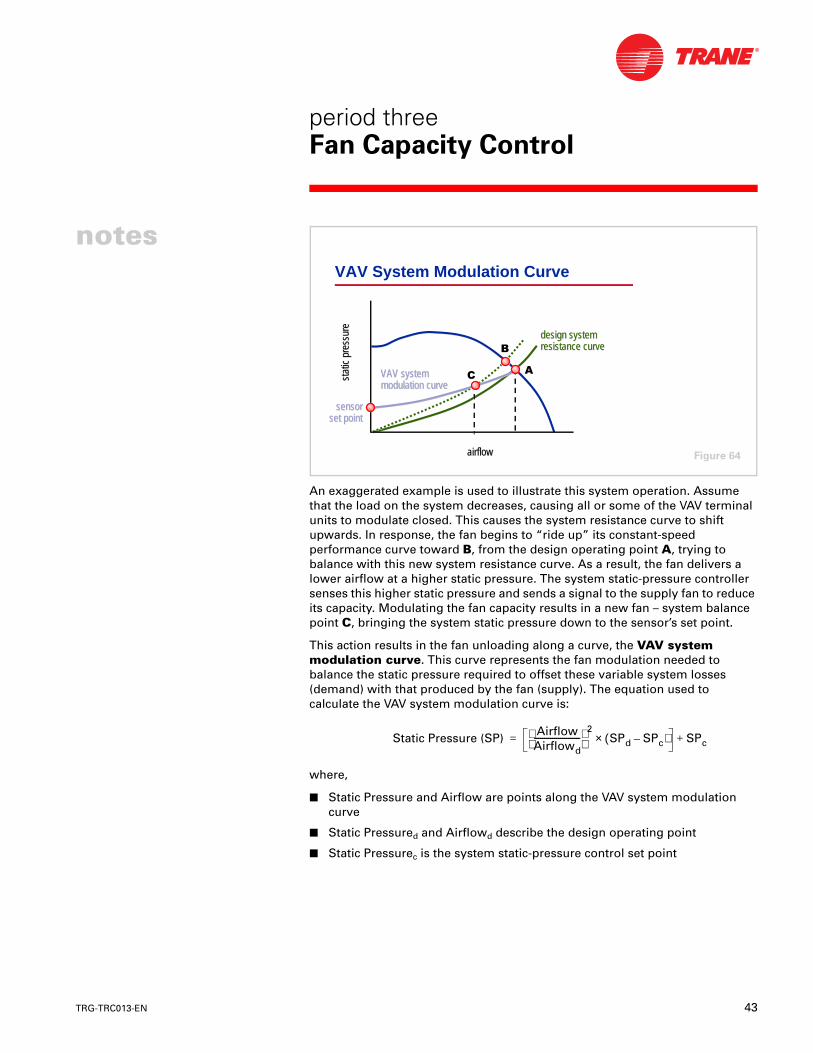
An exaggerated example is used to illustrate this system operation. Assume that the load on the system decreases, causing all or some of the VAV terminal units to modulate closed. This causes the system resistance curve to shift upwards. In response, the fan begins to “ride up” its constant-speed performance curve toward B, from the design operating point A, trying to balance with this new system resistance curve. As a result, the fan delivers a lower airflow at a higher static pressure. The system static-pressure controller senses this higher static pressure and sends a signal to the supply fan to reduce its capacity. Modulating the fan capacity results in a new fan – system balance point C, bringing the system static pressure down to the sensor’s set point.
This action results in the fan unloading along a curve, the VAV system modulation curve. This curve represents the fan modulation needed to balance the static pressure required to offset these variable system losses (demand) with that produced by the fan (supply). The equation used to calculate the VAV system modulation curve is:
where,
■ Static Pressure and Airflow are points along the VAV system modulation curve
■ Static Pressured and Airflowd describe the design operating point
■ Static Pressurec is the system static-pressure control set point
VAV System Modulation Curve
$&
design systemdesign systemresistance curveresistance curve
airflowairflow
stat
ic p
ress
ure
stat
ic p
ress
ure
sensorsensorset pointset point
VAV systemVAV systemmodulation curvemodulation curve
%
Figure 64
Static Pressure (SP) AirflowAirflowd-----------------------
2SPd SPc–( )× SPc+=
44 TRG-TRC013-EN
notes
period threeFan Capacity Control
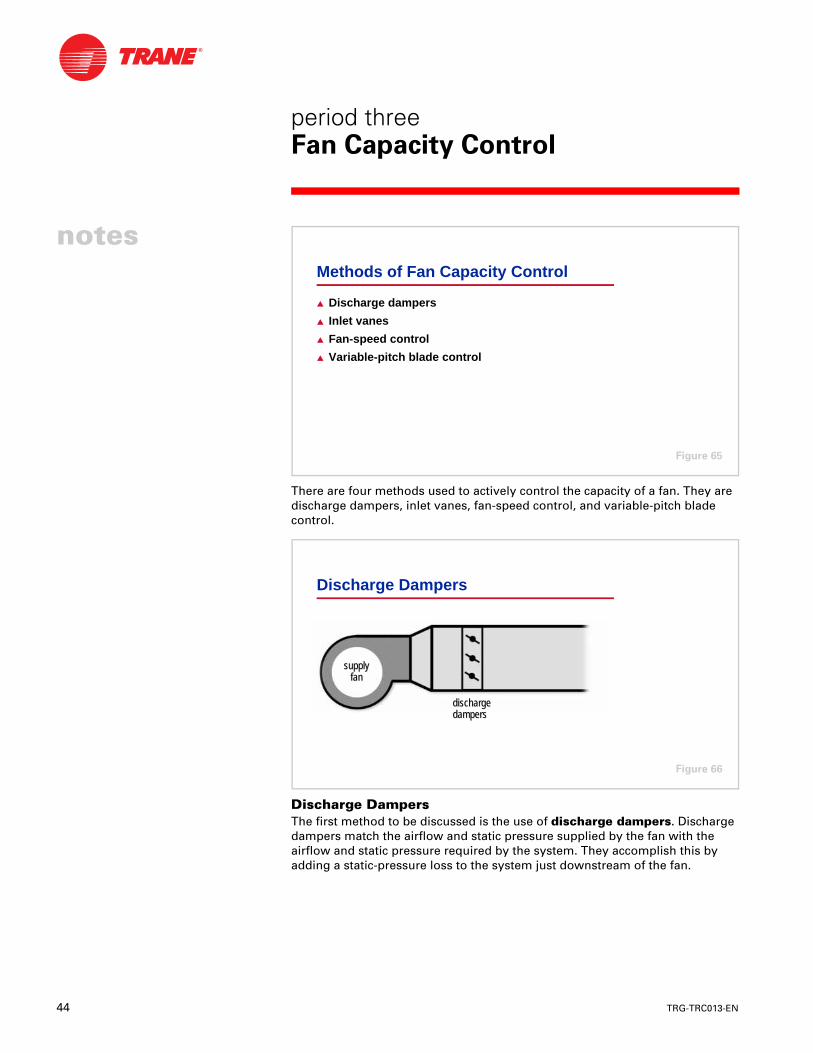
There are four methods used to actively control the capacity of a fan. They are discharge dampers, inlet vanes, fan-speed control, and variable-pitch blade control.
Discharge DampersThe first method to be discussed is the use of discharge dampers. Discharge dampers match the airflow and static pressure supplied by the fan with the airflow and static pressure required by the system. They accomplish this by adding a static-pressure loss to the system just downstream of the fan.
Methods of Fan Capacity Control
▲ Discharge dampers
▲ Inlet vanes
▲ Fan-speed control
▲ Variable-pitch blade control
Figure 65
Discharge Dampers
dischargedischargedampersdampers
supplysupplyfanfan
Figure 66
TRG-TRC013-EN 45
period threeFan Capacity Control
notes
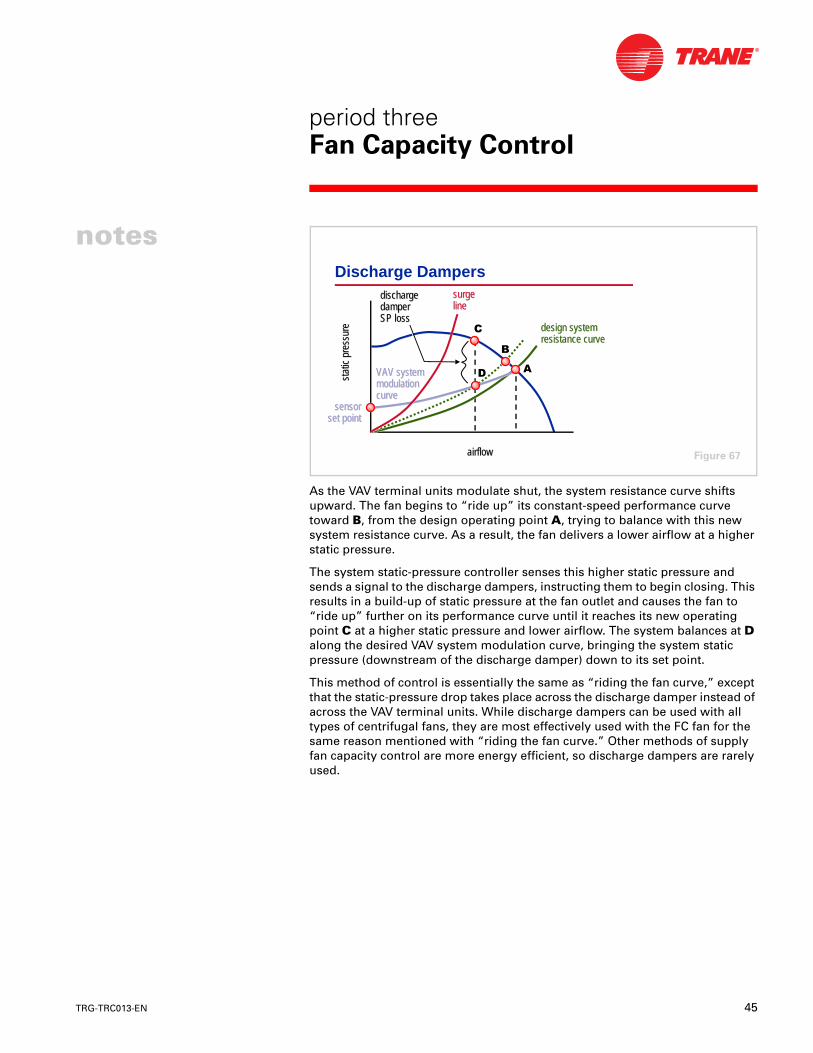
As the VAV terminal units modulate shut, the system resistance curve shifts upward. The fan begins to “ride up” its constant-speed performance curve toward B, from the design operating point A, trying to balance with this new system resistance curve. As a result, the fan delivers a lower airflow at a higher static pressure.
The system static-pressure controller senses this higher static pressure and sends a signal to the discharge dampers, instructing them to begin closing. This results in a build-up of static pressure at the fan outlet and causes the fan to “ride up” further on its performance curve until it reaches its new operating point C at a higher static pressure and lower airflow. The system balances at D along the desired VAV system modulation curve, bringing the system static pressure (downstream of the discharge damper) down to its set point.
This method of control is essentially the same as “riding the fan curve,” except that the static-pressure drop takes place across the discharge damper instead of across the VAV terminal units. While discharge dampers can be used with all types of centrifugal fans, they are most effectively used with the FC fan for the same reason mentioned with “riding the fan curve.” Other methods of supply fan capacity control are more energy efficient, so discharge dampers are rarely used.
Discharge DampersdischargedischargedamperdamperSP lossSP loss
airflowairflow
stat
ic p
ress
ure
stat
ic p
ress
ure
$'
design systemdesign systemresistance curveresistance curve
&
surgelinesurgesurgelineline
%
VAV systemVAV systemmodulationmodulationcurvecurve
sensorsensorset pointset point
Figure 67
46 TRG-TRC013-EN
notes
period threeFan Capacity Control
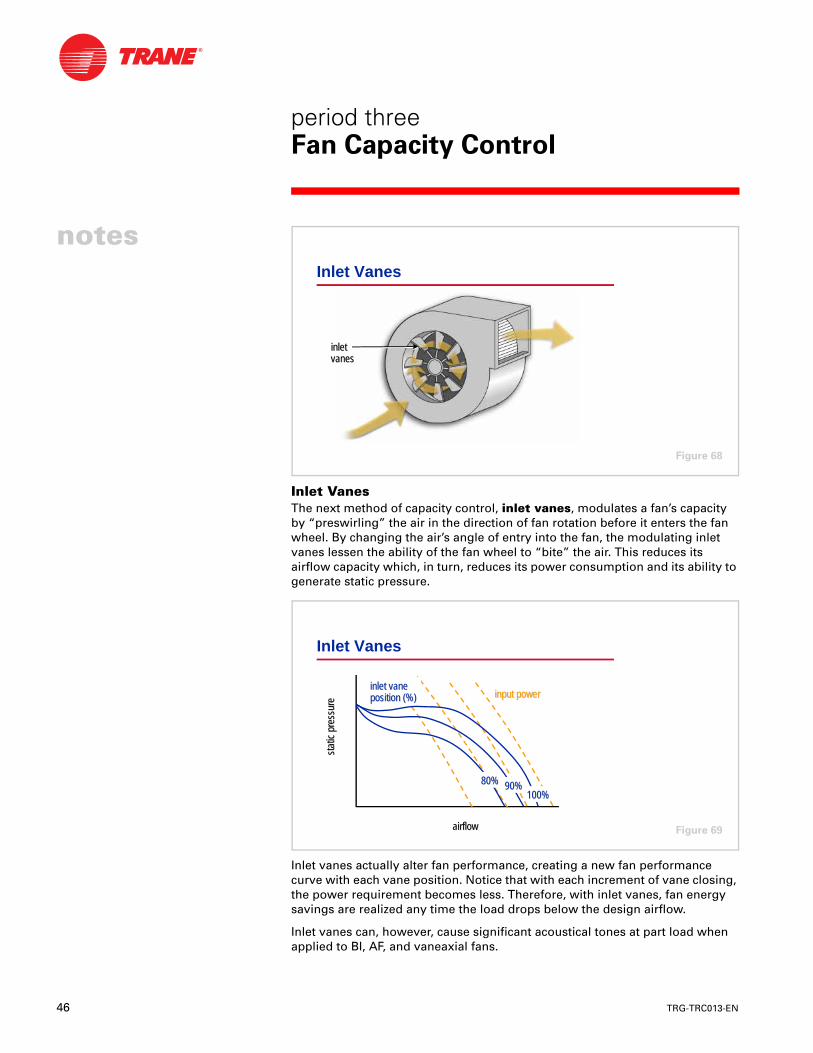
Inlet VanesThe next method of capacity control, inlet vanes, modulates a fan’s capacity by “preswirling” the air in the direction of fan rotation before it enters the fan wheel. By changing the air’s angle of entry into the fan, the modulating inlet vanes lessen the ability of the fan wheel to “bite” the air. This reduces its airflow capacity which, in turn, reduces its power consumption and its ability to generate static pressure.
Inlet vanes actually alter fan performance, creating a new fan performance curve with each vane position. Notice that with each increment of vane closing, the power requirement becomes less. Therefore, with inlet vanes, fan energy savings are realized any time the load drops below the design airflow.
Inlet vanes can, however, cause significant acoustical tones at part load when applied to BI, AF, and vaneaxial fans.
Inlet Vanes
inletinletvanesvanes
Figure 68
Inlet Vanes
airflowairflow
stat
ic p
ress
ure
stat
ic p
ress
ure
inlet vaneinlet vaneposition (%)position (%) input powerinput power
80%80% 90%90%100%100%
Figure 69
TRG-TRC013-EN 47
period threeFan Capacity Control
notes
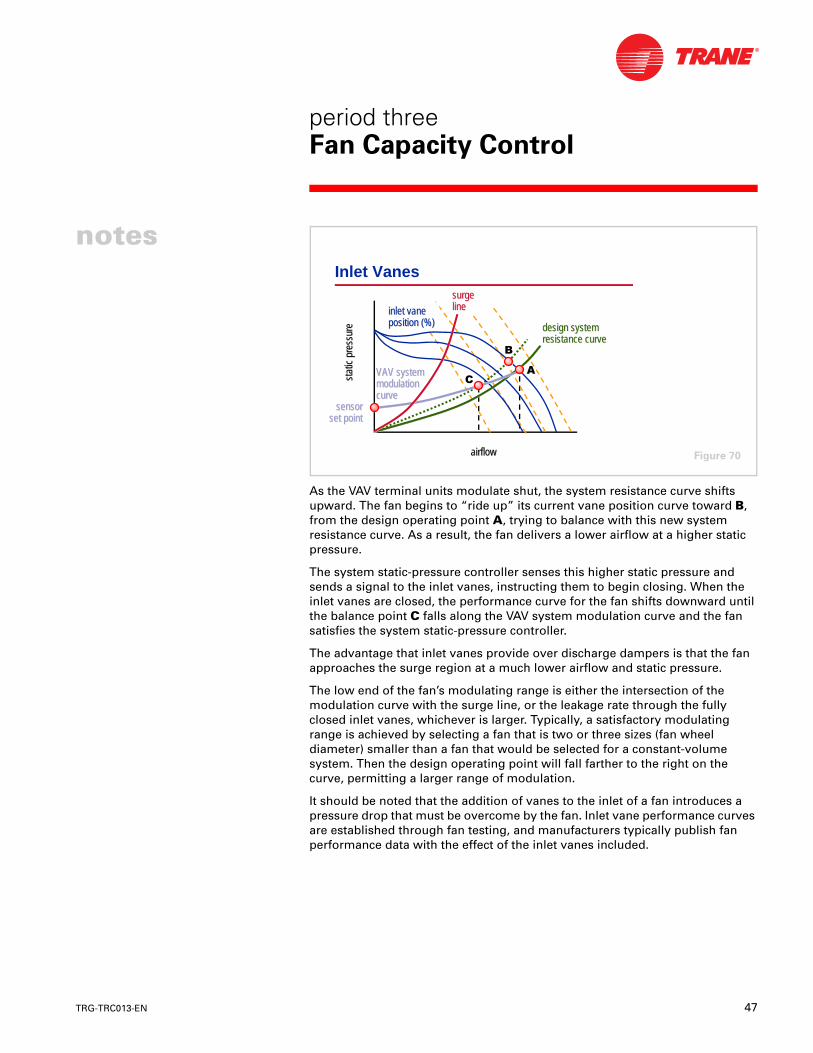
As the VAV terminal units modulate shut, the system resistance curve shifts upward. The fan begins to “ride up” its current vane position curve toward B, from the design operating point A, trying to balance with this new system resistance curve. As a result, the fan delivers a lower airflow at a higher static pressure.
The system static-pressure controller senses this higher static pressure and sends a signal to the inlet vanes, instructing them to begin closing. When the inlet vanes are closed, the performance curve for the fan shifts downward until the balance point C falls along the VAV system modulation curve and the fan satisfies the system static-pressure controller.
The advantage that inlet vanes provide over discharge dampers is that the fan approaches the surge region at a much lower airflow and static pressure.
The low end of the fan’s modulating range is either the intersection of the modulation curve with the surge line, or the leakage rate through the fully closed inlet vanes, whichever is larger. Typically, a satisfactory modulating range is achieved by selecting a fan that is two or three sizes (fan wheel diameter) smaller than a fan that would be selected for a constant-volume system. Then the design operating point will fall farther to the right on the curve, permitting a larger range of modulation.
It should be noted that the addition of vanes to the inlet of a fan introduces a pressure drop that must be overcome by the fan. Inlet vane performance curves are established through fan testing, and manufacturers typically publish fan performance data with the effect of the inlet vanes included.
Inlet Vanes
airflowairflow
stat
ic p
ress
ure
stat
ic p
ress
ure
$&
inlet vaneinlet vaneposition (%)position (%)
surgelinesurgesurgelineline
%
VAV systemVAV systemmodulationmodulationcurvecurve
sensorsensorset pointset point
design systemdesign systemresistance curveresistance curve
Figure 70
48 TRG-TRC013-EN
notes
period threeFan Capacity Control
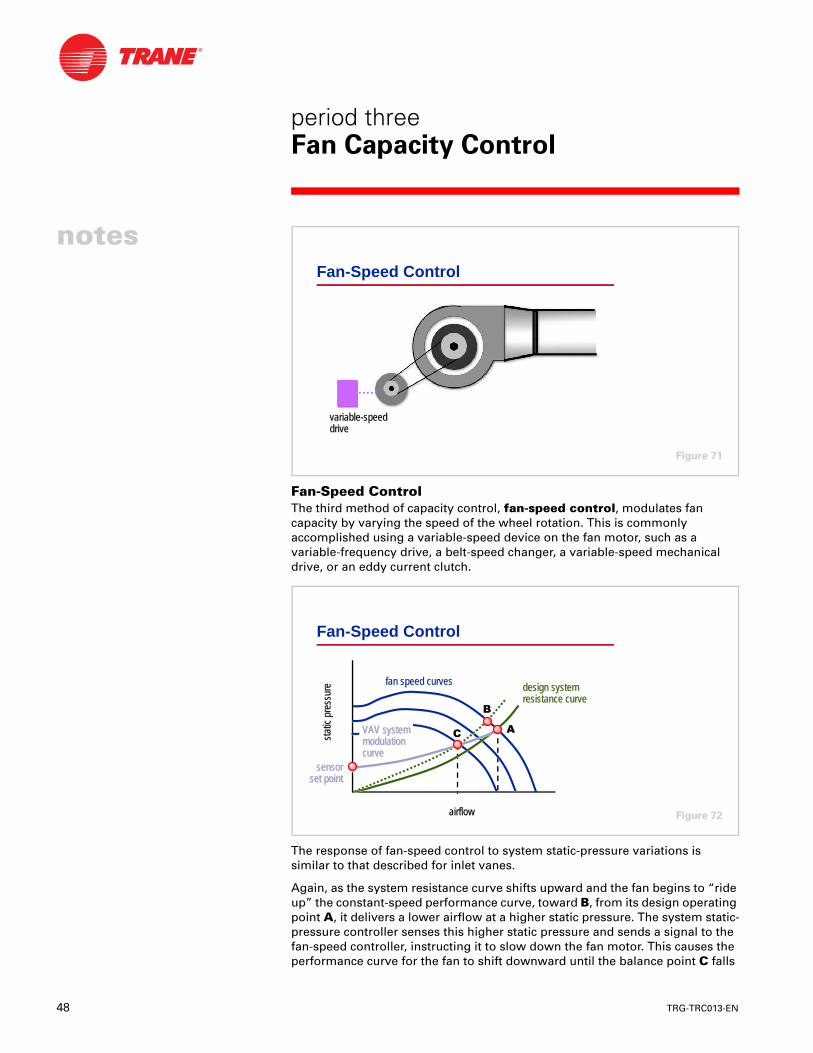
Fan-Speed ControlThe third method of capacity control, fan-speed control, modulates fan capacity by varying the speed of the wheel rotation. This is commonly accomplished using a variable-speed device on the fan motor, such as a variable-frequency drive, a belt-speed changer, a variable-speed mechanical drive, or an eddy current clutch.
The response of fan-speed control to system static-pressure variations is similar to that described for inlet vanes.
Again, as the system resistance curve shifts upward and the fan begins to “ride up” the constant-speed performance curve, toward B, from its design operating point A, it delivers a lower airflow at a higher static pressure. The system static-pressure controller senses this higher static pressure and sends a signal to the fan-speed controller, instructing it to slow down the fan motor. This causes the performance curve for the fan to shift downward until the balance point C falls
Fan-Speed Control
variable-speedvariable-speeddrivedrive
Figure 71
Fan-Speed Control
$&
airflowairflow
stat
ic p
ress
ure
stat
ic p
ress
ure fan speed curvesfan speed curves
%
VAV systemVAV systemmodulationmodulationcurvecurve
sensorsensorset pointset point
design systemdesign systemresistance curveresistance curve
Figure 72
TRG-TRC013-EN 49
period threeFan Capacity Control
notes along the VAV system modulation curve and the fan satisfies the systemstatic-pressure controller.
The low end of the fan’s modulation range is limited by the surge region. The principal advantages of fan-speed control are its energy saving potential and reduced noise at part load.
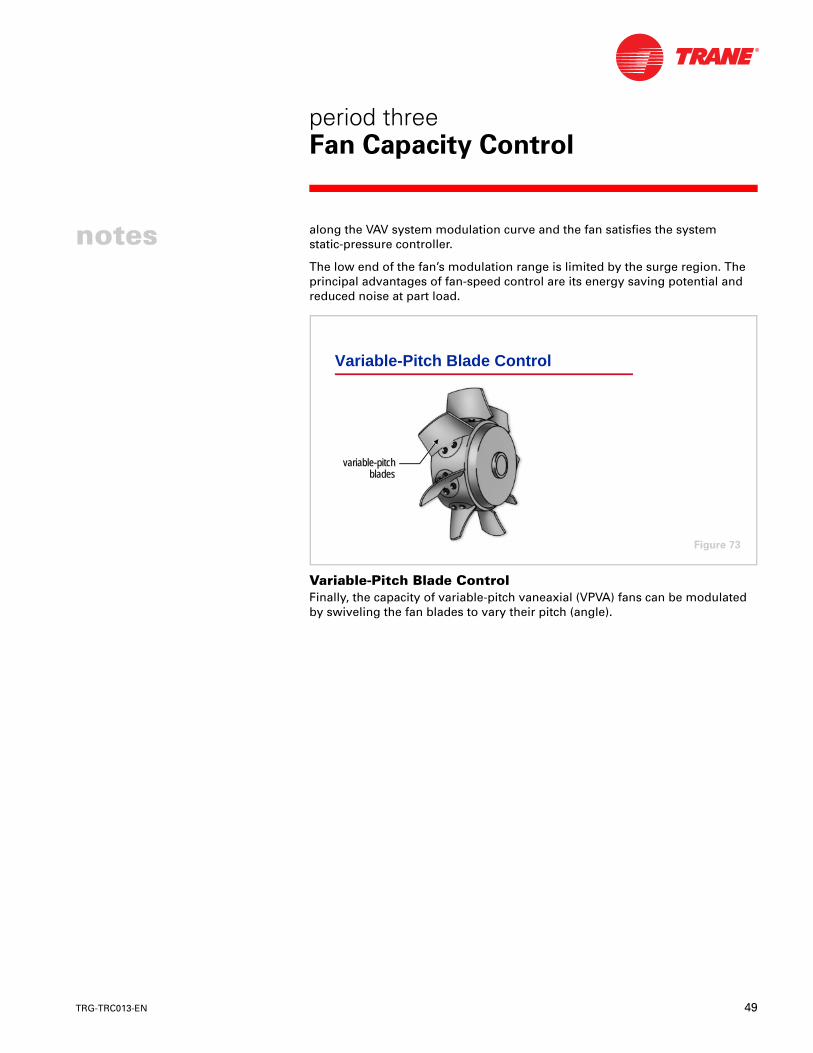
Variable-Pitch Blade ControlFinally, the capacity of variable-pitch vaneaxial (VPVA) fans can be modulated by swiveling the fan blades to vary their pitch (angle).
Variable-Pitch Blade Control
variable-pitchvariable-pitchbladesblades
Figure 73
50 TRG-TRC013-EN
notes
period threeFan Capacity Control
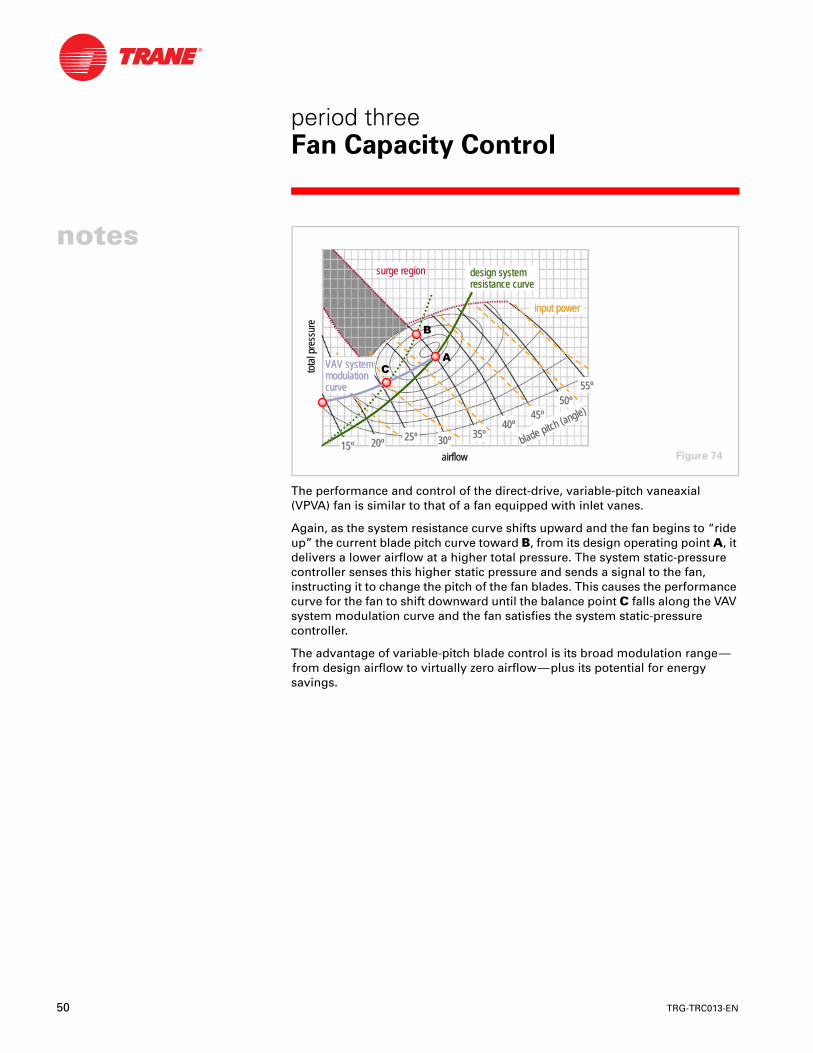
The performance and control of the direct-drive, variable-pitch vaneaxial (VPVA) fan is similar to that of a fan equipped with inlet vanes.
Again, as the system resistance curve shifts upward and the fan begins to “ride up” the current blade pitch curve toward B, from its design operating point A, it delivers a lower airflow at a higher total pressure. The system static-pressure controller senses this higher static pressure and sends a signal to the fan, instructing it to change the pitch of the fan blades. This causes the performance curve for the fan to shift downward until the balance point C falls along the VAV system modulation curve and the fan satisfies the system static-pressure controller.
The advantage of variable-pitch blade control is its broad modulation range—from design airflow to virtually zero airflow—plus its potential for energy savings.
airflowairflow
tota
l pre
ssur
eto
tal p
ress
ure
blade pitch (angle)
blade pitch (angle)
surge regionsurge region design systemdesign systemresistance curveresistance curve
&$
input powerinput power
%
50º50º
40º40º35º35º
30º30º20º20º15º15º
55º55º
45º45º
25º25º
VAV systemVAV systemmodulationmodulationcurvecurve
Figure 74
TRG-TRC013-EN 51
period threeFan Capacity Control
notes
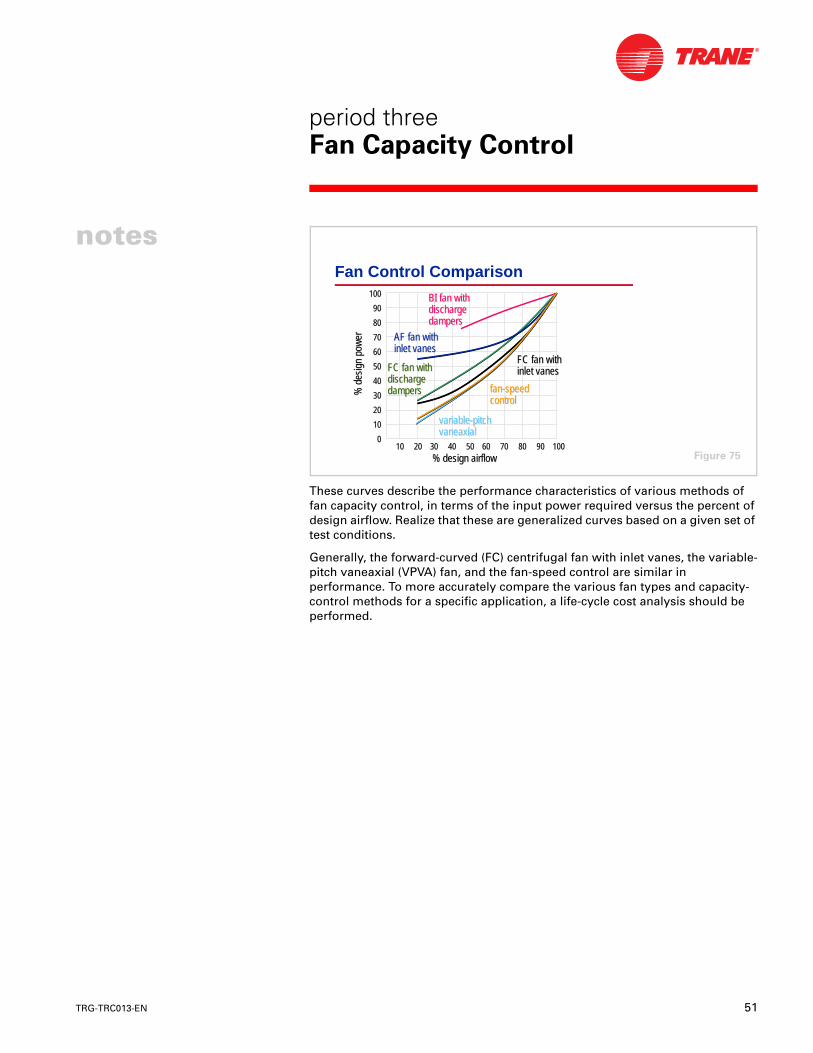
These curves describe the performance characteristics of various methods of fan capacity control, in terms of the input power required versus the percent of design airflow. Realize that these are generalized curves based on a given set of test conditions.
Generally, the forward-curved (FC) centrifugal fan with inlet vanes, the variable-pitch vaneaxial (VPVA) fan, and the fan-speed control are similar in performance. To more accurately compare the various fan types and capacity-control methods for a specific application, a life-cycle cost analysis should be performed.
Fan Control Comparison100100
9090
8080
7070
6060
5050
4040
3030
2020
1010
001010 20 20 30 30 40 40 50 50 60 60 70 70 80 90 100 80 90 100
BI fan withBI fan withdischargedischargedampersdampers
AF fan withAF fan withinlet vanesinlet vanes
FC fan withFC fan withdischargedischargedampersdampers
FC fan withFC fan withinlet vanesinlet vanes
fan-speedfan-speedcontrolcontrol
% design airflow% design airflow
% d
esig
n po
wer
% d
esig
n po
wer
variable-pitchvariable-pitchvaneaxialvaneaxial
Figure 75
52 TRG-TRC013-EN
notes
period fourApplication Considerations
Several considerations must be addressed when applying fans in air conditioning systems, including:
■ System static-pressure control
■ System effect
■ Acoustics
■ Effect of actual (nonstandard) conditions on fan selection
■ Equipment certification standards
While not all-inclusive, this list of considerations does represent some of the key issues.
Air Conditioning Fans
period four
Figure 76
TRG-TRC013-EN 53
period fourApplication Considerations
notes
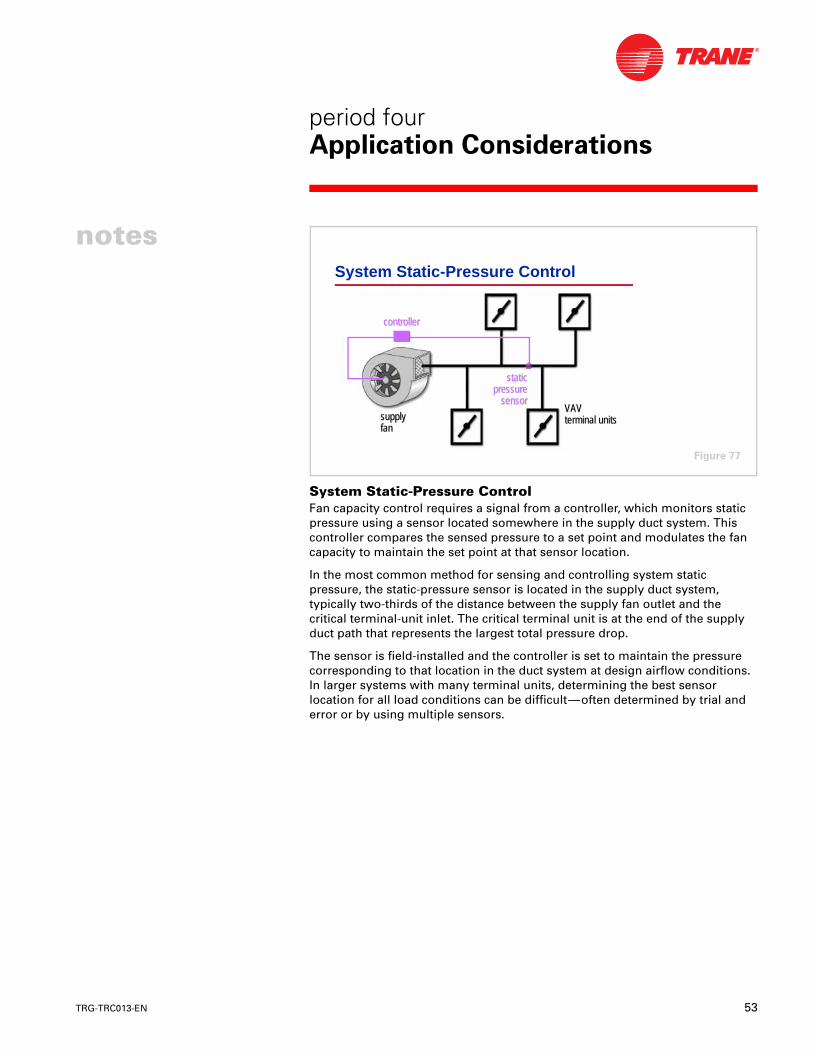
System Static-Pressure ControlFan capacity control requires a signal from a controller, which monitors static pressure using a sensor located somewhere in the supply duct system. This controller compares the sensed pressure to a set point and modulates the fan capacity to maintain the set point at that sensor location.
In the most common method for sensing and controlling system static pressure, the static-pressure sensor is located in the supply duct system, typically two-thirds of the distance between the supply fan outlet and the critical terminal-unit inlet. The critical terminal unit is at the end of the supply duct path that represents the largest total pressure drop.
The sensor is field-installed and the controller is set to maintain the pressure corresponding to that location in the duct system at design airflow conditions. In larger systems with many terminal units, determining the best sensor location for all load conditions can be difficult—often determined by trial and error or by using multiple sensors.
System Static-Pressure Control
VAVVAVterminal unitsterminal unitssupplysupply
fanfan
staticstaticpressurepressure
sensorsensor
controllercontroller
Figure 77
54 TRG-TRC013-EN
notes
period fourApplication Considerations
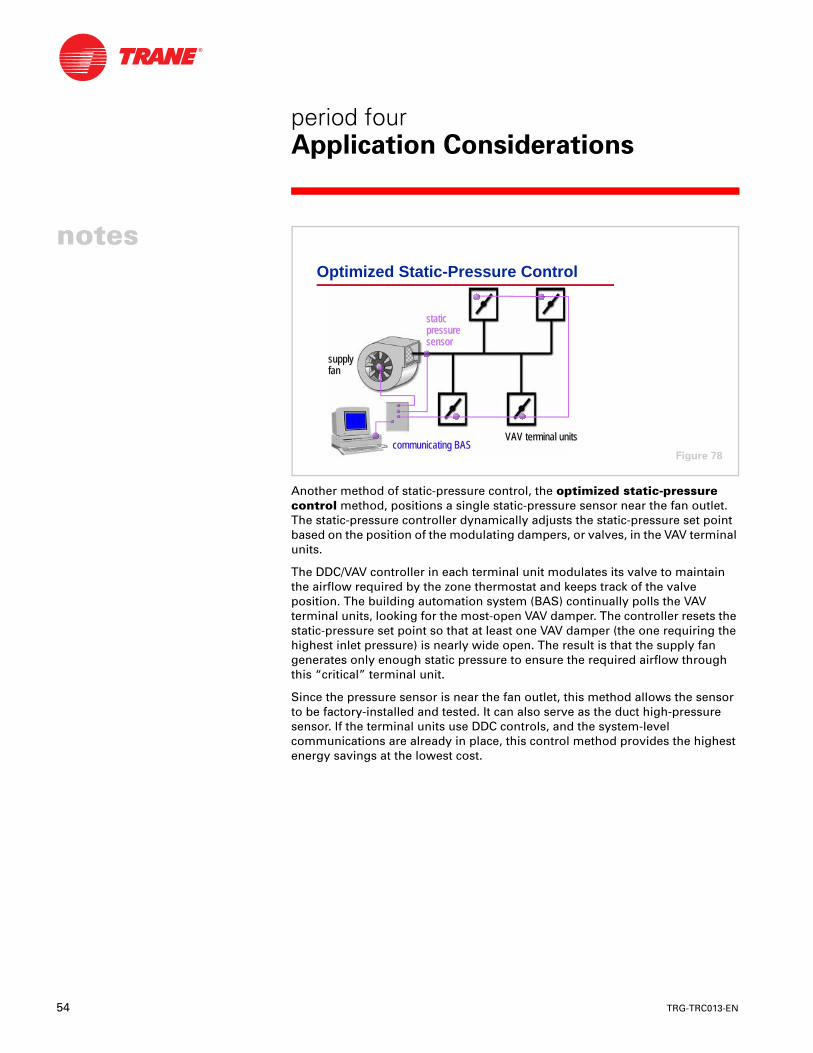
Another method of static-pressure control, the optimized static-pressure control method, positions a single static-pressure sensor near the fan outlet. The static-pressure controller dynamically adjusts the static-pressure set point based on the position of the modulating dampers, or valves, in the VAV terminal units.
The DDC/VAV controller in each terminal unit modulates its valve to maintain the airflow required by the zone thermostat and keeps track of the valve position. The building automation system (BAS) continually polls the VAV terminal units, looking for the most-open VAV damper. The controller resets the static-pressure set point so that at least one VAV damper (the one requiring the highest inlet pressure) is nearly wide open. The result is that the supply fan generates only enough static pressure to ensure the required airflow through this “critical” terminal unit.
Since the pressure sensor is near the fan outlet, this method allows the sensor to be factory-installed and tested. It can also serve as the duct high-pressure sensor. If the terminal units use DDC controls, and the system-level communications are already in place, this control method provides the highest energy savings at the lowest cost.
Optimized Static-Pressure Control
staticstaticpressurepressuresensorsensor
communicating BAScommunicating BAS
supplysupplyfanfan
VAV terminal unitsVAV terminal units
Figure 78
TRG-TRC013-EN 55
period fourApplication Considerations
notes
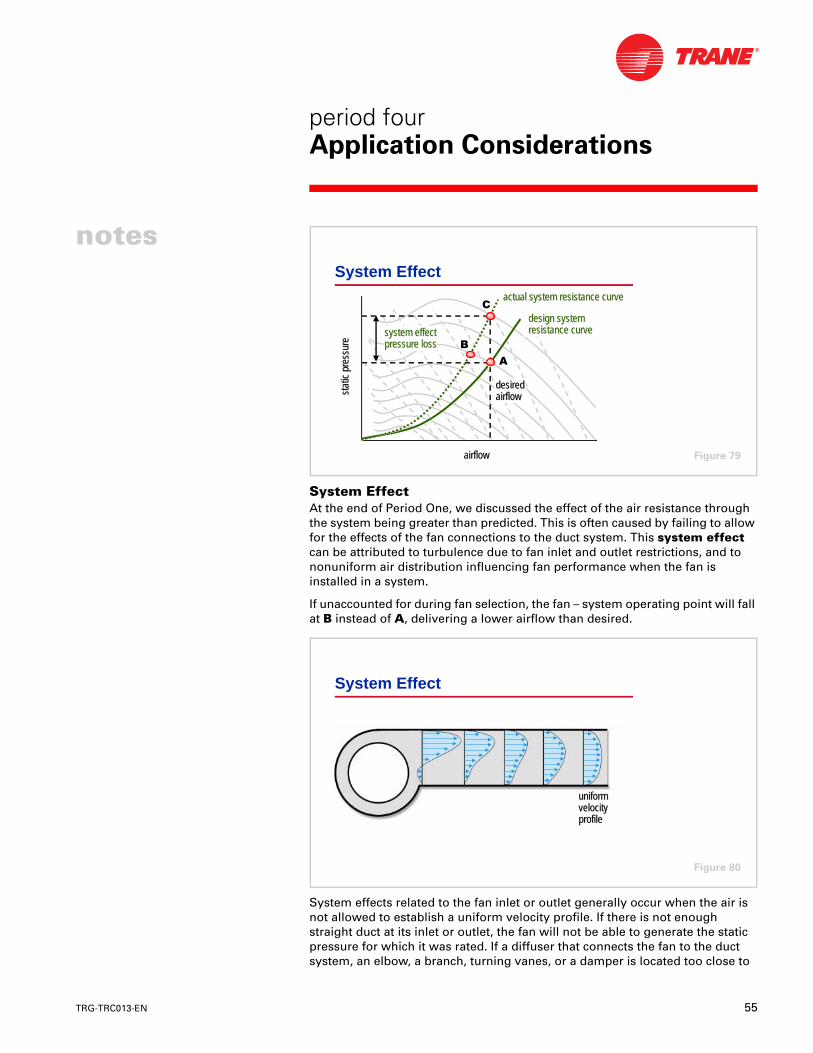
System EffectAt the end of Period One, we discussed the effect of the air resistance through the system being greater than predicted. This is often caused by failing to allow for the effects of the fan connections to the duct system. This system effect can be attributed to turbulence due to fan inlet and outlet restrictions, and to nonuniform air distribution influencing fan performance when the fan is installed in a system.
If unaccounted for during fan selection, the fan – system operating point will fall at B instead of A, delivering a lower airflow than desired.
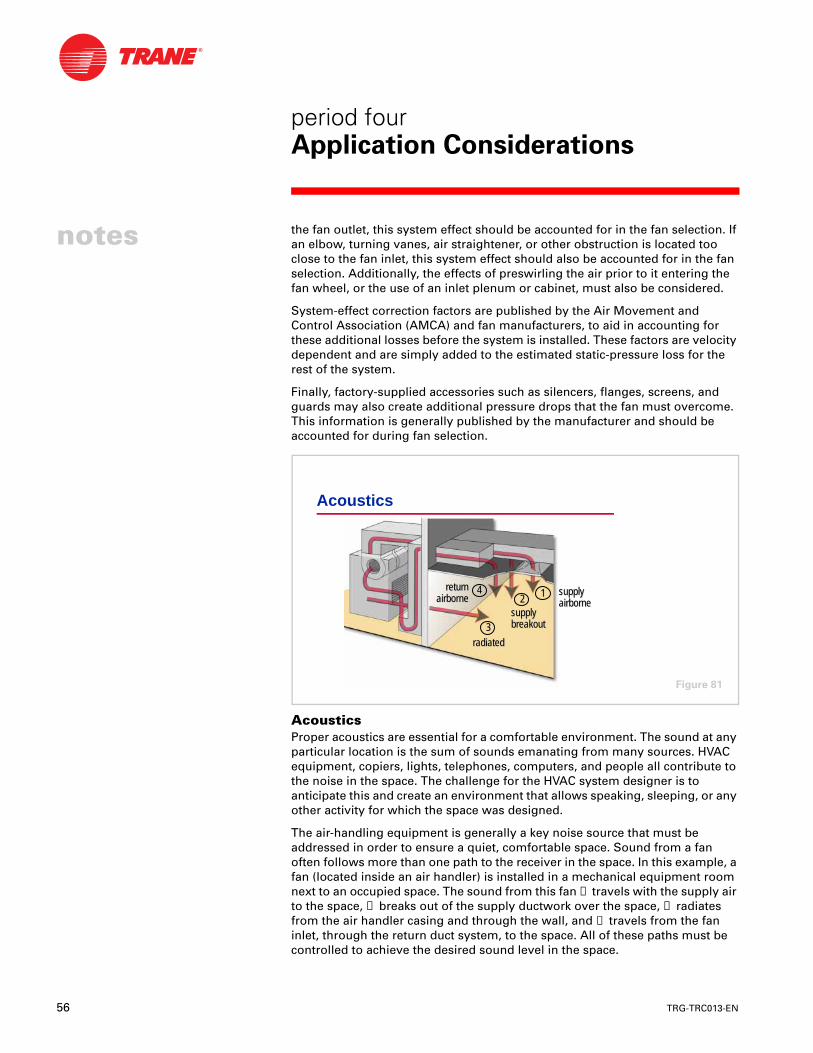
System effects related to the fan inlet or outlet generally occur when the air is not allowed to establish a uniform velocity profile. If there is not enough straight duct at its inlet or outlet, the fan will not be able to generate the static pressure for which it was rated. If a diffuser that connects the fan to the duct system, an elbow, a branch, turning vanes, or a damper is located too close to
System Effect
airflowairflow
stat
ic p
ress
ure
stat
ic p
ress
ure
design systemresistance curvedesign systemdesign systemresistance curveresistance curve
actual system resistance curveactual system resistance curveactual system resistance curve
system effectpressure losssystem effectsystem effectpressure losspressure loss
desireddesiredairflowairflow
&
$
%
Figure 79
System Effect
uniformuniformvelocityvelocityprofileprofile
Figure 80
56 TRG-TRC013-EN
notes
period fourApplication Considerations
the fan outlet, this system effect should be accounted for in the fan selection. If an elbow, turning vanes, air straightener, or other obstruction is located too close to the fan inlet, this system effect should also be accounted for in the fan selection. Additionally, the effects of preswirling the air prior to it entering the fan wheel, or the use of an inlet plenum or cabinet, must also be considered.
System-effect correction factors are published by the Air Movement and Control Association (AMCA) and fan manufacturers, to aid in accounting for these additional losses before the system is installed. These factors are velocity dependent and are simply added to the estimated static-pressure loss for the rest of the system.
Finally, factory-supplied accessories such as silencers, flanges, screens, and guards may also create additional pressure drops that the fan must overcome. This information is generally published by the manufacturer and should be accounted for during fan selection.
AcousticsProper acoustics are essential for a comfortable environment. The sound at any particular location is the sum of sounds emanating from many sources. HVAC equipment, copiers, lights, telephones, computers, and people all contribute to the noise in the space. The challenge for the HVAC system designer is to anticipate this and create an environment that allows speaking, sleeping, or any other activity for which the space was designed.
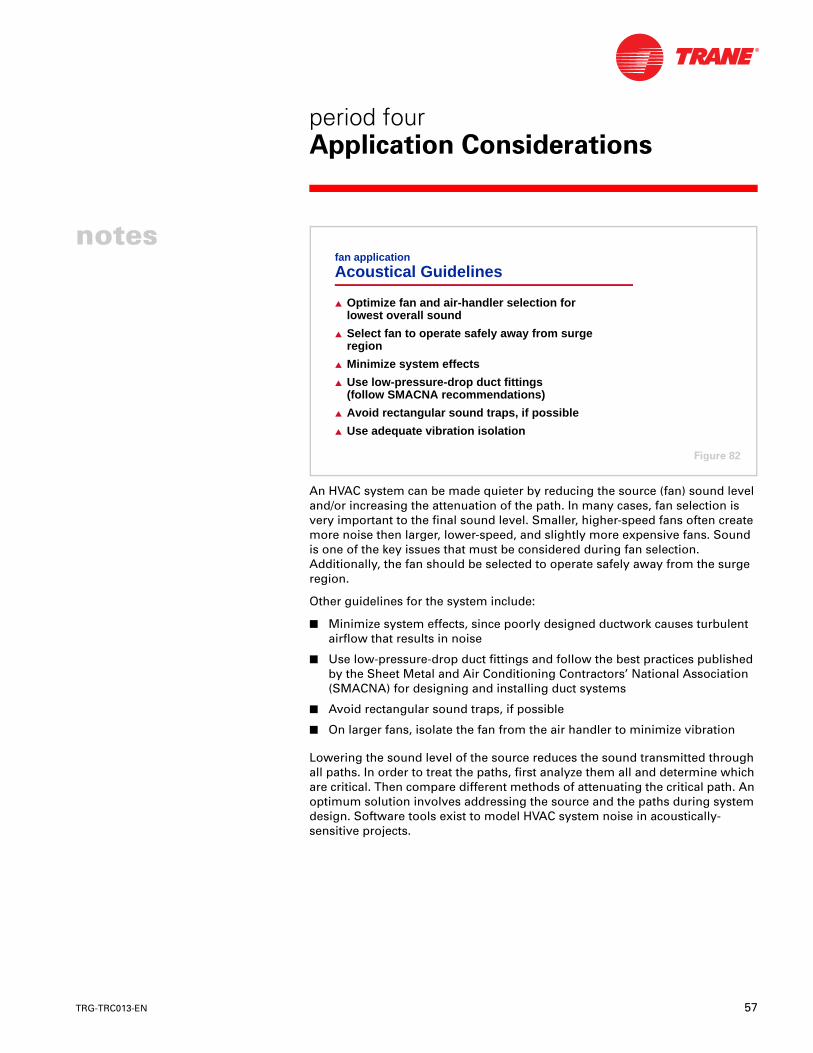
The air-handling equipment is generally a key noise source that must be addressed in order to ensure a quiet, comfortable space. Sound from a fan often follows more than one path to the receiver in the space. In this example, a fan (located inside an air handler) is installed in a mechanical equipment room next to an occupied space. The sound from this fan ➀ travels with the supply air to the space, ➁ breaks out of the supply ductwork over the space, ➂ radiates from the air handler casing and through the wall, and ➃ travels from the fan inlet, through the return duct system, to the space. All of these paths must be controlled to achieve the desired sound level in the space.
Acoustics
radiatedradiated
returnreturnairborneairborne
supplysupplyairborneairborne
supplysupplybreakoutbreakout
1122
33
44
Figure 81
TRG-TRC013-EN 57
period fourApplication Considerations
notes
An HVAC system can be made quieter by reducing the source (fan) sound level and/or increasing the attenuation of the path. In many cases, fan selection is very important to the final sound level. Smaller, higher-speed fans often create more noise then larger, lower-speed, and slightly more expensive fans. Sound is one of the key issues that must be considered during fan selection. Additionally, the fan should be selected to operate safely away from the surge region.
Other guidelines for the system include:
■ Minimize system effects, since poorly designed ductwork causes turbulent airflow that results in noise
■ Use low-pressure-drop duct fittings and follow the best practices published by the Sheet Metal and Air Conditioning Contractors’ National Association (SMACNA) for designing and installing duct systems
■ Avoid rectangular sound traps, if possible
■ On larger fans, isolate the fan from the air handler to minimize vibration
Lowering the sound level of the source reduces the sound transmitted through all paths. In order to treat the paths, first analyze them all and determine which are critical. Then compare different methods of attenuating the critical path. An optimum solution involves addressing the source and the paths during system design. Software tools exist to model HVAC system noise in acoustically-sensitive projects.
fan application
Acoustical Guidelines
▲ Optimize fan and air-handler selection forlowest overall sound
▲ Select fan to operate safely away from surgeregion
▲ Minimize system effects
▲ Use low-pressure-drop duct fittings (follow SMACNA recommendations)
▲ Avoid rectangular sound traps, if possible
▲ Use adequate vibration isolation
Figure 82
58 TRG-TRC013-EN
notes
period fourApplication Considerations
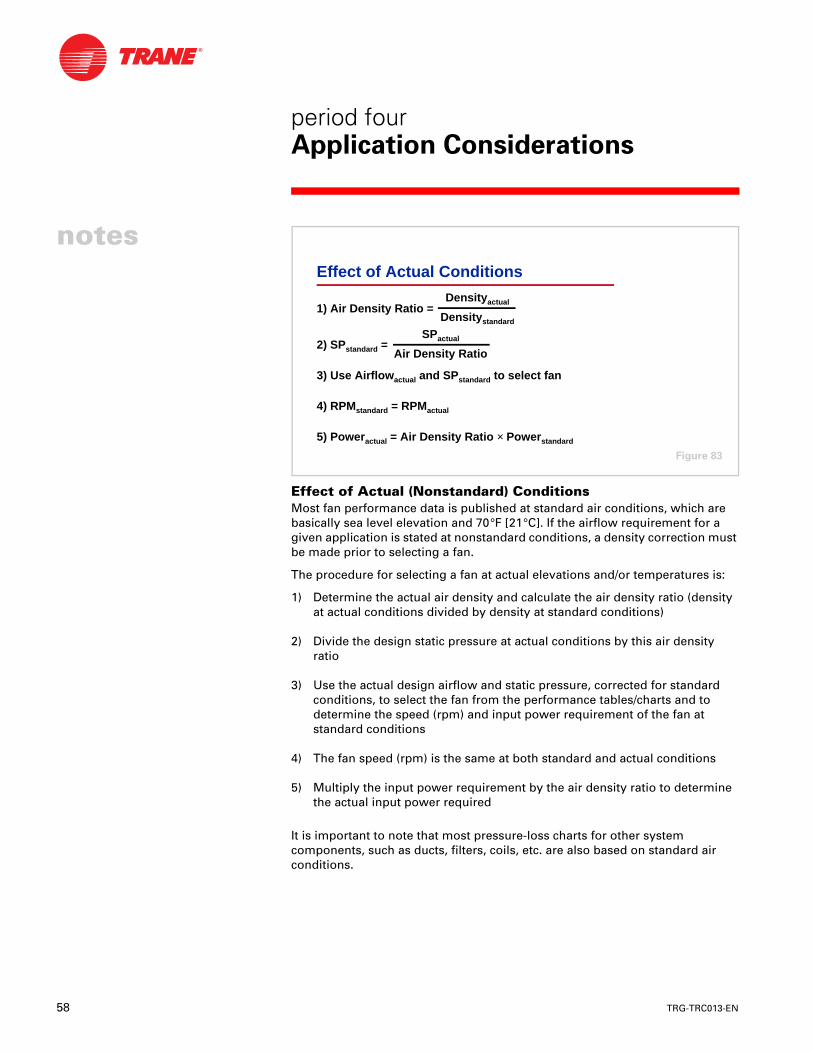
Effect of Actual (Nonstandard) ConditionsMost fan performance data is published at standard air conditions, which are basically sea level elevation and 70°F [21°C]. If the airflow requirement for a given application is stated at nonstandard conditions, a density correction must be made prior to selecting a fan.
The procedure for selecting a fan at actual elevations and/or temperatures is:
1) Determine the actual air density and calculate the air density ratio (density at actual conditions divided by density at standard conditions)
2) Divide the design static pressure at actual conditions by this air density ratio
3) Use the actual design airflow and static pressure, corrected for standard conditions, to select the fan from the performance tables/charts and to determine the speed (rpm) and input power requirement of the fan at standard conditions
4) The fan speed (rpm) is the same at both standard and actual conditions
5) Multiply the input power requirement by the air density ratio to determine the actual input power required
It is important to note that most pressure-loss charts for other system components, such as ducts, filters, coils, etc. are also based on standard air conditions.
Effect of Actual Conditions
1) Air Density Ratio =
2) SPstandard =
3) Use Airflowactual and SPstandard to select fan
4) RPMstandard = RPMactual
5) Poweractual = Air Density Ratio × Powerstandard
Densityactual
Densitystandard
SPactual
Air Density Ratio
Figure 83
TRG-TRC013-EN 59
period fourApplication Considerations
notes
Equipment Certification StandardsThe Air Movement and Control Association (AMCA) establishes testing procedures and rating standards for air-moving devices. AMCA also certifies performance and labels equipment through programs that involve random testing of a manufacturer’s equipment to verify published performance.
The overall objective of AMCA Standard 210 (also known as ASHRAE Standard 51), titled “Laboratory Methods of Testing Fans for Rating,” is to promote consistent testing methods for fans, blowers, exhausters, and some types of air compressors.
The Air-Conditioning & Refrigeration Institute (ARI) has similar standards for fans that are a part of equipment such as fan coils, central-station air handlers, unit ventilators, and water-source heat pumps. These standards, such as ARI Standard 430 for central-station air handlers, account for the effects of the air handler casing around the fan and establish rating, testing, and certification standards for equipment manufacturers.
Equipment Certification Standards
▲ Purpose◆ Establish methods for
laboratory testing of airmoving devices
Figure 84
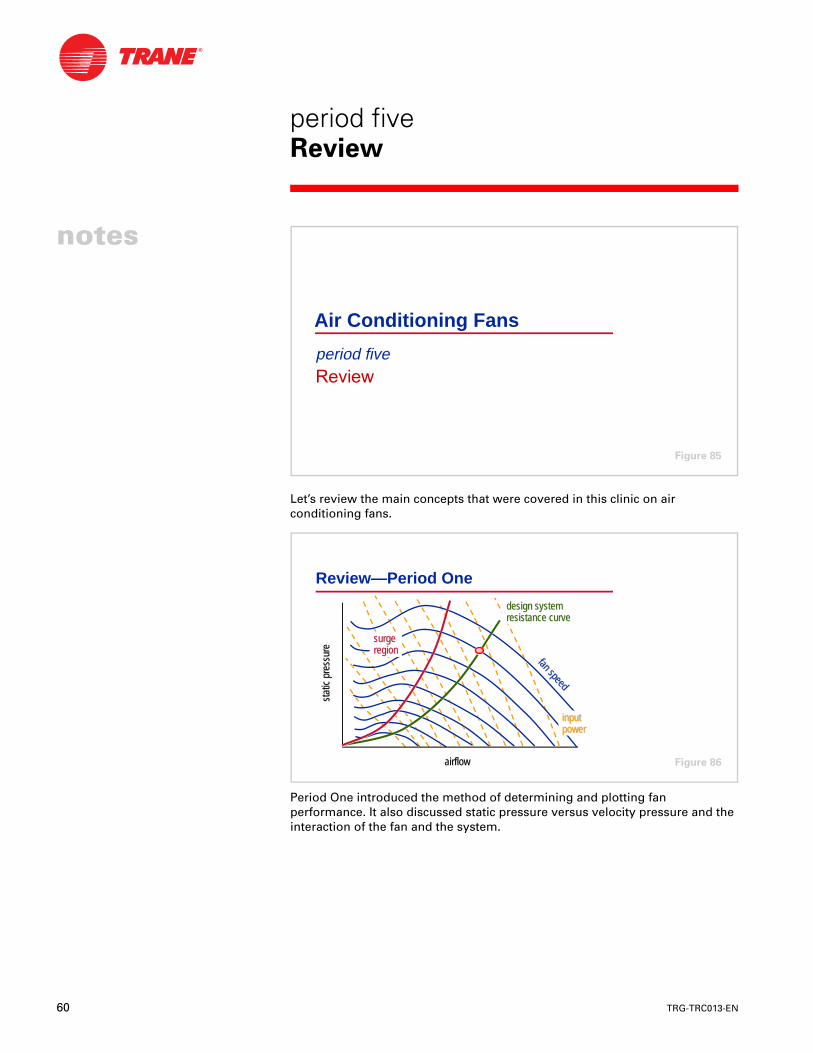
60 TRG-TRC013-EN
notes
Let’s review the main concepts that were covered in this clinic on air conditioning fans.
Period One introduced the method of determining and plotting fan performance. It also discussed static pressure versus velocity pressure and the interaction of the fan and the system.
Air Conditioning Fans
period five
Figure 85
Review—Period One
airflowairflow
stat
ic p
ress
ure
stat
ic p
ress
ure
surgeregionsurgesurgeregionregion
design systemresistance curvedesign systemdesign systemresistance curveresistance curve
fan speed
fan speed
inputinputpowerpower
Figure 86
period fiveReview
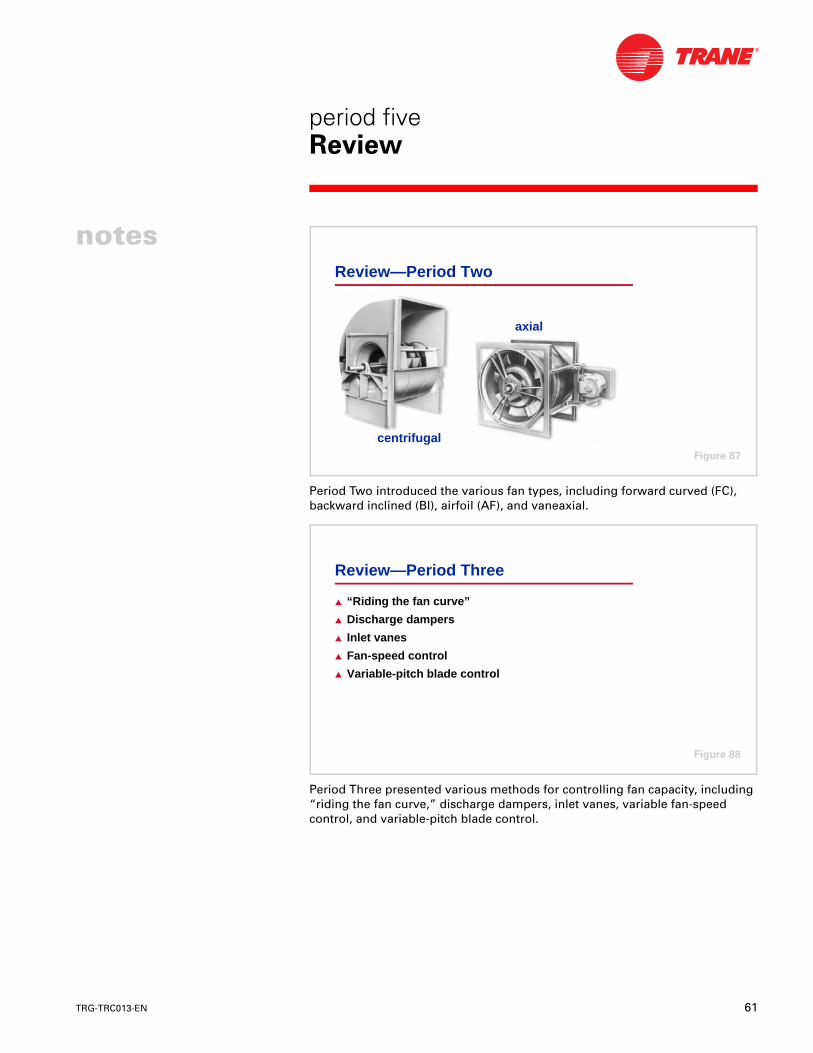
TRG-TRC013-EN 61
period fiveReview
notes
Period Two introduced the various fan types, including forward curved (FC), backward inclined (BI), airfoil (AF), and vaneaxial.
Period Three presented various methods for controlling fan capacity, including “riding the fan curve,” discharge dampers, inlet vanes, variable fan-speed control, and variable-pitch blade control.
Review—Period Two
centrifugal
axial
Figure 87
Review—Period Three
▲ “Riding the fan curve”
▲ Discharge dampers
▲ Inlet vanes
▲ Fan-speed control
▲ Variable-pitch blade control
Figure 88
62 TRG-TRC013-EN
notes
period fiveReview
Period Four covered several considerations in the application of fans in air conditioning systems, including system static-pressure control, system effect, acoustics, the effect of actual (nonstandard) conditions on fan selection, and equipment certification standards.
Review—Period Four
▲ Application considerations◆ System static-pressure control
◆ System effect
◆ Acoustics
◆ Effect of actual (nonstandard) conditions on fanselection
◆ Equipment certification standards
Figure 89
TRG-TRC013-EN 63
period fiveReview
notes
For more information, refer to the following references:
■ Fans and their Application in Air Conditioning (Trane literature order number ED-FAN)
■ Trane Air Conditioning Manual
■ “VAV System Optimization” (Trane Engineers Newsletter, 1991–volume 20,number 2)
■ “Specifying ‘Quality Sound’” (Trane Engineers Newsletter, 1996–volume 25, number 3)
■ Acoustics in Air Conditioning Applications Engineering Manual (Trane literature order number FND-AM-5)
■ ASHRAE Handbook—Systems and Equipment
■ AMCA Fan Application Manual (publications 200, 201, 202, and 203)
■ SMACNA HVAC Systems Duct Design
The World Wide Web is another helpful resource. Sites to visit include:
the ASHRAE Bookstore at www.ashrae.org.
the AMCA Web site at www.amca.org.
the SMACNA Web site at www.smacna.org.
For information on additional educational materials available from Trane, contact your local Trane sales office (request a copy of the Educational Materials price sheet — Trane order number EM-ADV1) or visit our online bookstore at www.trane.com/bookstore/.
Figure 90
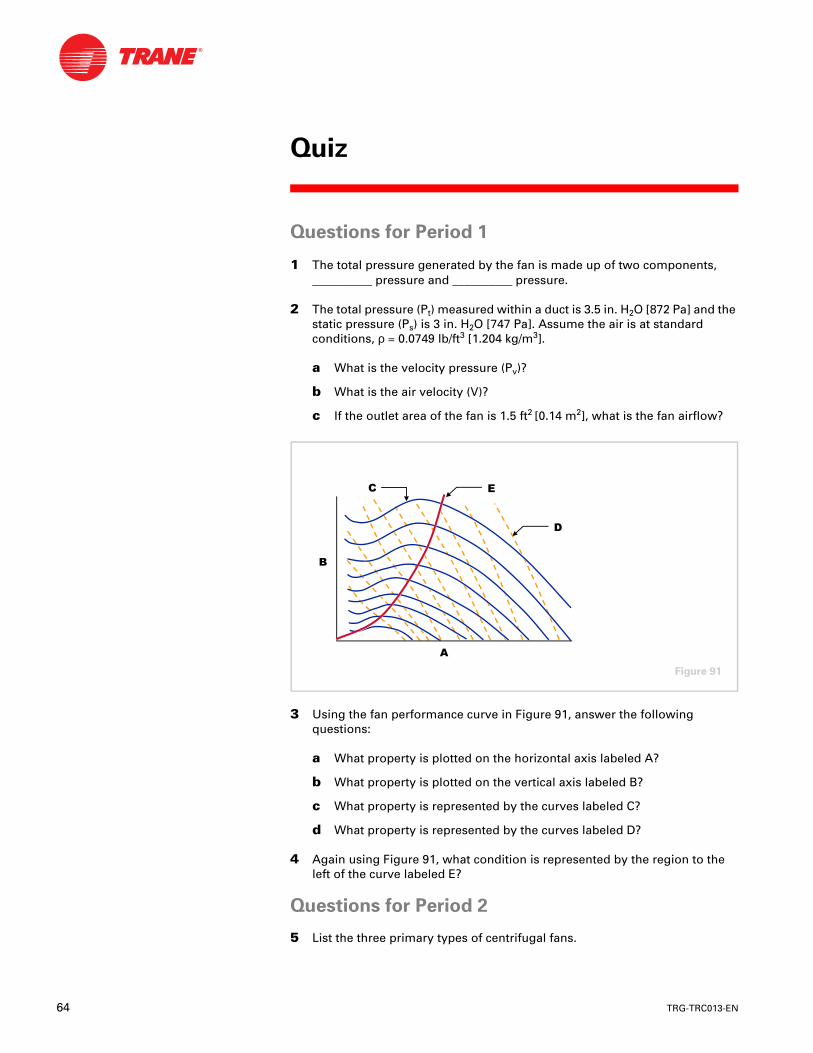
64 TRG-TRC013-EN
Questions for Period 1
1 The total pressure generated by the fan is made up of two components, __________ pressure and __________ pressure.
2 The total pressure (Pt) measured within a duct is 3.5 in. H2O [872 Pa] and the static pressure (Ps) is 3 in. H2O [747 Pa]. Assume the air is at standard conditions, ρ = 0.0749 lb/ft3 [1.204 kg/m3].
a What is the velocity pressure (Pv)?
b What is the air velocity (V)?
c If the outlet area of the fan is 1.5 ft2 [0.14 m2], what is the fan airflow?
3 Using the fan performance curve in Figure 91, answer the following questions:
a What property is plotted on the horizontal axis labeled A?
b What property is plotted on the vertical axis labeled B?
c What property is represented by the curves labeled C?
d What property is represented by the curves labeled D?
4 Again using Figure 91, what condition is represented by the region to the left of the curve labeled E?
Questions for Period 2
5 List the three primary types of centrifugal fans.
$
%
&
'
(
Figure 91
Quiz
TRG-TRC013-EN 65
Quiz
6 Between the forward curved (FC) and backward inclined (BI) fans, which one can handle higher static-pressure applications?
7 Explain why the forward curved (FC) fan is called an overloading type of fan.
Questions for Period 3
8 List three methods of fan capacity control.
9 What method of fan capacity control “preswirls” the air in the direction of fan rotation before it enters the fan wheel?
10 How is the capacity of a variable-pitch vaneaxial (VPVA) fan controlled?
Questions for Period 4
11 List two possible causes of system effect.
12 What document establishes laboratory testing methods for air-moving devices?
66 TRG-TRC013-EN
1 velocity pressure and static pressure
2 a Pv = 0.5 in. H2O [125 Pa]
b V = 2,832 fpm [14.4 m/s]
c Airflow = 4,248 cfm [2 m3/s]
3 a airflow
b static pressure
c fan speed (rpm)
d input power
4 surge
5 forward curved (FC), backward inclined (BI) or backward curved (BC), and airfoil (AF) or plug (plenum)
6 backward inclined (BI)
7 As the fan airflow increases, the nature of the fan’s input power curves causes the fan’s power requirement to also increase, possibly overloading the motor.
8 “riding the fan curve,” discharge dampers, inlet vanes, fan-speed control, and variable-pitch blade control
9 inlet vanes
10 By adjusting (swiveling) the pitch of the fan blades.
11 Here are five possible causes:1 Not enough straight duct at the fan inlet or outlet to ensure a uniform velocity profile2 A diffuser that connects the fan to the duct system, an elbow, a branch, turning vanes, or a damper located too close to the fan outlet3 An elbow, turning vanes, air straightener, or other obstruction located too close to the fan inlet4 Preswirling the air prior to it entering the fan wheel5 Use of an inlet plenum or cabinet
12 AMCA Standard 210 (also known as ASHRAE Standard 51), titled “Laboratory Methods of Testing Fans for Rating”
Answers
TRG-TRC013-EN 67
adjustable-frequency drive (AFD) See variable-speed drive.
airfoil (AF) A type of centrifugal fan that is similar to the backward inclined fan, with the exception that the fan blades are in the shape of an airfoil, like an airplane wing.
AMCA Air Movement and Control Association
ARI Air-Conditioning & Refrigeration Institute
ASHRAE American Society of Heating, Refrigerating and Air-Conditioning Engineers
attenuation The process in which sound energy is absorbed or otherwise diminished in intensity.
axial fan A type of fan where the air passes straight through the fan, parallel to the shaft.
backward curved (BC) A type of centrifugal fan with blades that are curved away from the direction of wheel rotation.
backward inclined (BI) A type of centrifugal fan with flat blades that are slanted away from the direction of wheel rotation.
BAS Building automation system
blocked-tight static pressure The point on the fan performance curve where there is no airflow: only static pressure is being generated by the fan.
centrifugal fan A type of fan where the air enters the center of the fan from the side and follows a radial path through the fan wheel.
constant-volume system A type of air conditioning system that varies the temperature of a constant volume of air supplied to meet the changing load conditions of the space.
DDC Direct digital control: a method of unit control using a microprocessor that enables digital communication between the unit controller and a central building automation system.
discharge damper A device used to control the capacity of a fan by creating a static-pressure drop in the system, just downstream of the fan.
dynamometer A device used to measure the power applied to the fan shaft.
VAV system modulation curve A curve that illustrates the VAV system fan’s static-pressure requirement over the range of airflows.
fan performance curve A plot of a specific fan’s airflow capacity at a given speed (rpm) versus the pressure it generates.
Glossary
68 TRG-TRC013-EN
Glossary
fan-speed control A method of controlling fan capacity by varying its speed of rotation—commonly accomplished using a variable-speed drive on the fan motor.
forward curved (FC) A type of centrifugal fan with blades curved in the direction of wheel rotation.
inlet vanes A device used to control the capacity of a fan by “preswirling” the air in the direction of fan wheel rotation before it enters the wheel, lessening its ability to “bite” the air and reducing its airflow capacity.
manometer A device used to measure small pressures within a duct system.
optimized static-pressure control An optimized method of VAV system static-pressure control that uses the benefits of DDC control to continuously reset the static-pressure set point of the system, so that the VAV terminal requiring the highest inlet pressure is nearly wide open.
plenum fan See plug fan.
plug fan A type of centrifugal fan; it consists of an unhoused fan wheel with airfoil fan blades and an inlet cone that pressurizes the plenum surrounding the fan, allowing the air to discharge in multiple directions.
“riding the fan curve” A method of fan capacity modulation that involves no direct form of control, but simply allows the fan to react to the change in system static pressure and “ride” up and down its performance curve.
propeller fan A type of axial fan that is well suited for high volumes of air, but which has little or no static-pressure generating capability.
SMACNA Sheet Metal and Air Conditioning Contractors’ National Association
sound trap A device installed in an air duct system to control discharge air noise.
static efficiency The percentage of input power that is realized as useful work in terms of static energy (pressure).
static pressure Pressure due to the perpendicular outward “push” of the air against the duct walls.
surge A condition of unstable fan operation where the air alternately flows backward and forward through the fan wheel, generating noise and vibration.
system effect Turbulence due to fan inlet and outlet restrictions, where the air is not allowed to establish a uniform velocity profile, influencing fan performance.
system resistance curve A curve representing the pressure that the system (including the supply ductwork, duct fittings, terminal units, supply diffusers, return grilles, coils, filters, dampers, etc.) creates over a range of airflows.
TRG-TRC013-EN 69
Glossary
notes total efficiency The percentage of input power that is realized as useful work in terms of total energy (pressure).
total pressure Sum of the velocity pressure plus static pressure.
tubeaxial fan A type of axial fan consisting of a propeller fan mounted in a cylinder.
vaneaxial fan A type of axial fan with vane-type straighteners on the outlet to improve efficiency and reduce turbulence and generated noise.
variable-pitch blade control A method of vaneaxial fan capacity control achieved by adjusting the pitch of the fan blades.
variable-air-volume (VAV) system A type of air conditioning system that varies the volume of constant-temperature air supplied to meet the changing load conditions of the space.
variable-pitch vaneaxial (VPVA) fan A type of vaneaxial fan that adjusts the pitch (angle) of its blades to match the airflow and pressure requirements of the system.
variable-speed drive A device used to control the capacity of a fan by varying the speed of the motor that rotates the fan wheel.
VAV terminal unit A sheet metal assembly installed upstream of the space to vary the quantity of air delivered to the conditioned space.
velocity pressure Pressure due to the axial movement of the air through the duct.
wide-open airflow The point on the fan performance curve where the system offers no resistance to airflow. The pressure generated by the fan is velocity pressure only—the static pressure is negligible.
The Trane CompanyWorldwide Applied Systems Group3600 Pammel Creek RoadLa Crosse, WI 54601-7599www.trane.com
An American Standard Company
Literature Order Number TRG-TRC013-EN
File Number E/AV-FND-TRG-TRC013-1099-EN
Supersedes 2803-9-285
Stocking Location Inland-La Crosse
Since The Trane Company has a policy of continuous product improvement, it reserves the right to change design and specifications without notice.
85667_Cvr.fm Page 2 Friday, October 8, 1999 10:05 AM