Embed Size (px)
Citation preview
Catalogue no. 51-203-X
Air Carrier Traffic atCanadian Airports
2015
How to obtain more information
For information about this product or the wide range of services and data available from Statistics Canada, visit our website,www.statcan.gc.ca.
You can also contact us by
e-mail at [email protected]
telephone, from Monday to Friday, 8:30 a.m. to 4:30 p.m., at the following toll-free numbers:• Statistical Information Service 1-800-263-1136• National telecommunications device for the hearing impaired 1-800-363-7629• Fax line 1-877-287-4369
Depository Services Program• Inquiries line 1-800-635-7943• Fax line 1-800-565-7757
To access this product
This product, Catalogue no. 51-203-X, is available free in electronic format. To obtain a single issue, visit our website,www.statcan.gc.ca and browse by “Key resource” > “Publications.”
Standards of service to the public
Statistics Canada is committed to serving its clients in a prompt, reliable and courteous manner. To this end, this agencyhas developed standards of service that its employees observe. To obtain a copy of these service standards, pleasecontact Statistics Canada toll-free at 1-800-263-1136. The service standards are also published at www.statcan.gc.ca under“Contact us” > “Standards of service to the public.”
Statistics CanadaEnvironment, Energy and Transportation Statistics Division
Air Carrier Traffic at CanadianAirports2015
Published by authority of the Minister responsible for Statistics Canada
© Minister of Industry, 2016
All rights reserved. Use of this publication is governed by the Statistics CanadaOpen License Agreement.
http://www.statcan.gc.ca/reference/licence-eng.html
July 2016
Catalogue no. 51-203-X
ISSN 1480-7505
Frequency: Annual
Ottawa
Cette publication est également disponible en français.
Note of appreciation
Canada owes the success of its statistical system to a long-standing partnership betweenStatistics Canada, the citizens of Canada, its businesses, governments and otherinstitutions. Accurate and timely statistical information could not be produced withouttheir continued cooperation and goodwill.
User information
Symbols
The following standard symbols are used in Statistics Canada publications:
. not available for any reference period
.. not available for a specific reference period
... not applicable
0 true zero or a value rounded to zero
0s value rounded to 0 (zero) where there is a meaningful distinction between true zero and the value that wasrounded
p preliminary
r revised
x suppressed to meet the confidentiality requirements of the Statistics Act
E use with caution
F too unreliable to be published
* significantly different from reference category (p < 0.05)
Acknowledgements
Statistics Canada would like to thank all of the respondents and data suppliers, as well as our colleagues at TransportCanada, whose participation has enabled us to provide the statistical information contained in this publication.
The information found in this publication could not have been produced if not for the cooperation of our respondentsand data suppliers.
This publication resulted from the efforts of Gwen Cromwell, Trever Bova, Mario Lisciotto and Julie Lepage of theAviation Statistics Centre (ASC) of the Environment, Energy and Transportation Statistics Division (EETSD) underthe general direction of Kevin Roberts, Director, EETSD, Michael Scrim, Assistant Director, EETSD and RobertLarmour, Chief, ASC.
2 Statistics Canada – Catalogue no. 51-203-X
Table of contents
Highlights 4
Introduction 6
Related products 7
Statistical tables
1 Passengers enplaned and deplaned on selected services 9
1-1 Top 50 airports 9
1-2 Top 50 airports by sector 10
1-3 By sector, by province and territory 11
2 Tonnes of cargo loaded and unloaded on major scheduled services and major charter services 12
2-1 Top 50 airports 12
2-2 Top 50 airports by sector 13
2-3 By sector, by province and territory 14
3 Top 50 airports according to arriving and departing flights for scheduled services and major charterservices — by passenger flights and by cargo flights 15
Data quality, concepts and methodology
Services offered by carriers - 2015 16
Methodology 24
Data quality and limitations 26
Factors which may have influenced the data 27
Appendix
I Glossary 28
Statistics Canada – Catalogue no. 51-203-X 3
Highlights
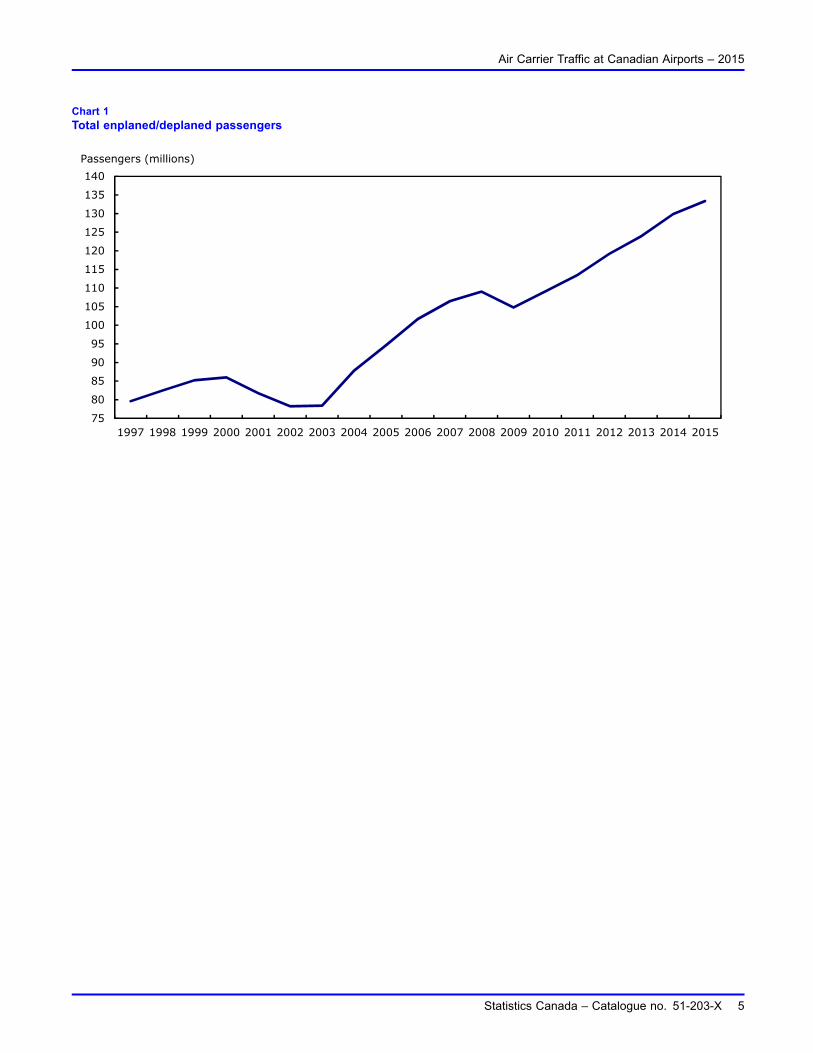
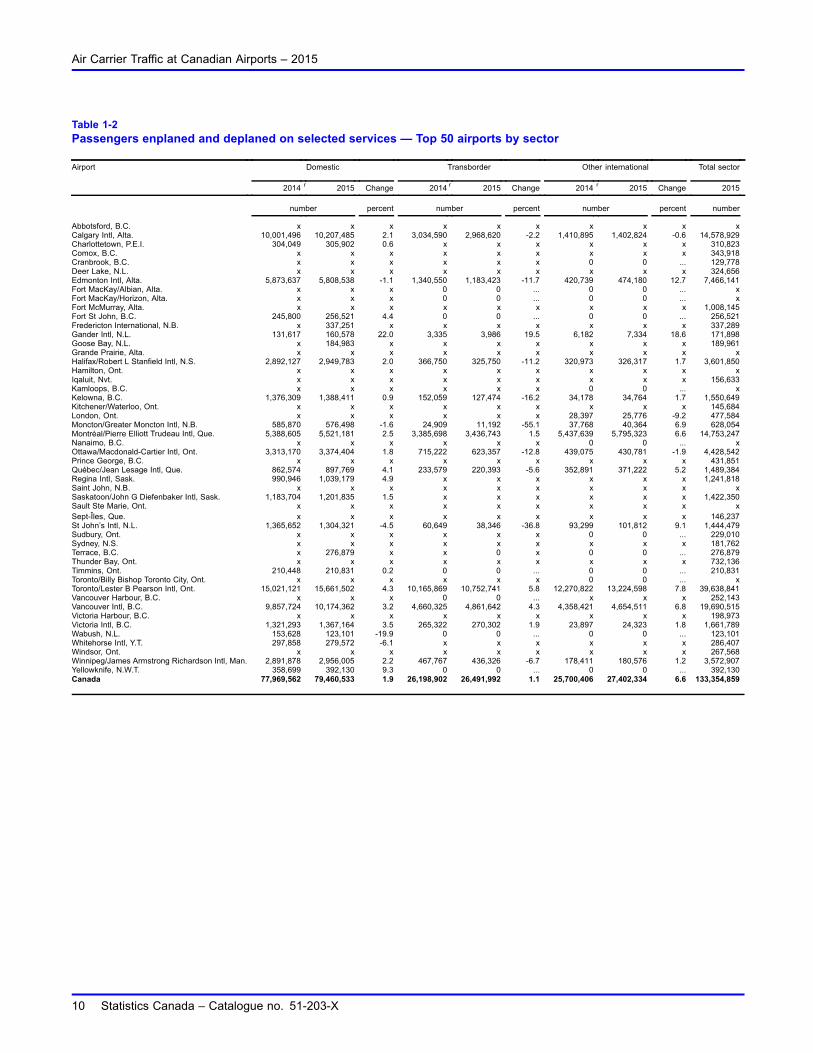
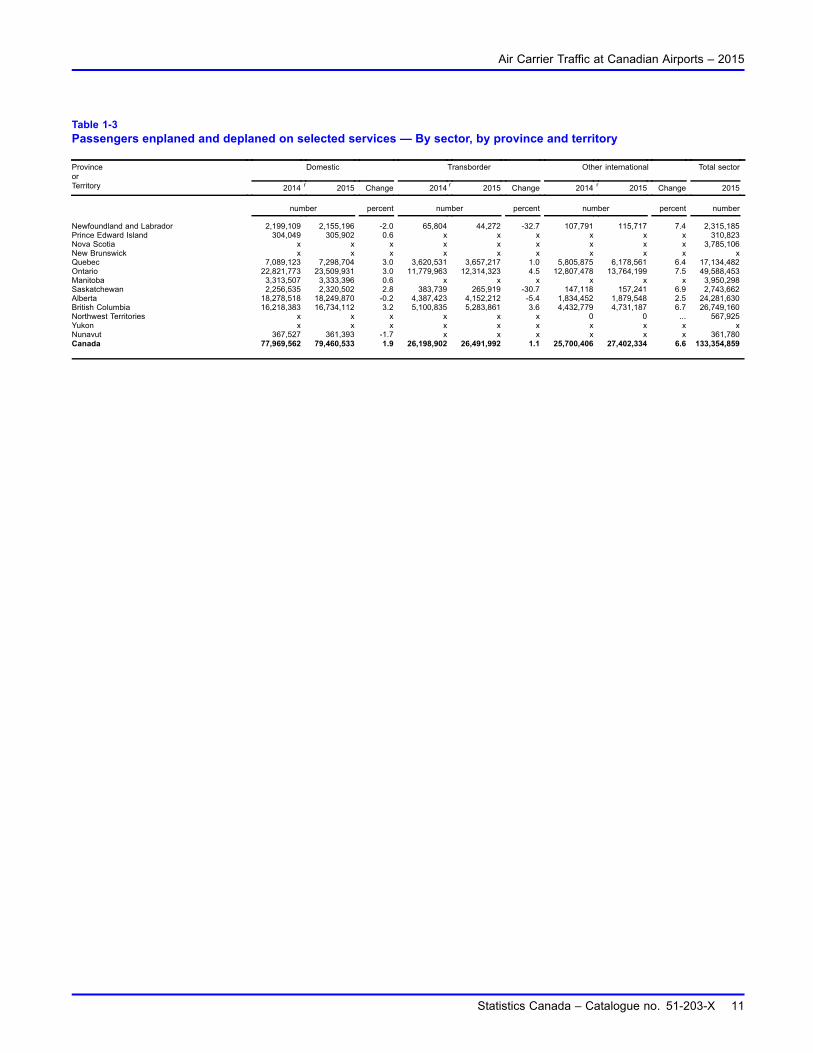
• Air passenger traffic at Canadian airports increased 2.7% in 2015, the sixth consecutive annual increase followingthe economic slowdown of 2009. All sectors experienced growth, as the domestic sector expanded 1.9%(+1.5 million passengers), other international traffic was up 6.6% (+1.7 million) and transborder traffic (betweenCanada and the United States) increased 1.1% (+0.3 million). Continued strong traffic growth at Canada’s twolargest airports (Lester B. Pearson in Toronto and Vancouver International) was a significant factor. The trendfor air passenger traffic in Canada, since 1997, is shown in Chart 1.
• The total number of passengers enplaned and deplaned in Canada rose from 104.8 million in 2009 to 133.4 millionin 2015, an increase of 27.3%. Since 2009, the transborder (+29.0%) and other international (+40.0%) sectorshave experienced stronger passenger traffic growth than the domestic sector (+22.9%). However, the domesticsector remains the largest with 79.5 million passengers in 2015, compared with the transborder (26.5 million) andother international (27.4 million) sectors.
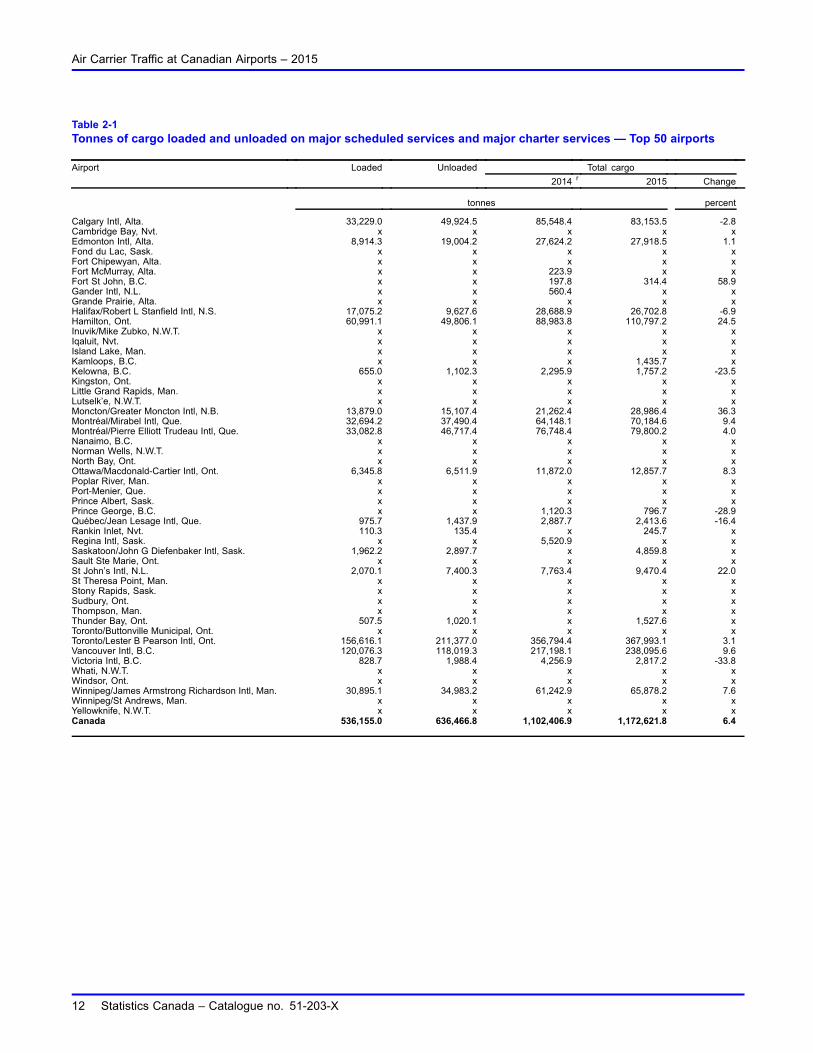
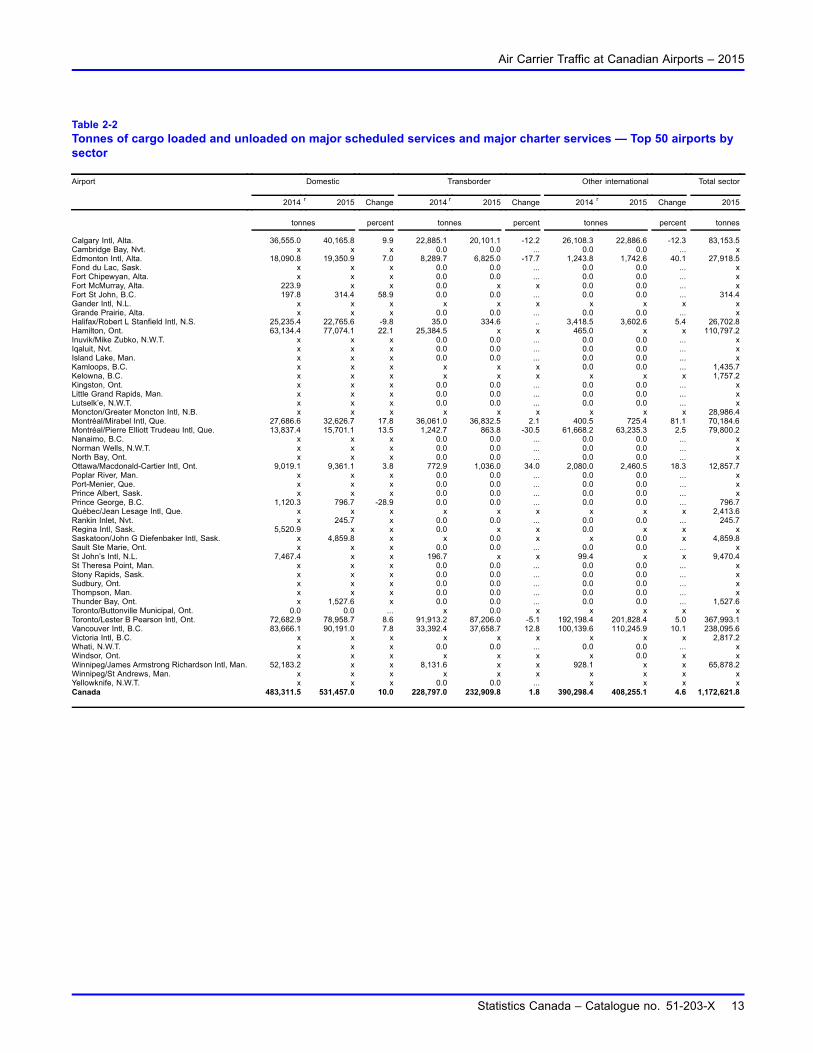
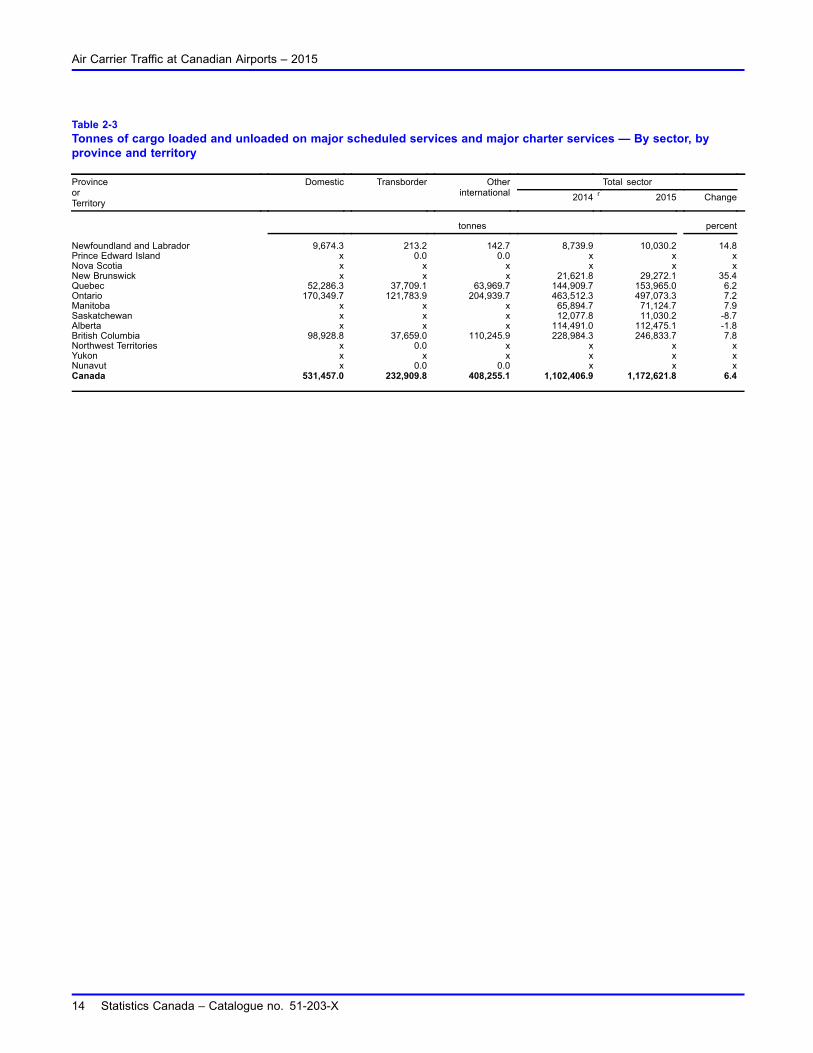
• The weight of cargo loaded and unloaded at Canadian airports increased 6.4% in 2015 to just under 1.2 milliontonnes. Domestic cargo increased 10.0% to 531,000 tonnes. Transborder tonnages increased 1.8%to 233,000 tonnes while international cargo grew 4.6% to 408,000 tonnes.
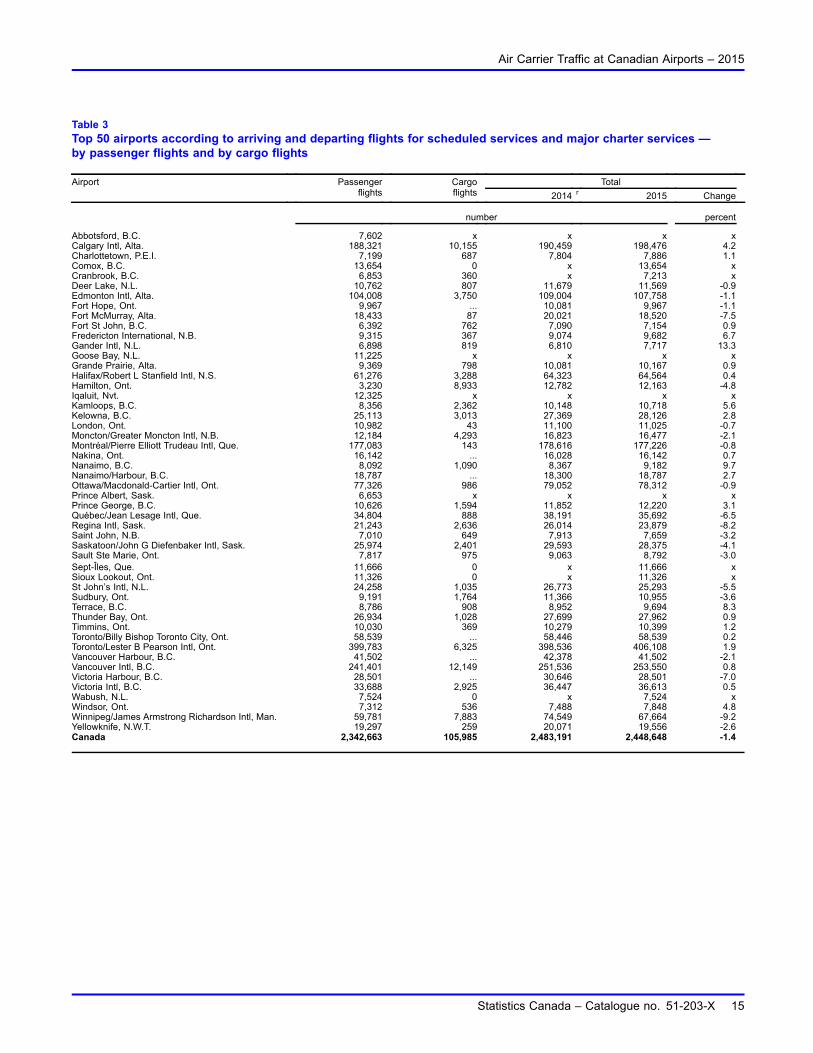
• Canadian airports experienced a decrease in the total number of flights arriving and departing; flights weredown 1.4% in 2015.
Note to readers
The 2015 edition is the last issue of Air Carrier Traffic at Canadian Airports (51-203-X).
Data and information previously included in the publication will be regularly released and made available in The Daily, onCANSIM or in the repository for survey definitions, data sources and methods Airport Activity Survey (survey 2701). Hyperlinksto all this information will be included in The Daily.
Text table 1Passenger and cargo data
Annual 2014 r Annual 2015 Change 2014 to 2015
number percent
Enplaned and Deplaned Passengers
Domestic Segments 77,969,562 79,460,533 1.9Transborder Segments 26,198,902 26,491,992 1.1Other International Segments 25,700,406 27,402,334 6.6Total 129,868,870 133,354,859 2.7
Loaded/Unloaded Cargo (tonnes) 1,102,407 1,172,622 6.4
4 Statistics Canada – Catalogue no. 51-203-X
Air Carrier Traffic at Canadian Airports – 2015
Chart 1Total enplaned/deplaned passengers
75
80
85
90
95
100
105
110
115
120
125
130
135
140
1997 1998 1999 2000 2001 2002 2003 2004 2005 2006 2007 2008 2009 2010 2011 2012 2013 2014 2015
Passengers (millions)
Statistics Canada – Catalogue no. 51-203-X 5
Introduction
In 1968, Statistics Canada published its first Airport Activity Statistics publication. Over the next 20 years, changesoccurring in the industry and regulations prompted changes in the survey methodology and publication format. OnJanuary 1st, 1988 the National Transportation Act, 1987, came into effect. Changes in the statistical reportingrequirements for air carriers prompted a review of the content and presentation of the Air Carrier Traffic at CanadianAirports publication (catalogue 51-005).
In response to these changes, a new format was introduced for the publication beginning with the firstquarter 1989 issue. The publication now displays preliminary data for the current reference year and revised datafor the previous year.
The redesigned Air Carrier Traffic at Canadian Airports publication continued most of the past data series and inaddition, incorporated data on regional and local scheduled services to complement the data previously published onCanadian and foreign carriers’ major scheduled services and major charter services. This provided a comprehensiveoverview of air traffic activity at Canadian airports.
It should be noted that, prior to the changes in the statistical reporting requirements, this publication provided data onboth revenue and non-revenue passengers. However, carriers are now required to report only revenue passengers,and, as such, all references to passengers in this publication refer to revenue passengers.
Beginning in 1995, this publication was only produced annually with the new catalogue number 51-203.
Starting in 2003, the content of this publication was reduced significantly. More specifically, most tables providingdata by type of services (major scheduled services, regional/local scheduled services and major charter services)were eliminated. This change is due to the concerns expressed by carriers in the current context of increasedcommercial sensitivity of aviation data. In addition, table 1-1 is now showing the top 50 airports, compared to thetop 100 airports previously published. Some of the data that used to be available in these tables may still be obtainedby contacting the Aviation Statistics Centre.
Beginning with 2007 data and coinciding with the national roll-out of the Transport Canada Electronic Collection ofAir Transportation Statistics (ECATS) project, data are reported electronically to Transport Canada and shared withStatistics Canada.
Passenger and cargo are available on CANSIM.
Note to Users
Cargo data
It is important to note that the air cargo data presented in the Table 2 series does not represent the total cargo loaded andunloaded in Canada. Comprehensive cargo data are not collected for the following reasons:
i. the regional and local scheduled carriers do not file cargo data on the airport activity survey and,
ii. the major charter survey does not collect data on domestic courier cargo or domestic entity cargo flights.
6 Statistics Canada – Catalogue no. 51-203-X
Related products
Selected CANSIM tables from Statistics Canada
401-0044 Air passenger traffic and flights, annual
401-0045 Air cargo traffic and flights, annual
Selected surveys from Statistics Canada
2701 Airport Activity Survey
2704 Coupon Passenger Origin and Destination Report - Other Unit Toll Services
2705 Air Charter Statistics
Statistics Canada – Catalogue no. 51-203-X 7

Statistical tables
Air Carrier Traffic at Canadian Airports – 2015
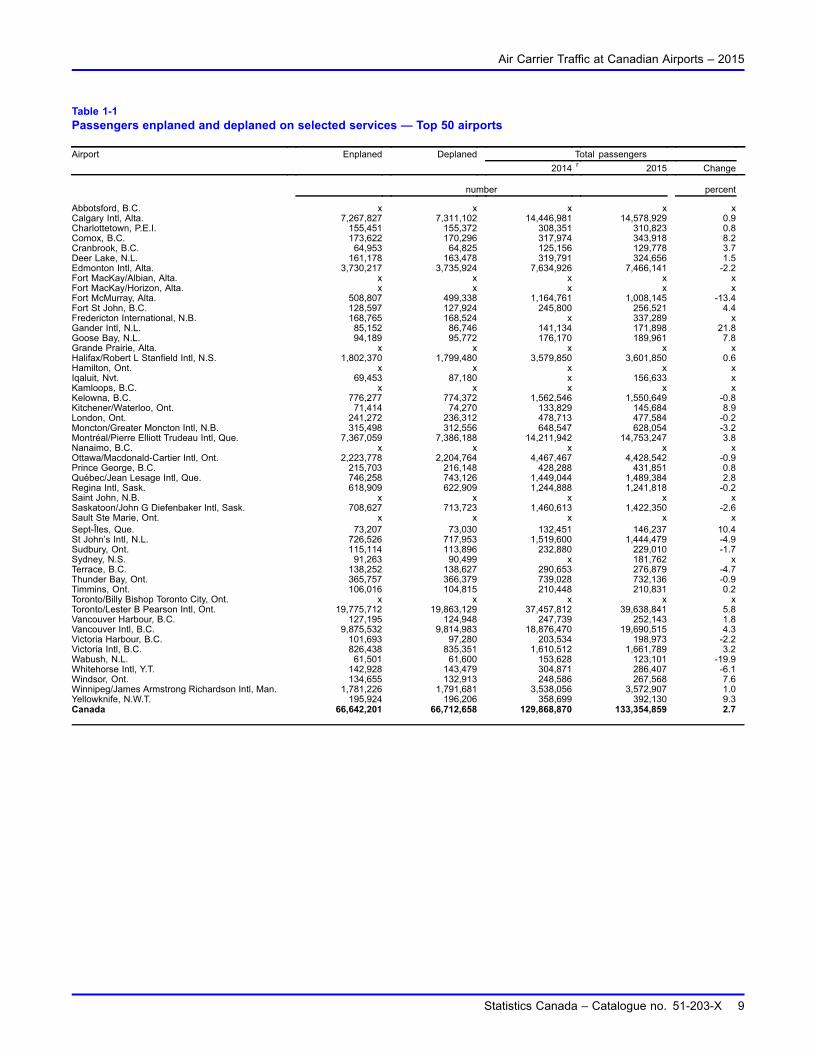
Table 1-1Passengers enplaned and deplaned on selected services — Top 50 airports
Total passengersAirport Enplaned Deplaned
2014 r 2015 Change
number percent
Abbotsford, B.C. x x x x xCalgary Intl, Alta. 7,267,827 7,311,102 14,446,981 14,578,929 0.9Charlottetown, P.E.I. 155,451 155,372 308,351 310,823 0.8Comox, B.C. 173,622 170,296 317,974 343,918 8.2Cranbrook, B.C. 64,953 64,825 125,156 129,778 3.7Deer Lake, N.L. 161,178 163,478 319,791 324,656 1.5Edmonton Intl, Alta. 3,730,217 3,735,924 7,634,926 7,466,141 -2.2Fort MacKay/Albian, Alta. x x x x xFort MacKay/Horizon, Alta. x x x x xFort McMurray, Alta. 508,807 499,338 1,164,761 1,008,145 -13.4Fort St John, B.C. 128,597 127,924 245,800 256,521 4.4Fredericton International, N.B. 168,765 168,524 x 337,289 xGander Intl, N.L. 85,152 86,746 141,134 171,898 21.8Goose Bay, N.L. 94,189 95,772 176,170 189,961 7.8Grande Prairie, Alta. x x x x xHalifax/Robert L Stanfield Intl, N.S. 1,802,370 1,799,480 3,579,850 3,601,850 0.6Hamilton, Ont. x x x x xIqaluit, Nvt. 69,453 87,180 x 156,633 xKamloops, B.C. x x x x xKelowna, B.C. 776,277 774,372 1,562,546 1,550,649 -0.8Kitchener/Waterloo, Ont. 71,414 74,270 133,829 145,684 8.9London, Ont. 241,272 236,312 478,713 477,584 -0.2Moncton/Greater Moncton Intl, N.B. 315,498 312,556 648,547 628,054 -3.2Montréal/Pierre Elliott Trudeau Intl, Que. 7,367,059 7,386,188 14,211,942 14,753,247 3.8Nanaimo, B.C. x x x x xOttawa/Macdonald-Cartier Intl, Ont. 2,223,778 2,204,764 4,467,467 4,428,542 -0.9Prince George, B.C. 215,703 216,148 428,288 431,851 0.8Québec/Jean Lesage Intl, Que. 746,258 743,126 1,449,044 1,489,384 2.8Regina Intl, Sask. 618,909 622,909 1,244,888 1,241,818 -0.2Saint John, N.B. x x x x xSaskatoon/John G Diefenbaker Intl, Sask. 708,627 713,723 1,460,613 1,422,350 -2.6Sault Ste Marie, Ont. x x x x xSept-Îles, Que. 73,207 73,030 132,451 146,237 10.4St John’s Intl, N.L. 726,526 717,953 1,519,600 1,444,479 -4.9Sudbury, Ont. 115,114 113,896 232,880 229,010 -1.7Sydney, N.S. 91,263 90,499 x 181,762 xTerrace, B.C. 138,252 138,627 290,653 276,879 -4.7Thunder Bay, Ont. 365,757 366,379 739,028 732,136 -0.9Timmins, Ont. 106,016 104,815 210,448 210,831 0.2Toronto/Billy Bishop Toronto City, Ont. x x x x xToronto/Lester B Pearson Intl, Ont. 19,775,712 19,863,129 37,457,812 39,638,841 5.8Vancouver Harbour, B.C. 127,195 124,948 247,739 252,143 1.8Vancouver Intl, B.C. 9,875,532 9,814,983 18,876,470 19,690,515 4.3Victoria Harbour, B.C. 101,693 97,280 203,534 198,973 -2.2Victoria Intl, B.C. 826,438 835,351 1,610,512 1,661,789 3.2Wabush, N.L. 61,501 61,600 153,628 123,101 -19.9Whitehorse Intl, Y.T. 142,928 143,479 304,871 286,407 -6.1Windsor, Ont. 134,655 132,913 248,586 267,568 7.6Winnipeg/James Armstrong Richardson Intl, Man. 1,781,226 1,791,681 3,538,056 3,572,907 1.0Yellowknife, N.W.T. 195,924 196,206 358,699 392,130 9.3Canada 66,642,201 66,712,658 129,868,870 133,354,859 2.7
Statistics Canada – Catalogue no. 51-203-X 9
Air Carrier Traffic at Canadian Airports – 2015
Table 1-2Passengers enplaned and deplaned on selected services — Top 50 airports by sector
Domestic Transborder Other international Total sectorAirport
2014 r 2015 Change 2014 r 2015 Change 2014 r 2015 Change 2015
number percent number percent number percent number
Abbotsford, B.C. x x x x x x x x x xCalgary Intl, Alta. 10,001,496 10,207,485 2.1 3,034,590 2,968,620 -2.2 1,410,895 1,402,824 -0.6 14,578,929Charlottetown, P.E.I. 304,049 305,902 0.6 x x x x x x 310,823Comox, B.C. x x x x x x x x x 343,918Cranbrook, B.C. x x x x x x 0 0 ... 129,778Deer Lake, N.L. x x x x x x x x x 324,656Edmonton Intl, Alta. 5,873,637 5,808,538 -1.1 1,340,550 1,183,423 -11.7 420,739 474,180 12.7 7,466,141Fort MacKay/Albian, Alta. x x x 0 0 ... 0 0 ... xFort MacKay/Horizon, Alta. x x x 0 0 ... 0 0 ... xFort McMurray, Alta. x x x x x x x x x 1,008,145Fort St John, B.C. 245,800 256,521 4.4 0 0 ... 0 0 ... 256,521Fredericton International, N.B. x 337,251 x x x x x x x 337,289Gander Intl, N.L. 131,617 160,578 22.0 3,335 3,986 19.5 6,182 7,334 18.6 171,898Goose Bay, N.L. x 184,983 x x x x x x x 189,961Grande Prairie, Alta. x x x x x x x x x xHalifax/Robert L Stanfield Intl, N.S. 2,892,127 2,949,783 2.0 366,750 325,750 -11.2 320,973 326,317 1.7 3,601,850Hamilton, Ont. x x x x x x x x x xIqaluit, Nvt. x x x x x x x x x 156,633Kamloops, B.C. x x x x x x 0 0 ... xKelowna, B.C. 1,376,309 1,388,411 0.9 152,059 127,474 -16.2 34,178 34,764 1.7 1,550,649Kitchener/Waterloo, Ont. x x x x x x x x x 145,684London, Ont. x x x x x x 28,397 25,776 -9.2 477,584Moncton/Greater Moncton Intl, N.B. 585,870 576,498 -1.6 24,909 11,192 -55.1 37,768 40,364 6.9 628,054Montréal/Pierre Elliott Trudeau Intl, Que. 5,388,605 5,521,181 2.5 3,385,698 3,436,743 1.5 5,437,639 5,795,323 6.6 14,753,247Nanaimo, B.C. x x x x x x 0 0 ... xOttawa/Macdonald-Cartier Intl, Ont. 3,313,170 3,374,404 1.8 715,222 623,357 -12.8 439,075 430,781 -1.9 4,428,542Prince George, B.C. x x x x x x x x x 431,851Québec/Jean Lesage Intl, Que. 862,574 897,769 4.1 233,579 220,393 -5.6 352,891 371,222 5.2 1,489,384Regina Intl, Sask. 990,946 1,039,179 4.9 x x x x x x 1,241,818Saint John, N.B. x x x x x x x x x xSaskatoon/John G Diefenbaker Intl, Sask. 1,183,704 1,201,835 1.5 x x x x x x 1,422,350Sault Ste Marie, Ont. x x x x x x x x x xSept-Îles, Que. x x x x x x x x x 146,237St John’s Intl, N.L. 1,365,652 1,304,321 -4.5 60,649 38,346 -36.8 93,299 101,812 9.1 1,444,479Sudbury, Ont. x x x x x x 0 0 ... 229,010Sydney, N.S. x x x x x x x x x 181,762Terrace, B.C. x 276,879 x x 0 x 0 0 ... 276,879Thunder Bay, Ont. x x x x x x x x x 732,136Timmins, Ont. 210,448 210,831 0.2 0 0 ... 0 0 ... 210,831Toronto/Billy Bishop Toronto City, Ont. x x x x x x 0 0 ... xToronto/Lester B Pearson Intl, Ont. 15,021,121 15,661,502 4.3 10,165,869 10,752,741 5.8 12,270,822 13,224,598 7.8 39,638,841Vancouver Harbour, B.C. x x x 0 0 ... x x x 252,143Vancouver Intl, B.C. 9,857,724 10,174,362 3.2 4,660,325 4,861,642 4.3 4,358,421 4,654,511 6.8 19,690,515Victoria Harbour, B.C. x x x x x x x x x 198,973Victoria Intl, B.C. 1,321,293 1,367,164 3.5 265,322 270,302 1.9 23,897 24,323 1.8 1,661,789Wabush, N.L. 153,628 123,101 -19.9 0 0 ... 0 0 ... 123,101Whitehorse Intl, Y.T. 297,858 279,572 -6.1 x x x x x x 286,407Windsor, Ont. x x x x x x x x x 267,568Winnipeg/James Armstrong Richardson Intl, Man. 2,891,878 2,956,005 2.2 467,767 436,326 -6.7 178,411 180,576 1.2 3,572,907Yellowknife, N.W.T. 358,699 392,130 9.3 0 0 ... 0 0 ... 392,130Canada 77,969,562 79,460,533 1.9 26,198,902 26,491,992 1.1 25,700,406 27,402,334 6.6 133,354,859
10 Statistics Canada – Catalogue no. 51-203-X
Air Carrier Traffic at Canadian Airports – 2015
Table 1-3Passengers enplaned and deplaned on selected services — By sector, by province and territory
Domestic Transborder Other international Total sectorProvinceorTerritory 2014 r 2015 Change 2014 r 2015 Change 2014 r 2015 Change 2015
number percent number percent number percent number
Newfoundland and Labrador 2,199,109 2,155,196 -2.0 65,804 44,272 -32.7 107,791 115,717 7.4 2,315,185Prince Edward Island 304,049 305,902 0.6 x x x x x x 310,823Nova Scotia x x x x x x x x x 3,785,106New Brunswick x x x x x x x x x xQuebec 7,089,123 7,298,704 3.0 3,620,531 3,657,217 1.0 5,805,875 6,178,561 6.4 17,134,482Ontario 22,821,773 23,509,931 3.0 11,779,963 12,314,323 4.5 12,807,478 13,764,199 7.5 49,588,453Manitoba 3,313,507 3,333,396 0.6 x x x x x x 3,950,298Saskatchewan 2,256,535 2,320,502 2.8 383,739 265,919 -30.7 147,118 157,241 6.9 2,743,662Alberta 18,278,518 18,249,870 -0.2 4,387,423 4,152,212 -5.4 1,834,452 1,879,548 2.5 24,281,630British Columbia 16,218,383 16,734,112 3.2 5,100,835 5,283,861 3.6 4,432,779 4,731,187 6.7 26,749,160Northwest Territories x x x x x x 0 0 ... 567,925Yukon x x x x x x x x x xNunavut 367,527 361,393 -1.7 x x x x x x 361,780Canada 77,969,562 79,460,533 1.9 26,198,902 26,491,992 1.1 25,700,406 27,402,334 6.6 133,354,859
Statistics Canada – Catalogue no. 51-203-X 11
Air Carrier Traffic at Canadian Airports – 2015
Table 2-1Tonnes of cargo loaded and unloaded on major scheduled services and major charter services — Top 50 airports
Total cargoAirport Loaded Unloaded
2014 r 2015 Change
tonnes percent
Calgary Intl, Alta. 33,229.0 49,924.5 85,548.4 83,153.5 -2.8Cambridge Bay, Nvt. x x x x xEdmonton Intl, Alta. 8,914.3 19,004.2 27,624.2 27,918.5 1.1Fond du Lac, Sask. x x x x xFort Chipewyan, Alta. x x x x xFort McMurray, Alta. x x 223.9 x xFort St John, B.C. x x 197.8 314.4 58.9Gander Intl, N.L. x x 560.4 x xGrande Prairie, Alta. x x x x xHalifax/Robert L Stanfield Intl, N.S. 17,075.2 9,627.6 28,688.9 26,702.8 -6.9Hamilton, Ont. 60,991.1 49,806.1 88,983.8 110,797.2 24.5Inuvik/Mike Zubko, N.W.T. x x x x xIqaluit, Nvt. x x x x xIsland Lake, Man. x x x x xKamloops, B.C. x x x 1,435.7 xKelowna, B.C. 655.0 1,102.3 2,295.9 1,757.2 -23.5Kingston, Ont. x x x x xLittle Grand Rapids, Man. x x x x xLutselk’e, N.W.T. x x x x xMoncton/Greater Moncton Intl, N.B. 13,879.0 15,107.4 21,262.4 28,986.4 36.3Montréal/Mirabel Intl, Que. 32,694.2 37,490.4 64,148.1 70,184.6 9.4Montréal/Pierre Elliott Trudeau Intl, Que. 33,082.8 46,717.4 76,748.4 79,800.2 4.0Nanaimo, B.C. x x x x xNorman Wells, N.W.T. x x x x xNorth Bay, Ont. x x x x xOttawa/Macdonald-Cartier Intl, Ont. 6,345.8 6,511.9 11,872.0 12,857.7 8.3Poplar River, Man. x x x x xPort-Menier, Que. x x x x xPrince Albert, Sask. x x x x xPrince George, B.C. x x 1,120.3 796.7 -28.9Québec/Jean Lesage Intl, Que. 975.7 1,437.9 2,887.7 2,413.6 -16.4Rankin Inlet, Nvt. 110.3 135.4 x 245.7 xRegina Intl, Sask. x x 5,520.9 x xSaskatoon/John G Diefenbaker Intl, Sask. 1,962.2 2,897.7 x 4,859.8 xSault Ste Marie, Ont. x x x x xSt John’s Intl, N.L. 2,070.1 7,400.3 7,763.4 9,470.4 22.0St Theresa Point, Man. x x x x xStony Rapids, Sask. x x x x xSudbury, Ont. x x x x xThompson, Man. x x x x xThunder Bay, Ont. 507.5 1,020.1 x 1,527.6 xToronto/Buttonville Municipal, Ont. x x x x xToronto/Lester B Pearson Intl, Ont. 156,616.1 211,377.0 356,794.4 367,993.1 3.1Vancouver Intl, B.C. 120,076.3 118,019.3 217,198.1 238,095.6 9.6Victoria Intl, B.C. 828.7 1,988.4 4,256.9 2,817.2 -33.8Whati, N.W.T. x x x x xWindsor, Ont. x x x x xWinnipeg/James Armstrong Richardson Intl, Man. 30,895.1 34,983.2 61,242.9 65,878.2 7.6Winnipeg/St Andrews, Man. x x x x xYellowknife, N.W.T. x x x x xCanada 536,155.0 636,466.8 1,102,406.9 1,172,621.8 6.4
12 Statistics Canada – Catalogue no. 51-203-X
Air Carrier Traffic at Canadian Airports – 2015
Table 2-2Tonnes of cargo loaded and unloaded on major scheduled services and major charter services — Top 50 airports bysector
Domestic Transborder Other international Total sectorAirport
2014 r 2015 Change 2014 r 2015 Change 2014 r 2015 Change 2015
tonnes percent tonnes percent tonnes percent tonnes
Calgary Intl, Alta. 36,555.0 40,165.8 9.9 22,885.1 20,101.1 -12.2 26,108.3 22,886.6 -12.3 83,153.5Cambridge Bay, Nvt. x x x 0.0 0.0 ... 0.0 0.0 ... xEdmonton Intl, Alta. 18,090.8 19,350.9 7.0 8,289.7 6,825.0 -17.7 1,243.8 1,742.6 40.1 27,918.5Fond du Lac, Sask. x x x 0.0 0.0 ... 0.0 0.0 ... xFort Chipewyan, Alta. x x x 0.0 0.0 ... 0.0 0.0 ... xFort McMurray, Alta. 223.9 x x 0.0 x x 0.0 0.0 ... xFort St John, B.C. 197.8 314.4 58.9 0.0 0.0 ... 0.0 0.0 ... 314.4Gander Intl, N.L. x x x x x x x x x xGrande Prairie, Alta. x x x 0.0 0.0 ... 0.0 0.0 ... xHalifax/Robert L Stanfield Intl, N.S. 25,235.4 22,765.6 -9.8 35.0 334.6 .. 3,418.5 3,602.6 5.4 26,702.8Hamilton, Ont. 63,134.4 77,074.1 22.1 25,384.5 x x 465.0 x x 110,797.2Inuvik/Mike Zubko, N.W.T. x x x 0.0 0.0 ... 0.0 0.0 ... xIqaluit, Nvt. x x x 0.0 0.0 ... 0.0 0.0 ... xIsland Lake, Man. x x x 0.0 0.0 ... 0.0 0.0 ... xKamloops, B.C. x x x x x x 0.0 0.0 ... 1,435.7Kelowna, B.C. x x x x x x x x x 1,757.2Kingston, Ont. x x x 0.0 0.0 ... 0.0 0.0 ... xLittle Grand Rapids, Man. x x x 0.0 0.0 ... 0.0 0.0 ... xLutselk’e, N.W.T. x x x 0.0 0.0 ... 0.0 0.0 ... xMoncton/Greater Moncton Intl, N.B. x x x x x x x x x 28,986.4Montréal/Mirabel Intl, Que. 27,686.6 32,626.7 17.8 36,061.0 36,832.5 2.1 400.5 725.4 81.1 70,184.6Montréal/Pierre Elliott Trudeau Intl, Que. 13,837.4 15,701.1 13.5 1,242.7 863.8 -30.5 61,668.2 63,235.3 2.5 79,800.2Nanaimo, B.C. x x x 0.0 0.0 ... 0.0 0.0 ... xNorman Wells, N.W.T. x x x 0.0 0.0 ... 0.0 0.0 ... xNorth Bay, Ont. x x x 0.0 0.0 ... 0.0 0.0 ... xOttawa/Macdonald-Cartier Intl, Ont. 9,019.1 9,361.1 3.8 772.9 1,036.0 34.0 2,080.0 2,460.5 18.3 12,857.7Poplar River, Man. x x x 0.0 0.0 ... 0.0 0.0 ... xPort-Menier, Que. x x x 0.0 0.0 ... 0.0 0.0 ... xPrince Albert, Sask. x x x 0.0 0.0 ... 0.0 0.0 ... xPrince George, B.C. 1,120.3 796.7 -28.9 0.0 0.0 ... 0.0 0.0 ... 796.7Québec/Jean Lesage Intl, Que. x x x x x x x x x 2,413.6Rankin Inlet, Nvt. x 245.7 x 0.0 0.0 ... 0.0 0.0 ... 245.7Regina Intl, Sask. 5,520.9 x x 0.0 x x 0.0 x x xSaskatoon/John G Diefenbaker Intl, Sask. x 4,859.8 x x 0.0 x x 0.0 x 4,859.8Sault Ste Marie, Ont. x x x 0.0 0.0 ... 0.0 0.0 ... xSt John’s Intl, N.L. 7,467.4 x x 196.7 x x 99.4 x x 9,470.4St Theresa Point, Man. x x x 0.0 0.0 ... 0.0 0.0 ... xStony Rapids, Sask. x x x 0.0 0.0 ... 0.0 0.0 ... xSudbury, Ont. x x x 0.0 0.0 ... 0.0 0.0 ... xThompson, Man. x x x 0.0 0.0 ... 0.0 0.0 ... xThunder Bay, Ont. x 1,527.6 x 0.0 0.0 ... 0.0 0.0 ... 1,527.6Toronto/Buttonville Municipal, Ont. 0.0 0.0 ... x 0.0 x x x x xToronto/Lester B Pearson Intl, Ont. 72,682.9 78,958.7 8.6 91,913.2 87,206.0 -5.1 192,198.4 201,828.4 5.0 367,993.1Vancouver Intl, B.C. 83,666.1 90,191.0 7.8 33,392.4 37,658.7 12.8 100,139.6 110,245.9 10.1 238,095.6Victoria Intl, B.C. x x x x x x x x x 2,817.2Whati, N.W.T. x x x 0.0 0.0 ... 0.0 0.0 ... xWindsor, Ont. x x x x x x x 0.0 x xWinnipeg/James Armstrong Richardson Intl, Man. 52,183.2 x x 8,131.6 x x 928.1 x x 65,878.2Winnipeg/St Andrews, Man. x x x x x x x x x xYellowknife, N.W.T. x x x 0.0 0.0 ... x x x xCanada 483,311.5 531,457.0 10.0 228,797.0 232,909.8 1.8 390,298.4 408,255.1 4.6 1,172,621.8
Statistics Canada – Catalogue no. 51-203-X 13
Air Carrier Traffic at Canadian Airports – 2015
Table 2-3Tonnes of cargo loaded and unloaded on major scheduled services and major charter services — By sector, byprovince and territory
Total sectorProvinceorTerritory
Domestic Transborder Otherinternational 2014 r 2015 Change
tonnes percent
Newfoundland and Labrador 9,674.3 213.2 142.7 8,739.9 10,030.2 14.8Prince Edward Island x 0.0 0.0 x x xNova Scotia x x x x x xNew Brunswick x x x 21,621.8 29,272.1 35.4Quebec 52,286.3 37,709.1 63,969.7 144,909.7 153,965.0 6.2Ontario 170,349.7 121,783.9 204,939.7 463,512.3 497,073.3 7.2Manitoba x x x 65,894.7 71,124.7 7.9Saskatchewan x x x 12,077.8 11,030.2 -8.7Alberta x x x 114,491.0 112,475.1 -1.8British Columbia 98,928.8 37,659.0 110,245.9 228,984.3 246,833.7 7.8Northwest Territories x 0.0 x x x xYukon x x x x x xNunavut x 0.0 0.0 x x xCanada 531,457.0 232,909.8 408,255.1 1,102,406.9 1,172,621.8 6.4
14 Statistics Canada – Catalogue no. 51-203-X
Air Carrier Traffic at Canadian Airports – 2015
Table 3Top 50 airports according to arriving and departing flights for scheduled services and major charter services —by passenger flights and by cargo flights
TotalAirport Passengerflights
Cargoflights 2014 r 2015 Change
number percent
Abbotsford, B.C. 7,602 x x x xCalgary Intl, Alta. 188,321 10,155 190,459 198,476 4.2Charlottetown, P.E.I. 7,199 687 7,804 7,886 1.1Comox, B.C. 13,654 0 x 13,654 xCranbrook, B.C. 6,853 360 x 7,213 xDeer Lake, N.L. 10,762 807 11,679 11,569 -0.9Edmonton Intl, Alta. 104,008 3,750 109,004 107,758 -1.1Fort Hope, Ont. 9,967 ... 10,081 9,967 -1.1Fort McMurray, Alta. 18,433 87 20,021 18,520 -7.5Fort St John, B.C. 6,392 762 7,090 7,154 0.9Fredericton International, N.B. 9,315 367 9,074 9,682 6.7Gander Intl, N.L. 6,898 819 6,810 7,717 13.3Goose Bay, N.L. 11,225 x x x xGrande Prairie, Alta. 9,369 798 10,081 10,167 0.9Halifax/Robert L Stanfield Intl, N.S. 61,276 3,288 64,323 64,564 0.4Hamilton, Ont. 3,230 8,933 12,782 12,163 -4.8Iqaluit, Nvt. 12,325 x x x xKamloops, B.C. 8,356 2,362 10,148 10,718 5.6Kelowna, B.C. 25,113 3,013 27,369 28,126 2.8London, Ont. 10,982 43 11,100 11,025 -0.7Moncton/Greater Moncton Intl, N.B. 12,184 4,293 16,823 16,477 -2.1Montréal/Pierre Elliott Trudeau Intl, Que. 177,083 143 178,616 177,226 -0.8Nakina, Ont. 16,142 ... 16,028 16,142 0.7Nanaimo, B.C. 8,092 1,090 8,367 9,182 9.7Nanaimo/Harbour, B.C. 18,787 ... 18,300 18,787 2.7Ottawa/Macdonald-Cartier Intl, Ont. 77,326 986 79,052 78,312 -0.9Prince Albert, Sask. 6,653 x x x xPrince George, B.C. 10,626 1,594 11,852 12,220 3.1Québec/Jean Lesage Intl, Que. 34,804 888 38,191 35,692 -6.5Regina Intl, Sask. 21,243 2,636 26,014 23,879 -8.2Saint John, N.B. 7,010 649 7,913 7,659 -3.2Saskatoon/John G Diefenbaker Intl, Sask. 25,974 2,401 29,593 28,375 -4.1Sault Ste Marie, Ont. 7,817 975 9,063 8,792 -3.0Sept-Îles, Que. 11,666 0 x 11,666 xSioux Lookout, Ont. 11,326 0 x 11,326 xSt John’s Intl, N.L. 24,258 1,035 26,773 25,293 -5.5Sudbury, Ont. 9,191 1,764 11,366 10,955 -3.6Terrace, B.C. 8,786 908 8,952 9,694 8.3Thunder Bay, Ont. 26,934 1,028 27,699 27,962 0.9Timmins, Ont. 10,030 369 10,279 10,399 1.2Toronto/Billy Bishop Toronto City, Ont. 58,539 ... 58,446 58,539 0.2Toronto/Lester B Pearson Intl, Ont. 399,783 6,325 398,536 406,108 1.9Vancouver Harbour, B.C. 41,502 ... 42,378 41,502 -2.1Vancouver Intl, B.C. 241,401 12,149 251,536 253,550 0.8Victoria Harbour, B.C. 28,501 ... 30,646 28,501 -7.0Victoria Intl, B.C. 33,688 2,925 36,447 36,613 0.5Wabush, N.L. 7,524 0 x 7,524 xWindsor, Ont. 7,312 536 7,488 7,848 4.8Winnipeg/James Armstrong Richardson Intl, Man. 59,781 7,883 74,549 67,664 -9.2Yellowknife, N.W.T. 19,297 259 20,071 19,556 -2.6Canada 2,342,663 105,985 2,483,191 2,448,648 -1.4
Statistics Canada – Catalogue no. 51-203-X 15
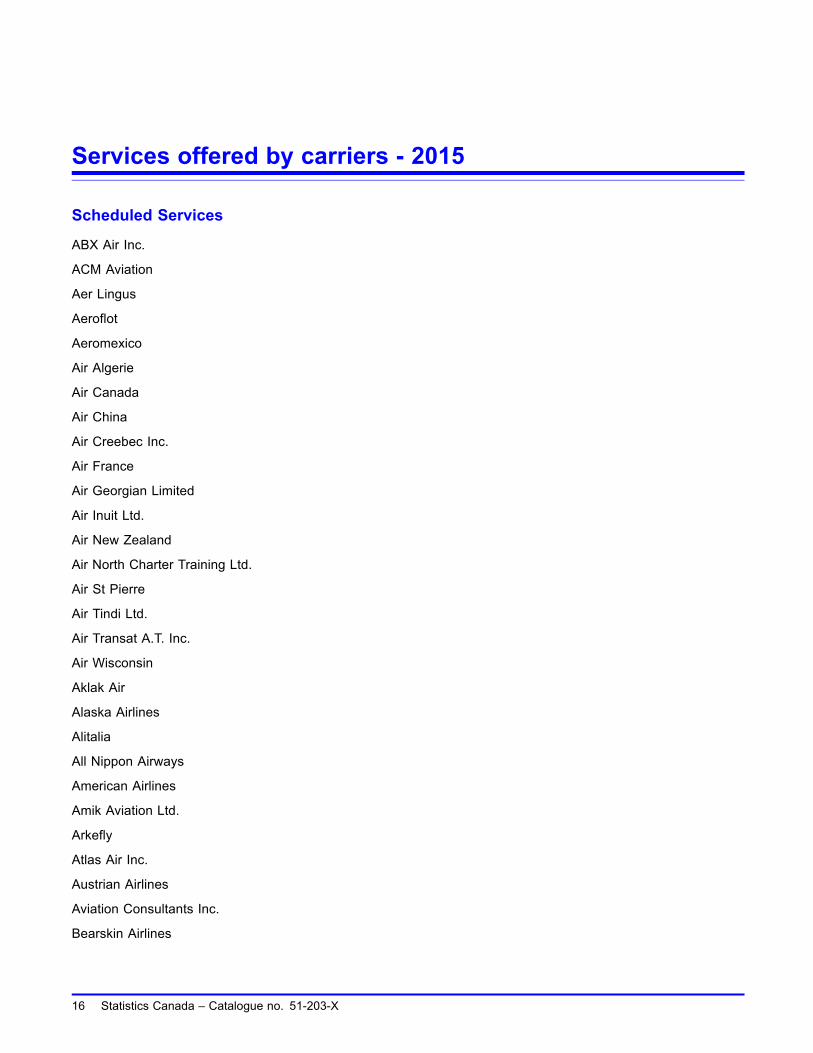
Services offered by carriers - 2015
Scheduled Services
ABX Air Inc.
ACM Aviation
Aer Lingus
Aeroflot
Aeromexico
Air Algerie
Air Canada
Air China
Air Creebec Inc.
Air France
Air Georgian Limited
Air Inuit Ltd.
Air New Zealand
Air North Charter Training Ltd.
Air St Pierre
Air Tindi Ltd.
Air Transat A.T. Inc.
Air Wisconsin
Aklak Air
Alaska Airlines
Alitalia
All Nippon Airways
American Airlines
Amik Aviation Ltd.
Arkefly
Atlas Air Inc.
Austrian Airlines
Aviation Consultants Inc.
Bearskin Airlines
16 Statistics Canada – Catalogue no. 51-203-X
Air Carrier Traffic at Canadian Airports – 2015
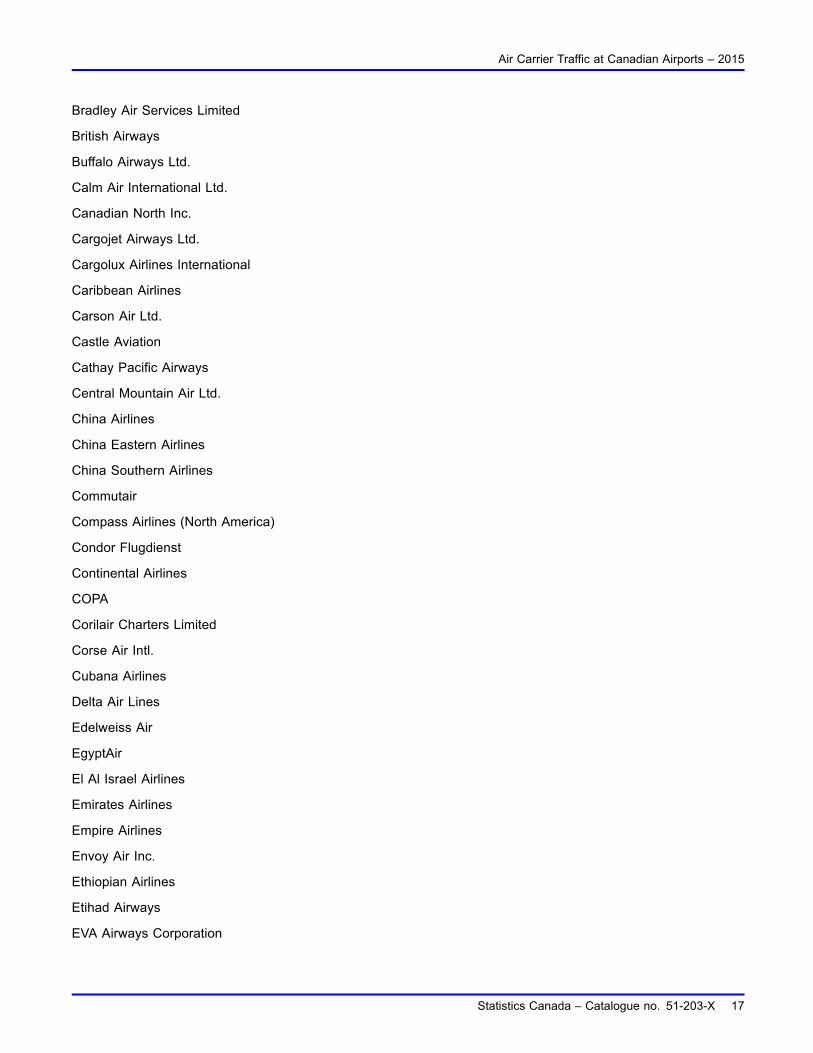
Bradley Air Services Limited
British Airways
Buffalo Airways Ltd.
Calm Air International Ltd.
Canadian North Inc.
Cargojet Airways Ltd.
Cargolux Airlines International
Caribbean Airlines
Carson Air Ltd.
Castle Aviation
Cathay Pacific Airways
Central Mountain Air Ltd.
China Airlines
China Eastern Airlines
China Southern Airlines
Commutair
Compass Airlines (North America)
Condor Flugdienst
Continental Airlines
COPA
Corilair Charters Limited
Corse Air Intl.
Cubana Airlines
Delta Air Lines
Edelweiss Air
EgyptAir
El Al Israel Airlines
Emirates Airlines
Empire Airlines
Envoy Air Inc.
Ethiopian Airlines
Etihad Airways
EVA Airways Corporation
Statistics Canada – Catalogue no. 51-203-X 17
Air Carrier Traffic at Canadian Airports – 2015
Exploits Valley Air Services Ltd.
ExpressJet
FedEx
Finnair
Fly Jamaica Airways
GoJet Airlines LLC
Griffing Flying Service
Hainan Airlines
Harbour Air Ltd.
Hawkair Aviation Services Ltd.
Helijet International Inc.
Horizon Air Industries Inc.
Icelandair
Inland Air Charters Ltd.
Integra Air Inc.
Island Express Air Inc.
JAL-Japan Airlines International Co. Ltd.
Jazz Air Inc.
JDR Pacific Ventures Ltd.
Jet Access Aviation
Jet Airways India
K D Air Corporation
Keewatin Air Ltd.
Kenmore Air Harbor Inc.
Kenn Borek Air Ltd.
KF Aerospace
KLM Royal Dutch Airlines
Korean Air
Labrador Airways Ltd.
LACSA
LOT-Polish Airlines
Lufthansa German Airlines
McMurray Aviation
18 Statistics Canada – Catalogue no. 51-203-X
Air Carrier Traffic at Canadian Airports – 2015
Mesa Airlines
Midwest Airlines Inc.
Missinippi Airways
Montmagny Air Service Inc.
Morningstar Air Express Inc.
Nakina Outpost Camps & Air Service Ltd.
Northern Air Charter (P.R.) Inc.
Northern Thunderbird Air Inc.
Northway Aviation Ltd.
Northwestern Air Lease
Northwright Air
Omni Air Express
Orca Airways Ltd.
Pacific Coastal Airlines Limited
Pakistan International
Pascan Aviation Inc.
Perimeter Aviation Ltd.
Philippine Airlines Inc.
Pinnacle Airlines
Porter Airlines Inc.
Provincial Airlines
Qatar Airways
Royal Air Maroc
Royal Jordanian
Salt Spring Island Air Ltd.
SATA Internacional
Saudia
Shuttle America Corp.
Sichuan Airlines Co. Ltd.
Sky Regional Airlines Inc.
Sky West Airlines
SkyJet M.G. Inc.
Skylink Express Inc.
Statistics Canada – Catalogue no. 51-203-X 19
Air Carrier Traffic at Canadian Airports – 2015
Sunwest Aviation Ltd.
Sunwing Airlines Inc.
Swiss International Air Lines Ltd.
TAG Aviation
Thunder Airlines Limited
Tofino Airlines Ltd.
Transaero Airlines
Transwest Air
Turkish Airlines
Tyrolean Jet Service
United Airlines
United Parcel Service
US Airways Inc.
Vancouver Island Air Ltd.
Virgin Atlantic Airways
Wasaya Airways Limited Partnership
West Coast Air Ltd.
West Wind Aviation Limited Partnership
WestJet
WestJet Encore
Major Charter Services
ACM Air Charter
ACM Aviation
Aeromexico
Air Alsie
Air Canada
Air Foyle
Air Rutter International
Air St Pierre
Air Transat A.T. Inc.
Airborne Inc.
American Air Services Inc.
American Airlines
20 Statistics Canada – Catalogue no. 51-203-X
Air Carrier Traffic at Canadian Airports – 2015
Ameristar Air Cargo Inc.
Arkefly
ATI - Air Transport International LLC
Atlas Air Inc.
Aviation Consultants Inc.
Aviation Starlink Inc.
Avjet Corporation
Canadian North Inc.
CanJet Airlines
Cargolux Airlines International
Cathay Pacific Airways
Centaero Aviation Ltd.
Chantilly Air Inc.
China Airlines
Cockrell Resources Inc.
Condor Flugdienst
Continental Airlines
Corporate Flight International Inc.
Delta Air Lines
Enerjet
Executive Fliteways Inc.
Fast Air Ltd.
Flair Airlines Ltd.
Flexjet
Flight Options
Flightexec
Florida Jet Service Inc.
Florida West International Airlines
G5 Executive AG
GainJet Aviation
Galaxy Airways
Global Aviation
Gulf & Caribbean Cargo Inc.
Statistics Canada – Catalogue no. 51-203-X 21
Air Carrier Traffic at Canadian Airports – 2015
Independent Flight Leasing Inc.
JAL-Japan Airlines International Co Ltd.
Jazz Air Inc.
JEM Air Holdings
Jet Access Aviation
Jet Linx Aviation
Jet Solutions LLC
JETEX LLC
Jetport Inc.
Kalitta Air LLC
Key Air
Landmark Aviation
London Air Services Limited
Longtail Aviation
Lufthansa German Airlines
Lynden Air Cargo LLC
Miami Air International
Monarch Airlines (UK)
Mountain Air Cargo
Neptune Aviation Services Inc.
NetJets Europe
Nolinor Aviation
North American Airlines
North Cariboo Flying Service Ltd.
Oak Air Ltd.
Omni Air Express
Paradigm Air Operators Inc.
Partner Jet Inc.
Pentastar Aviation
Porter Airlines Inc.
Priester Aviation
Prime Jet
Rectrix Aviation
22 Statistics Canada – Catalogue no. 51-203-X
Air Carrier Traffic at Canadian Airports – 2015
SATA Internacional
SC Aviation
Skycharter
Skyservice Business Aviation Inc.
Solairus Aviation
Starbase Aviation
Sunwest Aviation Ltd.
Sunwing Airlines Inc.
TAG Aviation
Taughannock Aviation
Travel Management Company Ltd.
Triair
Tulsair
United Airlines
USA Jet Airlines Inc.
VIH Execujet Ltd.
VistaJet (Austria)
VistaJet (Malta)
Volga-Dnepr Airlines LLC
Western Air Charter Inc.
WestJet
XOJET
Y2K Aviation LLC
Statistics Canada – Catalogue no. 51-203-X 23
Methodology
Survey universe
Coverage
The airport activity data presented in this publication were compiled from three surveys (statements) conducted bythe Aviation Statistics Centre of Statistics Canada and collected by Transport Canada’s Electronic Collection of AirTransportation Statistics (ECATS) project.
Daily Airport Activities Survey
This survey covers the scheduled domestic and international services operated by the Level I Canadian air carriers.Data concerning other Canadian carriers and foreign carriers operating scheduled international services into andout of Canada using aircraft with a maximum take-off weight on wheels greater than 30,000 kg are also included.
The survey data are filed on a census basis and are reported in the traffic flow format.
Coupon Passenger Origin and Destination Survey
This survey covers the scheduled services operated within, into or out of Canada by regional and local Canadianair carriers and the scheduled services operated into or out of Canada by foreign air carriers using aircraft withmaximum take-off weight on wheels not greater than 30,000 kg.
The survey data are collected on a census basis. Data is reported on an origin and destination basis (that is, thepassengers’ origin and destination on the reporting carrier’s system) from Canadian carriers assigned to ReportingLevels II, III, and IV. Foreign air carriers operating unit toll international scheduled services using fixed wing aircrafthaving a maximum take-off weight on wheels not greater than 30,000 kg also report. The Aviation Statistics Centreconverts the data into the enplaned and deplaned format.
Charter On-Flight Origin and Destination Survey
This survey covers the charter services operated by Canadian air carriers within Canada or by Canadian or foreignair carriers between Canada and foreign countries other than the United States using aircraft having a maximumtake-off weight on wheels greater than 15,900 kg. Likewise, all commercial charter services operated betweenCanada and the United States using aircraft with maximum take-off weight on wheels greater than 8,200 kg are alsoreported.
Data are reported on a census basis and are reported in the on-flight origin and destination format (that is, thepassengers are reported according to their own origin and destination and not necessarily according to the routingof the flight).
Survey methodology
Beginning with 2007 data and coinciding with the national roll-out of the Transport Canada Electronic Collection ofAir Transportation Statistics (ECATS) project, data are reported electronically to Transport Canada and shared withStatistics Canada.
24 Statistics Canada – Catalogue no. 51-203-X
Air Carrier Traffic at Canadian Airports – 2015
Upon receipt of the data, the Aviation Statistics Centre (ASC) applies its own edit programs to the data. Theseprograms conduct quality checks to determine the quality and legitimacy of the information contained within flightrecords. Aviation Statistics Centre personnel then correct invalid entries, impute for missing data, tabulate andprepare the data for publication.
Statistics Canada – Catalogue no. 51-203-X 25
Data quality and limitations
The air carriers must file their data in accordance with the reporting procedures provided by Transport Canada. Thequality of the data may be affected by non-sampling errors such as coverage error, response error or coding error.
Users of the airport activity data should be aware of the following limitations:
• In order to publish timely data, the Aviation Statistics Centre imputes for data that are not received from thecarriers in time for the publication. The Aviation Statistics Centre makes every effort to include reported data inthe database.
• From time to time, participating carriers refile or update previous data submissions. The revisions will be reflectedin the database and in the next publication.
• Passenger flights which carry cargo on them are classified as passenger flights for the purpose of this publication.The cargo carried on these passenger flights is defined as belly-hold cargo. The belly-hold cargo data are includedwith the pure cargo data in the cargo tables presented in the Table 2 series.
• Cargo data are not collected for the smaller scheduled services.
• Charter data are not collected on the smaller charter operations.
• The data presented in this publication are broken down into three categories: domestic, transborder and otherinternational. The data are assigned to the categories for each flight segment according to the next stop(for departures) and the last stop (for arrivals) of the aircraft. For example, consider a flight with a routing ofVancouver-Edmonton-Amsterdam. The departure of the flight from Vancouver would be considered domestic, aswould the arrival at Edmonton. The departure of the flight from Edmonton for Amsterdam would be consideredas other international since the next stop of the aircraft is a foreign point.
• Effective January 1, 1988, data for non-revenue passengers and mail are no longer collected for the majorscheduled services.
26 Statistics Canada – Catalogue no. 51-203-X
Factors which may have influenced the data
2015
January 2015 was marked by extreme cold, heavy snow and freezing rain conditions across Canada forcing delaysand flight cancellations at many airports.
Significant winter storms struck Atlantic Canada in February 2015 forcing numerous flight cancellations and delays.During the same time, eastern Ontario and southwestern Quebec recorded colder-than-normal temperatures.
Major snowstorms struck Atlantic Canada in mid-March 2015, forcing flight delays and cancellations.
In May, Air Canada expanded its international services at Vancouver International Airport by offering flights to Osaka,Japan. Air Canada rouge also launched a new international service from Montréal to Venice, Italy.
Also in May, WestJet began seasonal service from Halifax to Glasgow, Scotland.
In June, Air Canada further expanded its global network with routes from Toronto/Lester B. Pearson International toAmsterdam, Netherlands and from Montréal to Mexico City, Mexico. Also, Air Canada rouge began a new non-stopdaily seasonal service from Toronto/Lester B. Pearson International Airport to Abbotsford.
In July, WestJet Encore launched new daily non-stop flights from Halifax, Nova Scotia to Deer Lake and Gander,Newfoundland and Labrador, and to Sydney, Nova Scotia. The airline also launched a new daily non-stop servicebetween Moncton, New Brunswick, and Ottawa, Ontario.
In November, Air Canada launched non-stop services from Toronto/Lester B. Pearson International Airport to Delhi,India and to Dubai, United Arab Emirates.
In December, Aeromexico launched a daily non-stop service between Vancouver and Mexico City, Mexico.
In late December, a major snowstorm hit central and eastern Canada causing delays and cancellations in southernOntario and western Quebec, including Toronto, Ottawa, and Montréal airports.
2014
In March, Japanese airline All Nippon Airways began servicing the Canadian market by offering daily, non-stopscheduled flights between Vancouver and Tokyo.
In April, Irish airline Aer Lingus launched a scheduled service between Dublin and Toronto.
In June, WestJet began offering seasonal daily transatlantic flights to Dublin, Ireland, from Toronto and St. John’s,Newfoundland and Labrador.
Also in June, Calgary International Airport opened a new runway. The new runway is one of the longest in Canadaand is capable of landing some of the largest and heaviest aircraft in the world.
In October, Russian carrier Aeroflot cancelled its scheduled service between Moscow and Toronto. That was theironly scheduled service to Canada. Aeroflot had just recently returned to the Canadian market in the summer of 2013.
Statistics Canada – Catalogue no. 51-203-X 27
Appendix I
Glossary
Arriving: Traffic (flights, passengers and cargo) which lands at an airport in Canada.
Cargo: All freight, air express and excess baggage for which any tariff charge is assessed. Air cargo does notinclude mail and provisions, or passenger baggage for which no charge is assessed.
Charter transportation: The transportation of passengers and/or goods by aircraft where a person other than theair carrier operating the aircraft, or its agent, contracts for a block of seats or a portion of cargo capacity for thatperson’s own use or for resale, in whole or in units, to members of the public. The entire capacity of the aircraft isdisposed of in this manner.
Classification in reporting levels (Definitions 2010)
–Level I. This includes every Canadian air carrier that, in the calendar year immediately preceding the reportingyear, transported at least 2 million revenue passengers or at least 400 thousand tonnes of cargo.
–Level II. This includes every Canadian air carrier that, in the calendar year immediately preceding the reportingyear, transported at least 100 thousand, but fewer than 2 million revenue passengers, or at least 50 thousand butless than 400 thousand tonnes of cargo.
–Level III. This includes every Canadian air carrier not classified in reporting level I or II that, in the calendar yearimmediately preceding the reporting year, realized gross revenues of at least 2 million dollars for the provision ofair services for which the air carrier held a licence.
–Level IV. This includes every Canadian air carrier not classified in reporting level I, II or III that, in the calendaryear immediately preceding the reporting year, realized gross revenues of less than 2 million dollars for theprovision of air services for which the air carrier held a licence.
Departing: Traffic (flights, passengers and cargo) which takes off from an airport in Canada.
Deplaned: Traffic (passengers and cargo) which lands and disembarks at an airport in Canada.
Domestic: Traffic travelling between two airports in Canada.
Enplaned: Traffic (passengers and cargo) which embarks and takes off from an airport in Canada.
MCTOW: The maximum certificated take-off weight for aircraft as shown in the aircraft flight manual referred to inthe aircraft’s Certificate of Airworthiness issued by the competent Canadian or foreign authority.
Other international: Traffic between an airport in a foreign country (excluding the United States) and an airport inCanada.
Revenue passenger: A person receiving air transportation from an air carrier for which remuneration is receivedby the air carrier. Air carrier employees or others receiving air transportation against whom token service chargesare levied are not considered as revenue passengers. Infants for whom a token fare is charged are not counted aspassengers.
28 Statistics Canada – Catalogue no. 51-203-X
Air Carrier Traffic at Canadian Airports – 2015
Traffic flow format: Data are captured in a traffic flow format; that is, for each departing flight, both enplaned anddeparting passengers (and cargo) are collected as well as the next stop in the flight itinerary. For arriving flights,deplaned and arriving passengers (and cargo) as well as the last (previous) stop in the flight itinerary are recorded.
Transborder: Traffic between an airport in the United States (including Alaska, Hawaii and Puerto Rico) and anairport in Canada.
Statistics Canada – Catalogue no. 51-203-X 29