Embed Size (px)
Citation preview

ENVIRONMENTAL PRODUCT DECLARATION
TYVEK® FLUID APPLIED WEATHER BARRIER SYSTEMS
DuPont Protection Solutions is a
strategic business unit of DuPont,
bringing dynamic science to the
discovery and development of
innovative products and services for
commercial and residential
construction. DuPont Protection
Solutions is committed to increasing
the performance of building systems
and creating energy efficient and
durable structures. DuPont is the
only manufacturer to offer both fluid
applied and mechanically fastened
building wrap air and water barrier
systems. DuPont™ Tyvek®
commercial air and water barrier
systems help effectively seal the
building envelope. When you choose
DuPont products for your next
project, you get products that meet
the highest performance standards
and are backed by industry-leading
building science and unrivaled
industry support provided by the
DuPont™ Tyvek® Specialists
Network and the DuPont™ Building
Knowledge Center.
DuPont™ Tyvek® Fluid Applied Weather Barrier (WB) Systems offers outstandingprotection for concrete, CMU, and many common sheathing substrates.

TYVEK® FLUID APPLIED WEATHER BARRIER SYSTEMS
AIR BARRIER FOR COMMERCIAL CONSTRUCTION According to ISO 14025
This declaration is an environmental product declaration (EPD) in accordance with ISO 14025. EPDs rely
on Life Cycle Assessment (LCA) to provide information on a number of environmental impacts of products
over their life cycle. Exclusions: EPDs do not indicate that any environmental or social performance
benchmarks are met, and there may be impacts that they do not encompass. LCAs do not typically address
the site-specific environmental impacts of raw material extraction, nor are they meant to assess human health
toxicity. EPDs can complement but cannot replace tools and certifications that are designed to address these impacts
and/or set performance thresholds – e.g. Type 1 certifications, health assessments and declarations, environmental
impact assessments, etc. Accuracy of Results: EPDs regularly rely on estimations of impacts, and the level of accuracy
in estimation of effect differs for any particular product line and reported impact. Comparability: EPDs are not
comparative assertions and are either not comparable or have limited comparability when they cover different life cycle
stages, are based on different product category rules or are missing relevant environmental impacts. EPDs from different
programs may not be comparable.
PROGRAM OPERATOR UL EnvironmentDECLARATION HOLDER DuPontDECLARATION NUMBER 4787059050.101.1
DECLARED PRODUCT Tyvek® Fluid Applied Weather Barrier Systems
REFERENCE PCR IBU Part B: Plastic and elastomer roofing and sealing sheet systems. With UL part A and part B addendum
DATE OF ISSUE June 21, 2017PERIOD OF VALIDITY 5 Years
CONTENTS OF THE DECLARATION
Product definition and information about building physics
Information about basic material and the material’s origin
Description of the product’s manufacture
Indication of product processing
Information about the in-use conditions
Life cycle assessment results
Testing results and verifications
The PCR review was conducted by: Institut und Umwelt e.V.Independent Expert [email protected]
This declaration was independently verified in accordance with ISO 14025 by Underwriters Laboratories
☐ INTERNAL ☒ EXTERNAL Wade Stout, UL Environment
This life cycle assessment was independently verified in accordance with ISO 14044 and the reference PCR by:
Thomas P. Gloria, Industrial Ecology Consultants

Page 2
TYVEK® FLUID APPLIED WEATHER BARRIER SYSTEMS
AIR AND WATER BARRIER FOR COMMERCIAL CONSTRUCTION According to ISO 14025
Product
Product Description
DuPont™ Tyvek® Fluid Applied Weather Barrier (WB) Systems provide building envelope protection against water penetration and air infiltration. Tyvek® Fluid Applied air and water barriers are designed for the unique demands of heavy commercial construction projects.
This innovative system of fluid applied products applies DuPont’s expertise in building and material science to deliver what commercial projects require, including:
– Sustainable Building Design and Construction– Superior Protection– Energy Efficiency– Ease of Installation– Enhanced Durability– Integrated Solutions– Expert Support
The Tyvek® Fluid Applied WB System provides an ideal combination of air infiltration and bulk water penetration resistance with vapor permeability that allows incidental moisture to escape so that the building envelope can dry out. All products within it are low-VOC, for reduced environmental impact, and fully compatible with DuPont™ Tyvek® self-adhered flashing products.
Products in the system include:
– DuPont™ Tyvek® Fluid Applied WB and WB+ Membranes– DuPont™ Tyvek® Fluid Applied Flashing & Joint (F&J) Compound– DuPont™ Sealant for Tyvek® Fluid Applied System– DuPont™ Tyvek® Fluid Applied Flashing – Brush Formulation
Application
Tyvek® Fluid Applied WB Systems are typically installed in commercial buildings where building geometry or the application substrate precludes use of mechanically fastened barrier products.
Technical Data
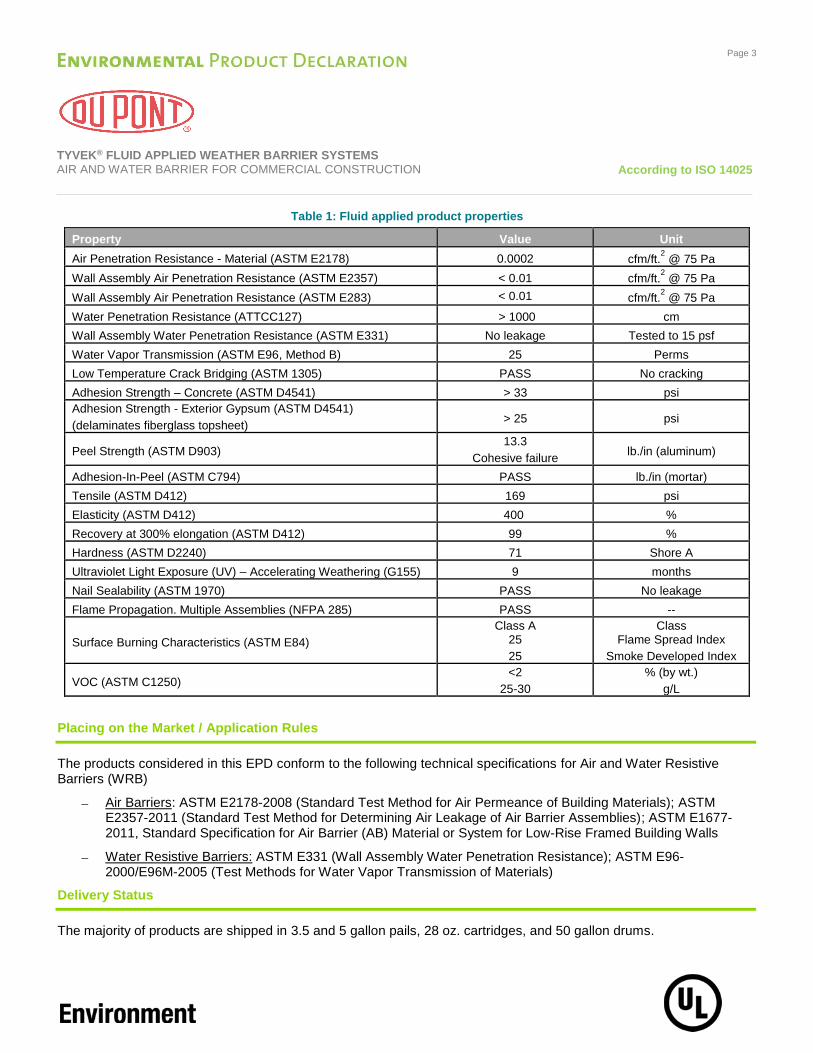
Product properties for the Tyvek® Fluid Applied WB are shown in Table 1. Additional information is available from DuPont’s technical data sheet for the Fluid Applied WB.
Page 3
TYVEK® FLUID APPLIED WEATHER BARRIER SYSTEMS
AIR AND WATER BARRIER FOR COMMERCIAL CONSTRUCTION According to ISO 14025
Table 1: Fluid applied product properties
Property Value Unit
Air Penetration Resistance - Material (ASTM E2178) 0.0002 cfm/ft.2 @ 75 Pa
Wall Assembly Air Penetration Resistance (ASTM E2357) < 0.01 cfm/ft.2 @ 75 Pa
Wall Assembly Air Penetration Resistance (ASTM E283) < 0.01 cfm/ft.2 @ 75 Pa
Water Penetration Resistance (ATTCC127) > 1000 cm
Wall Assembly Water Penetration Resistance (ASTM E331) No leakage Tested to 15 psf
Water Vapor Transmission (ASTM E96, Method B) 25 Perms
Low Temperature Crack Bridging (ASTM 1305) PASS No cracking
Adhesion Strength – Concrete (ASTM D4541) > 33 psi
Adhesion Strength - Exterior Gypsum (ASTM D4541)
(delaminates fiberglass topsheet) > 25 psi
Peel Strength (ASTM D903) 13.3
Cohesive failure lb./in (aluminum)
Adhesion-In-Peel (ASTM C794) PASS lb./in (mortar)
Tensile (ASTM D412) 169 psi
Elasticity (ASTM D412) 400 %
Recovery at 300% elongation (ASTM D412) 99 %
Hardness (ASTM D2240) 71 Shore A
Ultraviolet Light Exposure (UV) – Accelerating Weathering (G155) 9 months
Nail Sealability (ASTM 1970) PASS No leakage
Flame Propagation. Multiple Assemblies (NFPA 285) PASS --
Surface Burning Characteristics (ASTM E84)
Class A 25
25
Class Flame Spread Index
Smoke Developed Index
VOC (ASTM C1250) <2
25-30
% (by wt.)
g/L
Placing on the Market / Application Rules
The products considered in this EPD conform to the following technical specifications for Air and Water Resistive Barriers (WRB)
Air Barriers: ASTM E2178-2008 (Standard Test Method for Air Permeance of Building Materials); ASTM E2357-2011 (Standard Test Method for Determining Air Leakage of Air Barrier Assemblies); ASTM E1677-2011, Standard Specification for Air Barrier (AB) Material or System for Low-Rise Framed Building Walls
Water Resistive Barriers: ASTM E331 (Wall Assembly Water Penetration Resistance); ASTM E96-2000/E96M-2005 (Test Methods for Water Vapor Transmission of Materials)
Delivery Status
The majority of products are shipped in 3.5 and 5 gallon pails, 28 oz. cartridges, and 50 gallon drums.

Page 4
TYVEK® FLUID APPLIED WEATHER BARRIER SYSTEMS
AIR AND WATER BARRIER FOR COMMERCIAL CONSTRUCTION According to ISO 14025
Base Materials / Ancillary Materials
Products in Tyvek® Fluid Applied WB Systems are based on proprietary polymer technology. Formula variations between components is small; therefore an average composition (Table 2) was used for all four products in the system.
Table 2: Fluid applied material composition in mass percent
Material System average Weather Barrier Flashing & Joint
Compound Sealant
Flashing – Brush
Proprietary polymer 41% 25 - 50% 25 - 50% 20 - 30% 25 - 50%
Limestone 20% 15-25% - 30 - 40% -
Calcium carbonate (precipitate and non-precipitate)
16% 10 - 20% 20 - 30% 10 - 20% 20 - 30%
Polyether diol 10% 15 - 25% 15 - 25% 10 - 20% 15 - 25%
Titanium dioxide 6% 2-7% 5 - 10% 1 - 5% 5 - 10%
Diamino silane 3% 1 - 5% 1 - 5% - 1 - 5%
Trimethoxyvinyl silane 2% 1 - 2% 1 - 2% - 1 - 2%
Other < 2% 0.01-2% - 0.1-1% -
No base or ancillary materials are included in the Resource Conservation and Recovery Act (RCRA). For more information on these products, visit the DuPont™ Tyvek® Fluid Applied WB System website.
Manufacture
DuPont™ Tyvek® Fluid Applied WB System products are manufactured by mixing ingredients and packaging for shipment.
Environment and Health during Manufacturing
Where there is potential for airborne exposures in excess of applicable limits, wear NIOSH (National Institute for Occupational Safety and Health) approved respiratory protection. This material does not contain any chemical components with known CAS numbers that exceed the threshold reporting levels established by SARA Title III, Section 313. In this product, crystalline silica is not supplied in the form regulated in California and known to the State of California to cause cancer. PA Right to Know Regulated Chemical(s): titanium dioxide, limestone, calcium carbonate. Product complies with applicable federal, state/provincial and local regulations for waste disposal.
Product Processing/Installation
Tyvek® Fluid Applied WB System products may be sprayed, rolled or brush applied. Application using a pressure roller, such as a Graco Pressure Roller, is preferred.
Packaging
Tyvek® Fluid Applied WB System products are packaged in plastic buckets, drums and cartridges.

Page 5
TYVEK® FLUID APPLIED WEATHER BARRIER SYSTEMS
AIR AND WATER BARRIER FOR COMMERCIAL CONSTRUCTION According to ISO 14025
Condition of Use
DuPont™ Tyvek® Fluid Applied WB should not be used for below grade applications or in applications in which it will be permanently exposed. It should be covered with the facade within nine months to limit UV exposure. Asphalt based adhesives are not recommended for use with this product.
Environment and Health during Use
Spray application could generate harmful vapor; apply in a well-ventilated area and use a NIOSH approved respirator.
Reference Service Life
No use stage modules are reported; as such, declaration of the reference service life (RSL) is voluntary. A RSL has not been declared for the Tyvek® Fluid Applied WB Systems.
Extraordinary Effects
Tyvek® Fluid Applied WB System products conform to the following standards pertaining to extraordinary effects:
Fire
NFPA 285: Standard Fire Test Method for Evaluation of Fire Propagation Characteristics of Exterior Non-Load-Bearing Wall Assemblies Containing Combustible Components
Water
AATCC-127, Hydrostatic Head Test for WRB measuring pressure to failure or time of failure at a given pressure; ASTM E331-2000, Standard Test Method for Water Penetration of Exterior Windows, Skylights, Doors, And Curtain Walls by Uniform Static Pressure
Air Leakage Control
ASTM E 2178-2008, Standard Test Method for Air Permeance of Building Materials; ASTM E 283-2004, Standard Test Method for Determining Rate of Air Leakage Through Exterior Windows, Curtain Walls, and Doors Under Specified Pressure Differences Across the Specimen; ASTM E 2357-2011 Standard Test Method for Determining Air Leakage of Air Barrier Assemblies; ASTM E1677-2011, Standard Specification for Air Barrier (AB) Material or System for Low-Rise Framed Building Walls; ASTM E779-10 Standard Test Method for Determining Air Leakage Rate by Fan Pressurization (whole building).
See the Other Environmental Information section for building energy savings.
Re-use Phase
Fluid applied membrane products, by design, adhere to the underlying substrate; consequently, there is no possibility for reuse.
Disposal
Since Tyvek® Fluid Applied WB System products are not separated from general construction waste at end-of-life, they are assumed to be disposed to landfill.

Page 6
TYVEK® FLUID APPLIED WEATHER BARRIER SYSTEMS
AIR AND WATER BARRIER FOR COMMERCIAL CONSTRUCTION According to ISO 14025
Life Cycle Assessment Calculation Rules
Declared Unit
The declared unit for Tyvek® Fluid Applied WB Systems is 1 square meter (m2). The complete weatherization system consists of weather barrier and flashing and flashing accessories, as well as self-adhered flashing product. Table 3 shows the reference flow of each component required for a base building.
Additional StraightFlash™ products to adjoin roof systems and below-grade water proofing are not considered in this analysis, nor are sealants for window installation.
Table 3: Product breakdown per declared unit
Component Type of Sealing Amount per
declared unit [kg]
Surface density
[kg/m2]
Tyvek® Fluid Applied WB Fluid applied 0.752
0.899 Tyvek® Fluid Applied F&J Fluid applied 0.128
DuPont™ Sealant Fluid applied 0.0086
StraightFlash™ 9” Flashing 0.0098
System Boundary
The analysis includes all modules in the production and installation stages (A1 – A5), along with the transport (C2) and disposal (C4) modules in the end-of-life stage. As such, it represents a “cradle to gate – with options” system boundary. Specific use stage impacts will vary substantially due to climate, building design, regional codes, energy fuel supplies, etc. Therefore, this stage of the life cycle (B1 - B7) is not included in the EPD. However, energy use during the use-stage can be significantly impacted by the reduction in air leakage rate available with the Fluid applied product system relative to alternative construction. An evaluation of a typical US based application for the use stage operational energy use (B6) is presented in the Other Environmental Information section of this EPD.
Table 4: System boundary
Production Installation Use stage End-of-Life Next product
system
Ra
w m
ate
ria
l sup
ply
Tra
nsp
ort
to
ma
nu
factu
rer
Ma
nufa
ctu
ring
Tra
nsp
ort
to
build
ing
site
Insta
llatio
n in
to b
uild
ing
Use
/ a
pp
licatio
n
Ma
inte
nan
ce
Re
pa
ir
Re
pla
ce
me
nt
Re
furb
ishm
en
t
Op
era
tion
al e
ne
rgy u
se
Op
era
tion
al w
ate
r use
De
co
nstr
uction
/ d
em
olit
ion
Tra
nsp
ort
to
end
-of-
life
Wa
ste
pro
ce
ssin
g f
or
reuse
,
recove
ry o
r re
cyclin
g
Dis
posa
l
Re
use
, re
co
ve
ry o
r re
cyclin
g
po
ten
tia
l
A1 A2 A3 A4 A5 B1 B2 B3 B4 B5 B6 B7 C1 C2 C3 C4 D
X X X X X MND MND MND MND MND MND MND MND X MND X MND
X = declared module; MND = module not declared

Page 7
TYVEK® FLUID APPLIED WEATHER BARRIER SYSTEMS
AIR AND WATER BARRIER FOR COMMERCIAL CONSTRUCTION According to ISO 14025
Estimates and Assumptions
The complete weatherization system consists of fluid-applied weather barrier membrane, flashing, and flashing accessories, as well as self-adhered flashing product. A reference flow was estimated using a representative building, “Hotel, Small” prototype (Pacific Northwest National Laboratory, 2015), to determine the relative amounts required of each product. Once the masses of each product needed to seal the representative building were calculated, the numbers were scaled down to the functional unit of 1 m2 using the building’s exterior wall surface area of 1,640 m2. Total reference flow for the representative building was calculated to be 0.899 kg per m2.
Production of the fluid applied weather barrier is based on a confidential proprietary polymer technology and was modeled using a polyether polyol dataset from the GaBi 2016 database as a proxy.
Primary data for the production of 9” StraightFlash™ were not collected since the mass of this component represents approximately 1% of total declared unit mass. Instead, proxy data were used to represent the Tyvek® StraightFlash™ top sheet and butyl adhesive based on product composition.
EPD results omit use-stage impacts, which includes indirect energy consumption—that is, the share of a building’s operational energy consumption that can be causally attributed to the weatherization system. Given that most energy associated with a building’s life cycle is consumed during its operation, indirect energy consumption for the weatherization system is expected to represent a large fraction of the product’s cradle-to-grave environmental burden. This number, however, is also difficult to quantify with reasonable effort or certainty. Therefore, a payback period approach is used to illustrate the effect application of DuPont’s Tyvek® Fluid Applied Weather Barrier System can have on building operational energy consumption in the section Other Environmental Information. Users of this EPD are encouraged to consider Use-Stage impacts in the evaluation of Fluid Applied Weatherization product systems for specific applications.
Cut-off Criteria
No cut-off criteria were applied in this study. All reported data was incorporated and modeled using best available life cycle inventory (LCI) data.
Background Data
Background datasets for upstream and downstream data are representative of the years 2009 – 2015 and were obtained from the GaBi 2016 databases (thinkstep, 2016).
Data Quality
A variety of tests and checks were performed throughout the project to ensure high quality of the completed LCA. Checks included an extensive review of project-specific LCA models as well as the background data used.
Data included first-hand industry data from DuPont in combination with consistent background life cycle inventory information from the GaBi 2016 databases. The data are representative of DuPont™ Tyvek® Fluid Applied products produced in the United States in 2015.
Period under Review
Data are representative of manufacturing during 2015.

Page 8
TYVEK® FLUID APPLIED WEATHER BARRIER SYSTEMS
AIR AND WATER BARRIER FOR COMMERCIAL CONSTRUCTION
According to ISO 14025
Allocation
No allocation was necessary for primary data collected from DuPont’s manufacturing facility.
Comparability
A comparison or an evaluation of EPD results is only possible if all results to be compared were created using the same background data and according to the same guidelines, including EN 15804 (CEN, 2013) and the PCR (IBU, 2014). Additionally, the building context and product-specific performance characteristics should be taken into account. Further, use-stage functionality of the product should be considered, particularly air infiltration reduction potential, the potential to reduce building energy use relative to a baseline building design with no effective air leakage control, as well as the potential to increase levels of envelope leakage control established by common industry standards.
Life Cycle Assessment Scenarios and Additional Technical Information
Information relevant to the life cycle modules included in this study are summarized in the following tables.
Table 5: Transport to building site (A4)
Property Value Unit
Liters of fuel 39 L / 100 km
Transport distance 800 km
Capacity utilization (including empty runs) 78 %
Table 6: Installation at building site (A5)
Property Value Unit
Material loss 5 %
Packaging waste 0.072 kg
VOC emissions to air 0.019 kg
Table 7: End-of-life (C1-C4)
Property Value Unit
Collected as mixed construction waste 0.881 kg
Landfilling 0.881 kg

Page 9
TYVEK® FLUID APPLIED WEATHER BARRIER SYSTEMS
AIR AND WATER BARRIER FOR COMMERCIAL CONSTRUCTION
According to ISO 14025
Life Cycle Assessment Results
Results for 1 m2 of installed Tyvek® Fluid Applied Weather Barrier Systems are presented below.
ENVIRONMENTAL IMPACTS CML 2001 (Apr 2013)
Parameter Unit A1-A3 A4 A5 C2 C4 D
GWP [kg CO2 eq.] 3.50E+00 5.83E-02 2.30E-01 2.14E-03 3.95E-02 -1.35E-03
ODP [kg CFC-11 eq.] 3.57E-10 4.80E-13 3.62E-07 1.76E-14 7.56E-13 -4.08E-13
AP [kg SO2 eq.] 9.61E-03 2.16E-04 6.48E-04 7.94E-06 1.71E-04 -3.56E-06
EP [kg PO43 eq.] 1.17E-03 5.57E-05 1.12E-04 2.05E-06 2.18E-05 -2.28E-07
POCP [kg C2H4 eq.] 1.19E-03 2.57E-05 6.92E-03 9.46E-07 1.73E-05 -2.32E-07
ADPE [kg Sb eq.] 1.53E-05 8.72E-09 7.81E-07 3.21E-10 1.51E-08 -2.44E-10
ADPF [MJ] 6.64E+01 8.19E-01 4.29E+00 3.01E-02 5.97E-01 -1.60E-02
TRACI 2.1
Parameter Unit A1-A3 A4 A5 C2 C4 D
GWP [kg CO2 eq.] 3.50E+00 5.83E-02 2.30E-01 2.14E-03 3.95E-02 -1.35E-03
ODP [kg CFC-11 eq.] 3.80E-10 5.10E-13 3.62E-07 1.88E-14 8.04E-13 -4.34E-13
AP [kg SO2 eq.] 9.96E-03 2.83E-04 7.46E-04 1.04E-05 1.84E-04 -3.39E-06
EP [kg N eq.] 9.74E-04 2.63E-05 8.78E-05 9.67E-07 1.02E-05 -1.57E-07
SFP [kg O3 eq.] 1.48E-01 8.99E-03 6.19E-02 3.31E-04 3.58E-03 -3.38E-05 GWP = Global warming potential; ODP = Depletion potential of the stratospheric ozone layer; AP = Acidification potential of land and water; EP = Eutrophication potential; POCP = Formation potential of tropospheric ozone photochemical oxidants; ADPE = Abiotic depletion potential for non-fossil resources; ADPF = Abiotic depletion potential for fossil resources; SFP = Smog formation potential
RESOURCE USE
Parameter Unit A1-A3 A4 A5 C2 C4 D
PERE [MJ] 3.46E+00 1.36E-02 1.94E-01 5.01E-04 3.88E-02 -1.28E-03
PERM [MJ] 2.68E-01 – 1.34E-02 – – –
PERT [MJ] 3.73E+00 1.36E-02 2.07E-01 5.01E-04 3.88E-02 -1.28E-03
PENRE [MJ] 5.19E+01 8.23E-01 3.31E+00 3.03E-02 6.13E-01 -1.96E-02
PENRM [MJ] 1.81E+01 – 1.18E+00 – – –
PENRT [MJ] 7.00E+01 8.23E-01 4.50E+00 3.03E-02 6.13E-01 -1.96E-02
SM [kg] – – – – – –
RSF [MJ] – – – – – –
NRSF [MJ] – – – – – –
FW [m³] 4.87E+01 1.67E-01 2.59E+00 6.14E-03 9.43E-02 -5.85E-03 PERE = Use of renewable primary energy excluding renewable primary energy resources used as raw materials; PERM = Use of renewable primary energy resources used as raw materials; PERT = Total use of renewable primary energy resources; PENRE = Use of non-renewable primary energy excluding non-renewable primary energy resources used as raw materials; PENRM = Use of non-renewable primary energy resources used as raw materials; PENRT = Total use of non-renewable primary energy resources; SM= Use of secondary material; RSF = Use of renewable secondary fuels; NRSF = Use of non-renewable secondary fuels; FW = Use of net fresh water
OUTPUT FLOWS AND WASTE CATEGORIES
Parameter Unit A1-A3 A4 A5 C2 C4 D
HWD [kg] 6.12E-08 1.05E-09 4.09E-09 3.85E-11 1.17E-09 6.12E-08
NHWD [kg] 4.36E+01 1.04E+00 2.66E+00 3.84E-02 6.28E-01 4.36E+01
RWD [kg] 1.43E-03 1.73E-06 8.11E-05 6.37E-08 6.23E-06 1.43E-03
CRU [kg] – – – – – –
MFR [kg] – – – – – –
MER [kg] – – – – – –
EEE [MJ] – – 6.20E-03 – – –
EET [MJ] – – 2.92E-03 – – – HWD = Hazardous waste disposed; NHWD = Non-hazardous waste disposed; RWD = Radioactive waste disposed; CRU = Components for re-use; MFR = Materials for recycling; MER = Materials for energy recovery; EEE = Exported electrical energy; EET = Exported thermal energy

Page 10
TYVEK® FLUID APPLIED WEATHER BARRIER SYSTEMS
AIR AND WATER BARRIER FOR COMMERCIAL CONSTRUCTION
According to ISO 14025
Interpretation
The results represent the cradle-to-gate and end-of-life environmental performance of Tyvek® Fluid Applied WB Systems. For most impact categories, the manufacturing stage (modules A1-A3) is the dominant contributor to life cycle impact, with the exception of ozone depletion and photochemical ozone creation results. Potential ozone depletion impact is almost entirely due to chloromethane (a.k.a. methyl chloride) emissions as this material is used as a solvent in butyl adhesive production (for the StraightFlash™). Fugitive NMVOC (non-methane volatile organic compound) emissions from the fluid applied products are a key contributor to potential photochemical ozone creation impact. Emissions during installation also contribute to smog formation potential (TRACI 2.1), but manufacturing is still a key contributor to this metric due to differences in impact models—specifically, due to differences in characterization factors for unspecified NMVOCs and nitrogen oxides. Disposal (module C4) has a relatively small impact across all environmental indicators.
Figure 1: CML 2001 (April 2013) impact category results
Requisite Evidence
No requisite evidence is required for Tyvek® Fluid Applied WB Systems.
Other Environmental Information
Building Use Stage Benefits
The EPD analysis focuses on the production, distribution, installation, and disposal of the Tyvek® Fluid Applied Weather Barrier System. However, it does not provide a complete picture of the overall environmental impact associated with the weatherization system as it omits the building use stage. While DuPont™ Tyvek® Fluid Applied Weather Barrier Systems itself does not consume energy, its use can reduce building air leakage rate, which in turn
-20% 0% 20% 40% 60% 80% 100%
Abiotic depletion potential, fossil
Abiotic depletion, elements
Photochemical ozone creation
Eutrophication
Acidification
Ozone depletion
Global warming
A1-A3: Product stage A4: Distribution A5: Installation C2: Transport to disposal C4: Disposal D: Credits

Page 11
TYVEK® FLUID APPLIED WEATHER BARRIER SYSTEMS
AIR AND WATER BARRIER FOR COMMERCIAL CONSTRUCTION
According to ISO 14025
lowers building energy consumption required for space heating and cooling. The extent to which weather barrier use reduces building energy consumption can exceed the energy needed to manufacture, install, and dispose the barrier. Therefore, use of the weather barrier to reduce air leakage rates can have a net positive effect on a building’s environmental footprint.
A payback period approach is used to compare the upfront “energy cost” of that DuPont™ Tyvek® Fluid Applied Weather Barrier System with the “energy savings” due to reduction in building operational energy consumption. A U.S. average case is used to estimate the time needed to “payback” the energy and greenhouse gas impacts associated with manufacturing, distributing, installing and disposing of the product system. For payback times shorter than the building service life, the use of a weather barrier system would result in net impact reductions in the building’s environmental footprint relative to a baseline option without such a system.
Since energy requirements will vary based on numerous factors, including building design, regional weather, temperature control systems, building heating and cooling sources, code requirements, etc. the calculations are performed for a U.S. average case, using average energy savings across all climates for a representative building. The “Hotel, Small” prototype or a similar building is used as a representative building to estimate space heating and cooling energy savings, as well as to calculate weatherization system energy demand.
The small hotel characteristics are shown in Table 8. Based on these characteristics, 1,640 m2 of weatherization system are required to seal the building envelope. This is associated with a total primary energy demand of 131 GJ (=
79.9 MJ/m2 × 1,640 m2).
Table 8: Small hotel building characteristics
Property Value (Imperial) Value (metric)
Building height 38 ft. 11.6 m
Number of stories 4 4
Floor space 43,200 ft.2 4,010 m2
Exterior wall area (covered by membrane system) 17,700 ft. 2 1,640 m2
Estimating reduction in space heating and cooling energy consumption associated with reduction in air leakage is somewhat more complicated due to lack of data and appropriate guidelines for air infiltration input into whole-building energy simulation models. An overview of the calculation approach is as follows:
1) Define air leakage rates for a baseline building and an airtight building as would be the case for a building using the Tyvek® Fluid Applied Weather Barrier system.
2) Using whole building energy simulations, calculate percent energy savings for an average commercial building, based on meeting different air leakage rates defined in (1).
3) Translate percent energy savings to an absolute value based on commercial sector annual energy consumption for space heating and cooling. Use U.S. average data for building design, climatic assumptions, and fuel supply for both heating and cooling systems.
4) Calculate energy savings per 1,000 square feet of building floor space based on total floor space for the commercial sector.
5) Calculate energy savings for the representative building based on results from (4) and building floor area from Table 8.
6) Energy savings for the representative building can then be compared with the weatherization system energy demand to calculate the energy payback period.

Page 12
TYVEK® FLUID APPLIED WEATHER BARRIER SYSTEMS
AIR AND WATER BARRIER FOR COMMERCIAL CONSTRUCTION
According to ISO 14025
7) A similar methodology is used to calculate the “payback” period for greenhouse gas
These calculations are briefly summarized below.
(1) The following air leakage rates were used for this analysis:
– Baseline building: 1.00 CFM/SF @ 75Pa (0.3 in. w.c.) based on whole building tests of existing buildings, measured as part of USACE (US Army Corps of Engineers) air barrier program
– Airtight building: two different standards were used: 0.40 CFM/SF @ 75Pa (0.3 in. w.c.) based on ASHRAE 90.1-2013 Appendix G, and 0.25 CFM/SF @ 75Pa (0.3 in. w.c.) based on USACE requirements.
It is possible to achieve Whole Building air tightness using the Tyvek® Fluid Applied Weather Barrier system that exceeds the 0.25 CFM/SF @ 75 Pa standard. If a whole building airtightness test results are available for a given building, the actual value could be used in the energy model to calculate the energy savings for a specific project.
(2) Whole building energy simulation data from (Zhivov, 2013) provides percent energy savings for the two air leakage
rates 0.25 CFM/SF and 0.4 CFM/SF as compared to a baseline air leakage rate of 1.0 CFM/SF (all measured at 75 Pa). This information is then combined with building construction volume for each ASHRAE climate zone (Jarnagin & Bandyopadhyay, 2010) in order to calculate weighted average energy savings across all climate zones (shown in Table 9, second column).
Table 9: Annual primary energy consumption and energy savings for ALL US commercial buildings
Air tightness standard @ 75 Pa
Weighted % energy savings
Commercial energy end use for space heating & cooling [1015 Btu]
Commercial energy savings for space heating and cooling [1015 Btu]
2010 primary 2015 primary 2010 primary 2015 primary
1.0 CFM/SF 0% (baseline) 5.77 4.13 0 0
0.4 CFM/SF 6.5% 5.77 4.13 0.38 0.27
0.25 CFM/SF 12.3% 5.77 4.13 0.71 0.51
(3) Next, total energy used for space heating and cooling for all commercial buildings was obtained from the 2011
Buildings Energy Data Book (US Department of Energy, 2012). Energy used for space heating and cooling was calculated based on commercial sector energy consumption in BEDB Table 3.1.3 and on percent of that energy used for space heating and cooling in BEDB Tables 3.1.4 and 3.1.5. Calculated percent energy savings was then applied to space heating and cooling energy consumption to calculate the amount of energy saved. Results based on BEDB 2010 calculations and 2015 projections are shown in Table 9.
(4) Commercial building primary energy savings associated with space heating and cooling from Table 9 are then
divided by the total floor area of all commercial buildings (also from (US Department of Energy, 2012)) to calculate energy savings per 1,000 SF of floor space. These normalized results are shown in Table 10.

Page 13
TYVEK® FLUID APPLIED WEATHER BARRIER SYSTEMS
AIR AND WATER BARRIER FOR COMMERCIAL CONSTRUCTION
According to ISO 14025
Table 10: Annual energy savings for representative building
Air tightness standard @ 75 Pa
Floor space [109 SF]
Commercial energy savings for space heating and cooling, normalized by
floor area [MMBtu / 1,000 SF]
Representative building energy savings for space heating and
cooling [MMBtu / yr.]
2010 2015 2010 primary 2015 primary 2010 primary 2015 primary
1.0 CFM/SF 81.1 84.1 0 0 0 0
0.4 CFM/SF 81.1 84.1 4.6 3.2 200 140
0.25 CFM/SF 81.1 84.1 8.8 6.0 380 260
(5) Finally, energy savings associated with the representative building are calculated based on the representative building’s floor space in Table 8. The results are shown in the last two columns in Table 10 for 2010 and 2015.
(6) Energy payback period is calculated based on the weatherization system energy demand as it compares to annual
energy savings from Table 10. Results in Table 11 indicate that payback period is on the order of months. Therefore, most of the energy required to manufacture, install, and dispose DuPont™ Tyvek® Fluid Applied Weather Barrier Systems is recovered within the first year of building use due to lower space heating and cooling energy consumption.
Table 11: Energy payback period calculation for small hotel building prototype
Air tightness standard @ 75
Pa
Product energy
demand [MJ]
Weighted % energy savings
2010 building energy savings
2010 payback period
2015 building energy savings
2015 payback period
1.0 CFM/SF 0 0% (baseline) 0 GJ N/A 0 GJ N/A
0.4 CFM/SF 131 GJ 6.5% 210 GJ 7.5 months 150 GJ 11 months
0.25 CFM/SF 131 GJ 12.3% 400 GJ 3.9 months 270 GJ 5.7 months
(7) Likewise, global warming potential payback period can be calculated using the same methodology (since energy savings lead to greenhouse gas emissions reduction) and the results are summarized in Table 12. Total CO2 emissions used to calculate payback period were obtained from Tables 3.4.2 and 3.4.3 in the Building Energy Data Book (US Department of Energy, 2012).
Table 12: Global warming payback period calculation for small hotel building prototype
Air tightness standard @ 75
Pa
Product carbon
emissions [kg CO2e]
Weighted % energy savings
2010 building GWP reduction [kg CO2e / yr.]
2010 payback period
2015 building GWP reduction [kg CO2e / yr.]
2015 payback period
1.0 CFM/SF 0 0% (baseline) 0 N/A 0 N/A
0.4 CFM/SF 6,280 6.5% 10,800 7.0 months 7,300 10 months
0.25 CFM/SF 6,280 12.3% 20,300 3.7 months 13,800 5.5 months
The potential global warming impact during manufacture, installation, and disposal of DuPont’s Tyvek® Fluid Applied Weather Barrier Systems is “recovered” within the first year of building use due to lower space heating and cooling energy consumption. Since energy savings and global warming potential reduction from building envelope airtightness

Page 14
TYVEK® FLUID APPLIED WEATHER BARRIER SYSTEMS
AIR AND WATER BARRIER FOR COMMERCIAL CONSTRUCTION According to ISO 14025
are expected throughout the building service life (typically > 50 years), Tyvek® Fluid Applied WB Systems are anticipated to have a net environmental benefit over the remaining of the building life.
Other Air and Water Barrier Benefits
In addition to energy savings which were quantified in this analysis through whole building energy simulations, Tyvek® systems provide substantial additional benefits by preventing risks associated with water intrusion and air infiltration. Potential risks associated with water intrusion can range from health risks (due to mold and dampness which could affect the IEQ), to building envelope durability/materials degradation (such as rotting of wood or corrosion of metals), to materials performance (such as loss of insulation R-value). Potential risks associated with air infiltration include impact on the occupant’s comfort (e.g. cold drafts) and transport of outdoor contaminants into the conditioned space, affecting the IEQ. A continuous WRB system is a cost-effective measure for avoiding risks associated with water intrusion and air infiltration. While these additional WRB benefits are more difficult to quantify because moisture intrusion and air infiltration events are unpredictable, the impact on building envelope durability/longer building life (which will obviously impact materials resources), as well as comfort and health of the building occupants could be significant.
References
CEN. (2013). EN 15804:2013-05 Sustainability of construction works -- Environmental Product Declarations -- Core rules for the product category of construction products.
IBU. (2014). PCR Guidance - Texts for Building-Related Products and Services: Part B: Requirements on the EPD for Plastic and elastomer roofing and sealing sheet systems. Berlin.
IBU. (2014). Product Category Rules for Building-Related Products and Services: Part A: Calculation Rules for the Life Cycle Assessment and Requirements on the Project report. Königswinter.
ISO. (2006). ISO 14040: Environmental management – Life cycle assessment – Principles and framework. Geneva: International Organization for Standardization.
ISO. (2006). ISO 14044: Environmental management – Life cycle assessment – Requirements and guidelines. Geneva: International Organization for Standardization.
Jarnagin, R. E., & Bandyopadhyay, G. K. (2010). Weighting Factors for the Commercial Building Prototypes used in the Development of ANSI/ASRAE/IENSA. PNNL, Richland, WA.
Pacific Northwest National Laboratory. (2015). ANSI/ASHRAE/IES Standard 90.1 Prototype Building Model Package, Hotel Small. Washington, D.C.: US DOE.
thinkstep. (2016). GaBi LCA Database Documentation. Retrieved from thinkstep AG: http://www.gabi-software.com/international/databases/gabi-databases/
US Department of Energy. (2012). 2011 Buildings Energy Data Book.
Zhivov, A. (2013). Air Tightness in New and Retrofitted US Army Buildings. ABAA Symposium. Clearwater, FL.

Page 15
TYVEK® FLUID APPLIED WEATHER BARRIER SYSTEMS
AIR AND WATER BARRIER FOR COMMERCIAL CONSTRUCTION According to ISO 14025
Contact Information
Study Commissioned by
DuPont 1-800-44-TYVEK
LCA Practitioner
thinkstep, Inc. +1 [email protected]://www.thinkstep.com