Embed Size (px)
Citation preview

This is a copy of the accepted author manuscript.
Full bibliographic reference:
DOI:
Eprints: 379179
ePrints: The University of Southampton Institutional Research Repository ePrints Soton
See ePrints for user guides and documentation: http://eprints.soton.ac.uk/
“Nursing consultations and control of diabetes in general practice: retrospective
observational study”
This version is made available in accordance with publisher policies. It has been peer reviewed and accepted for publication, but may not incorporate changes made during the final stages of
publication. Please cite only the definitive published version using the reference above.
Please scroll down to view the document
Nursing consultations and control of diabetes in general practice: retrospective observational study.
Trevor Murrells, MSc, BSc, Statistician/Research Data Manager, National Nursing Research
Unit, Florence Nightingale Faculty of Nursing and Midwifery, King’s College London, London, UK
Jane Ball, BSc, Principal Research Fellow, NIHR CLAHRC Wessex, University of Southampton,
Southampton, UK
Jill Maben, PhD, MSc, BA, RN, Professor of Nursing Research, Director, National Nursing
Research Unit, Florence Nightingale Faculty of Nursing and Midwifery, King’s College London,
London, UK
Mark Ashworth, DM, Clinical Senior Lecturer, Primary Care and Public Health Sciences, Faculty
of Life Sciences and Medicine, King’s College London, London, UK
Peter Griffiths, PhD, BA, RN, FEANS, FHEA, Professor of Health Services Research, NIHR
CLAHRC Wessex, University of Southampton, Southampton, UK
Address for correspondence
Trevor Murrells, National Nursing Research Unit, Florence Nightingale Faculty of Nursing and
Midwifery, James Clerk Maxwell Building, 57 Waterloo Road, London SE1 8WA, UK;
E-mail: [email protected]
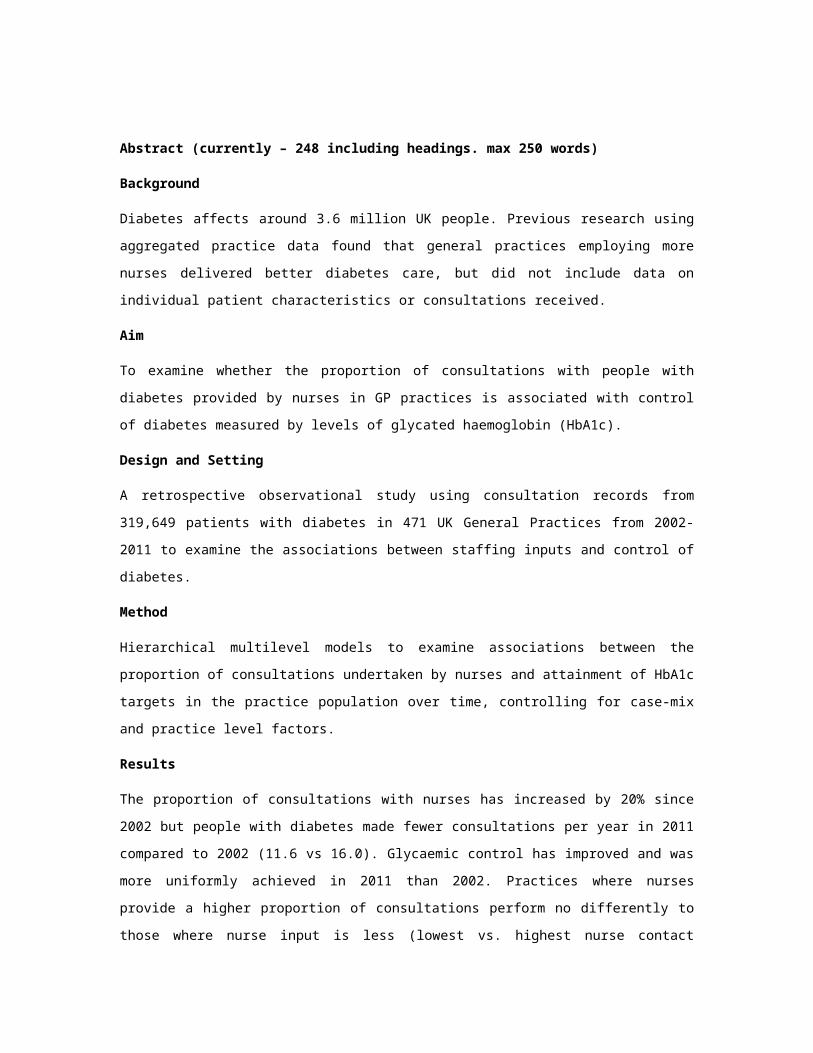
Abstract (currently – 248 including headings. max 250 words)
Background
Diabetes affects around 3.6 million UK people. Previous research using aggregated practice data
found that general practices employing more nurses delivered better diabetes care, but did not
include data on individual patient characteristics or consultations received.
Aim
To examine whether the proportion of consultations with people with diabetes provided by nurses
in GP practices is associated with control of diabetes measured by levels of glycated
haemoglobin (HbA1c).
Design and Setting
A retrospective observational study using consultation records from 319,649 patients with
diabetes in 471 UK General Practices from 2002-2011 to examine the associations between
staffing inputs and control of diabetes.
Method
Hierarchical multilevel models to examine associations between the proportion of consultations
undertaken by nurses and attainment of HbA1c targets in the practice population over time,
controlling for case-mix and practice level factors.
Results
The proportion of consultations with nurses has increased by 20% since 2002 but people with
diabetes made fewer consultations per year in 2011 compared to 2002 (11.6 vs 16.0). Glycaemic
control has improved and was more uniformly achieved in 2011 than 2002. Practices where
nurses provide a higher proportion of consultations perform no differently to those where nurse
input is less (lowest vs. highest nurse contact tertile OR [95%CI]: HbA1c ≤ 53 mmol/mol (7%)
2002 1.04 [0.87 – 1.25], 2011 0.95 [0.87 – 1.03]; HbA1c ≤ 86 mmol/mol (10%) 2002 0.97 [0.73 –
1.29], 2011 0.95 [0.86 – 1.04]).

Conclusion
Practices which primarily use GP’s to deliver diabetes care might release significant resources
with no adverse effect by switching their services towards nurse-led care.
Word: 2,660 21-4-2015 (includes all text from INTRODUCTION to end of the DISCUSSION
excluding table and figure headings)
Keywords (up to six keywords - MeSH headings).
General Practice; Nurses; Diabetes Mellitus; Health Workforce; Nursing Staff; Primary health care
How this fits (in 4 short sentences – what was previously known, what this adds, relevance to
clinicians)
The relationship between nurse staffing and patient outcomes has been extensively
explored in acute hospital care, but little research has been undertaken in primary care.
A previous study used aggregated practice data and found that general practices
employing more practice nurses delivered better care for people with diabetes.
This study goes further by including data on individual patient characteristics and on the
consultations undertaken by registered nurses, doctors and other staff.
This study shows that there may be considerable scope for increasing the amount of
diabetes care that is delivered by nurses.
INTRODUCTION
Diabetes prevalence has increased dramatically over the last ten years and it is estimated to
affect 3.6 million people in the UK1 and cost the NHS at least £10 billion a year2. Primary care has
become the focal point with more diabetes care now taking place in GP practices 3,4. In order to
improve the quality of chronic disease management in primary care, a pay for performance
scheme, the quality and outcomes framework (QOF), was introduced in 2004/5 with targets and
incentives for improving the quality of care for people with diabetes5. Much of the work involved in
delivering results against the QOF indicators has been delegated by GP’s to nurses6. There was
a steady increase in the number of nurses employed in general practice until 2007 when numbers
declined before rising again in 2010 and then remaining relatively stable thereafter7,8. The
proportion of consultations undertaken by nurses has increased steadily from 1998 onwards9.
Several studies have outlined the changes to practice nurses’ workload and their increased role
in caring for those with chronic conditions such as diabetes 10,11,12. Models of nurse-led diabetes
care have been advocated and positively evaluated in a range of settings including primary
care12. Clinical trials have shown that nurses provide comparable high quality primary care that is
complementary to that of their medical colleagues14,15. Some have argued that there is
considerable scope to further increase the amount of primary care delivered by nurses16,17 but the
benefits of substitution are disputed18.
Evidence of the impact on the quality of diabetes care of a widespread and routine increased
nursing contribution is scant. Our previous research used practice level data derived from the
QOF to examine several long-term conditions including diabetes, and found that overall, practices
with higher levels of practice nurse staffing relative to their list size were associated with improved
practice performance19. But findings based on aggregated practice level data are constrained;
there is limited ability to risk adjust for individual patient characteristics.
The aim of this study was to examine whether different patterns of workforce activity in primary
care are associated with variation in the level of diabetes control as measured by glycated
haemoglobin (HbA1c). Specifically we examined the extent to which people with diabetes had
consultations with registered nurses at the practice level, as opposed to general practitioners, and
whether there was any association between this and meeting glycaemic control thresholds.

METHOD
A retrospective observational design using routinely collected data to examine the associations
between staffing inputs at the practice level and glycaemic control at the patient level.
Data Source
We used data derived from electronic patient records from the 556 general practices contributing
to the ‘The Health Information Network’ (THIN) database. At the time of the study the database
covered 3.7 million active patients in the United Kingdom (UK) (6% of all patients). THIN has a
similar demographic profile and diabetes prevalence to the UK population although THIN has
more people from affluent areas and fewer younger people20.
Selection of people with diabetes and GP practices from THIN
People registered with a THIN GP practice anytime up to the 16th May 2012 with a diabetes
related entry in their medical record or health details were initially selected (n=406,632). Diabetes
was clearly indicated for 319,649 (79%) of those people based on a combination of the following:
presence of a diagnosis, annual review, HbA1c reading 6.5% or over and diabetes therapies. A
review of a sub-sample of the 86,551 (21%) people excluded suggested that the selection had
been successfully applied.
The selection criteria for GP practices were then applied to the dataset:
For each year practices had to meet the following criterion:
i. Complete mortality data.
ii. At least 90% of all HbA1c measurements recorded in, or transformable into, percentage
units.
iii. At least 90% of consultations could be associated with a staff member with known clinical
role (not administrative staff).
The number of GP practices selected increased from 2002 to 2009 and then declined (Table 1).
The number of people in the dataset with diabetes increased from 51,493 in 2002 to 150,023 in
2011 (Table 1).
Measures
Workforce input – staff consultations

Consultations were defined as direct contact with people (e.g. surgery, clinic, home visit,
telephone conversations). The staff group who made an entry for the consultation was obtained
from the medical, health details and medication records (practice prescribed therapies). Each
consultation was attached to a staff group code (e.g. doctor only, doctor and practice nurse).
Three measures of workforce activity were derived:
mean number of times people with diabetes were seen by a healthcare professional (per
annum).
percentage of consultations annually involving practice nurses.
total time spent in consultations (minutes) annually and mean consultation length.
Outcome - Glycaemic control
The proportion of people with diabetes in each practice achieving a certain level of glycaemic
control (measured using Hb1Ac) was our main outcome measure (‘population attainment’). The
HbA1c reading closest to 1st July was selected for each person with diabetes for each calendar
year from 2002 to 2011. Each percentage HbA1c reading was then categorised according to
whether it met a lower (≤ 53 mmol/mol (7%)) or upper (≤ 86 mmol/mol(10%)) threshold. These
lower and upper limits span the range of thresholds used since QOF was introduced in 2004. The
53 mmol/mol (7%) threshold was used in 2009/10 and 2010/11, and the 86 mmol/mol (10%)
threshold from 2004/5 to 2008/921,22.
Statistical analysis
A multilevel modelling approach23 was used to test the association between a person with
diabetes meeting the HbA1c threshold and the percentage of practice consultations with a nurse.
Because the amount of contact is largely determined by clinical need we analysed associations
between outcomes at the person level and workforce inputs at the practice level. Individual
consultations are likely to be driven primarily by patient factors whereas activity at the practice
level is more reflective of a practice’s approach to care delivery, once patient characteristics are
taken into account.
As the underlying population has changed due to earlier diagnosis and treatment, data were
analysed by year, rather than longitudinally. A two level random intercepts hierarchical logistic
regression model was fitted with people nested within practice.
Each model included the following variables:

Patient level: age, gender, ethnicity, case severity (primary care equivalent of the
Charlson Index24, obesity, social deprivation25 (Townsend).
Practice level: list size, diabetes prevalence, UK country.
staff activity: percentage of consultations with a nurse and mean number of consultations
with a healthcare professional annually.
The following variables were used in the model in their standardised form (mean zero, standard
deviation of one): age, case severity, practice list size, prevalence and consultations. For each
year, models were fitted to the lower (≤ 53 mmol/mol (7%)) and upper (≤ 86 mmol/mol (10%))
HbA1c threshold using SAS GLIMMIX26.
RESULTS
The mean number of people with diabetes in each practice increased from 3.0% of all patients
registered in 2002 to 4.8% in 2011 and the number with at least one other comorbidity increased
from 79.5% in 2002 to 88.2% in 2011. The total annual number of consultations in each practice
with people that have diabetes increased by 12% from 3900 in 2002 to 4376 in 2011. Nurses
increased their activity much more than doctors during this period – a 20% increase compared to
no change for GP’s. In 2002 70% of consultations were undertaken by doctors, falling to 64% in
2011. Meanwhile the mean proportion of consultations undertaken by nurses in each practice has
increased slightly (from 31% to 32%)(Table 1) and those by other healthcare professionals from
less than 3% to 8%. Variation between practices in the use of nurses has also increased. In 2002
for practices in the bottom ten percent of nurse activity, 15% or fewer contacts involved a nurse
whilst in the top ten percent this rose to 46% or more. For 2011 it was 15% and 50% respectively.
These changes are explored in more detail Figure 1.
Table 1: Population achievement for HbA1c by threshold and level of practice nurse involvement
Figure 1: Proportion of consultations undertaken by doctors and nurses at the practice level in 2002 and 2011
Activity levels have not increased as sharply as the number of people with diabetes, so although
both doctors and nurses are providing more consultations, each person with diabetes received

fewer consultations in 2011 (11.6) than in 2002 (16.0). The mean duration of a consultation with
a doctor increased from 10.2 in 2002 to 11.1 minutes in 2011 and for nurses from 11.2 to 12.8
minutes.
The mean number of times people had their diabetes reviewed fell from 1.23 in 2002 to 1.05 in
2007 before rising again to 1.31 in 2011. The corresponding means for reviews by doctors were
0.48, 0.31 and 0.34 and for nurses 0.72, 0.71 and 0.90. The net result was an increase in the
proportion of diabetes reviews undertaken by nurses, from 58% in 2002 to 69% in 2011.
Glycaemic control improved considerably between 2002 and 2004. Since then improvement
slowed, reaching a plateau in 2005 for the upper threshold (≤ 86 mmol/mol (10%)) and in 2009 for
the lower threshold (≤ 53 mmol/mol (7%)) (Figure 2). There was more variation between
practices, after adjustment, in 2002 than in subsequent years (2003-2011) for both the lower and
higher thresholds (Residual σ2, Tables 2 and 3).
Figure 2: HbA1c population achievement by threshold
Table 2: Multilevel model examining level of nurse contact and meeting the HbA1c ≤ 53 mmol/mol (7%) threshold
Table 3: Multilevel model examining level of nurse contact and meeting the HbA1c ≤ 86 mmol/mol (10%) threshold
The proportion of nurse contact at the practice level was categorised into three groups of
approximately equal size: low (< 26.0%), medium (26.0 – 35.3%) and high (35.4% and over)
using 2002 as the reference year. The proportion of people attaining the ‘tight’ (HbA1c ≤ 53
mmol/mol (7%)) threshold was consistently higher in practices with a high proportion of nurse
contact for every year from 2002 to 2007. However, in absolute terms the differences were
generally small. The difference between the high and low contact groups for the higher threshold
(HbA1c ≤ 86 mmol/mol (10%)) was more apparent in the earlier period with maximum advantage
of 3.5% (2003) and consistently in excess of 1% before 2007 (Table 1).
After risk adjustment at the person and practice level, practices in which people had a higher
proportion of nurse contact had significantly more people meeting both the lower (≤53 mmol/mol
(7%)) and higher threshold (≤ 86 mmol/mol (10%)) in 2003 (Tables 2 and 3). For all other years

the proportion of people meeting either threshold did not vary significantly across nurse contact
groups.
Practices with a higher mean annual number of consultations with a healthcare professional had
significantly fewer patients meeting both the lower and higher threshold for 2002 and 2003
(Tables 2 and 3). This association was stronger for the higher threshold (2002: P=0.007, 2003:
P<0.001) than the lower threshold (2002: P=0.015, 2003: P=0.047). For the lower threshold the
association has changed, with higher numbers of consultations reducing the chances of the
threshold being met in the first half of the period (2002 – 2006) and increasing the chances of the
threshold being met in the second half (2007 – 2011). This association was statistically significant
in 2011 (P=0.020) and close to significance in 2010 (P=0.066).
DISCUSSION
Summary
Glycaemic control for patients in UK general practice has improved over the last ten years and is
now more uniformly achieved across practices, in spite of the large increase in recorded
prevalence of diabetes. Much of the variation between practices in the population achievement of
glycaemic control is related to differences in the patient populations served.
As diabetes has become increasingly prevalent, proportionally more care is being delivered and
managed by nurses, although the changes have not been as substantial as might have been
supposed. The amount of diabetes care delivered by nurses varies substantially between
practices from 15% or less of all contacts in the bottom ten percent of practices, in terms of nurse
activity, to almost a half of all contacts in the top ten percent. People with diabetes now have
fewer consultations per year than in the past, but more of them are undertaken by nurses who
provide slightly longer consultations than GPs. Practices where nurses undertake a higher
proportion of consultations with people with diabetes perform no differently to those where nurse
input is less.
In the early part of the decade practices undertaking higher numbers of consultations were less
likely to meet the QOF thresholds, suggesting practices may have been ‘playing catch-up’.
Practices where people were already meeting QOF thresholds could maintain those levels
without increasing their work activity. From the middle of the decade onwards the usual
expectation of higher level of work activity and meeting the thresholds took hold.
Strengths and limitations
This study analysed individual patient data from practices that care for 6% of the UK population.
Prevalence and consultation rates in this study are similar to those found elsewhere 1,7,27 and
provides some validation of the calculations and computations made. We could not definitively
assign a ‘consultation’ to one member of staff if more than one had made changes to the
record(s) associated with that consultation, nor could we apportion time to individual staff groups
if that was the case.
All types of consultation were used to reflect the total care provided by a practice to people with
diabetes. Focusing on consultations with a diabetes Read code would have resulted in a high
level of data attrition. Care of related complications (e.g. hypertension) would have been missed
particularly where GPs only code a single comorbidity because of time constraints.
The accuracy of consultation time is unclear as it relies on practitioners remembering to mark the
patient as ‘left’. However the use of electronic systems was well established in all practices and
there is no reason to assume that errors varied systematically across years.
A single measure such as HbA1c may not provide an absolute indication of whether a person’s
diabetes is well controlled or not; meeting HbA1c thresholds was chosen as it has been one of
the key QOF diabetes indicators. The cross-sectional analysis did not allow us to test for causality
but nonetheless the findings establish that practices which involve nurses more often typically
perform as well as those who use nurses less often (in terms of glycaemic control). Practices vary
in their availability of resources, for example patient list per nurse and doctor, and the availability
of diabetes specialist GP or nurses. We were unable to consider these practice level contextual
factors in our analysis although a sub-study based on a survey of 249 practices found no
associations between specialist provision and HbA1c level 28. The richness of the GP patient level
data in this study is mirrored by a paucity of good quality workforce data8.
Comparison with existing literature
Specialist nurses or nurse case managers have been shown to be associated with improved
short term diabetic control in a number of trials29 and trials have demonstrated that nurse
practitioners can achieve outcomes that are equivalent to those of general practitioners30.
However, little research has examined the impact of the increased use of nurses in routine
general practice outside of these trials. Associations were found previously between higher levels
of nurse staffing and better performance measured using QOF diabetes domain score and
percent meeting the lower (≤ 57 mmol/mol (7%)) and upper (≤ 86 mmol/mol (10%)) HbA1c QOF
indicator thresholds for 2005/619,31 using aggregated practice level data only, with no control for
individual patient characteristics. Our findings based on 2005 THIN data are consistent with this
earlier work. This study provides support for the view that extension of the nursing role would not
compromise quality of care or patient outcomes32.
Implications for research and/or practice
This study has important implications for policy, practice and further research. Nurses are well
placed to help people with diabetes make the behavioural changes that can benefit their long-
term health. This study shows that there may be considerable scope for increasing the amount of
diabetes care that is delivered by nurses although this would have workforce implications. Some
practices may have to employ more nurses to increase capacity to meet the demand. For others
the amount of care delivered by nurses is still low.
Further evidence is required concerning the long term costs and benefits of deploying more
nurses to undertake diabetes care but the results of this study give no indication that the control
of diabetes is worse when more care is provided by nurses.. Future research should also
consider the preferences of people with diabetes and a full economic analysis.
References
1. Kanavos P, van den Aardweg S, Schurer W. Diabetes expenditure, burden of disease
and management in 5 EU countries. London School of Economics, 2012.
2. Hex N, Bartlett C, Wright C, et al. Estimating the current and future costs of Type
1 and 2 diabetes in the United Kingdom including direct health costs and indirect societal
and productivity costs. Diabetic Medicine 2012; 29(7): 855-862.
3. National Institute for Health and Clinical Excellence (NICE). Type 2 diabetes:
National clinical guideline for management in primary and secondary care (update) .
London: Royal College of Physicians, 2008.
4. Forbes A, While A, Griffiths P, et al. Organizing and delivering diabetes education and
self-care support: findings of scoping project. J Health Serv Res Policy 2011; 16 (suppl_1): 42-49.
5. Roland, DM. Linking physicians' pay to the quality of care - a major experiment in
the United Kingdom. N Engl J Med; 2004, 351(14): 1448-1454.
6. Leese B. New opportunities for nurses and other healthcare professionals? A
review of the potential impact of the new GMS contract on the primary care workforce. J
Health Organ Manag 2006; 20(6): 525-536.
7. Hippisley-Cox J,Vinogradova Y. Trends in Consultation Rates in General Practice
1995 to 2008: Analysis of the QRESEARCH database. The Information Centre for Health
and Social Care, 2009.
8. Ball JE, Maben J, Griffiths P. Practice nursing: what do we know?. Br J Gen
Pract 2015; 65(630):10-11.
9. Health and Social Care Information Centre. General and Personal Medical
Services England 2003-2013. Health and Social Care Information Centre, 2014
www.hscic.gov.uk/catalogue/PUB13849 (accessed 21st November 2014)
10. Gemmell I, Campbell S, Hann M, et al. Assessing workload in general practice in
England before and after the introduction of the pay-for-performance contract. J Adv Nurs
2009; 65 (3), 509-515.
11. Laurant M, Reeves D, Hermens R, et al. Substitution of doctors by nurses in
primary care. Cochrane Database Syst Rev 2005; Apr 18;(2):CD001271.

12. Richardson G. Identifying, evaluating and implementing cost-effective skill mix. J
Nurs Manag 1999; 7(5): 265-270.
13. Vrijhoef HJM, Diederiks JPM, Spreeuwenberg C, et al. The nurse specialist as
main care-provider for patients with type 2 diabetes in a primary care setting: effects on
patient outcomes. Int J Nursing Studies 2002; 39(4): 441-451.
14. Sibbald B, Laurant, MG, Reeves D. Advanced nurse roles in UK Primary care. Medical
Journal of Australia 2006; 185(1): 10-12.
15. Mundinger MO, Kane RL, Lenz ER, et al. Primary care outcomes in patients
treated by nurse practitioners or physicians: a randomized trial. JAMA 2000; 283(1): 59-
68.
16. Sibbald B. Should primary care be nurse led? Yes. BMJ 2008 Sep 4; 337: a1157.
17. Sibbald B. Who needs doctors in general practice? Qual Prim Care 2008; 16(2): 73-74.
18. Knight R. Should primary care be nurse led? No. BMJ 2008 Sep 4; 337: a1169.
19. Griffiths P, Murrells T., Maben J, et al. Nurse staffing and quality of care in UK
general practice: cross-sectional study using routinely collected data. Br J Gen Pract
2010; 60(570): 36-48.
20. Blak BT, Thompson M, Dattani H, et al. Generalisability of The Health Improvement
Network (THIN) database: demographics, chronic disease prevalence and mortality rates. Inform
Prim Care 2011 19(4): 251-255.
21. NHS Employers and General Practitioners Committee. Quality and Outcomes Framework
guidance for GMS contract 2008/9: delivering investment to general practice. London: The NHS
Confederation (Employers) Company Ltd., 2008.
22. NHS Employers and General Practitioners Committee. Quality and Outcomes Framework
guidance for GMS contract 2009/10: delivering investment to general practice. London: The NHS
Confederation (Employers) Compnay Ltd., 2009.
23. Goldstein H. Multilevel statistical models. Arnold, London, 1995.
24. Khan NF, Perera R, Harper S, et al. Adaption and validation of the Charlson Index for Read/OXMIS coded databases. BMC Fam Pract 2011; 11(1).
25. Townsend P, Phillmore P, Beattie A. Health and deprivation: inequality and The
North. London, Croom Helm, 1998.
26. SAS Institute Inc. SAS/STAT® 9.3 User’s Guide. Cary, NC: SAS Institute Inc.,
2011.
27. NHS Information Centre for Health and Social Care. Disease prevalence, Quality
and Outcomes Framework (QOF) for April 2011 - March 2012, England. 2012.
http://www.ic.nhs.uk/catalogue/PUB08661 (accessed on 18th November 2014).
28. Murrells T, Ball J, Maben J, et al. Managing diabetes in primary care: how does
the configuration of the workforce affect quality of care. King’s College London, 2013.
29. Loveman E, Royle P, Waugh N. Specialist nurses in diabetes mellitus. Cochrane
Database Syst Rev 2003 2.
30. Horrocks S, Anderson E, Salisbury C. Systematic review of whether nurse
practitioners working in primary care can provide equivalent care to doctors. BMJ 2002
324(7341): 819-823.
31. Griffiths P, Maben J, Murrells T. Organisational quality, nurse staffing and quality
of chronic disease management in primary care: observational study using routinely
collected data. Int J Nursing Studies 2011; 48(10): 1199-1210.
32. Sibbald B, Laurant MG, Reeves D. Advanced nurse roles in UK primary care.
Med J Aust 2006; 185(1): 10-12.
33. Liebl L. Insulin intensification – the rationale and the target. Int J of Clin Pract
Suppl 2009; 164: 1-5.
Funding
This study was supported by the English Department of Health’s Policy Research Programme,
which provided funding to the National Nursing Research Unit (to 2012) at King’s College
London. The views expressed are those of the authors, not the Department of Health.
Ethical approval
Based on the information we provided to National Research Ethics Service (NRES), we were
advised that this project was not considered to be research according to the NRES guidance and
therefore it did not require ethical review by a NHS Research Ethics Committee.
IMS Health (previously Cegedim Strategic Data Market Research) periodically audits it practices
for administrative information. The instrument and database for the audit had previously received
ethical approval.
Competing interests
None declared
Acknowledgements
We would like to thank Henrietta Mulnier for her work to develop the Read code classification
system of activity, and selection of people with diabetes from the initial data extract, and

Geraldine Lee for support with reviewing the literature in the study. Thanks also to Professor
Angus Forbes for diabetes specific advice throughout the project and to Professor Graham
Cookson for economic analyses undertaken in the study.
Thanks also go to Mary Thompson, Fiona Hill and Anne Costello at IMS Health for liaising over
the use of The Health Information Network (THIN) database and coordinating an additional
survey of practices to inform the research.
FIGURES
Figure 1: Proportion of consultations undertaken by doctors and nurses at the practice level in 2002 and 2011
0-9% 10-19% 20-29% 30-39% 40-49% 50-59% 60-69% 70-79% 80-89% 90% + 0-9% 10-19% 20-29% 30-39% 40-49% 50-59% 60-69% 70-79% 80-89% 90% +2002 2011
0
5
10
15
20
25
30
35
Doctor Practice Nurse
%
x-axis: proportion of consultations undertaken within each year grouped into 10% bands
Figure 2 HbA1c population achievement by threshold
20022003
20042005
20062007
20082009
20102011
0
10
20
30
40
50
60
70
80
90%
pop
ulati
on a
chie
vem
ent
≤53 mmol/mol (7%)
≤ 86 mmol/mol (10%)

TABLES
Table 1 Population achievement for HbA1c by threshold and level of practice nurse involvement
Practice nurse contact 2002 2003 2004 2005 2006 2007 2008 2009 2010 2011
Low <26.0% 30.8 33.9 37.5 37.7 42.2 41.8 43.6 42.9 43.0 42.5Medium 26.0-35.3% 30.3 34.6 37.3 38.6 41.2 42.6 43.1 43.9 43.7 42.0High 35.4% and over 31.0 36.6 38.1 40.3 43.1 42.8 42.8 43.6 43.8 43.4
Low <26.0% 71.6 76.9 81.7 83.2 83.2 83.1 84.0 82.8 82.8 82.0Medium 26.0-35.3% 70.4 77.5 82.8 83.6 83.2 83.5 84.0 83.7 83.3 82.8High 35.4% and over 74.1 80.4 83.5 84.5 84.8 83.7 83.3 83.0 83.6 82.9
% consultations with nurses 30.7 31.0 30.7 30.9 30.6 31.2 31.2 31.5 31.1 32.2
Total number of people 51,493 78,502 86,838 103,391 114,039 123,504 135,420 143,329 148,221 150,023
Number of GP practices 247 375 386 427 441 448 470 471 466 445
HbA1c threshold
≤ 53 mmol/mol (7%)
≤ 86 mmol/mol (10%)
Table 2 Multilevel model examining level of nurse contact and meeting the HbA1c ≤ 53 mmol/mol (7%) threshold
Nurse contact
Year Low Medium High
2002 OR 1.04 0.94 1.00 0.90*
(0.87 - 1.25) (0.79 -1.11) (-) (0.82 - 0.98)
2003 OR 0.86 0.89 1.00 * 0.95*
(0.77 - 0.95) (0.80 - 1.00) (-) (0.91 - 1.00)
2004 OR 0.95 0.96 1.00 0.97
(0.86 - 1.06) (0.87 - 1.07) (-) (0.93 - 1.01)
2005 OR 0.90 0.91 1.00 0.97
(0.82 - 0.99) (0.83 - 1.07) (-) (0.93 - 1.00)
2006 OR 0.97 0.93 1.00 0.98
(0.88 - 1.06) (0.85 - 1.02) (-) (0.94 - 1.02)
2007 OR 0.94 0.98 1.00 1.01
(0.85 - 1.03) (0.90 - 1.08) (-) (0.96 - 1.05)
2008 OR 1.01 1.01 1.00 1.02
(0.92 - 1.10) (0.93 - 1.10) (-) (0.99 - 1.05)
2009 OR 0.94 1.01 1.00 1.02
(0.86 - 1.03) (0.93 - 1.11) (-) (0.99 - 1.05)
2010 OR 0.96 0.98 1.00 1.03
(0.88 - 1.04) (0.91 - 1.07) (-) (1.00 - 1.07)
2011 OR 0.95 0.95 1.00 1.04*
sig†Consultations per h/c prof
(L95% - U95%)
(L95% - U95%)
(L95% - U95%)
(L95% - U95%)
(L95% - U95%)
(L95% - U95%)
(L95% - U95%)
(L95% - U95%)
(L95% - U95%)
† prob > 2(with two degrees of freedom); * p<0.05 ** p<0.01 *** p<0.001

Table 3 Multilevel model examining level of nurse contact and meeting the HbA1c ≤ 86 mmol/mol (10%) threshold
Nurse contact
Year Low Medium High
2002 OR 0.97 0.83 1.00 0.83**
(0.73 - 1.29) (0.63 - 1.09) (-) (0.72 - 0.95)
2003 OR 0.83 0.84 1.00 * 0.90***
(0.72 - 0.95) (0.73 - 0.97) (-) (0.85 - 0.95)
2004 OR 0.91 0.97 1.00 0.96
(0.81 - 1.02) (0.86 - 1.09) (-) (0.91 - 1.01)
2005 OR 0.93 0.95 1.00 0.98
(0.84 - 1.03) (0.86 - 1.05) (-) (0.93 - 1.02)
2006 OR 0.92 0.92 1.00 0.99
(0.84 - 1.03) (0.83 - 1.02) (-) (0.94 - 1.03)
2007 OR 0.99 1.02 1.00 0.99
(0.89 - 1.10) (0.92 - 1.13) (-) (0.95 - 1.04)
2008 OR 1.04 1.08 1.00 1.00
(0.95 - 1.15) (0.98 - 1.19) (-) (0.97 - 1.03)
2009 OR 1.00 1.07 1.00 0.99
(0.91 - 1.10) (0.97 - 1.18) (-) (0.96 - 1.02)
2010 OR 0.98 1.02 1.00 0.99
(0.89 - 1.07) (0.92 - 1.11) (-) (0.96 - 1.03)
2011 OR 0.95 0.99 1.00 1.01
sig†Consultations per h/c prof
(L95% - U95%)
(L95% - U95%)
(L95% - U95%)
(L95% - U95%)
(L95% - U95%)
(L95% - U95%)
(L95% - U95%)
(L95% - U95%)
(L95% - U95%)