Embed Size (px)
Citation preview

AIICO INSURANCE PLC AND SUBSIDIARIES
ANNUAL REPORT AND FINANCIAL STATEMENTS
FOR THE YEAR ENDED 31 DECEMBER 2020
AIICO INSURANCE PLC AND SUBSIDIARIES
Annual Report and Financial Statements
31 December 2020
Table of contents Page
Corporate Information 2
Consolidated Results at a Glance - The Group 5
Results at a Glance - The Company 6
Directors' Report 7
Report of the Statutory Audit Committee 10
Certification Pursuant to Section 60(2) of Investment & Securities Act No. 29 of 2007 11
Independent Auditor's Report 12
Statement of Significant Accounting Policies 17
Consolidated and Separate Statements of Financial Position 44
Consolidated and Separate Statements of Profit or Loss and Other Comprehensive Income 45
Consolidated and Separate Statements of Changes in Equity - Group 46
Consolidated and Separate Statements of Changes in Equity - Company 47
Consolidated and Separate Statements of Cash flows 48
Notes to the Consolidated and Separate Financial Statements 49
Other National Disclosures:
- Valued Added Statement 103
- Five-year Financial Summary - Group 104
- Five-year Financial Summary - Company 105
- Revenue Account of General Business 106
- Revenue Account of Life Business 107
1
AIICO INSURANCE PLC AND SUBSIDIARIES
Annual Report and Financial Statements
31 December 2020
Corporate Information
Directors Mr. Kundan Sainani (Indian) Chairman
Mr. Babatunde Fajemirokun Group MD / CEO
Mr. Olusola Ajayi Executive Director
Mr. Adewale Kadri Executive Director
Mr. Samaila Zubairu Director/Independent
Mr. Sobandele David Ayodele Sobanjo * Director
Mr. Ademola Adebise Director
Mrs. Oluwafolakemi Edun (Nee Fajemirokun) Director
Mr. Olalekan Akinyanmi Director
Raimun Snyders ** Director
Key
* Retired with effect from 1 January 2020
** Appointed with effect from 14 January 2020
Company Secretary Mr. Donald Kanu
AIICO Insurance Plc AIICO Plaza
Plot PC 12, Churchgate Street
Victoria Island, Lagos
Registered Office AIICO Plaza
Plot PC 12, Churchgate Street
Victoria Island
Lagos
RC No. 7340
TIN 00401332-0001
Corporate Head Office AIICO Plaza
Plot PC 12, Churchgate Street Victoria Island
Lagos
Tel: +234 01 2792930-59
0700AIIContact (0700 2442 6682 28)
Fax: +234 01 2799800
Website: //www.aiicoplc.com
E-mail: [email protected]
Registrar Coronation Registrars (Formerly United Securities Limited)
10, Amodu Ojikutu Street Off
Bishop Oluwole Street Victoria Island
P.M.B. 12753
Lagos
Independent Auditor Ernst & Young
10th & 13th Floors, UBA House
57, Marina Road
Lagos Island
Lagos
website: www.ey.com/ng
Bankers Access Bank Plc
Ecobank Plc
First Bank of Nigeria Limited
First City Monument Bank Limited
Guaranty Trust Bank Plc
2

AIICO INSURANCE PLC AND SUBSIDIARIES
Annual Report and Financial Statements
31 December 2020
Corporate Information (Continued)
Stanbic IBTC Bank
Standard Chartered Bank Nigeria Limited
Union Bank of Nigeria Plc
United Bank of Africa Plc
Wema Bank Plc
Actuary Zamara Consulting Actuaries Nigeria Limited
FRC/2017/NAS/00000016912
Reinsurers
Continental Reinsurance Plc
Swiss Reinsurance
WAICA Reinsurance
Nigerian Reinsurance
Trust Reinsurance
Zep Reinsurance
Arig Reinsurance
Aveni Reinsurance
NCA Reinsurance
Estate Valuer Niyi Fatokun & Co.
(Chartered Surveyors & Valuer)
FRC/2013/NIESV/70000000/1217
Regulatory Authority National Insurance Commission (NAICOM)
Branch Networks
1. Port Harcourt 2. Kaduna
11 Ezimgbu Link Road (Mummy B Road) Yaman Phone House
Off Stadium Road 1, Constitution Road
G.R.A Phase 4, Port Harcourt Kaduna, Kaduna State
Rivers State Tel: +234 803 338 6968;
Tel: +234 808 313 4875 +234 805 601 9667
+234 909 448 9393
3. Abuja Area Office 4. Kano
Plot 1012, Adetokunbo Ademola Crescent 8, Post Office Road
Opp. Rockview Hotel (Classic), Wuse II Kano
FCT, Abuja. Kano State
Tel: +234 805 820 0439 Tel: +234 807 810 7938
+234 806 593 4787
5. Abeokuta 6. Lagos Ikeja
46, Tinubu Street AIICO House
Ita Eko, Abeokuta Plot 2, Oba Akran Avenue
Ogun State Opp. Dunlop, Ikeja, Lagos
Tel: +234 803 255 7071 Tel: +234 1 460 2097-8; +234 808 313 4376
+234 1 460 2218
7. Aba 8. Lagos Isolo
7, Factory Road 203/205, Apapa-Oshodi Expressway
Aba, Abia State Isolo, Lagos
Tel: +234 805 531 4351 Tel: +234 802 305 4803; +234 805 717 6063
9. Enugu 10. Lagos Ilupeju
55-59, Chime Avenue AIICO House
Gbuja's Plaza New Haven 36/38, Ilupeju Industrial Avenue
Enugu State Ilupeju, Lagos
Tel: +234 803 724 6767 Tel: +234 816 046 6239
+234 803 334 3036
Africa Reinsurance Corporation
+234 817 668 4115
3
AIICO INSURANCE PLC AND SUBSIDIARIES
Annual Report and Financial Statements
31 December 2020
Corporate Information (Continued)
11. Benin 12. Onitsha
28, Sakponba Road Noclink Plaza, 41 New Market Road
Benin City Opp UBA Bank, Onitsha
Edo State Anambra State
Tel: +234 805 116 3395 Tel: +234 708 606 4999
+234 813 405 1972 +234 803 375 0361
13. Jos 14. Owerri
4, Beach Road 46, Wetheral Road
Jos, Plateau State. Owerri, Imo State
Tel: +234 805 735 6726 Tel: +234 805 603 3269
+234 809 033 5125 +234 706 603 2065
15. Ibadan 16. Warri
12, Moshood Abiola Way 60, Effurun/Sapele Road
Challenge Area Warri.
Ibadan, Oyo State Delta State.
Tel: +234 803 231 8925 Tel: +234 803 971 0794
+234 802 834 4263 +234 818 749 7490
4
AIICO INSURANCE PLC AND SUBSIDIARIES
Annual Report and Financial Statements
31 December 2020
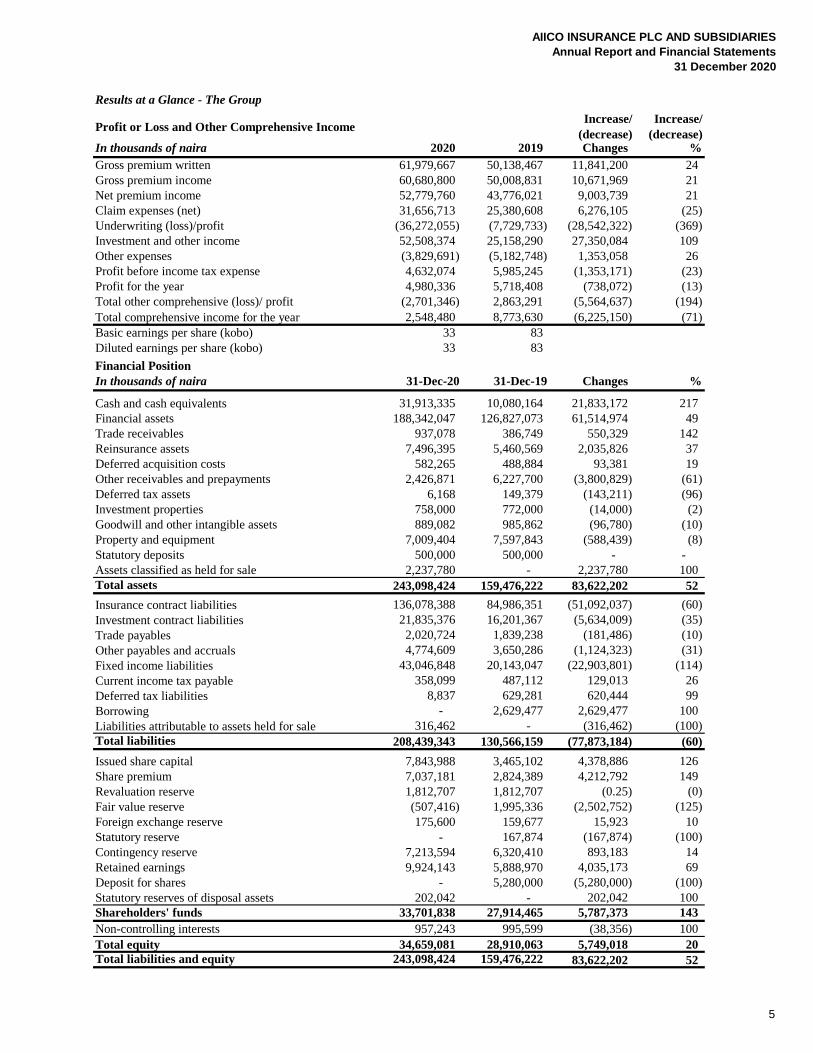
Results at a Glance - The Group
Profit or Loss and Other Comprehensive Income Increase/
(decrease)
Increase/
(decrease) In thousands of naira 2020 2019 Changes %
Gross premium written 61,979,667 50,138,467 11,841,200 24
Gross premium income 60,680,800 50,008,831 10,671,969 21
Net premium income 52,779,760 43,776,021 9,003,739 21
Claim expenses (net) 31,656,713 25,380,608 6,276,105 (25)
Underwriting (loss)/profit (36,272,055) (7,729,733) (28,542,322) (369)
Investment and other income 52,508,374 25,158,290 27,350,084 109
Other expenses (3,829,691) (5,182,748) 1,353,058 26
Profit before income tax expense 4,632,074 5,985,245 (1,353,171) (23)
Profit for the year 4,980,336 5,718,408 (738,072) (13)
Total other comprehensive (loss)/ profit (2,701,346) 2,863,291 (5,564,637) (194)
Total comprehensive income for the year 2,548,480 8,773,630 (6,225,150) (71)
Basic earnings per share (kobo) 33 83
Diluted earnings per share (kobo) 33 83
Financial Position
In thousands of naira 31-Dec-20 31-Dec-19 Changes %
Cash and cash equivalents 31,913,335 10,080,164 21,833,172 217
Financial assets 188,342,047 126,827,073 61,514,974 49
Trade receivables 937,078 386,749 550,329 142
Reinsurance assets 7,496,395 5,460,569 2,035,826 37
Deferred acquisition costs 582,265 488,884 93,381 19
Other receivables and prepayments 2,426,871 6,227,700 (3,800,829) (61)
Deferred tax assets 6,168 149,379 (143,211) (96)
Investment properties 758,000 772,000 (14,000) (2)
Goodwill and other intangible assets 889,082 985,862 (96,780) (10)
Property and equipment 7,009,404 7,597,843 (588,439) (8)
Statutory deposits 500,000 500,000 - -
Assets classified as held for sale 2,237,780 - 2,237,780 100
Total assets 243,098,424 159,476,222 83,622,202 52
Insurance contract liabilities 136,078,388 84,986,351 (51,092,037) (60)
Investment contract liabilities 21,835,376 16,201,367 (5,634,009) (35)
Trade payables 2,020,724 1,839,238 (181,486) (10)
Other payables and accruals 4,774,609 3,650,286 (1,124,323) (31)
Fixed income liabilities 43,046,848 20,143,047 (22,903,801) (114)
Current income tax payable 358,099 487,112 129,013 26
Deferred tax liabilities 8,837 629,281 620,444 99
Borrowing - 2,629,477 2,629,477 100
Liabilities attributable to assets held for sale 316,462 - (316,462) (100)
Total liabilities 208,439,343 130,566,159 (77,873,184) (60)
Issued share capital 7,843,988 3,465,102 4,378,886 126
Share premium 7,037,181 2,824,389 4,212,792 149
Revaluation reserve 1,812,707 1,812,707 (0.25) (0)
Fair value reserve (507,416) 1,995,336 (2,502,752) (125)
Foreign exchange reserve 175,600 159,677 15,923 10
Statutory reserve - 167,874 (167,874) (100)
Contingency reserve 7,213,594 6,320,410 893,183 14
Retained earnings 9,924,143 5,888,970 4,035,173 69
Deposit for shares - 5,280,000 (5,280,000) (100)
Statutory reserves of disposal assets 202,042 - 202,042 100
Shareholders' funds 33,701,838 27,914,465 5,787,373 143
Non-controlling interests 957,243 995,599 (38,356) 100
Total equity 34,659,081 28,910,063 5,749,018 20
Total liabilities and equity 243,098,424 159,476,222 83,622,202 52
5
AIICO INSURANCE PLC AND SUBSIDIARIES
Annual Report and Financial Statements
31 December 2020
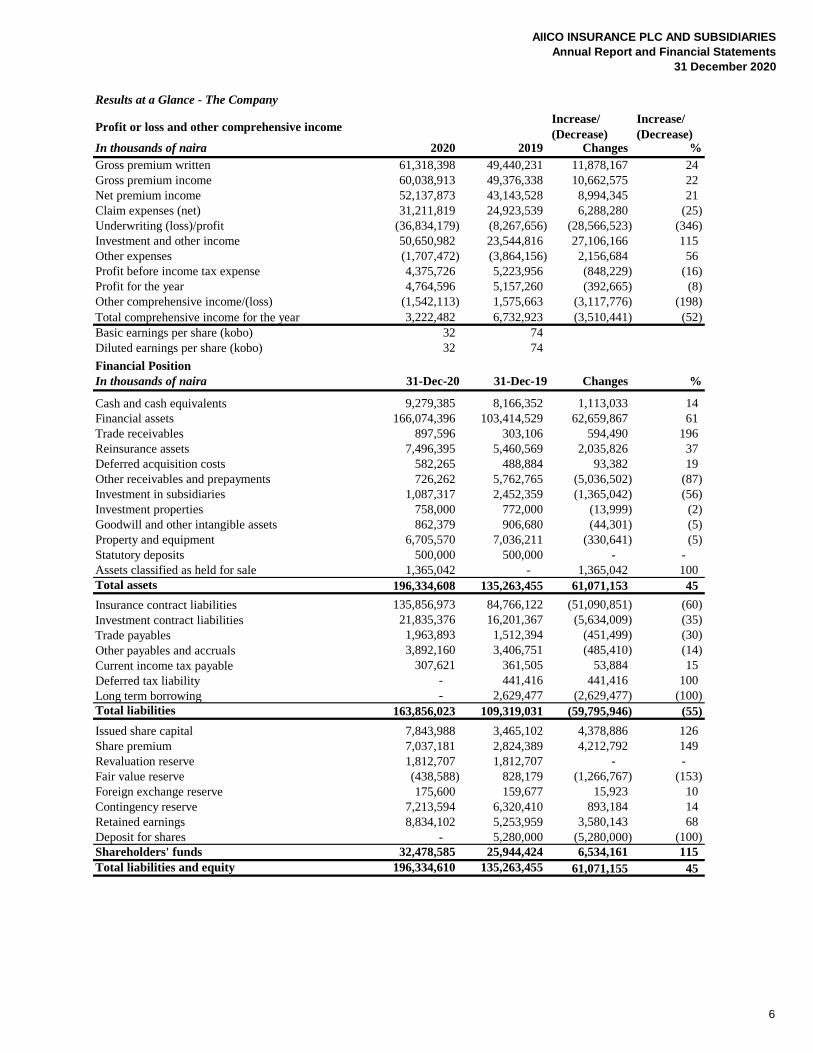
Results at a Glance - The Company
Profit or loss and other comprehensive incomeIncrease/
(Decrease)
Increase/
(Decrease) In thousands of naira 2020 2019 Changes %
Gross premium written 61,318,398 49,440,231 11,878,167 24
Gross premium income 60,038,913 49,376,338 10,662,575 22
Net premium income 52,137,873 43,143,528 8,994,345 21
Claim expenses (net) 31,211,819 24,923,539 6,288,280 (25)
Underwriting (loss)/profit (36,834,179) (8,267,656) (28,566,523) (346)
Investment and other income 50,650,982 23,544,816 27,106,166 115
Other expenses (1,707,472) (3,864,156) 2,156,684 56
Profit before income tax expense 4,375,726 5,223,956 (848,229) (16)
Profit for the year 4,764,596 5,157,260 (392,665) (8)
Other comprehensive income/(loss) (1,542,113) 1,575,663 (3,117,776) (198)
Total comprehensive income for the year 3,222,482 6,732,923 (3,510,441) (52)
Basic earnings per share (kobo) 32 74
Diluted earnings per share (kobo) 32 74
Financial Position
In thousands of naira 31-Dec-20 31-Dec-19 Changes %
Cash and cash equivalents 9,279,385 8,166,352 1,113,033 14
Financial assets 166,074,396 103,414,529 62,659,867 61
Trade receivables 897,596 303,106 594,490 196
Reinsurance assets 7,496,395 5,460,569 2,035,826 37
Deferred acquisition costs 582,265 488,884 93,382 19
Other receivables and prepayments 726,262 5,762,765 (5,036,502) (87)
Investment in subsidiaries 1,087,317 2,452,359 (1,365,042) (56)
Investment properties 758,000 772,000 (13,999) (2)
Goodwill and other intangible assets 862,379 906,680 (44,301) (5)
Property and equipment 6,705,570 7,036,211 (330,641) (5)
Statutory deposits 500,000 500,000 - -
Assets classified as held for sale 1,365,042 - 1,365,042 100
Total assets 196,334,608 135,263,455 61,071,153 45
Insurance contract liabilities 135,856,973 84,766,122 (51,090,851) (60)
Investment contract liabilities 21,835,376 16,201,367 (5,634,009) (35)
Trade payables 1,963,893 1,512,394 (451,499) (30)
Other payables and accruals 3,892,160 3,406,751 (485,410) (14)
Current income tax payable 307,621 361,505 53,884 15
Deferred tax liability - 441,416 441,416 100
Long term borrowing - 2,629,477 (2,629,477) (100)
Total liabilities 163,856,023 109,319,031 (59,795,946) (55)
Issued share capital 7,843,988 3,465,102 4,378,886 126
Share premium 7,037,181 2,824,389 4,212,792 149
Revaluation reserve 1,812,707 1,812,707 - -
Fair value reserve (438,588) 828,179 (1,266,767) (153)
Foreign exchange reserve 175,600 159,677 15,923 10
Contingency reserve 7,213,594 6,320,410 893,184 14
Retained earnings 8,834,102 5,253,959 3,580,143 68
Deposit for shares - 5,280,000 (5,280,000) (100)
Shareholders' funds 32,478,585 25,944,424 6,534,161 115
Total liabilities and equity 196,334,610 135,263,455 61,071,155 45
6
AIICO INSURANCE PLC AND SUBSIDIARIES
Annual Report and Financial Statements
31 December 2020
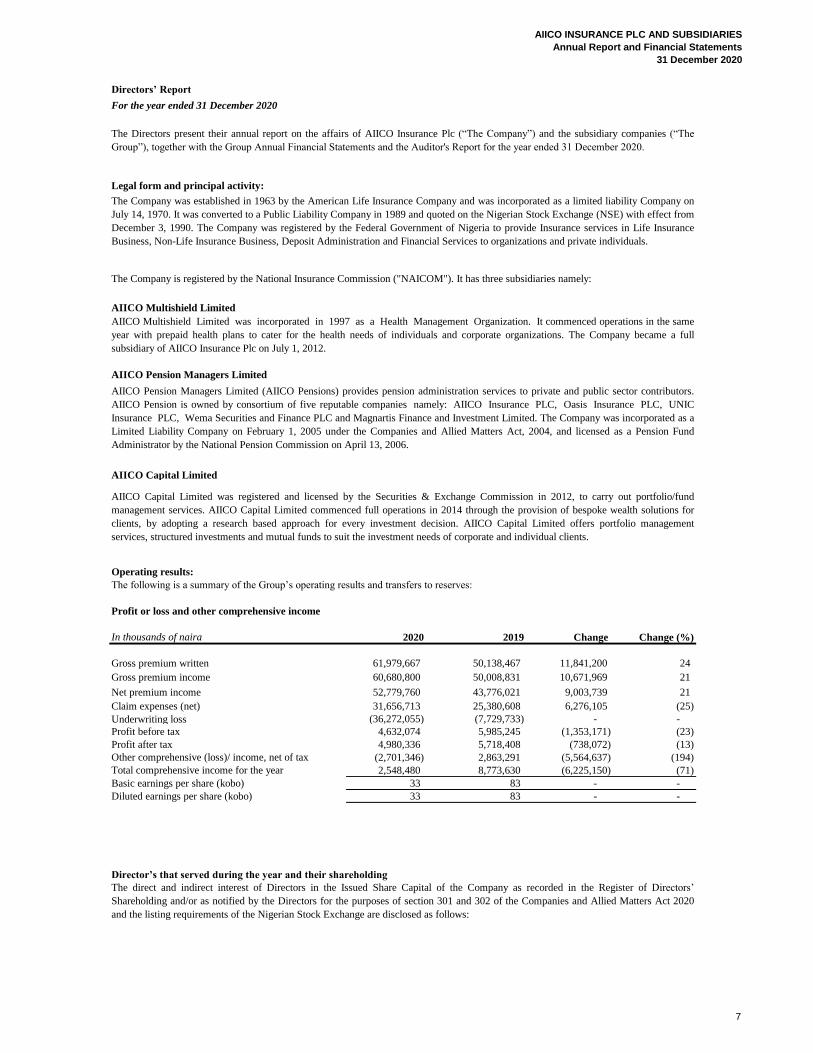
Directors’ Report
For the year ended 31 December 2020
The Company is registered by the National Insurance Commission ("NAICOM"). It has three subsidiaries namely:
AIICO Multishield Limited
AIICO Pension Managers Limited
AIICO Capital Limited
Profit or loss and other comprehensive income
In thousands of naira 2020 2019 Change Change (%)
Gross premium written 61,979,667 50,138,467 11,841,200 24
Gross premium income 60,680,800 50,008,831 10,671,969 21
Net premium income 52,779,760 43,776,021 9,003,739 21
Claim expenses (net) 31,656,713 25,380,608 6,276,105 (25)
Underwriting loss (36,272,055) (7,729,733) - -
Profit before tax 4,632,074 5,985,245 (1,353,171) (23)
Profit after tax 4,980,336 5,718,408 (738,072) (13)
(2,701,346) 2,863,291 (5,564,637) (194)
2,548,480 8,773,630 (6,225,150) (71)
Basic earnings per share (kobo) 33 83 - -
Diluted earnings per share (kobo) 33 83 - -
Director’s that served during the year and their shareholding
The direct and indirect interest of Directors in the Issued Share Capital of the Company as recorded in the Register of Directors’
Shareholding and/or as notified by the Directors for the purposes of section 301 and 302 of the Companies and Allied Matters Act 2020
and the listing requirements of the Nigerian Stock Exchange are disclosed as follows:
Other comprehensive (loss)/ income, net of tax
The Company was established in 1963 by the American Life Insurance Company and was incorporated as a limited liability Company on
July 14, 1970. It was converted to a Public Liability Company in 1989 and quoted on the Nigerian Stock Exchange (NSE) with effect from
December 3, 1990. The Company was registered by the Federal Government of Nigeria to provide Insurance services in Life Insurance
Business, Non-Life Insurance Business, Deposit Administration and Financial Services to organizations and private individuals.
AIICO Multishield Limited was incorporated in 1997 as a Health Management Organization. It commenced operations in the same
year with prepaid health plans to cater for the health needs of individuals and corporate organizations. The Company became a full
subsidiary of AIICO Insurance Plc on July 1, 2012.
AIICO Pension Managers Limited (AIICO Pensions) provides pension administration services to private and public sector contributors.
AIICO Pension is owned by consortium of five reputable companies namely: AIICO Insurance PLC, Oasis Insurance PLC, UNIC
Insurance PLC, Wema Securities and Finance PLC and Magnartis Finance and Investment Limited. The Company was incorporated as a
Limited Liability Company on February 1, 2005 under the Companies and Allied Matters Act, 2004, and licensed as a Pension Fund
Administrator by the National Pension Commission on April 13, 2006.
AIICO Capital Limited was registered and licensed by the Securities & Exchange Commission in 2012, to carry out portfolio/fund
management services. AIICO Capital Limited commenced full operations in 2014 through the provision of bespoke wealth solutions for
clients, by adopting a research based approach for every investment decision. AIICO Capital Limited offers portfolio management
services, structured investments and mutual funds to suit the investment needs of corporate and individual clients.
Operating results:
The Directors present their annual report on the affairs of AIICO Insurance Plc (“The Company”) and the subsidiary companies (“The
Group”), together with the Group Annual Financial Statements and the Auditor's Report for the year ended 31 December 2020.
Total comprehensive income for the year
Legal form and principal activity:
The following is a summary of the Group’s operating results and transfers to reserves:
7
AIICO INSURANCE PLC AND SUBSIDIARIES
Annual Report and Financial Statements
31 December 2020
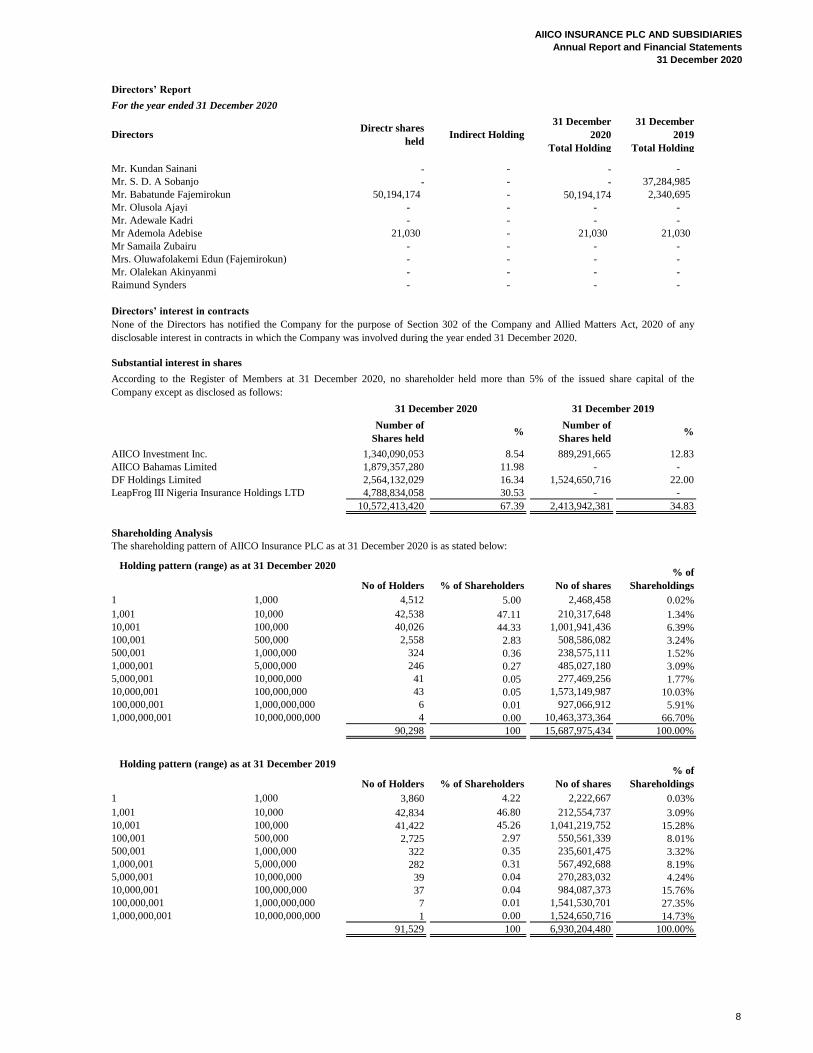
Directors’ Report
For the year ended 31 December 2020
DirectorsDirectr shares
heldIndirect Holding
31 December
2020
Total Holding
31 December
2019
Total Holding
Mr. Kundan Sainani - - - -
Mr. S. D. A Sobanjo - - - 37,284,985
Mr. Babatunde Fajemirokun 50,194,174 - 50,194,174 2,340,695
Mr. Olusola Ajayi - - - -
Mr. Adewale Kadri - - - -
Mr Ademola Adebise 21,030 - 21,030 21,030
Mr Samaila Zubairu - - - -
Mrs. Oluwafolakemi Edun (Fajemirokun) - - - -
Mr. Olalekan Akinyanmi - - - -
Raimund Synders - - - -
Directors’ interest in contracts
Substantial interest in shares
Number of
Shares held%
Number of
Shares held%
AIICO Investment Inc. 1,340,090,053 8.54 889,291,665 12.83
AIICO Bahamas Limited 1,879,357,280 11.98 - -
DF Holdings Limited 2,564,132,029 16.34 1,524,650,716 22.00
LeapFrog III Nigeria Insurance Holdings LTD 4,788,834,058 30.53 - -
10,572,413,420 67.39 2,413,942,381 34.83
Shareholding Analysis
1 1,000 4,512 5.00 2,468,458 0.02%
1,001 10,000 42,538 47.11 210,317,648 1.34%
10,001 100,000 40,026 44.33 1,001,941,436 6.39%
100,001 500,000 2,558 2.83 508,586,082 3.24%
500,001 1,000,000 324 0.36 238,575,111 1.52%
1,000,001 5,000,000 246 0.27 485,027,180 3.09%
5,000,001 10,000,000 41 0.05 277,469,256 1.77%
10,000,001 100,000,000 43 0.05 1,573,149,987 10.03%
100,000,001 1,000,000,000 6 0.01 927,066,912 5.91%
1,000,000,001 10,000,000,000 4 0.00 10,463,373,364 66.70%
90,298 100 15,687,975,434 100.00%
1 1,000 3,860 4.22 2,222,667 0.03%
1,001 10,000 42,834 46.80 212,554,737 3.09%
10,001 100,000 41,422 45.26 1,041,219,752 15.28%
100,001 500,000 2,725 2.97 550,561,339 8.01%
500,001 1,000,000 322 0.35 235,601,475 3.32%
1,000,001 5,000,000 282 0.31 567,492,688 8.19%
5,000,001 10,000,000 39 0.04 270,283,032 4.24%
10,000,001 100,000,000 37 0.04 984,087,373 15.76%
100,000,001 1,000,000,000 7 0.01 1,541,530,701 27.35%
1,000,000,001 10,000,000,000 1 0.00 1,524,650,716 14.73%
91,529 100 6,930,204,480 100.00%
Holding pattern (range) as at 31 December 2019
No of Holders % of Shareholders
% of
Shareholdings
Holding pattern (range) as at 31 December 2020
No of Holders % of Shareholders No of shares
% of
Shareholdings
The shareholding pattern of AIICO Insurance PLC as at 31 December 2020 is as stated below:
According to the Register of Members at 31 December 2020, no shareholder held more than 5% of the issued share capital of the
Company except as disclosed as follows:
31 December 2020 31 December 2019
None of the Directors has notified the Company for the purpose of Section 302 of the Company and Allied Matters Act, 2020 of any
disclosable interest in contracts in which the Company was involved during the year ended 31 December 2020.
No of shares
8
AIICO INSURANCE PLC AND SUBSIDIARIES
Annual Report and Financial Statements
31 December 2020
Directors’ Report
For the year ended 31 December 2020
Company’s distributors
Events after balance sheet date
Property and equipment
Acquisition of own shares
The Company did not purchase any of its own shares during the year.
Employment and Employees:
Employees’ health, safety and environment
Employment of disabled persons
Employees’ Involvement and Training
Auditors
BY THE ORDER OF THE BOARD OF DIRECTORS
Mr. Donald Kanu
Company Secretary
FRC/2013/NBA/00000002884
Plot PC 12, Churchgate Street
Victoria Island
Lagos, Nigeria
Date: 25 February 2021
It is the policy of the Company that there is no discrimination in considering applications for employment including those of physically
challenged persons. All employees whether physically challenged or not are given equal opportunities to develop their knowledge and to
qualify for promotion in furtherance of their careers.
The Company is committed to keeping employees fully informed as much as possible regarding the Company’s performance and progress.
Views of employees are sought, where practicable, on matters which particularly affect them as employees. The Company runs an
open door management policy. Management, professional and technical expertise are the Company’s major assets and investment in
developing such skills is continuous. The Company’s expanding skills base is being brought about by a wide range of in-house and
external training. Opportunities for career development within the Company have also been broadened. Incentive schemes designed to
meet the circumstances of each individual are implemented wherever appropriate and some of these schemes include staff retirement
benefit, productivity bonus, promotion and salary review.
In accordance with Section 401 (1) of the Companies and Allied Matters Act 2020, Messrs. Ernst and Young was appointed as the new
auditor at the Company's last annual general meeting and shall remain in office as auditors of the Company until the end of the current
financial year.
The Company’s products are marketed by insurance brokers and agents throughout the country. The Company also employs the direct
marketing method to source for insurance business.
There has been no material change in the Group’s financial position since 31 December, 2020 that would have affected the true and fair
view of the Company’s state of affairs as at that date.
Investment in property and equipment during the year is limited to the amounts shown in Note 16 the financial statements. In the
opinion of the directors, the market value of property and equipment is not less than the value indicated in the financial statements.
The Company strictly observes all health and safety regulations. The Company maintains business premises designed with a view to
guaranteeing the safety and healthy living conditions of its employees and customers alike. Employees are adequately insured against
occupational and other hazards. Financial provision is also made for all employees in respect of transportation, housing, medical expenses
and meals.
9
AIICO INSURANCE PLC AND SUBSIDIARIES
Annual Report and Financial Statements
31 December 2020
·
·
·
SIGNED ON BEHALF OF THE COMMITTEE BY:
Mr. Samaila Zubairu
Chairman of the Statutory Audit Committee
FRC/2014/ICAN/00000007663
25 February 2021
Members of the Statutory Audit Committee are:
Mr. Samaila Zubairu (Independent Directors’ Representative) Chairman
Sir Edmond. U. Njoku Mr. (Shareholders’ Representative) Vice-Chairman
Mrs ‘Funke Augustine (Shareholders’ Representative) Member
Chief Robert I. Igwe (Shareholders’ Representative) Member
Mr. Ademola Adebise ( Directors’ Representative) Member
Mr. S. D. A. Sobanjo (Directors’ Representative) Member
We have reviewed the scope and planning of the audit for the year ended 31 December 2020 and we confirm
that they were adequate;
The Company Secretary/Legal Adviser acted as the Secretary to the Committee.
Report of the Statutory Audit Committee
To the members of AIICO Insurance PLC
In accordance with the provisions of Section 359(6) of the Companies and Allied Matters Act 2020, we the
members of the Audit Committee of AIICO Insurance PLC, having carried out our statutory functions under
the Act, hereby report as follows:
The Company’s reporting and accounting policies as well as internal control systems conform to legal
requirements and agreed ethical practices; and
We are satisfied with the responses to the External Auditors’ findings on management matters for the year
ended 31 December 2020.
Finally, we acknowledge and appreciate the co-operation of management and staff in the conduct of these
duties.
10
AIICO INSURANCE PLC AND SUBSIDIARIES
Annual Report and Financial Statements
31 December 2020
Certification Pursuant to Section 60(2) of Investment and Securities Act No. 29 of 2007
(i)
• Any untrue statement of a material fact, or
•
•
(ii) We:
•
•
•
•
(iii) We have disclosed to the auditors of the Group and Audit Committee:
•
•
Mr. Babatunde Fajemirokun Mr. Oladeji Oluwatola
MD/CEO Chief Financial Officer
FRC /2015/MULTI/00000019973 FRC/2013/ICAN/0000004910
25 February 2021 25 February 2021
Date Date
We have identified in the report whether or not there were significant changes in internal controls or other factors that
could significantly affect internal controls subsequent to the date of our evaluation, including any corrective actions with
regard to significant deficiencies and material weaknesses.
We the undersigned, hereby certify the following with regards to our audited financial statements for the year ended 31
December 2020 that:
We have reviewed the report and to the best of our knowledge, the report does not contain:
Omission to state a material fact, which would make the statements, misleading in the light of circumstances
under which such statements were made;
To the best of our knowledge, the financial statements and other financial information included in the report
fairly present in all material respects the financial condition and results of operation of the Group as of, and for
the years presented in the report.
Any fraud, whether or not material, that involves management or other employees who have significant role in
the Group’s internal controls;
are responsible for establishing and maintaining internal controls.
have designed such internal controls to ensure that material information relating to the Company and its
consolidated subsidiaries is made known to such officers by others within those entities particularly during the
year in which the yearic reports are being prepared;
have evaluated the effectiveness of the group’s internal controls as of date of the report;
have presented in the report our conclusions about the effectiveness of our internal controls based on our
evaluation as of that date;
all significant deficiencies in the design or operation of internal controls which would adversely affect the
Group’s ability to record, process, summarize and report financial data and have identified for the Group’s
auditors any material weakness in internal controls, and
11
AIICO INSURANCE PLC AND SUBSIDIARIES
Annual Report and Financial Statements
31 December 2020
Statement of Significant Accounting Policies
For the year ended 31 December 2020
1 Reporting entity
2 Basis of accounting
2.1 Statement of compliance
2.2 Going concern
2.3 Functional and presentation currency
2.4 Basis of measurement
AIICO Insurance Plc was established in 1963 by American Life Insurance Company and was incorporated in
1970. It was converted to a Public Liability Company in 1989 and quoted on the Nigerian Stock Exchange (NSE)
in December 1990. The Company was registered by the Federal Government of Nigeria to provide insurance
services in Life Insurance Business, Non-Life Insurance Business, Deposit Administration and Financial Services
to organizations and private individuals. Arising from the merger in the insurance industry, AIICO Insurance Plc
acquired Nigerian French Insurance Plc and Lamda Insurance Company Limited in February 2007.
The Company currently has its corporate head office at Plot PC 12, Churchgate St, Victoria Island, Lagos with
branches spread across major cities and commercial centres in Nigeria.
These consolidated and separate financial statements comprise the Company and its subsidiaries (together
referred to as “the Group”). The Group and Company are primarily involved in the business of providing risk
underwriting and related financial services to its customers. Such services include provision of life and non-life
insurance services to both corporate and individual customers. The activities of the subsidiaries and AIICO
Insurance percentage holding are mentioned in Note 13 (Investment in subsidiaries).
These consolidated and separate financial statements have been prepared in accordance with International
Financial Reporting Standards (IFRSs) as issued by the International Accounting Standards Board (IASB),
the financial statements comply with the Companies and Allied Matters Act 2020, the Financial Reporting
Council of Nigeria Act No. 6, 204, the Insurance Act of Nigeria 2003, the Pension Reform Act 2014 and
relevant National Insurance Commission (NAICOM) policy guidelines and circulars.
These consolidated and separate financial statements were authorised for issue by the Company’s Board of
Directors on 25 February 2021.
These consolidated and separate financial statements have been prepared using appropriate accounting
policies, supported by reasonable judgments and estimates. The Directors have a reasonable expectation,
based on an appropriate assessment of a comprehensive range of factors, that the Group and the Company
have adequate resources to continue as going concern for the foreseeable future.
These consolidated and separate financial statements are presented in Nigerian Naira, which is the Group
and Company’s functional and presentation currency. Except as indicated, financial information presented
in Naira has been rounded to the nearest thousand.
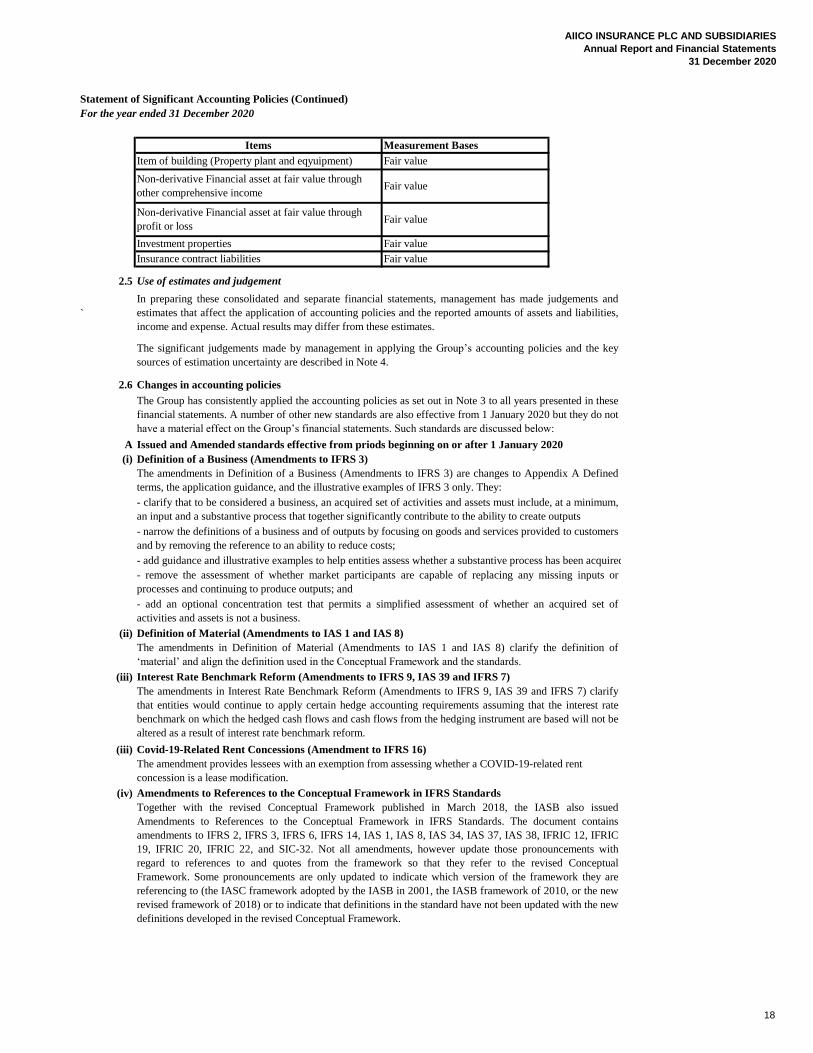
These consolidated and separate financial statements have been prepared under the historical cost
convention, except for the following items; which are measured on an alternative basis on each reporting
date.
17
AIICO INSURANCE PLC AND SUBSIDIARIES
Annual Report and Financial Statements
31 December 2020
Statement of Significant Accounting Policies (Continued)
For the year ended 31 December 2020
2.5 Use of estimates and judgement
`
2.6 Changes in accounting policies
A Issued and Amended standards effective from priods beginning on or after 1 January 2020
(i) Definition of a Business (Amendments to IFRS 3)
- add guidance and illustrative examples to help entities assess whether a substantive process has been acquired;
(ii) Definition of Material (Amendments to IAS 1 and IAS 8)
(iii) Interest Rate Benchmark Reform (Amendments to IFRS 9, IAS 39 and IFRS 7)
(iii) Covid-19-Related Rent Concessions (Amendment to IFRS 16)
(iv) Amendments to References to the Conceptual Framework in IFRS Standards
The amendment provides lessees with an exemption from assessing whether a COVID-19-related rent
concession is a lease modification.
The amendments in Interest Rate Benchmark Reform (Amendments to IFRS 9, IAS 39 and IFRS 7) clarify
that entities would continue to apply certain hedge accounting requirements assuming that the interest rate
benchmark on which the hedged cash flows and cash flows from the hedging instrument are based will not be
altered as a result of interest rate benchmark reform.
In preparing these consolidated and separate financial statements, management has made judgements and
estimates that affect the application of accounting policies and the reported amounts of assets and liabilities,
income and expense. Actual results may differ from these estimates.
The significant judgements made by management in applying the Group’s accounting policies and the key
sources of estimation uncertainty are described in Note 4.
- clarify that to be considered a business, an acquired set of activities and assets must include, at a minimum,
an input and a substantive process that together significantly contribute to the ability to create outputs
- narrow the definitions of a business and of outputs by focusing on goods and services provided to customers
and by removing the reference to an ability to reduce costs;
- remove the assessment of whether market participants are capable of replacing any missing inputs or
processes and continuing to produce outputs; and
- add an optional concentration test that permits a simplified assessment of whether an acquired set of
activities and assets is not a business.
The amendments in Definition of Material (Amendments to IAS 1 and IAS 8) clarify the definition of
‘material’ and align the definition used in the Conceptual Framework and the standards.
Items
Item of building (Property plant and eqyuipment)
Non-derivative Financial asset at fair value through
other comprehensive income
Non-derivative Financial asset at fair value through
profit or loss
Investment properties
Insurance contract liabilities
Measurement Bases
Fair value
Fair value
Fair value
Fair value
Fair value
The amendments in Definition of a Business (Amendments to IFRS 3) are changes to Appendix A Defined
terms, the application guidance, and the illustrative examples of IFRS 3 only. They:
The Group has consistently applied the accounting policies as set out in Note 3 to all years presented in these
financial statements. A number of other new standards are also effective from 1 January 2020 but they do not
have a material effect on the Group’s financial statements. Such standards are discussed below:
Together with the revised Conceptual Framework published in March 2018, the IASB also issued
Amendments to References to the Conceptual Framework in IFRS Standards. The document contains
amendments to IFRS 2, IFRS 3, IFRS 6, IFRS 14, IAS 1, IAS 8, IAS 34, IAS 37, IAS 38, IFRIC 12, IFRIC
19, IFRIC 20, IFRIC 22, and SIC-32. Not all amendments, however update those pronouncements with
regard to references to and quotes from the framework so that they refer to the revised Conceptual
Framework. Some pronouncements are only updated to indicate which version of the framework they are
referencing to (the IASC framework adopted by the IASB in 2001, the IASB framework of 2010, or the new
revised framework of 2018) or to indicate that definitions in the standard have not been updated with the new
definitions developed in the revised Conceptual Framework.
18
AIICO INSURANCE PLC AND SUBSIDIARIES
Annual Report and Financial Statements
31 December 2020
Statement of Significant Accounting Policies (Continued)
For the year ended 31 December 2020
2.7 Segment reporting
Segment performance is evaluated based on profit or loss. The Company's financing and income taxes are
managed on a group basis and are not allocated to individual operating segments.
Inter-segment transactions which occurred in 2020 as shown in Note 5.1 Segment statement of profit or loss
and other comprehensive income and 5.2 Segment statement of financial position and results will include
those transfers between business segments.
As a result of the amendments to IFRS 7, the Group has expanded disclosure about offsetting financial assets
and financial liabilities.
For management purposes, the Group is organized into business units based on their products and services.
19
AIICO INSURANCE PLC AND SUBSIDIARIES
Annual Report and Financial Statements
31 December 2020
Statement of Significant Accounting Policies (Continued)
For the year ended 31 December 2020
3 Significant accounting policies
3.1 Basis of Consolidation
(a) Business combination and goodwill
(b) Subsidiaries
Subsidiaries are investees controlled by the Group. The Group controls an investee when it is exposed to, or
has rights to, variable returns from its involvement with the investee and has the ability to affect those returns
through its power over the investee. The financial statements of subsidiaries are included in the consolidated
financial statement from the date on which control commences until the date on which control ceases.
The Group has consistently applied the following accounting policies to all years presented in these consolidated
and separate financial statements.
Business combinations are accounted for using the acquisition method. The cost of an acquisition is
measured as the aggregate of the consideration transferred, measured at acquisition date fair value and the
amount of any non-controlling interest in the acquiree. For each business combination, the Company has an
option to measure any non-controlling interests in the acquiree either at fair value or at the non-controlling
interest’s proportionate share of the acquiree’s identifiable net assets.
When the Group acquires a business, it assesses the financial assets and liabilities assumed for appropriate
classification and designation in accordance with the contractual terms, economic circumstances and
pertinent conditions at the acquisition date. This includes the separation of embedded derivatives in host
contracts by the acquiree. No reclassification of insurance contracts is required as part of the accounting for
the business combination. However, this does not preclude the Group from reclassifying insurance contracts
to accord with its own policy only if classification needs to be made on the basis of the contractual terms and
other factors at the inception or modification date.
If the business combination is achieved in stages, the acquisition date fair value of the acquirer’s previously
held equity interest in the acquiree is re-measured to fair value as at the acquisition date through profit or
loss.
Any contingent consideration to be transferred by the acquirer will be recognized at fair value at the
acquisition date. Subsequent changes to the fair value of the contingent consideration, which is deemed to be
an asset or a liability, will be recognized as measurement year adjustments in accordance with the applicable
IFRS. If the contingent consideration is classified as equity, it will not be remeasured and its subsequent
settlement will be accounted for within equity.
Goodwill is initially measured at cost, being the excess of the fair value of the consideration transferred over
the Company’s share in the net identifiable assets acquired and liabilities assumed and net of the fair value of
any previously held equity interest in the acquiree. After initial recognition, goodwill is measured at cost less
any accumulated impairment losses. For the purposes of impairment testing, goodwill acquired in a business
combination is allocated to an appropriate cash-generating unit that is expected to benefit from the
combination, irrespective of whether other assets or liabilities of the acquiree are assigned to those units.
Where goodwill forms part of a cash-generating unit and part of the operation within that unit is disposed of,
the goodwill associated with the operation disposed of is included in the carrying amount of the operation
when determining the gain or loss on disposal of the operation. Goodwill disposed of in this circumstance is
measured based on the relative values of the operation disposed of and the portion of the cash-generating unit
retained.
20
AIICO INSURANCE PLC AND SUBSIDIARIES
Annual Report and Financial Statements
31 December 2020
Statement of Significant Accounting Policies (Continued)
For the year ended 31 December 2020
3.Significant accounting policies (Continued)
3.1 Basis of Consolidation (Continued)
In the separate financial statements, investments in subsidiaries are measured at cost.
Acquisition-related costs are expensed as incurred
Disposal of subsidiaries
(c) Non-Controlling Interest
3.2 Foreign currency transactions
3.3 Cash and cash equivalents
However, foreign currency differences arising from the translation of the following items are recognised in
Other Comprehensive Income (OCI):
Non-Controlling Interest (NCI) are measured at their proportionate share of the acquiree's identifiable net
assets at the acquisition date.
Transactions in foreign currencies are translated into the respective functional currencies of Group
companies at the exchange rates at the dates of the transactions.
Monetary assets and liabilities denominated in foreign currencies are translated into the functional currency
at the exchange rate at the reporting date. Non-monetary assets and liabilities that are measured at fair value
in a foreign currency are translated into the functional currency at the spot exchange rate when the fair value
was determined.
Non-monetary items that are measured based on historical cost in a foreign currency are translated at the spot
exchange rate at the date of the transaction. Foreign currency differences are generally recognised in profit or
The financial statements of subsidiaries are consolidated from the date the Group acquires control, up to the
date that such effective control ceases.
Changes in the Group’s interest in a subsidiary that do not result in a loss of control are accounted for as
equity transactions (transactions with owners). Any difference between the amount by which the non-
controlling interest is adjusted and the fair value of the consideration paid or received is recognised directly
in equity and attributed to the Group.
Inter-company transactions, balances and unrealised gains on transactions between companies within the
Group are eliminated on consolidation. Unrealised losses are also eliminated in the same manner as
unrealised gains, but only to the extent that there is no evidence of impairment. Accounting policies of
subsidiaries have been changed where necessary to ensure consistency with the policies adopted by the
Group.
On loss of control, the Group derecognises the assets and liabilities of the subsidiary, any related non-
controlling interests and the other components of equity related to the subsidiary. Any gain or loss arising
from the loss of control is recognised in profit or loss. If the Group retains any interest in such subsidiary,
then such interest is measured at fair value at the date that control is lost. Subsequently, that retained interest
is accounted for as an equity-accounted investee or as a financial asset elected to be measured at fair value
through other comprehensive income depending on the level of influence retained.
If the business combination is achieved in stages, fair value of the acquirer’s previously held equity interest
in the acquiree is re-measured to fair value at the acquisition date through profit or loss.
Cash and cash equivalents comprise cash at bank and in hand and short-term deposits with an original
maturity of three months or less from the date of acquisition that are subject to an insignificant risk of
changes in their fair value and are used by the Group in the management of its short term commitments.
For the purpose of the statement of cash flows, cash and cash equivalents consist of cash and cash
equivalents as defined above, net of outstanding bank overdrafts.
Cash and cash equivalents are carried at amortized cost in the consolidated and separate statements of
financial position.
21
AIICO INSURANCE PLC AND SUBSIDIARIES
Annual Report and Financial Statements
31 December 2020
Statement of Significant Accounting Policies (Continued)
For the year ended 31 December 2020
3.Significant accounting policies (Continued)
3.4 Financial instruments
3.4.1 Recognition and initial measurement
3.4.2 Classification of financial instruments
(i)
A financial asset or financial liability is measured initially at fair value plus, except for a financial asset or liability
measured at fair value through profit or loss, transaction costs that are directly attributable to its acquisition or issue.
A trade receivable without a significant financing component is initially measured at the transaction price.
The Group classified its financial assets under IFRS 9, into the following measurement categories:
• Those to be measured at fair value through other comprehensive income (FVOCI) (either with or without recycling)
• Those to be measured at fair value through profit or loss (FVTPL); and
• Those to be measured at amortized cost.
The classification depends on the Group’s business model for managing financial assets and the contractual terms of
the financial assets cash flow (i.e. solely payments of principal and interest- (SPPI test)).
The Group classifies its financial liabilities as liabilities at fair value through profit or loss and liabilities at amortized
cost.
Management determine the classification of the financial instruments at initial recognition.
A financial instrument is any contract that gives rise to a financial asset of one entity and a financial liability or equity
instrument of another entity.
All financial instruments are initially recognized on the trade date, i.e., the date that the Group becomes a party to the
contractual provisions of the instrument.
Business model assessment
• the stated policies and objectives for the portfolio and the operation of those policies in practice. In particular,
whether management’s strategy focuses on earning contractual interest revenue, maintaining a particular interest rate
profile, matching the duration of the financial assets to the duration of the liabilities that are funding those assets or
realising cash flows through the sale of the assets;
• how the performance of the portfolio is evaluated and reported to the Group's management;
• the risks that affect the performance of the business model (and the financial assets held within that business model)
and how those risks are managed;
• how managers of the business are compensated e.g. whether compensation is based on the fair value of the assets
managed or the contractual cash flows collected; and
• the frequency, volume and timing of sales in prior years, the reasons for such sales and its expectations about future
sales activity. However, information about sales activity is not considered in isolation, but as part of an overall
assessment of how the Group’s stated objective for managing the financial assets is achieved and how cash flows are
realised.
The Group makes an assessment of the objective of a business model in which an asset is held at a portfolio level
because this best reflects the way the business is managed and information is provided to management. The
information considered includes:
The business model assessment is based on reasonably expected scenarios without taking 'worst case' or 'stress case’
scenarios into account. If cash flows after initial recognition are realised in a way that is different from the Group's
original expectations, the Group does not change the classification of the remaining financial assets held in that
business model, but incorporates such information when assessing newly originated or newly purchased financial
assets going forward.
Financial assets that are held for trading or managed and whose performance is evaluated on a fair value basis are
measured at FVTPL because they are neither held to collect contractual cash flows nor held both to collect
contractual cash flows and to sell financial assets.
22
AIICO INSURANCE PLC AND SUBSIDIARIES
Annual Report and Financial Statements
31 December 2020
Statement of Significant Accounting Policies (Continued)
For the year ended 31 December 2020
3.Significant accounting policies (Continued)
(ii)
(iii) Reclassifications
In assessing whether the contractual cash flows are solely payments of principal and interest, the Group considers the
contractual terms of the instrument. This includes assessing whether the financial asset contains a contractual term
that could change the timing or amount of contractual cash flows such that it would not meet this condition. In
making the assessment, the Group considers:
• contingent events that would change the amount and timing of cash flows;
• leverage features;
• prepayment and extension terms;
• terms that limit the Group’s claim to cash flows from specified assets (e.g. non-recourse asset features); and
Financial assets with embedded derivatives are considered in their entirety when determining whether their cash
flows are solely payment of principal and interest.
A financial liability is classified at fair value through profit or loss if it is classified as held-for-trading or designated
as such on initial recognition. Directly attributable transaction costs on these instruments are recognised in profit or
loss as incurred. Financial liabilities at fair value through profit or loss are measured at fair value and changes
therein, including any interest expense, are recognised in profit or loss.
Other non-derivative financial liabilities are initially measured at fair value less any directly attributable transaction
costs. Subsequent to initial recognition, these liabilities are measured at amortised cost using the effective interest
method.
Assessment whether contractual cash flows are solely payments of principal and interest
Financial assets are not reclassified subsequent to their initial recognition, except in the year after the Group changes
its business model for managing financial assets that are debt instruments. A change in the objective of the Group’s
business occurs only when the Group either begins or ceases to perform an activity that is significant to its operations
(e.g., via acquisition or disposal of a business line).
The following are not considered to be changes in the business model:
• A change in intention related to particular financial assets (even in circumstances of significant changes in market
conditions)
• A temporary disappearance of a particular market for financial assets
• A transfer of financial assets between parts of the entity with different business models.
As a second step of its classification process the Company assesses the contractual terms of financial asset to identify
whether they meet the SPPI test.
‘Principal’ for the purpose of this test is defined as the fair value of the financial asset at initial recognition and may
change over the life of the financial asset (for example, if there are repayments of principal or amortization of the
premium/discount). ‘Interest’ is defined as consideration for the time value of money and for the credit risk
associated with the principal amount outstanding during a particular year of time and for other basic lending risks
and costs (e.g. liquidity risk and administrative costs), as well as profit margin.
The most significant elements of interest within a lending arrangement are typically the consideration for the time
value of money and credit risk. To make the SPPI assessment, the Group applies judgement and considers relevant
factors such as the currency in which the financial asset is denominated, and the year for which the interest rate is set.
In contrast, contractual terms that introduce a more than de minimis exposure to risks or volatility in the contractual
cash flows that are unrelated to a basic lending arrangement do not give rise to contractual cash flows that are solely
payments of principal and interest on the principal amount outstanding. In such cases, the financial asset is required
to be measured at FVTPL
23
AIICO INSURANCE PLC AND SUBSIDIARIES
Annual Report and Financial Statements
31 December 2020
Statement of Significant Accounting Policies (Continued)
For the year ended 31 December 2020
3.Significant accounting policies (Continued)
3.4.3 Subsequent measurements
(i) Debt instuments
*
*
Investment in debt instrument is measured at FVOCI only if it meets both of the following conditions and is not
designated as at FVTPL:
• the asset is held within a business model whose objective is achieved by both collecting contractual cash flows and
selling financial assets; and
• the contractual terms of the financial asset give rise on specified dates to cash flows that are solely payments of
principal and interest on the principal amount outstanding.
Financial assets that do not meet the criteria for amortized cost or FVOCI are measured at fair value through profit or
loss. The gain or loss arising from changes in fair value of a debt securities that is subsequently measured at fair
value through profit or loss and is not part of a hedging relationship is included directly in the profit or loss and
reported as ‘Net fair value gain/loss’ in the year in which it arises. Interest income from these financial assets is
recognized in profit or loss as investment income.
The debt instrument is subsequently measured at fair value. Gains and losses arising from changes in fair value are
included in other comprehensive income (OCI) and accumulated in a separate component of equity. Impairment
gains or losses, interest revenue and foreign exchange gains and losses are recognized in profit or loss. Upon
disposal or derecognition, the cumulative gain or loss previously recognized in OCI is reclassified from equity to
profit or loss and recognized as realized gain or loss. Interest income from these financial assets is determined using
the effective interest method and recognized in profit or loss as investment income.
Fair value through other comprehensive income (FVOCI)
Fair value through profit or loss (FVTPL)
The subsequent measurement of financial assets depends on its initial classification:
The amortized cost of a financial instrument is the amount at which it was measured at initial recognition, minus
principal repayments, plus or minus the cumulative amortization using the effective interest method of any difference
between the initial amount recognized and the maturity amount, minus any loss allowance. The effective interest
method is a method of calculating the amortised cost of a financial instrument (or group of instruments) and of
allocating the interest income or expense over the relevant year. The effective interest rate is the rate that exactly
discounts estimated future cash payments or receipts over the expected life of the instrument or, when appropriate, a
shorter year, to the instrument's net carrying amount.
When reclassification occurs, the Group reclassifies all affected financial assets in accordance with the new business
model. Reclassification is applied prospectively from the ‘reclassification date’. Reclassification date is ‘the first day
of the first reporting year following the change in business model.
Gains, losses or interest previously recognized are not restated when reclassification occurs.
A financial asset is measured at amortized cost if it meets both of the following conditions and is not designated as at
FVTPL:
• The asset is held within a business model whose objective is to hold assets to collect contractual cash flows; and
• The contractual terms of the financial asset give rise on specified dates to cash flows that are solely payments of
principal and interest on the principal amount outstanding.
The gain or loss on a debt securities that is subsequently measured at amortized cost and is not part of a hedging
relationship is recognized in profit or loss when the asset is derecognized or impaired. Interest income from these
financial assets is determined using the effective interest method and reported in profit or loss as ‘Investment
income’.
24
AIICO INSURANCE PLC AND SUBSIDIARIES
Annual Report and Financial Statements
31 December 2020
Statement of Significant Accounting Policies (Continued)
For the year ended 31 December 2020
3.Significant accounting policies (Continued)
(ii)
3.4.4
(a)
If, in a subsequent year, credit quality improves and reverses any previously assessed significant increase in credit
risk since origination, depending on the stage of the lifetime – stage 2 or stage 3 of the ECL bucket, the Group would
continue to monitor such financial assets for a probationary period of 90 days to confirm if the risk of default has
decreased sufficiently before upgrading such exposure from Lifetime ECL (Stage 2) to 12-months ECL (Stage 1). In
addition to the 90 days probationary year above, the Group also observes a further probationary year of 90 days to
upgrade from Stage 3 to 2. This means a probationary year of 180 days will be observed before upgrading financial
assets from Lifetime ECL (Stage 3) to 12-months ECL (Stage 1).
gains and losses on equity investments in other comprehensive income, there is no subsequent reclassification of fair
value gains and losses to profit or loss.
Dividends from such investments continue to be recognised in profit or loss when the Group’s right to receive
payments is established unless the dividend clearly represents a recovery of part of the cost of the investment.
Changes in the fair value of financial assets at fair value through other comprehensive income are recognised in ‘Net
fair value gain/loss in the other comprehensive income.
The Group recognizes loss allowances for ECL on the following financial instruments that are not measured at
FVTPL:
• Financial assets that are debt instruments measured at amortized cost and FVOCI
Loss allowances for account receivable are always measured at an amount equal to lifetime ECL. The Group has
established a policy to perform an assessment, at the end of each reporting year, of whether a financial instrument’s
credit risk has increased significantly since initial recognition, by considering the change in the risk of default
occurring over the remaining life of the financial instrument.
Based on the above process, the Group groups its financial instruments into Stage 1, Stage 2, Stage 3 and POCI, as
described below:
•Stage 1: When financial assets are first recognised, the Company recognises an allowance based on 12m ECLs.
Stage 1 asset also include facilities where the credit risk has improved and the asset has been reclassified from Stage
2.
• Stage 2: When a financial asset has shown a significant increase in credit risk since origination, the Company
records an allowance for the LT ECLs. Stage 2 asset also include facilities, where the credit risk has improved and
the asset has been reclassified from Stage 3.
• Stage 3: Financial assets considered credit-impaired. The Company records an allowance for the LT ECLs.
Equity instruments
Impairment of financial assets
Overview of the Expected Credit Losses (ECL) principles
The 12month ECL is the portion of LT ECLs that represent the ECLs that result from default events on a financial
instrument that are possible within the 12 months after the reporting date (or a shorter year if the expected life of the
instrument is less than 12 months). Both LT ECLs and 12m ECLs are calculated on either an individual basis or a
collective basis, depending on the nature of the underlying portfolio of financial instruments.
In this section, the instruments mentioned above are all referred to as ‘financial instruments’ or ‘assets’. Equity
instruments are not subject to impairment under IFRS 9.
The ECL allowance is based on the credit losses expected to arise over the life of the asset (the lifetime expected
credit loss or LT ECL), unless there has been no significant increase in credit risk since origination, in which case,
the allowance is based on the 12 months’ expected credit loss (12m ECL) as outlined.
The Group subsequently measures all equity investments at fair value. For equity investment that is not held for
trading, the Group may irrevocably elect to present subsequent changes in fair value in OCI. This election is made on
an investment-by-investment basis. Where the Group’s management has elected to present fair value
25
AIICO INSURANCE PLC AND SUBSIDIARIES
Annual Report and Financial Statements
31 December 2020
Statement of Significant Accounting Policies (Continued)
For the year ended 31 December 2020
3.Significant accounting policies (Continued)
3.4 Financial instruments (Continued)
3.4.4 Impairment of financial assets (Continued)
(b)
The mechanics of the ECL calculations are outlined below and the key elements are as follows:
- quantitative e.g overdue status and non payment of another obligation of the same issuer to the Group.
The Group has defined its maximum year in estimating expected credit losses to be the maximum year to which the
Group is exposed to the credit risk.
The Group has assumed that credit risk of a financial asset has not increased significantly since initial recognition if
the financial asset have low credit risk at reporting date. The Group considers a financial asset to have low risk when
its credit rating is equivalent to the globally understood definition of investment grade.
As a back stop, the Group considers that a significant increase in credit risk occurs no later than when an asset is
more than 30 days past due. Days past due are determined by counting the number of days since the earliest elapsed
due date in respect of which full payment has not been received. Due dates are determined without considering grace
year that might be available to the borrower.
For financial assets for which the Group has no reasonable expectations of recovering either the entire outstanding
amount, or a proportion thereof, the gross carrying amount of the financial asset is reduced. This is considered a
(partial) derecognition of the financial asset.
- Failure by the counterparty to meet obligation 90days past due.
In assessing whether a borrower is in default, the Group considers indicators that are:
- qualitative: e.g indicators of financial asset OR breach of covenant.
• PD: The Probability of Default is an estimate of the likelihood of default over a given time horizon. A default may
only happen at a certain time over the assessed year, if the facility has not been previously derecognised and is still in
the portfolio.
• EAD: The Exposure at Default is an estimate of the exposure at a future default date, taking into account expected
changes in the exposure after the reporting date, including repayments of principal and interest, whether scheduled by
contract or otherwise, expected drawdowns on committed facilities, and accrued interest from missed payments.
• LGD: The Loss Given Default is an estimate of the loss arising in the case where a default occurs at a given time. It
is based on the difference between the contractual cash flows due and those that the lender would expect to receive,
including from the realisation of any collateral. It is usually expressed as a percentage of the EAD.
The Group considers a financial asset to be in default when the following occurs;
- The counterparty is unlikely to pay its credit obligations e.g market information
The calculation of ECLs
The Group calculates ECLs based on a three probability-weighted scenarios to measure the expected cash shortfalls,
• Stage 1: The 12m ECL is calculated as the portion of LT ECLs that represent the ECLs that result from default
events on a financial instrument that are possible within the 12 months after the reporting date. The Group calculates
the 12m ECL allowance based on the expectation of a default occurring in the 12 months following the reporting
date. These expected 12-month default probabilities are applied to a forecast EAD and multiplied by the expected
LGD and discounted by an approximation to the original EIR. This calculation is made for each of the three
scenarios, as explained above.
• Stage 2: When an asset has shown a significant increase in credit risk since origination, the Group records an
allowance for the LT ECLs. The mechanics are similar to those explained above, including the use of multiple
scenarios, but PDs and LGDs are estimated over the lifetime of the instrument. The expected cash shortfalls are
discounted by an approximation to the original EIR.
When estimating the ECLs, the Group considers three scenarios (a base case, an upside and downside). Each of these
is associated with different PDs, EADs and LGDs. When relevant, the assessment of multiple scenarios also
incorporates how defaulted assets are expected to be recovered, including the probability that the assets will cure and
the value of collateral or the amount that might be received for selling the asset. Impairment losses and releases are
accounted for and disclosed separately from modification losses or gains that are accounted for as an adjustment of
the financial asset’s gross carrying value.
The mechanics of the ECL method are summarised below:
26
AIICO INSURANCE PLC AND SUBSIDIARIES
Annual Report and Financial Statements
31 December 2020
Statement of Significant Accounting Policies (Continued)
For the year ended 31 December 2020
3.Significant accounting policies (Continued)
(c)
(d)
(e)
(f)
3.4.5
In its ECL models, the Group relies on a broad range of forward looking information as economic inputs, such as:
• GDP growth
• Unemployment rates
• Inflation rates
• Crude oil price
The inputs and models used for calculating ECLs may not always capture all characteristics of the market at the date
of the financial statements. To reflect this, qualitative adjustments or overlays are occasionally made as temporary
adjustments when such differences are significantly material. Detailed information about these inputs and sensitivity
analysis are provided in Note 46 (d) in the financial statements.
‘Fair value’ is the price that would be received to sell an asset or paid to transfer a liability in an orderly transaction
between market participants at the measurement date in the principal or, in its absence, the most advantageous
market to which the Group has access at that date. The fair value of a liability reflects its non-performance risk.
If a market for a financial instrument is not active, then the Group establishes fair value using a valuation technique.
A market is regarded as active if transactions for the assets or liability take place with sufficient frequency and
volume to provide pricing information on an ongoing basis.The chosen valuation technique makes maximum use of
market inputs, relies as little as possible on estimates specific to the Group, incorporates all factors that market
participants would consider in setting a price and is consistent with accepted economic methodologies for pricing
financial instruments.
To mitigate its credit risks on financial assets, the Group seeks to use collateral, where possible. The collateral comes
in various forms: staff gratuity or guarantors for staff loans, in-house pension fee for agency loan, policy
document/cash value for policy loans, etc. The Company’s accounting policy for collateral assigned to it through its
lending arrangements under IFRS 9 is the same is it was under IAS 39. Collateral, unless repossessed, is not recorded
on the Company’s statement of financial position.
However, the fair value of collateral affects the calculation of ECLs. It is generally assessed, at a minimum, at
inception and re-assessed on yearly basis as deemed necessary.
Loan allowances for ECL are presented in the statement of financial position as follows:
• Financial assets measured at amortised cost: as a deduction from the gross carrying amount of the assets;
• Debt instruments measured at FVOCI: no loss allowance is recognised in the statement of financial position
because the carrying amount of these assets is their fair value. However, the loss allowance is disclosed and
recognised in the fair value reserve in equity (through OCI).
Debt instruments measured at fair value through OCI
Collateral valuation
Presentation of allowance for ECL in the statement of financial position
• Stage 3: For assets considered credit-impaired, the Group recognises the lifetime expected credit losses for these
assets. The method is similar to that for Stage 2 assets, with the PD set at 100%.
The ECLs for debt instruments measured at FVOCI do not reduce the carrying amount of these financial assets in the
statement of financial position, which remains at fair value. Instead, an amount equal to the allowance that would
arise if the assets were measured at amortised cost is recognised in OCI as an accumulated impairment amount, with
a corresponding charge to profit or loss. The accumulated loss recognised in OCI is reclassified to the profit and loss
upon derecognition of the assets.
Fair value measurement
The best evidence of the fair value of a financial instrument at initial recognition is the transaction price – i.e. the fair
value of the consideration given or received. However, in some cases the initial estimate of fair value of a financial
instrument on initial recognition may be different from its transaction price. If this estimated fair value is evidenced
by comparison with other observable current market transactions in the same instrument (without modification or
repackaging) or based on a valuation technique whose variables include only data from
observable markets, then the difference is recognised in profit or loss on initial recognition of the instrument. In other
cases, the fair value at initial recognition is considered to be the transaction price and the difference is not recognised
in profit or loss immediately but is recognised over the life of the instrument on an appropriate basis or when the
instrument is redeemed, transferred or sold, or the fair value becomes observable.
Forward looking information
27
AIICO INSURANCE PLC AND SUBSIDIARIES
Annual Report and Financial Statements
31 December 2020
Statement of Significant Accounting Policies (Continued)
For the year ended 31 December 2020
3.Significant accounting policies (Continued)
3.4.6
3.4.7
3.4.8
3.5
3.6
3.7 Trade payables
3.8 Other payables and accruals
Fair value of fixed income liabilities is not less than the amount payable on demand, discounted from the first date on
which the amount could be required to be paid.
Trade receivables
Reinsurance assets
The Group cedes insurance risk in the normal course of business on the bases of our treaty and facultative
agreements. Reinsurance assets represent balances due from reinsurance companies. Amounts recoverable from
reinsurers are estimated in a manner consistent with settled claims associated with the reinsurer’s policies and are in
accordance with the related reinsurance contract
Trade receivables arising from insurance contracts represent premium receivable with determinable payments that are
not quoted in an active market and the Group has no intention to sell. Premium receivables are those for which credit
notes issued by brokers are within 30days, in conformity with the “NO PREMIUM NO COVER” policy. Refer to
note 3.4 for basis of measurement.
Trade payables are recognised when due and measured on initial recognition at the fair value of the consideration
received less directly attributable transaction costs. Subsequent to initial recognition, they are measured at amortized
cost using the effective interest rate method. Trade payables are recognised as financial liabilities.
Derecognition of financial liabilities
The Group derecognises a financial asset when the contractual rights to the cash flows from the financial asset
expire, or when it transfers the financial asset in a transaction in which substantially all the risks and rewards of
ownership of the financial asset are transferred or in which the Group neither transfers nor retains substantially all the
risks and rewards of ownership and it does not retain control of the financial asset. Any interest in such derecognised
asset financial asset that is created or retained by the Group is recognised as a separate asset or liability.
Derecognition of financial assets
Other payables and accruals are recognised initially at fair value and subsequently measured at amortised cost using
the effective interest method. The fair value of a non-interest bearing liability is its discounted repayment
On derecognition of a financial asset, the difference between the carrying amount of the asset (or the carrying amount
allocated to the portion of the asset transferred), and consideration received (including any new asset obtained less
any new liability assumed) is recognised in profit or loss.
The Group derecognises financial liabilities when, and only when its contractual obligations are discharged or
cancelled, or expired.
When an existing financial liability is replaced by another from the same lender on substantially different terms or the
terms of an existing liability are substantially modified, such an exchange or modification is treated as a
derecognition of the original liability and the recognition of a new liability, and the difference in the respective
carrying amounts is recognized in profit or loss.
The Group writes off a financial asset (and any related allowances for impairment losses) when the Group determines
that the assets are uncollectible. Financial assets are written off either partially or in their entirety. This determination
is reached after considering information such as the occurrence of significant changes in the borrower/issuer’s
financial position such that the borrower/issuer can no longer pay the obligation, or that proceeds from collateral will
not be sufficient to pay back the entire exposure. If the amount to be written off is greater than the accumulated loss
allowance, the difference is first treated as an addition to the allowance that is then applied against the gross carrying
amount. Any subsequent recoveries are credited to impairment loss on financial assets.
However, financial assets that are written off could still be subject to enforcement activities in order to comply with
the Group's procedures for recovery of amount due.
Write off
28
AIICO INSURANCE PLC AND SUBSIDIARIES
Annual Report and Financial Statements
31 December 2020
Statement of Significant Accounting Policies (Continued)
For the year ended 31 December 2020
3.Significant accounting policies (Continued)
Other payables and accruals (Continued)
3.9 Deferred expenses
(a)
(b) Deferred expenses -Reinsurance commissions
3.10 Other receivables and prepayment
3.11 Income tax
(a) Current tax
(b) NITDA Levy
(c) Deferred income taxation
-
-
Deferred acquisition costs (DAC)
Those direct and indirect costs incurred during the financial year arising from the writing or renewing of insurance
contracts and are deferred to the extent that these costs are recoverable out of future premiums. All other acquisition
costs are recognized as an expense when incurred.
Acquisition cost for life insurance are expensed as incurred. Subsequent to initial recognition, Acquisition cost for
general insurance are amortized over the year in which the related revenues are earned. Changes in the expected
useful life or the expected pattern of consumption of future economic benefits embodied in the asset are accounted
for by changing the amortization year and are treated as a change in an accounting estimate. DAC are derecognized
when the related contracts are either settled or disposed off.
Commissions receivable on outwards reinsurance contracts are deferred and amortized on a straight line basis over
the term of the expected premiums payable.
Other receivables are carried at amortised cost using the effective interest rate less accumulated impairment losses.
Prepayments are carried at cost less accumulated amortization and are amortized on a straight line basis to the profit
or loss account.
Income tax expense comprises current and deferred tax. It is recognised in profit or loss except to the extent that this
relates to a business combination, or items recognized directly in equity or other comprehensive income.
amount. Discounting is omitted for payables that are less than one year as the effect is not material. A financial
liability is derecognized when the obligation under the liability is discharged or cancelled or expires. When an
existing financial liability is replaced by another from the same lender on substantially different terms, or the terms of
an existing liability are substantially modified, such an exchange or modification is treated as a derecognition of the
original liability and the recognition of a new liability, and the difference in the respective carrying amounts is
recognised in the profit or loss. Gains and losses are recognised in the profit or loss when the liabilities are
derecognized. Other payables are recognised as other financial liabilities.
Current tax comprises the expected tax payable or receivable on the taxable income or loss for the year and any
adjustment to the tax payable or receivable in respect of previous years. The amount of current tax payable or
receivable is the best estimate of the tax amount expected to be paid or received that reflects uncertainty related to the
income taxes, if any. It is measured using tax rate enacted or substantively enacted at the reporting date. Current tax
also includes any tax arising from dividends received by the Group.
The National Information Technology Development Agency Act (2007) empowers and mandates the Federal Inland
Revenue Service (FIRS) to collect and remit 1% of profit before tax of Companies with turnovers of a minimum of
₦100million under the third schedule of the Act.
Deferred tax is recognised in respect of temporary differences between the carrying amounts of assets and liabilities
for financial reporting purposes and the amounts used for taxation purposes.
temporary differences arising on the initial recognition of assets or liabilities in a transaction that is not a business
combination and that affects neither accounting nor taxable profit;
temporary differences related to investments in subsidiaries, associates and joint arrangements to the extent that the
Group is able to control timing of the reversal of the temporary differences and it is probable that they will not reverse
in the foreseeable future; and
Deferred tax is not recognised for:
29
AIICO INSURANCE PLC AND SUBSIDIARIES
Annual Report and Financial Statements
31 December 2020
Statement of Significant Accounting Policies (Continued)
For the year ended 31 December 2020
3.Significant accounting policies (Continued)
-
3.12 Investment properties
3.13 Intangible assets and goodwill
(a) Goodwill
(b) Intangible assets
Computer software, not integral to the related hardware acquired by the Group, is stated at cost less accumulated
amortisation and accumulated impairment losses.
Costs associated with maintaining computer software programmes are recognised as an expense as incurred.
Subsequent expenditure on computer software is capitalised only when it increases the future economic benefits
embodied in the specific asset to which it relates. The estimated useful life is 5 years.
Intangible assets are derecognized on disposal or when no future economic benefits are expected from their use or
disposal.
Gains or losses arising from derecognition of an intangible asset are measured as the difference between the net
disposal proceeds and the carrying amount of the asset and are recognized in profit or loss when the asset is
derecognized.
taxable temporary difference arising on the initial recognition of goodwill.
Goodwill is measured at cost less accumulated impairment losses
Investment properties are initially measured at cost and subsequently at fair value with any change therein recognised
in profit or loss. Any gain or loss on disposal of investment properties (calculated as the difference between the net
proceeds from disposal and the carrying amount of the item) is recognised in profit or loss.
Intangible assets acquired separately are measured on initial recognition at cost. Following initial recognition,
intangible assets are carried at cost less any accumulated amortization and any accumulated impairment losses.
Internally generated intangible assets, excluding capitalized development costs, are not capitalized and expenditure is
reflected in the profit or loss in the year in which the expenditure is incurred.
The useful lives of intangible assets are assessed to be finite.
Intangible assets with finite lives are amortized over the useful economic lives, using a straight line method, and
assessed for impairment whenever there is an indication that the intangible asset may be impaired. The amortization
year and the amortization method for an intangible asset with a finite useful life are reviewed at least at each financial
year end. Changes in the expected useful life or the expected pattern of consumption of future economic benefits
embodied in the asset are accounted for by changing the amortization year or method, as appropriate, and are treated
as changes in accounting estimates. The amortization expense on intangible assets with finite lives is recognized in
the profit or loss in the expense category consistent with the function of the intangible asset.
Deferred tax assets are recognised for unused tax losses, unused tax credits and deductible temporary differences to
the extent that its probable that future taxable profits will be available against which they can be used. Future taxable
profits are determined based on business plans for individual subsidiaries in the Group. Deferred tax assets are
reviewed at each reporting date and are reduced to the extent that it is no longer probable that the related tax benefit
will be realised; such reductions are reversed when the probability of future taxable profit improves.
Unrecognised deferred tax asset are reassessed at each reporting date and recognised to the extent that it has become
probable that future taxable profits will be available against which they can be used.
Deferred tax is measured at the tax rates that are expected to be applied to temporary differences when they reverse,
using tax rates enacted or substantially enacted at the reporting date.
The measurement of deferred tax reflects the tax consequences that would follow the manner in which the Group
expects, at the end of the reporting year, to recover or settle the carrying amount of its assets and liabilities. For this
purpose, the carrying amount of investment property measured at fair value presumed to be recovered through sale,
and the Group has not been rebutted this presumption.
Deferred tax assets and liabilities are offset if there is a legally enforceable right to offset current tax liabilities and
assets, and they relate to taxes levied by the same tax authority on the same taxable entity, or on different tax entities,
but they intend to settle current tax liabilities and assets on a net basis or their tax assets and liabilities will be realised
simultaneously.
30
AIICO INSURANCE PLC AND SUBSIDIARIES
Annual Report and Financial Statements
31 December 2020
Statement of Significant Accounting Policies (Continued)
For the year ended 31 December 2020
3.Significant accounting policies (Continued)
(c) Present value of acquired in-force business (PVIF)
(d) Subsequent expenditure
(e) Amortisation
(f) Imapairment on goodwill
3.14 Property and equipment
(a) Recognition and measurement
Goodwill is evaluated for impairment annually or whenever we identify certain triggering events or circumstances
that would more likely than not reduce the fair value of a reporting unit below its carrying amount. Events or
circumstances that might indicate an interim evaluation is warranted include, among other things, unexpected adverse
business conditions, macro and reporting unit specific economic factors (for example, interest rate and foreign
exchange rate fluctuations, and loss of key personnel), supply costs, unanticipated competitive activities, and acts by
governments and courts.
Amortisation is calculated to write off the cost of intangible assets less their estimated residual values using the
straight line method over their estimated useful lives, and generally recognised in profit or loss. Goodwill is not
amortised.
Amortisation methods, useful lives and residual values are reviewed at each reporting date and adjusted if
Items of property and equipment are measured at cost less accumulated depreciation and impairment losses except
for building (see note 2.4). Cost includes expenditures that are directly attributable to the acquisition of the asset. The
cost of self-constructed assets includes the cost of materials and direct labour, any other costs directly attributable to
bringing the assets to a working condition for their intended use, the costs of dismantling and removing the items and
restoring the site on which they are located, and capitalised borrowing costs. Purchased software that is integral to the
functionality of the related equipment is capitalised as part of that equipment.
Buildings are measured at fair value less accumulated depreciation while land is not depreciated (see note 2.4).
Valuations are performed frequently (within every three year (3yrs)) to ensure that the fair value of the revalued asset
does not differ materially from its carrying amount. Accumulated depreciation as at the revaluation date is eliminated
against the gross carrying amount and the net value is restated to the revalued amount of the asset. Capital work-in-
progress is stated at cost and not depreciated. Depreciation on capital work-in-progress commences when the assets
are ready for their intended use and have been reclassified to the related asset category.
Subsequent expenditure is capitalised only when it increases the future economic benefits embodied in the specific
asset to which it relates. All other expenditure, including expenditure on internally generated goodwill and brands, is
recognised in profit or loss as incurred.
If significant parts of an item of property and equipment have different useful lives, they are accounted for as
separate items (major components) of property and equipment. Any gain or loss on disposal of an item of property
and equipment is recognised in profit or loss.
When a portfolio of insurance contracts is acquired, whether directly from another insurance company or as part of a
business combination, the difference between the fair value of insurance rights acquired and insurance obligation
assumed are measured using the Group’s existing accounting policies and it is recognized as the value of the acquired
in-force business.
Subsequent to initial recognition, the intangible asset is carried at cost less accumulated amortization and
accumulated impairment losses. The intangible asset is amortized over the useful life of the acquired in-force policy
during which future premiums are expected, which typically varies between five and fifty years. Changes in the
expected useful life or the expected pattern of consumption of future economic benefits embodied in the asset are
accounted for by changing the amortization year and they are treated as a change in an accounting estimate. An
impairment review is performed whenever there is an indication of impairment. When the recoverable amount is less
than the carrying value, an impairment loss is recognized in the profit and loss. PVIF is also considered in the liability
adequacy test for each reporting year.
PVIF is derecognized when the related contracts are settled or disposed off.
31
AIICO INSURANCE PLC AND SUBSIDIARIES
Annual Report and Financial Statements
31 December 2020
Statement of Significant Accounting Policies (Continued)
For the year ended 31 December 2020
3.Significant accounting policies (Continued)
(b) Subsequent expenditure
(c) Depreciation
Land Not depreciated
Buildings 50 years
5 years
Motor vehicles 4 years
4 years
Capital work in progress Not depreciated
(d) De-recognition
(e) Reclassification to investment property
3.15 Statutory deposit
3.16 Insurance contract liabilities
(a)
At each reporting date, an assessment is made of whether the recognized life insurance liabilities are adequate by
carrying out a liability adequacy test. The liability value is adjusted to the extent that it is insufficient to meet
expected future benefits and expenses. In performing the adequacy test, current best estimates of future contractual
cash flows, including related cash flows such as claims handling and policy administration expenses, policyholder
options and guarantees, as well as investment income from assets backing such liabilities, are used. Discounted cash
flows model is used in the valuation.
The interest rate applied is based on management’s prudent expectation of current market interest rates. Any
inadequacy is recorded in the profit or loss by establishing an additional insurance liability for the remaining loss. In
subsequent years, the liability for a block of business that has failed the adequacy test is based on the assumptions
that are established at the time of the loss recognition. The assumptions do not include a margin for adverse
deviation.
Statutory deposit represent 10% of required minimum paid up capital of AIICO Insurance PLC. The amount is held
by CBN (Central Bank of Nigeria) pursuant to Section 10(3) of the Insurance Act 2003. Statutory deposit is
measured at cost.
When the use of a property changes from owner- occupied to investment property, the property is remeasured to fair
value and reclassified accordingly. Any gain arising on this remeasurement is recognised in profit or loss to the extent
that it reverses a previous impairment loss on the specific property, with any remaining gain recognised in OCI and
presented in the revaluation reserve. Any loss is recognised in profit or loss.
Life insurance contract liabilities
An item of property and equipment is derecognised on disposal or when no future economic benefits are expected
from its use or disposal. Any gain or loss arising on de-recognition of the asset (calculated as the difference between
the net disposal proceeds and the carrying amount of the asset) is included in profit or loss in the year the asset is
derecognised. Any revaluation gain or loss previously recognised in reserve is derecognised into retained earnings
Subsequent expenditure is capitalised only if it is probable that the future economic benefits associated with the
expenditure will flow to the Group.
Depreciation methods, useful lives and residual values are reviewed at each reporting date and adjusted if
appropriate. Assets that are subject to depreciation are reviewed for impairment whenever events or changes in
circumstances indicate that the carrying amount may not be recoverable. An asset's carrying amount is written down
immediately to its recoverable amount if the asset's carrying amount is greater than its estimated recoverable amount.
The recoverable amount is the higher of the asset's value less costs to sell or the value in use. Gains and losses on
disposal are determined by comparing proceeds with carrying amount. Gains and losses are included in the profit or
loss account for the year.
Depreciation is calculated to write off the cost of items of property and equipment less their estimated residual value
using the straight-line method over the estimated useful lives, and is generally recognised in profit or loss. Leased
assets are depreciated over the shorter of the lease term and their useful lives unless it is reasonably certain that the
Group will obtain ownership by the end of the lease term.
Furniture and equipment
Leased motor vehicles
The estimated useful lives of significant items of property and equipment for current and comparative years are as
follows:
32
AIICO INSURANCE PLC AND SUBSIDIARIES
Annual Report and Financial Statements
31 December 2020
Statement of Significant Accounting Policies (Continued)
For the year ended 31 December 2020
3.Significant accounting policies (Continued)
(b)
(c)
3.16.2
Guaranteed annuity
Guaranteed annuity is recognised as an insurance contract. Annuity premium are recognised as income when
received from policy holders, payments to policy holders are recognised as an expense when due. The amount of
insurance risk under contracts with guaranteed annuity is also dependent on the number of contract holders that will
exercise their option (‘option take-up rate’). This will depend significantly on the investment conditions that apply
when the options can be exercised. The lower the current market interest rates in relation to the rates implicit in the
guaranteed annuity rates, the more likely it is that contract holders will exercise their options. Continuing
improvements in longevity reflected in current annuity rates will increase the likelihood of contract holders exercising
their options as well as increasing the level of insurance risk borne by the Company under the annuities issued. The
Group does not have sufficient historical data on which to base its estimate of the number of contract holders who
exercise their option.
However, when contracts contain both financial risk component and significant insurance risk component and cash
flows from the two components are not distinct and cannot be measured reliably, the underlying amounts
Investment contract liabilities
are not unbundled but are recognized in the statement of financial position account as insurance contract liabilities.
After which, the actuary, using the contract terms, allocates a portion to the deposit component during the actuarial
valaution. The portion allocated to the deposit component is subsequently debited to the profit and loss account as
part of the actuarially determined liabilities with a corresponding credit posted to other investmnent contract liabilities
account in order to track the deposit element separately from the risk element.
Deposits and withdrawals are recorded directly as an adjustment to the liability in the statement of financial position
and are not recognised as gross premium in the consolidated profit or loss account. The liability is derecognized when
the contract expires, is discharged or is cancelled. When contracts contain both a financial risk component and a
significant insurance risk component and the cash flows from the two components are distinct and can be measured
reliably, the underlying amounts are unbundled. Any premiums relating to the insurance risk component are
accounted for on the same basis as insurance contracts and the remaining element is accounted for as a deposit
through the statement of financial position as described above.
Non-life insurance contract liabilities
Non-life insurance contract liabilities include the outstanding claims provision, the provision for unearned premium
and the provision for premium deficiency. The outstanding claims provision is based on the estimated ultimate cost
of all claims incurred but not settled at the reporting date, whether reported or not, together with related claims
expenses. Delays can be experienced in the notification and settlement of certain types of claims, therefore, the
ultimate cost of these cannot be known with certainty at the reporting date. The liability is calculated at the reporting
based on empirical data and current assumptions that may include a margin for adverse deviation. The liability is not
discounted for the time value of money. No provision for equalization or catastrophe reserves is recognized. The
liabilities are derecognized when the obligation to pay a claim expires, is discharged or is cancelled.
The provision for unearned premiums represents that portion of premiums received or receivable that relates to risks
that have not yet expired at the reporting date. The provision is recognized when contracts are entered into and
premiums are charged, and is brought to account as premium income over the term of the contract in accordance with
the pattern of insurance service provided under the contract.
At each reporting date, the Group reviews its unexpired risk and a liability adequacy test is performed to determine
whether there is any overall excess of expected claims and deferred acquisition costs over unearned premiums. This
calculation uses current estimates of future contractual cash flows after taking account of the investment return
expected to arise on assets relating to the relevant non-life insurance technical provisions. If these estimates show that
the carrying amount of the unearned premiums (less related deferred acquisition costs) is inadequate, the deficiency
is recognized in the profit or loss by setting up a provision for premium deficiency.
Investment contract liabilities are recognized when contracts are entered into and premiums are received. These
liabilities are initially recognized at fair value, this being the transaction price excluding any transaction costs directly
attributable to the issue of the contract. Subsequent to initial recognition investment, contract liabilities are measured
at amortized cost.
33
AIICO INSURANCE PLC AND SUBSIDIARIES
Annual Report and Financial Statements
31 December 2020
Statement of Significant Accounting Policies (Continued)
For the year ended 31 December 2020
3.Significant accounting policies (Continued)
3.17 Portfolio under Management
(i) Fiduciary activities
(ii) Fixed income liability
3.18 Leases
As a lessee
During the year, the group has no lease liability as all leases were rental and leased properties prepaid.
As a lessor
These are funds managed by the Group on behalf of its clients. The interest rate on these liabilities are agreed with
the client at the inception of the investment. The Group invests these funds in finanacial instruments in order to
generate at the minimum, the agreed rate of returns. The interest spread on these investments is the return to the
Group. These liabilities are initially measured at fair value less any directly attributable transaction costs. Subsequent
to initial recognition, these liabilities are measured at amortised cost using the effective interest method.
The Group recognises a right-of-use asset and a lease liability at the lease commencement date. The right-of-use asset
is initially measured at cost, which comprises the initial amount of the lease liability adjusted for any lease payments
made at or before the commencementdate, plus any initial direct costs incurred and an estimate of costs to dismantle
and remove the underlying asset or to restore the underlying asset or the site on which it is located, less any lease
incentives received.
The Group acts in other fiduciary capacities that results in holding or placing of assets on behalf of individuals and
other institutions. These assets arising thereon are excluded from these financial statement as they are not assets of
the Group. However, fee income earned and fee expenses incurred by the Group relating to the Group's
responsibilities from fiduciary activities are recognised in profit or loss.
The right-of-use asset is subsequently depreciated using the straight-line method from the commencement date to the
end of the lease term, unless the lease transfers ownership of the underlying asset to the Group by the end of the lease
term or the cost of the right-of-use asset reflects that the Group will exercise a purchase option. In that case the right-
of-use asset will be depreciated over the useful life of the underlying asset, which
At commencement or on modification of a contract that contains a lease component, the Group allocates the
consideration in the contract to each lease component on the basis of its relative stand-alone prices. However, for the
leases of property the Group has elected not to separate non-lease components and account for the lease and non-lease
components as a single lease component.
To classify each lease, the Group makes an overall assessment of whether the lease transfers substantially all of the
risks and rewards incidental to ownership of the underlying asset. If this is the case, then the lease is a finance lease;
if not, then it is an operating lease. As part of this assessment, the Group considers certain indicators such as whether
the lease is for the major part of the economic life of the asset.
is determined on the same basis as those of property and equipment. In addition, the right-of-use asset is yearically
reduced by impairment losses, if any, and adjusted for certain remeasurements of the lease liability.
The lease liability is initially measured at the present value of the lease payments that are not paid at the
commencement date, discounted using the interest rate implicit in the lease or, if that rate cannot be readily
determined, the Group’s incremental borrowing rate. Generally, the Group uses its incremental borrowing rate as the
discount rate.
The lease liability is measured at amortised cost using the effective interest method. It is remeasured when there is a
change in future lease payments arising from a change in an index or rate, if there is a change in the Group’s estimate
of the amount expected to be payable under a residual value guarantee, if the Group changes its assessment of
whether it will exercise a purchase, extension or termination option or if there is a revised in-substance fixed lease
payment.
At inception or on modification of a contract that contains a lease component, the Group allocates the consideration
in the contract to each lease component on the basis of their relative standalone prices.
When the Group acts as a lessor, it determines at lease inception whether each lease is a finance lease or an operating
lease.
34
AIICO INSURANCE PLC AND SUBSIDIARIES
Annual Report and Financial Statements
31 December 2020
Statement of Significant Accounting Policies (Continued)
For the year ended 31 December 2020
3.Significant accounting policies (Continued)
3.19 Provisions
3.20 Share capital
(a) Ordinary shares
(b) Dividends on ordinary share capital
(c)
3.21 Deposit for shares
3.22 Revaluation reserve
3.23 Fair value reserve
(a) Financial assets at fair value through OCI (debt instruments)
(b) Financial assets designated at fair value through OCI (equity instruments)
Provisions are recognised when the Group has a present obligation (legal or constructive) as a result of a past event,
and it is probable that an outflow of resources embodying economic benefits will be required to settle the obligation
and a reliable estimate can be made of the amount of the obligation. Where the Group expects some or all of a
provision to be reimbursed, the reimbursement is recognised as a separate asset, but only when the reimbursement is
certain. The expense relating to any provision is presented in the profit or loss net of any reimbursement. If the effect
of the time value of money is material, provisions are discounted using a current pre-tax rate that reflects, where
appropriate, the risks specific to the liability.
Where discounting is used, the increase in the provision due to the passage of time is recognised as a finance cost.
The Group’s issued ordinary shares are classified as equity instruments. Incremental external costs that are directly
attributable to the issue of these shares are recognized in equity.
For debt instruments at fair value through OCI, interest income, foreign exchange revaluation and impairment losses
or reversals are recognised in the statement of profit or loss and computed in the same manner as for financial assets
measured at amortised cost. The remaining fair value changes are recognised in OCI. Upon derecognition, the
cumulative fair value change recognised in OCI is recycled to profit or loss. The Group’s debt instruments at fair
value through OCI includes investments in quoted debt instruments included under other non-current financial assets.
Upon initial recognition, the Group can elect to classify irrevocably its equity investments as equity instruments
designated at fair value through OCI when they meet the definition of equity under IAS 32 Financial Instruments:
Presentation and are not held for trading. The classification is determined on an instrument-by-instrument basis.
The Group classifies share premium as equity when there is no obligation to transfer cash or other assets.
Subsequent to initial recognition, an item of property and equipment and intangibles is carried using the cost model.
However, if such an item is revalued, the whole class of asset to which that asset belongs has to be revalued. The
revaluation gains is recognised in equity, unless it reverses a decrease in the fair value of the same asset which was
previously recognised as an expense, in which it is recognised in profit or loss. A subsequent decrease in the fair
value is charged against this reserve to the extent that there is a credit balance relating to the same asset, with the
balance being recognised in profit or loss. When a revalued asset is disposed of, any revaluation surplus is left in
equity under the heading retained earnings.
Share premium
The group recognises funds received from investors for the purposes of equity purchase as deposit for shares pending
the allotment of its shares.
To classify each lease, the Group makes an overall assessment of whether the lease transfers substantially all of the
risks and rewards incidental to ownership of the underlying asset. If this is the case, then the lease is a finance lease;
if not, then it is an operating lease. As part of this assessment, the Group considers certain indicators such as whether
the lease is for the major part of the economic life of the asset.
If an arrangement contains lease and non-lease components, then the Group applies IFRS 15 to allocate the
consideration in the contract.
The Group recognises lease payments received under operating leases as income on a straightline basis over the lease
term as part of ‘other revenue’. Generally, the accounting policies applicable to the Group as a lessor in the
comparative year were not different from IFRS 16.
Dividends on ordinary shares when approved by the Group’s shareholders are paid from retained earnings.
35
AIICO INSURANCE PLC AND SUBSIDIARIES
Annual Report and Financial Statements
31 December 2020
Statement of Significant Accounting Policies (Continued)
For the year ended 31 December 2020
3.Significant accounting policies (Continued)
3.24 Exchange gains reserve
3.25 Technical reserves
(a) General Insurance Contracts
(b) Reserves for Outstanding Claims
(c) Reserves for Unexpired Risk
(d) Life Business
General Reserve Fund
(e) Liability Adequacy Test
3.26 Statutory reserve
3.27 Contingency reserves
(a)
(b)
At each end of the reporting year, liability adequacy tests are performed by an Actuary to ensure the adequacy of the
contract liabilities net of related deferred acquisition cost (DAC) assets. In performing these tests, current best estimates
of future contractual cash flows and claims handling and administration expenses, as well as investment income from the
assets backing such liabilities, are used. Any deficiency is immediately recognised in profit or loss initially by writing
off DAC and by subsequently establishing a provision for losses arising from liability adequacy tests “the unexpired risk
provision”. The provisions of the Insurance Act 2003 requires an actuarial valuation for life reserves only. However,
IFRS 4 requires a liability adequacy test for both life and non-life insurance reserves. Hence, the Group carries out
actuarial valuation on both life and non-life insurance businesses.
This is made up of net liabilities on policies in force as computed by the actuaries at the time of the actuarial
valuation and an additional 25 percent of net premium for every year between valuation date
The reserve for outstanding claims is maintained at the total amount of outstanding claims incurred and reported plus
10 percent from claims incurred but not reported (IBNR) as at the reporting date. The IBNR is based on the liability
adequacy test.
A provision for additional unexpired risk reserve (AURR) is recognized for an underwriting year where it is
envisaged that the estimated cost of claims and expenses would exceed the unearned premium reserve (UPR)”.
In accordance with the provisions of Section 69 of the Pension Reform Act 2004, the statutory reserve is credited with
an amount equivalent to 12.5% of net profit after tax or such other percentage of the net profit as the National Pension
Commission may from time to time stipulate.
In compliance with Section 21 (2) of Insurance Act 2003, the contingency reserve is credited with the greater of 3% of
total premiums, or 20% of the net profits. This shall accumulate until it reaches the amount of greater of minimum paid-
up capital or 50 percent of net premium.
In compliance with Section 22 (1) (b) of Insurance Act 2003, the contingency reserve is credited with the higher of 1%
of gross premiums or 10% of net profit and accumulated until it reaches the amount of the minimum paid up capital –
Insurance ACT 22 (1)(b).
These are computed in compliance with the provisions of Section 20, 21, and 22 of the Insurance Act 2003 as
follows:
Exchange gain reserves comprises the cumulative net change when fair value through other comprehensive income
investment in foreign currency are translated into the functional currency. When such investment is disposed of, the
cumulative amount of the exchange differences recognised in other comprehensive income shall be reclassified to the
profit or loss account.
Life business
Non-life business
Reserves for unearned premium in compliance with Section 20 (1) (a) of Insurance Act 2003, the reserve for
unearned premium is calculated on a time apportionment basis in respect of the risks accepted during the year.
36
AIICO INSURANCE PLC AND SUBSIDIARIES
Annual Report and Financial Statements
31 December 2020
Statement of Significant Accounting Policies (Continued)
For the year ended 31 December 2020
3.Significant accounting policies (Continued)
3.28 Retained earnings
This account accumulates profits or losses from operations.
3.29 Revenue recognition
(a) Gross premium income
(b)
(c)
(d) Change in life fund
(e)
(f)
(g) Investment property rental income
Reinsurance premium
Gross recurring premiums on life are recognised as revenue when payable by the policyholder. For single premium
business, revenue is recognised on the date on which the policy is effective.
Gross general insurance written premiums comprise the total premiums receivable for the whole year of cover provided
by contracts entered into during the accounting year. They are recognised on the date on which the policy commences.
Premiums include any adjustments arising in the accounting year for premiums receivable in respect of business written
in prior accounting years. Rebates that form part of the premium rate, such as no-claim rebates, are deducted from the
gross premium; others are recognised as an expense. Premiums collected by intermediaries, but not yet received, are
assessed based on estimates from underwriting or past experience and are included in premiums written.
Unearned premiums are those proportions of premiums written in a year that relate to years of risk after the reporting
date. Unearned premiums are calculated on a daily pro rata basis. The proportion attributable to subsequent years is
deferred as a provision for unearned premiums.
Gross reinsurance premiums on life and investment contracts are recognised as an expense on the earlier of the date
when premiums are payable or when the policy becomes effective.
Gross general reinsurance premiums written comprise the total premiums payable for the whole cover provided by
contracts entered into the year and are recognised on the date the policy becomes effective.
Fees and commission income
Investment income
Premiums includes any adjustments arising in the accounting year in respect of reinsurance contracts that commenced in
prior accounting years.
Unearned reinsurance premiums are those proportions of premiums written in a year that relate to years of risk after the
reporting date. Unearned reinsurance premiums are deferred over the term of the underlying direct insurance policies for
risks-attaching contracts and over the term of the reinsurance contract for losses occurring contracts.
Insurance and investment contract policyholders are charged for policy administration services, investment management
services, surrenders and other contract fees. The administration fee is calculated as a flat charge payable monthly from
contributions received while the fund management fee is an asset based fee charged as a percentage of the opening net
assets value of the pension fund investment. These fees are recognized as revenue over the year in which the related
services are performed. If the fees are for services provided in future years, then they are deferred and recognized over
those future years.
Actuarial valuation of the ordinary life and annuity fund is conducted at reporting date to determine the net liabiities on
the existing policies and the adequacy of the assets representing the insurance fund. The changes in the fund is charged
to the income statement.
Interest income is recognized in the profit or loss as it accrues and is calculated by using the effective interest rate
method. Fees and commissions that are an integral part of the effective yield of the financial asset or liability are
recognized as an adjustment to the effective interest rate of the instrument. Investment income also includes dividends
when the right to receive payment is established. For listed securities, this is the date the security is listed as ex-dividend.
Realized gains and losses recorded in the profit or loss on investments include gains and losses on financial assets and
investment property. Gains and losses on the sale of investments are calculated as the difference between net sales
proceeds and the original or amortized cost and are recorded on occurrence of the sale transaction.
Realized gains and losses
The fair value gain or loss on investment property is recognised in the profit or loss account
Rental income from investment property is recognised as revenue on a straight line basis over the term of the lease. Lease
incentives granted are recognised as an integral part of the total rental income, over the term of the lease. Durng the
year, there was no rent receoved on the properties.
37
AIICO INSURANCE PLC AND SUBSIDIARIES
Annual Report and Financial Statements
31 December 2020
Statement of Significant Accounting Policies (Continued)
For the year ended 31 December 2020
3.Significant accounting policies (Continued)
3.30 Benefits, claims and expenses recognition
(a) Gross benefits and claims
(b)
(c) Reinsurance expenses
3.31 Underwriting expenses
3.32 Other operating income
3.33 Employee benefits
(a)
(b)
3.34 Other operating expenses
3.35 Finance cost
3.36 Earnings per share
Reinsurance claims are recognized when the related gross insurance claim is recognized according to the terms of the
relevant contract.
Reinsurance cost represents outward premium paid to reinsurance companies less the unexpired portion as at the end of
the accounting year.
Expenses are decreases in economic benefits during the accounting year in the form of outflows, depletion of assets or
incurrence of liabilities that result in decrease in equity, other than those relating to distributions to equity participants.
Other operating expenses are accounted for on accrual basis and recognized in the profit or loss upon utilization of the
service or at the date of their origin.
Interest paid is recognized in the profit or loss as it accrues and is calculated by using the effective interest rate method.
Accrued interest is included within the carrying value of the interest bearing financial liability.
The Group presents basic earnings per share (EPS) data for its ordinary shares. Basic EPS is calculated by dividing the
profit or loss attributable to ordinary shareholders of the Group by the weighted average number of ordinary shares
outstanding during the year, excluding treasury shares held by the Group. Diluted EPS is determined by adjusting the
profit or loss attributable to ordinary shareholders and the weighted average number of ordinary shares outstanding for
the effects of all dilutive potential ordinary shares.
Short term employee benefit
Defined contribution plans
Underwriting expenses comprise acquisition costs and other underwriting expenses. Acquisition costs comprise all direct
and indirect costs arising from the writing of insurance contracts. Examples of these costs include, but are not limited to,
commission expense, supervisory levy, superintending fees and other technical expenses. Other underwriting expenses
are those incurred in servicing existing policies/ contract. These expenses are recognised in the accounting year in which
they are incurred.
Other operating income comprises of income from realised profits on sale of securities, realised foreign exchange gains
and other sundry income.
Short term employee benefits are expensed as the related service is provided. A liability is recognised for the amount
expected to be paid if the Group has a present legal or constructive obligation to pay this amount as a result of past
service provided by the employee and the obligation can be estimated reliably.
The Company operates a contributory pension scheme in line with the provisions of the Pension Reform Act 2014. The
Pension Reform Act 2014 requires a minimum contributions of 8% from the staff and 10% by the Company based on
the basic salaries and other designated allowances. The Pension Reform Act 2014 also allows the Company to bear the
full contribution on behalf of the employees as far as the minimum contributions of 18% is met. The Company
contributes 18% of the employees' emolument as pension contributions which is charged to the profit or loss account.
Obligations for contributions to defined contribution plans are expensed as the related service is provided. Prepaid
contributions are recognised as an asset to the extent that a cash refund or a reduction in future payments is available.
Reinsurance claims
Gross benefits and claims for life insurance contracts include the cost of all claims arising during the year, including
internal and external claims handling costs that are directly related to the processing and settlement of claims. Changes in
the gross valuation of insurance are also included. Death claims and surrenders are recorded on the basis of notifications
received. Maturities and annuity payments are recorded when due. General insurance claims include all claims occurring
during the year, whether reported or not, related internal and external claims handling costs that are directly related to the
processing and settlement of claims, a reduction for the value of salvage and other recoveries, and any adjustments to
claims outstanding from previous years.
38
AIICO INSURANCE PLC AND SUBSIDIARIES
Annual Report and Financial Statements
31 December 2020
Statement of Significant Accounting Policies (Continued)
For the year ended 31 December 2020
3.Significant accounting policies (Continued)
3.37
(a)
(b)
(c)
(d)
(e) IFRS 17 Insurance Contracts
- A specific adaptation for contracts with direct participation features (the variable fee approach)
- A simplified approach (the premium allocation approach) mainly for short-duration contracts
(f)
Makes amendments to the following standards:
Classification of Liabilities as Current or Non-Current (Amendments to IAS 1) Annual reporting years
beginning on or after 1 January 2023
The amendments aim to promote consistency in applying the requirements by helping companies determine whether,
in the statement of financial position, debt and other liabilities with an uncertain settlement date should be classified
as current (due or potentially due to be settled within one year) or non-current.
Onerous Contracts — Cost of Fulfilling a Contract (Amendments to IAS 37) Annual reporting years beginning
on or after 1 January 2022
The amendments specify that the ‘cost of fulfilling’ a contract comprises the ‘costs that relate directly to the contract’.
Costs that relate directly to a contract can either be incremental costs of fulfilling that contract (examples would be direct
labour, materials) or an allocation of other costs that relate directly to fulfilling contracts (an example would be the
allocation of the depreciation charge for an item of property, plant and equipment used in fulfilling the contract).
Reference to the Conceptual Framework (Amendments to IFRS 3) Annual reporting years beginning on or after
1 January 2022
Property, Plant and Equipment — Proceeds before Intended Use (Amendments to IAS 16) Annual reporting
years beginning on or after 1 January 2022
The amendments prohibit deducting from the cost of an item of property, plant and equipment any proceeds from selling
items produced while bringing that asset to the location and condition necessary for it to be capable of operating in the
manner intended by management. Instead, an entity recognises the proceeds from selling such items, and the cost of
producing those items, in profit or loss.
- IFRS 1 – The amendment permits a subsidiary that applies paragraph D16(a) of IFRS 1 to measure cumulative
translation differences using the amounts reported by its parent, based on the parent’s date of transition to IFRSs.
Annual Improvements to IFRS Standards 2018–2020 Annual reporting years beginning on or after 1 January
2022
The amendments update an outdated reference to the Conceptual Framework in IFRS 3 without significantly changing
the requirements in the standard.
- IFRS 9 – The amendment clarifies which fees an entity includes when it applies the ‘10 per cent’ test in paragraph
B3.3.6 of IFRS 9 in assessing whether to derecognise a financial liability. An entity includes only fees paid or received
between the entity (the borrower) and the lender, including fees paid or received by either the entity or the lender on the
other’s behalf.
Standards issued but not yet effective
In May 2017, the IASB issued IFRS 17 Insurance Contracts (IFRS 17), a comprehensive new accounting standard
for insurance contracts covering recognition and measurement, presentation and disclosure. Once effective, IFRS 17 will
replace IFRS 4 Insurance Contracts (IFRS 4) that was issued in 2005. IFRS 17 applies to all types of insurance contracts
(i.e., life, non-life, direct insurance and re-insurance), regardless of the type of entities that issue them, as well as to
certain guarantees and financial instruments with discretionary participation features. A few scope exceptions will apply.
The overall objective of IFRS 17 is to provide an accounting model for insurance contracts that is more useful and
consistent for insurers. In contrast to the requirements in IFRS 4, which are largely based on grandfathering previous
local accounting policies, IFRS 17 provides a comprehensive model for insurance contracts, covering all relevant
accounting aspects. The core of IFRS 17 is the general model, supplemented by:
IFRS 17 is effective for reporting years beginning on or after 1 January 2023, with comparative figures required. Early
application is permitted, provided the entity also applies IFRS 9 and IFRS 15 on or before the date it first applies IFRS
17.
Certain new accounting standards and interpretations have been published that are not mandatory for 31 December 2020
reporting periods and have not been early adopted by the group. These standards are not expected to have a material
impact on the entity in the current or future reporting periods and on foreseeable future transactions except for IFRS 17.
The likely impact of IFRS 17 insurance contracts on the group's financial statements is stated in note (e) below
39
AIICO INSURANCE PLC AND SUBSIDIARIES
Annual Report and Financial Statements
31 December 2020
Statement of Significant Accounting Policies (Continued)
For the year ended 31 December 2020
3.Significant accounting policies (Continued)
- IFRS 16 – The amendment to Illustrative Example 13 accompanying IFRS 16 removes from the example the
illustration of the reimbursement of leasehold improvements by the lessor in order to resolve any potential confusion
regarding the treatment of lease incentives that might arise because of how lease incentives are illustrated in that
example.- IAS 41 – The amendment removes the requirement in paragraph 22 of IAS 41 for entities to exclude taxation cash
flows when measuring the fair value of a biological asset using a present value technique.
- IFRS 9 – The amendment clarifies which fees an entity includes when it applies the ‘10 per cent’ test in paragraph
B3.3.6 of IFRS 9 in assessing whether to derecognise a financial liability. An entity includes only fees paid or received
between the entity (the borrower) and the lender, including fees paid or received by either the entity or the lender on the
other’s behalf.
40
AIICO INSURANCE PLC AND SUBSIDIARIES
Annual Report and Financial Statements
31 December 2020
Statement of Significant Accounting Policies (Continued)
For the year ended 31 December2020
4 Critical accounting estimates and judgements
(a) The ultimate liability arising from claims made under insurance contracts
(b) Impairment of financial instrument
(c) Measurement of fair values
The Group makes estimates and assumptions that affect the reported amounts of assets and liabilities within the next financial
year. Estimates and judgements are continually evaluated and based on historical experience and other factors, including
expectations of future events that are believed to be reasonable under the circumstances.
The estimation of the ultimate liability arising from claims made under insurance contracts is one of the Group’s most critical
accounting estimate. There are several sources of uncertainty that need to be considered in the estimate of the liability that the
Group will ultimately pay for such claims.
The ultimate cost of outstanding claims is estimated by using a standard actuarial claims projection techniques called the
Basic Chain Ladder (BCL).
The main assumption underlying these technique is that the Group’s past claims development experience can be used to
project future claims development and hence ultimate claims costs. As such, this method extrapolates the development of paid
and incurred losses, average costs per claim and claim numbers based on the observed development of earlier years and
expected loss ratios. Historical claims development is mainly analysed by accident years and the assumptions used are those
implicit in the historical claims development data on which the projections are based. Additional qualitative judgment is used
to assess the extent to which past trends may not apply in future, (for example to reflect one-off occurrences, changes in
external or market factors such as public attitudes to claiming, economic conditions, levels of claims, inflation, judicial
decisions and legislation, as well as internal factors such as portfolio mix, policy features and claims handling procedures) in
order to arrive at the estimated ultimate cost of claims that present the likely outcome from the range of possible outcomes,
taking account of all the uncertainties involved.
The Company has applied some judgment in carrying out an assessment of whether credit risk on the financial asset has
increased significantly since initial recognition and incorporating forward-looking information in the measurement of ECL.
When one is available, the Group measures the fair value of an instrument using the quoted price in an active market for that
instrument. A market is regarded as active if transactions for the asset or liability take place with sufficient frequency and
volume to provide pricing information on an ongoing basis.
If there is no quoted price in an active market, then the Group uses valuation techniques that maximise the use of relevant
observable inputs and minimise the use of unobservable inputs. The chosen valuation technique incorporates all of the factors
that market participants would take into account in pricing a transaction.
If an asset or a liability measured at fair value has a bid price and an ask price, then the Group measures assets and long
positions at a bid price and liabilities and short positions at an ask price.
The best evidence of the fair value of a financial instrument on initial recognition is normally the transaction price – i.e. the
fair value of the consideration given or received. If the Group determines that the fair value on initial recognition differs from
the transaction price and the fair value is evidenced neither by a quoted price in an active market for an identical asset or
liability nor based on a valuation technique for which any unobservable inputs are judged to be insignificant in relation to the
measurement, then the financial instrument is initially measured at fair value, adjusted to defer the difference between the fair
value on initial recognition and the transaction price. Subsequently, that difference is recognised in profit or loss on an
appropriate basis over the life of the instrument but no later than when the valuation is wholly supported by observable market
data
The judgment is required by management in the estimation of the amount and timing of future cash flows when determining
an impairment loss for debt instruments measured at amortised cost and fair value through other comprehensive income. In
estimating these cash flows, the Company makes judgments about the borrower’s financial situation and value of other
collateral (where applicable). These estimates are based on assumptions about a number of factors and actual results may
differ, resulting in future changes to the impairment allowance.
A collective assessment of impairment takes into account data from the debt portfolio (such as credit quality, levels of arrears,
credit utilisation, loan to collateral ratios etc.), and concentrations of risk and economic data (including levels of
unemployment, real estate prices indices, country risk and the performance of different individual groups).
These critical assumptions have been applied consistently to all years presented.
Fair value’ is the price that would be received to sell an asset or paid to transfer a liability in an orderly transaction between
market participants at the measurement date in the principal or, in its absence, the most advantageous market to which the
Group has access at that date. The fair value of a liability reflects its non-performance risk.
A number of the Group’s accounting policies and disclosures require the measurement of fair values, for both financial and
non-financial assets and liabilities
41
AIICO INSURANCE PLC AND SUBSIDIARIES
Annual Report and Financial Statements
31 December 2020
Statement of Significant Accounting Policies (Continued)
For the year ended 31 December2020
(d) Fair value of unquoted equity financial instruments
(e) Liabilities arising from life insurance contracts
(f) Depreciation and carrying value of property and equipment
(g) Determination of impairment of property and equipment and intangible assets
Management is required to make judgements concerning the cause, timing and amount of impairment. In the identification of
impairment indicators, management considers the impact of changes in current competitive conditions, cost of capital,
availability of funding, technological obsolescence, discontinuance of services and other circumstances that could indicate
that impairment exists. This requires management to make significant judgements and estimates concerning the existence of
impairment indicators, separate cash generating units, remaining useful lives of assets, projected cash flows and net realisable
values. Management’s judgement is also required when assessing whether a previously recognised impairment loss should be
reversed.
All models are certified before they are used, and models are calibrated to ensure that outputs reflect actual data and
comparative market prices. To the extent practical, models use only observable data; however, areas such as credit risk (both
own credit risk and counterparty risk), volatilities and correlations require management to make estimates.
The best evidence of the fair value of a financial instrument on initial recognition is normally the transaction price – i.e. the
fair value of the consideration given or received. If the Group determines that the fair value on initial recognition differs from
the transaction price and the fair value is evidenced neither by a quoted price in an active market for an identical asset or
liability nor based on a valuation technique for which any unobservable inputs are judged to be insignificant in relation to the
measurement, then the financial instrument is initially measured at fair value, adjusted to defer the difference between the fair
value on initial recognition and the transaction price. Subsequently, that difference is recognised in profit or loss on an
appropriate basis over the life of the instrument but no later than when the valuation is wholly supported by observable market
data
Investments in unquoted equity financial instrument should be measured at fair value. The Group's investment in unquoted
equity financial instrument are measured at fair value, using free cashflow approach.
- Level 1: Quoted market price in an active market for an identical instrument.
The determination of fair value for financial assets and financial liabilities for which there is no observable market price
requires the use of valuation techniques. For financial instruments that trade infrequently and have little price transparency,
fair value is less objective, and requires varying degrees of judgment depending on liquidity, concentration, uncertainty of
market factors, pricing assumptions and other risks affecting the specific instrument.
The liabilities for life insurance contracts are estimated using appropriate and acceptable base tables of standard mortality
according to the type of contract being written. Management make various assumptions such as expenses inflation, valuation
interest rate, mortality and further mortality improved in estimating the required reserves for life contracts
The Group measures fair values using the following fair value hierarchy that reflects the significance of the inputs used in
making the requirements.
- Level 2: Valuation techniques based on observable inputs. This category includes instruments valued using: quoted market
prices in active markets for similar instruments; quoted prices for similar instruments in markets that are considered less than
active; or other valuation techniques where all significant inputs are directly or indirectly observable from market data.
- Level 3: Valuation techniques using significant unobservable inputs. This category includes all instruments where the
valuation technique includes inputs not based on observable data and the unobservable inputs have a significant effect on the
instruments valuation. This category includes instruments that are valued based on quoted prices for similar instruments where
significant unobservable adjustments or assumptions are required to reflect differences between the instruments.
Fair values of financial assets and financial liabilities that are traded in active markets are based on quoted market prices or
dealer price quotations.
The fair value of financial instruments where no active market exists or where quoted prices are not otherwise available are
determined by using valuation techniques. In these cases the fair values are estimated from observable data in respect of
similar financial instruments or using models. Where market observable inputs are not available, they are estimated based on
appropriate assumptions. Where valuation techniques (for example, models) are used to determine fair values, they are
validated and periodically reviewed by qualified personnel independent of those that sourced them.
The estimation of the useful lives of assets is based on management’s judgement. Any material adjustment to the estimated
useful lives of items of property and equipment will have an impact on the carrying value of these items.
42
AIICO INSURANCE PLC AND SUBSIDIARIES
Annual Report and Financial Statements
31 December 2020
Statement of Significant Accounting Policies (Continued)
For the year ended 31 December2020
(h) Impairment of goodwill
(i) Investment properties
(j) Current income tax
(k) Deferred tax asset and liabilities
(l) Determining control over investee entities
The profit on which tax may be imposed, shall be ascertained by taking the gross premium interest and other income
receivable in Nigeria less reinsurance and deducting from the balance so arrived at, a reserve fund for unexpired risks at the
percentage consistently adopted by the company in relation to its operation as a whole for such risks at the end of the year for
which the profits are being ascertained, subject to the Iimitation below:
An insurance company, other than a life insurance company, shall be allowed as deductions from its premium the following
reserves for tax purposes‐
Goodwill is tested for impairment annually and when circumstances indicate that the carrying value may be impaired.
Impairment is determined for goodwill by assessing the recoverable amount of the cash generating unit to which the goodwill
relates. Where the recoverable amount of the cash generating unit is less than their carrying amount, an impairment is
recognized. The recoverable amount was determined based on value-in-use calculations which require the use of assumptions.
The calculations use cash flow projections based on financial budgets approved by management covering a five-year period
Deferred tax assets are recognised for all unused tax losses to the extent that it is probable that taxable profit will be available
against which the losses can be utilised. Significant management judgment is required to determine the amount of deferred tax
assets that can be recognised, based upon the likely timing and the level of future taxable profits together with future tax
planning strategies.
(a) for unexpired risks, 45 percent of the total premium in case of general insurance business other than marine insurance
business and 25 percent of the total premium in the case of marine cargo insurance;
(b) for other reserves, claims and outgoings of the company an amount equal to 25 percent of the total premium.
The Directors have adopted current tax practices in computing the tax liabilities. Actual results may differ from these
estimates based on the interpretation by the tax authorities. The Directors acknowledge that changes in the application of the
current tax practices can have a significant impact on the tax expense and tax liabilities recorded in the financial statements.
Management applies its judgement to determine whether the Group has control over subsidiaries or significant influence over
an investee company as set out in Note 3.1(b).
The Group has determined that it exercises control and significant influence over certain investee companies due to its
representation on the Board of such companies and its significant participation in the Companies' operating and financial
policies
The Group's investment properties are valued on the basis of open market value. The fair values are determined by applying
the direct market evidence comparative method of valuation to derive the open market value such as price per square meter,
rate of development in the area and quality of the building.
The current income tax charge is calculated on taxable income on the basis of the tax laws enacted or substantively enacted at
the reporting date. The Company applies Section 16 of the Company Income Tax Act. It states that an Insurance business shall
be taxed as;
• an insurance company, whether proprietary or mutual, other than a life insurance company; or
• a Nigerian company whose profit accrued in part outside Nigeria,
43
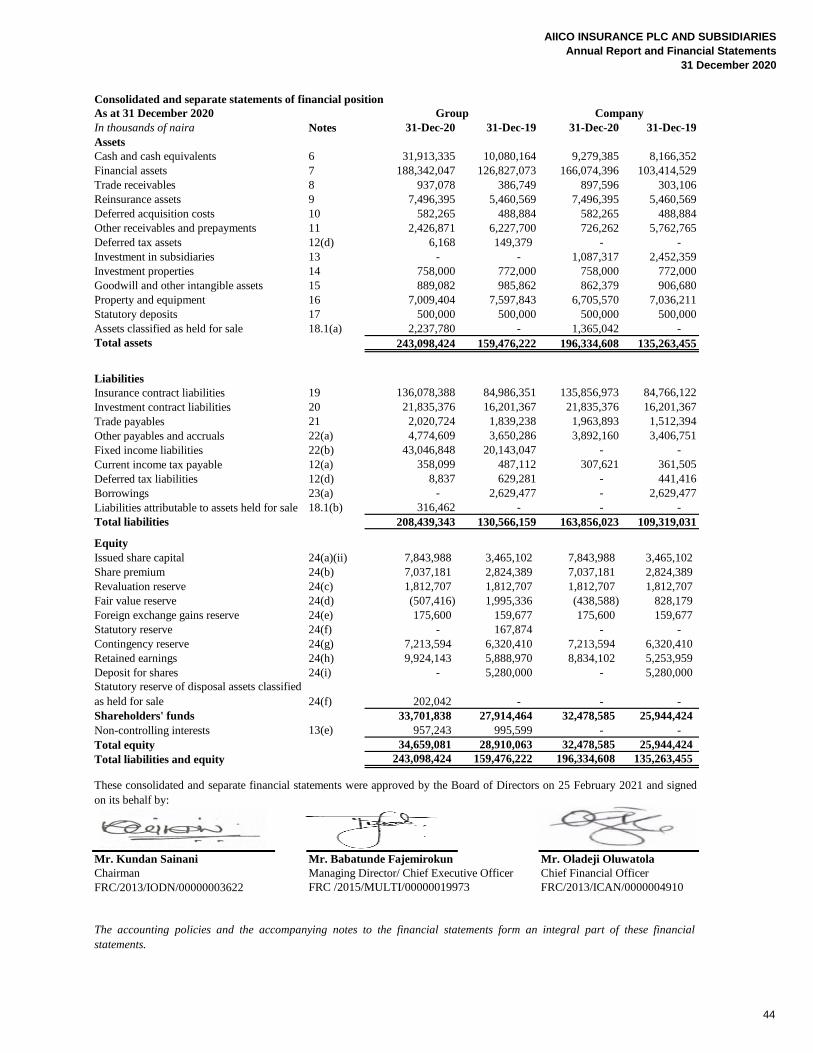
AIICO INSURANCE PLC AND SUBSIDIARIES
Annual Report and Financial Statements
31 December 2020
Consolidated and separate statements of financial position
As at 31 December 2020
In thousands of naira Notes 31-Dec-20 31-Dec-19 31-Dec-20 31-Dec-19
Assets
Cash and cash equivalents 6 31,913,335 10,080,164 9,279,385 8,166,352
Financial assets 7 188,342,047 126,827,073 166,074,396 103,414,529
Trade receivables 8 937,078 386,749 897,596 303,106
Reinsurance assets 9 7,496,395 5,460,569 7,496,395 5,460,569
Deferred acquisition costs 10 582,265 488,884 582,265 488,884
Other receivables and prepayments 11 2,426,871 6,227,700 726,262 5,762,765
Deferred tax assets 12(d) 6,168 149,379 - -
Investment in subsidiaries 13 - - 1,087,317 2,452,359
Investment properties 14 758,000 772,000 758,000 772,000
Goodwill and other intangible assets 15 889,082 985,862 862,379 906,680
Property and equipment 16 7,009,404 7,597,843 6,705,570 7,036,211
Statutory deposits 17 500,000 500,000 500,000 500,000
Assets classified as held for sale 18.1(a) 2,237,780 - 1,365,042 -
Total assets 243,098,424 159,476,222 196,334,608 135,263,455
Liabilities
Insurance contract liabilities 19 136,078,388 84,986,351 135,856,973 84,766,122
Investment contract liabilities 20 21,835,376 16,201,367 21,835,376 16,201,367
Trade payables 21 2,020,724 1,839,238 1,963,893 1,512,394
Other payables and accruals 22(a) 4,774,609 3,650,286 3,892,160 3,406,751
Fixed income liabilities 22(b) 43,046,848 20,143,047 - -
Current income tax payable 12(a) 358,099 487,112 307,621 361,505
Deferred tax liabilities 12(d) 8,837 629,281 - 441,416
Borrowings 23(a) - 2,629,477 - 2,629,477
Liabilities attributable to assets held for sale 18.1(b) 316,462 - - -
Total liabilities 208,439,343 130,566,159 163,856,023 109,319,031
Equity
Issued share capital 24(a)(ii) 7,843,988 3,465,102 7,843,988 3,465,102
Share premium 24(b) 7,037,181 2,824,389 7,037,181 2,824,389
Revaluation reserve 24(c) 1,812,707 1,812,707 1,812,707 1,812,707
Fair value reserve 24(d) (507,416) 1,995,336 (438,588) 828,179
Foreign exchange gains reserve 24(e) 175,600 159,677 175,600 159,677
Statutory reserve 24(f) - 167,874 - -
Contingency reserve 24(g) 7,213,594 6,320,410 7,213,594 6,320,410
Retained earnings 24(h) 9,924,143 5,888,970 8,834,102 5,253,959
Deposit for shares 24(i) - 5,280,000 - 5,280,000
24(f) 202,042 - - -
Shareholders' funds 33,701,838 27,914,464 32,478,585 25,944,424
Non-controlling interests 13(e) 957,243 995,599 - -
Total equity 34,659,081 28,910,063 32,478,585 25,944,424
Total liabilities and equity 243,098,424 159,476,222 196,334,608 135,263,455
Mr. Kundan Sainani Mr. Babatunde Fajemirokun Mr. Oladeji Oluwatola
Chairman Managing Director/ Chief Executive Officer Chief Financial Officer
FRC/2013/IODN/00000003622 FRC /2015/MULTI/00000019973 FRC/2013/ICAN/0000004910
The accounting policies and the accompanying notes to the financial statements form an integral part of these financial
statements.
Group Company
These consolidated and separate financial statements were approved by the Board of Directors on 25 February 2021 and signed
on its behalf by:
Statutory reserve of disposal assets classified
as held for sale
44
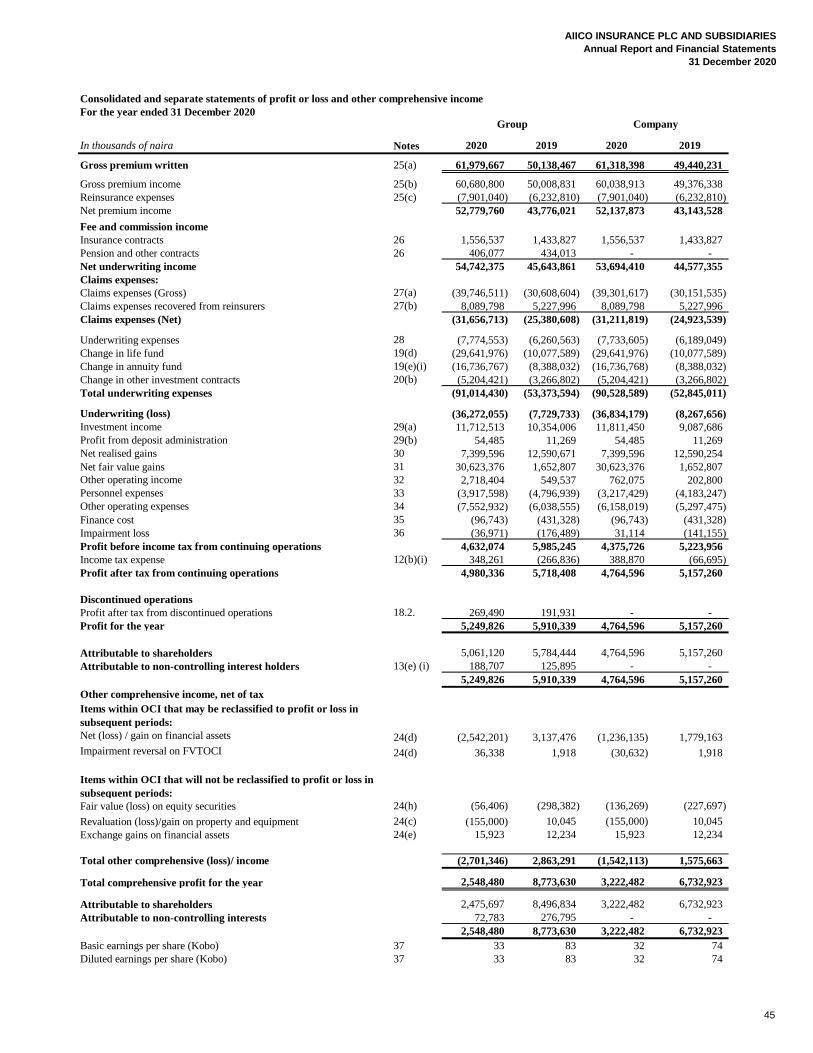
AIICO INSURANCE PLC AND SUBSIDIARIES
Annual Report and Financial Statements
31 December 2020
Consolidated and separate statements of profit or loss and other comprehensive income
For the year ended 31 December 2020
In thousands of naira Notes 2020 2019 2020 2019
Gross premium written 25(a) 61,979,667 50,138,467 61,318,398 49,440,231
Gross premium income 25(b) 60,680,800 50,008,831 60,038,913 49,376,338
Reinsurance expenses 25(c) (7,901,040) (6,232,810) (7,901,040) (6,232,810)
Net premium income 52,779,760 43,776,021 52,137,873 43,143,528
Fee and commission income
Insurance contracts 26 1,556,537 1,433,827 1,556,537 1,433,827
Pension and other contracts 26 406,077 434,013 - -
Net underwriting income 54,742,375 45,643,861 53,694,410 44,577,355
Claims expenses:
Claims expenses (Gross) 27(a) (39,746,511) (30,608,604) (39,301,617) (30,151,535)
Claims expenses recovered from reinsurers 27(b) 8,089,798 5,227,996 8,089,798 5,227,996
Claims expenses (Net) (31,656,713) (25,380,608) (31,211,819) (24,923,539)
Underwriting expenses 28 (7,774,553) (6,260,563) (7,733,605) (6,189,049)
Change in life fund 19(d) (29,641,976) (10,077,589) (29,641,976) (10,077,589)
Change in annuity fund 19(e)(i) (16,736,767) (8,388,032) (16,736,768) (8,388,032)
Change in other investment contracts 20(b) (5,204,421) (3,266,802) (5,204,421) (3,266,802)
Total underwriting expenses (91,014,430) (53,373,594) (90,528,589) (52,845,011)
Underwriting (loss) (36,272,055) (7,729,733) (36,834,179) (8,267,656)
Investment income 29(a) 11,712,513 10,354,006 11,811,450 9,087,686
Profit from deposit administration 29(b) 54,485 11,269 54,485 11,269
Net realised gains 30 7,399,596 12,590,671 7,399,596 12,590,254
31 30,623,376 1,652,807 30,623,376 1,652,807
Other operating income 32 2,718,404 549,537 762,075 202,800
Personnel expenses 33 (3,917,598) (4,796,939) (3,217,429) (4,183,247)
Other operating expenses 34 (7,552,932) (6,038,555) (6,158,019) (5,297,475)
Finance cost 35 (96,743) (431,328) (96,743) (431,328)
Impairment loss 36 (36,971) (176,489) 31,114 (141,155)
Profit before income tax from continuing operations 4,632,074 5,985,245 4,375,726 5,223,956
Income tax expense 12(b)(i) 348,261 (266,836) 388,870 (66,695)
Profit after tax from continuing operations 4,980,336 5,718,408 4,764,596 5,157,260
Discontinued operations
Profit after tax from discontinued operations 18.2. 269,490 191,931 - -
Profit for the year 5,249,826 5,910,339 4,764,596 5,157,260
Attributable to shareholders 5,061,120 5,784,444 4,764,596 5,157,260
Attributable to non-controlling interest holders 13(e) (i) 188,707 125,895 - -
5,249,826 5,910,339 4,764,596 5,157,260
Other comprehensive income, net of tax
Net (loss) / gain on financial assets 24(d) (2,542,201) 3,137,476 (1,236,135) 1,779,163
Impairment reversal on FVTOCI 24(d) 36,338 1,918 (30,632) 1,918
Fair value (loss) on equity securities 24(h) (56,406) (298,382) (136,269) (227,697)
Revaluation (loss)/gain on property and equipment 24(c) (155,000) 10,045 (155,000) 10,045
Exchange gains on financial assets 24(e) 15,923 12,234 15,923 12,234
Total other comprehensive (loss)/ income (2,701,346) 2,863,291 (1,542,113) 1,575,663
Total comprehensive profit for the year 2,548,480 8,773,630 3,222,482 6,732,923
Attributable to shareholders 2,475,697 8,496,834 3,222,482 6,732,923
Attributable to non-controlling interests 72,783 276,795 - -
2,548,480 8,773,630 3,222,482 6,732,923
Basic earnings per share (Kobo) 37 33 83 32 74
Diluted earnings per share (Kobo) 37 33 83 32 74
Group Company
Net fair value gains
Items within OCI that will not be reclassified to profit or loss in
subsequent periods:
Items within OCI that may be reclassified to profit or loss in
subsequent periods:
45
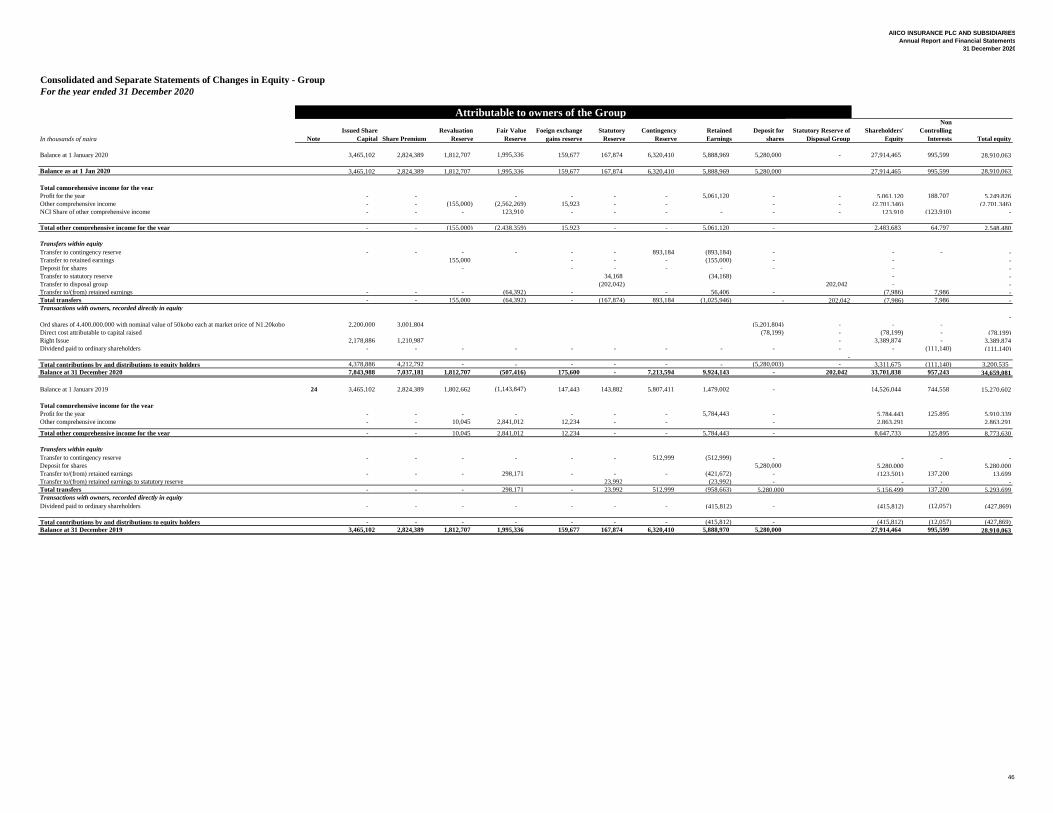
AIICO INSURANCE PLC AND SUBSIDIARIES
Annual Report and Financial Statements
31 December 2020
Consolidated and Separate Statements of Changes in Equity - Group
For the year ended 31 December 2020
In thousands of naira Note
Issued Share
Capital Share Premium
Revaluation
Reserve
Fair Value
Reserve
Foeign exchange
gains reserve
Statutory
Reserve
Contingency
Reserve
Retained
Earnings
Deposit for
shares
Statutory Reserve of
Disposal Group
Shareholders'
Equity
Non
Controlling
Interests Total equity
Balance at 1 January 2020 3,465,102 2,824,389 1,812,707 1,995,336 159,677 167,874 6,320,410 5,888,969 5,280,000 - 27,914,465 995,599 28,910,063
Balance as at 1 Jan 2020 3,465,102 2,824,389 1,812,707 1,995,336 159,677 167,874 6,320,410 5,888,969 5,280,000 27,914,465 995,599 28,910,063
Total comprehensive income for the year
Profit for the year - - - - - - 5,061,120 - - 5,061,120 188,707 5,249,826
Other comprehensive income - - (155,000) (2,562,269) 15,923 - - - - (2,701,346) (2,701,346)
NCI Share of other comprehensive income - - - 123,910 - - - - - - 123,910 (123,910) -
Total other comprehensive income for the year - - (155,000) (2,438,359) 15,923 - - 5,061,120 - 2,483,683 64,797 2,548,480
Transfers within equity
Transfer to contingency reserve - - - - - - 893,184 (893,184) - - - -
Transfer to retained earnings 155,000 - - - (155,000) - - -
Deposit for shares - - - - - - - -
Transfer to statutory reserve 34,168 (34,168) - -
Transfer to disposal group (202,042) 202,042 - -
Transfer to/(from) retained earnings - - - (64,392) - - 56,406 - (7,986) 7,986 -
Total transfers - - 155,000 (64,392) - (167,874) 893,184 (1,025,946) - 202,042 (7,986) 7,986 -
Transactions with owners, recorded directly in equity
Ord shares of 4,400,000,000 with nominal value of 50kobo each at market price of N1.20kobo 2,200,000 3,001,804 (5,201,804) - - -
-
Direct cost attributable to capital raised (78,199) - (78,199) - (78,199)
Right Issue 2,178,886 1,210,987 - 3,389,874 - 3,389,874
Dividend paid to ordinary shareholders - - - - - - - - - - - (111,140) (111,140)
-
Total contributions by and distributions to equity holders 4,378,886 4,212,792 - - - - - - (5,280,003) - 3,311,675 (111,140) 3,200,535
Balance at 31 December 2020 7,843,988 7,037,181 1,812,707 (507,416) 175,600 - 7,213,594 9,924,143 - 202,042 33,701,838 957,243 34,659,081
Balance at 1 January 2019 24 3,465,102 2,824,389 1,802,662 (1,143,847) 147,443 143,882 5,807,411 1,479,002 - 14,526,044 744,558 15,270,602
Total comprehensive income for the year
Profit for the year - - - - - - - 5,784,443 - 5,784,443 125,895 5,910,339
Other comprehensive income - - 10,045 2,841,012 12,234 - - - 2,863,291 2,863,291
Total other comprehensive income for the year - - 10,045 2,841,012 12,234 - - 5,784,443 - 8,647,733 125,895 8,773,630
Transfers within equity
Transfer to contingency reserve - - - - - - 512,999 (512,999) - - - -
Deposit for shares 5,280,000 5,280,000 5,280,000
Transfer to/(from) retained earnings - - - 298,171 - - - (421,672) - (123,501) 137,200 13,699
Transfer to/(from) retained earnings to statutory reserve 23,992 (23,992) - - - -
Total transfers - - - 298,171 - 23,992 512,999 (958,663) 5,280,000 5,156,499 137,200 5,293,699
Transactions with owners, recorded directly in equity
Dividend paid to ordinary shareholders - - - - - - - (415,812) - (415,812) (12,057) (427,869)
Total contributions by and distributions to equity holders - - - - - - - (415,812) - (415,812) (12,057) (427,869)
Balance at 31 December 2019 3,465,102 2,824,389 1,812,707 1,995,336 159,677 167,874 6,320,410 5,888,970 5,280,000 27,914,464 995,599 28,910,063
Attributable to owners of the Group
46
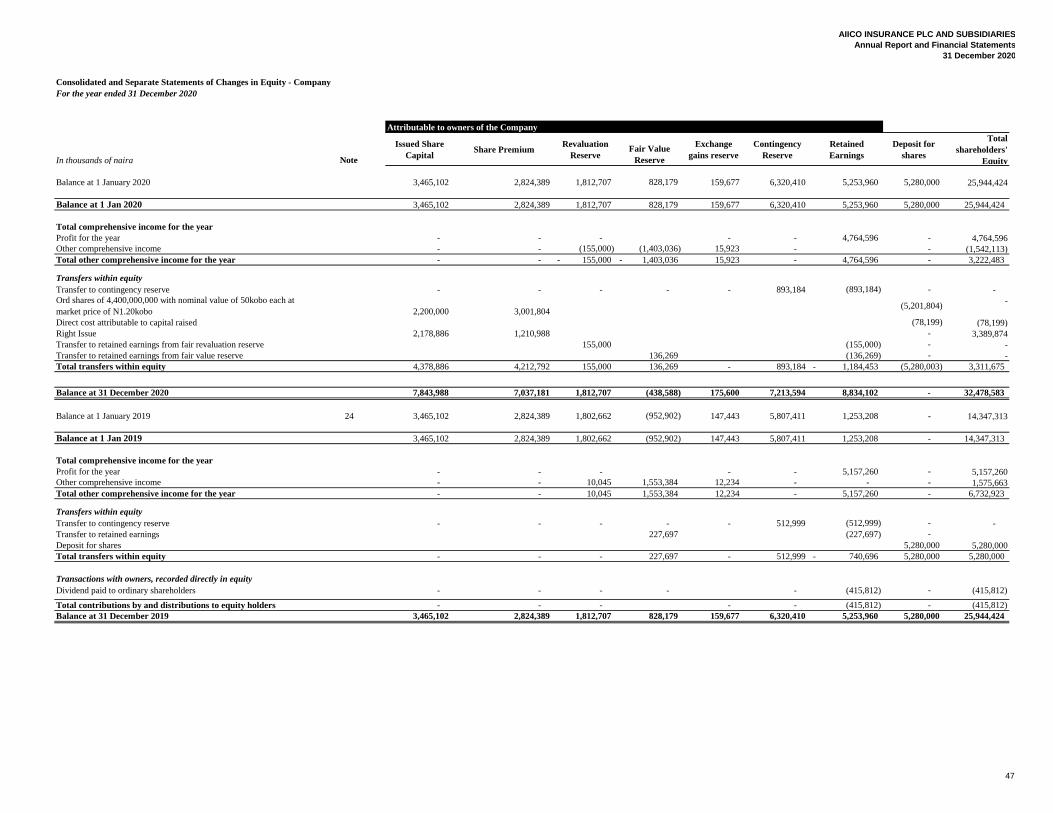
AIICO INSURANCE PLC AND SUBSIDIARIES
Annual Report and Financial Statements
31 December 2020
Consolidated and Separate Statements of Changes in Equity - Company
Attributable to owners of the Company
In thousands of naira Note
Issued Share
CapitalShare Premium
Revaluation
ReserveFair Value
Reserve
Exchange
gains reserve
Contingency
Reserve
Retained
Earnings
Deposit for
shares
Total
shareholders'
Equity
Balance at 1 January 2020 3,465,102 2,824,389 1,812,707 828,179 159,677 6,320,410 5,253,960 5,280,000 25,944,424
Balance at 1 Jan 2020 3,465,102 2,824,389 1,812,707 828,179 159,677 6,320,410 5,253,960 5,280,000 25,944,424
Total comprehensive income for the year
Profit for the year - - - - - 4,764,596 - 4,764,596
Other comprehensive income - - (155,000) (1,403,036) 15,923 - - (1,542,113)
Total other comprehensive income for the year - - 155,000- 1,403,036- 15,923 - 4,764,596 - 3,222,483
Transfers within equity
Transfer to contingency reserve - - - - - 893,184 (893,184) - -
Ord shares of 4,400,000,000 with nominal value of 50kobo each at
market price of N1.20kobo 2,200,000 3,001,804 (5,201,804)
-
Direct cost attributable to capital raised (78,199) (78,199)
Right Issue 2,178,886 1,210,988 - 3,389,874
Transfer to retained earnings from fair revaluation reserve 155,000 (155,000) - -
Transfer to retained earnings from fair value reserve 136,269 (136,269) - -
Total transfers within equity 4,378,886 4,212,792 155,000 136,269 - 893,184 1,184,453- (5,280,003) 3,311,675
Balance at 31 December 2020 7,843,988 7,037,181 1,812,707 (438,588) 175,600 7,213,594 8,834,102 - 32,478,583
Balance at 1 January 2019 24 3,465,102 2,824,389 1,802,662 (952,902) 147,443 5,807,411 1,253,208 - 14,347,313
Balance at 1 Jan 2019 3,465,102 2,824,389 1,802,662 (952,902) 147,443 5,807,411 1,253,208 - 14,347,313
Total comprehensive income for the year
Profit for the year - - - - - 5,157,260 - 5,157,260
Other comprehensive income - - 10,045 1,553,384 12,234 - - - 1,575,663
Total other comprehensive income for the year - - 10,045 1,553,384 12,234 - 5,157,260 - 6,732,923
Transfers within equity
Transfer to contingency reserve - - - - - 512,999 (512,999) - -
Transfer to retained earnings 227,697 (227,697) -
Deposit for shares 5,280,000 5,280,000
Total transfers within equity - - - 227,697 - 512,999 740,696- 5,280,000 5,280,000
Transactions with owners, recorded directly in equity
Dividend paid to ordinary shareholders - - - - - (415,812) - (415,812)
Total contributions by and distributions to equity holders - - - - - (415,812) - (415,812)
Balance at 31 December 2019 3,465,102 2,824,389 1,812,707 828,179 159,677 6,320,410 5,253,960 5,280,000 25,944,424
For the year ended 31 December 2020
47
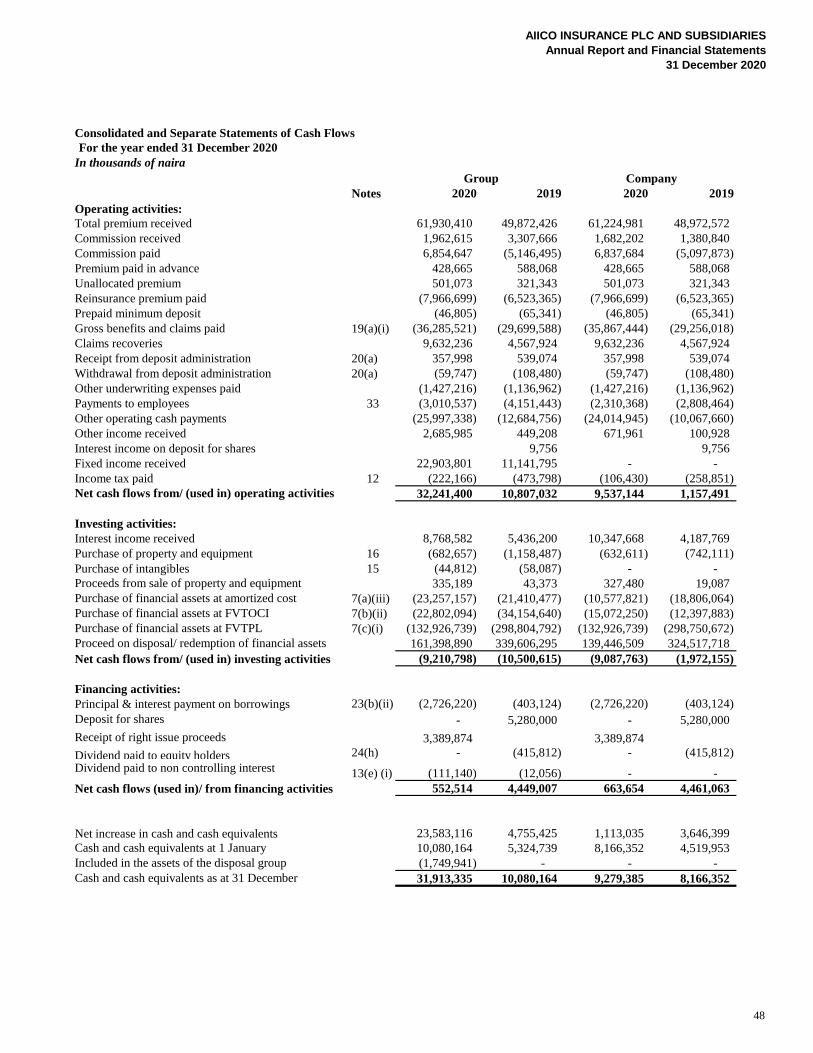
AIICO INSURANCE PLC AND SUBSIDIARIES
Annual Report and Financial Statements
31 December 2020
For the year ended 31 December 2020
In thousands of naira
Notes 2020 2019 2020 2019
Operating activities:
Total premium received 61,930,410 49,872,426 61,224,981 48,972,572
Commission received 1,962,615 3,307,666 1,682,202 1,380,840
Commission paid 6,854,647 (5,146,495) 6,837,684 (5,097,873)
Premium paid in advance 428,665 588,068 428,665 588,068
Unallocated premium 501,073 321,343 501,073 321,343
Reinsurance premium paid (7,966,699) (6,523,365) (7,966,699) (6,523,365)
Prepaid minimum deposit (46,805) (65,341) (46,805) (65,341)
Gross benefits and claims paid 19(a)(i) (36,285,521) (29,699,588) (35,867,444) (29,256,018)
Claims recoveries 9,632,236 4,567,924 9,632,236 4,567,924
Receipt from deposit administration 20(a) 357,998 539,074 357,998 539,074
Withdrawal from deposit administration 20(a) (59,747) (108,480) (59,747) (108,480)
Other underwriting expenses paid (1,427,216) (1,136,962) (1,427,216) (1,136,962)
Payments to employees 33 (3,010,537) (4,151,443) (2,310,368) (2,808,464)
Other operating cash payments (25,997,338) (12,684,756) (24,014,945) (10,067,660)
Other income received 2,685,985 449,208 671,961 100,928
Interest income on deposit for shares 9,756 9,756
Fixed income received 22,903,801 11,141,795 - -
Income tax paid 12 (222,166) (473,798) (106,430) (258,851)
32,241,400 10,807,032 9,537,144 1,157,491
Investing activities:
Interest income received 8,768,582 5,436,200 10,347,668 4,187,769
Purchase of property and equipment 16 (682,657) (1,158,487) (632,611) (742,111)
Purchase of intangibles 15 (44,812) (58,087) - -
335,189 43,373 327,480 19,087
7(a)(iii) (23,257,157) (21,410,477) (10,577,821) (18,806,064)
7(b)(ii) (22,802,094) (34,154,640) (15,072,250) (12,397,883)
7(c)(i) (132,926,739) (298,804,792) (132,926,739) (298,750,672)
161,398,890 339,606,295 139,446,509 324,517,718
Net cash flows from/ (used in) investing activities (9,210,798) (10,500,615) (9,087,763) (1,972,155)
Financing activities:
Principal & interest payment on borrowings 23(b)(ii) (2,726,220) (403,124) (2,726,220) (403,124)
Deposit for shares - 5,280,000 - 5,280,000
Receipt of right issue proceeds 3,389,874 3,389,874
Dividend paid to equity holders 24(h) - (415,812) - (415,812)
Dividend paid to non controlling interest 13(e) (i) (111,140) (12,056) - -
Net cash flows (used in)/ from financing activities 552,514 4,449,007 663,654 4,461,063
Net increase in cash and cash equivalents 23,583,116 4,755,425 1,113,035 3,646,399
10,080,164 5,324,739 8,166,352 4,519,953
(1,749,941) - - -
31,913,335 10,080,164 9,279,385 8,166,352
Purchase of financial assets at amortized cost
Consolidated and Separate Statements of Cash Flows
Group Company
Net cash flows from/ (used in) operating activities
Proceeds from sale of property and equipment
Cash and cash equivalents as at 31 December
Purchase of financial assets at FVTOCI
Purchase of financial assets at FVTPL
Proceed on disposal/ redemption of financial assets
Cash and cash equivalents at 1 January
Included in the assets of the disposal group
48
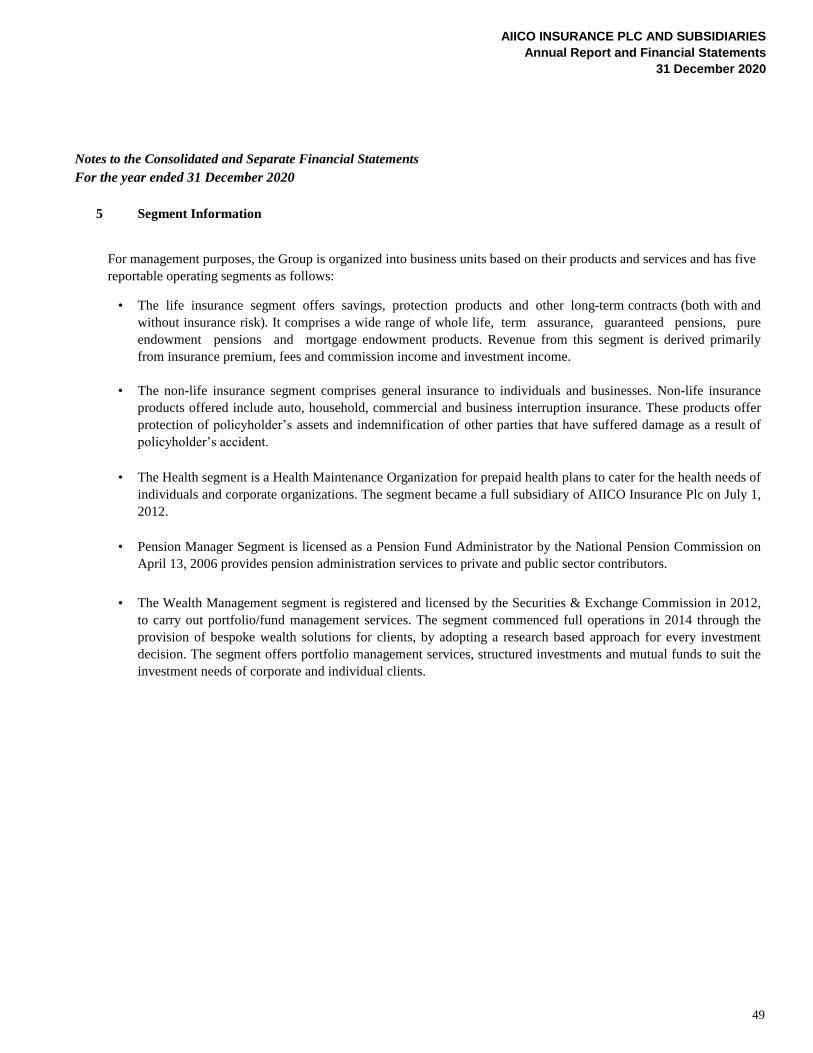
AIICO INSURANCE PLC AND SUBSIDIARIES
Annual Report and Financial Statements
31 December 2020
Notes to the Consolidated and Separate Financial Statements
For the year ended 31 December 2020
5 Segment Information
•
•
•
•
•
For management purposes, the Group is organized into business units based on their products and services and has five
reportable operating segments as follows:
The life insurance segment offers savings, protection products and other long-term contracts (both with and
without insurance risk). It comprises a wide range of whole life, term assurance, guaranteed pensions, pure
endowment pensions and mortgage endowment products. Revenue from this segment is derived primarily
from insurance premium, fees and commission income and investment income.
The non-life insurance segment comprises general insurance to individuals and businesses. Non-life insurance
products offered include auto, household, commercial and business interruption insurance. These products offer
protection of policyholder’s assets and indemnification of other parties that have suffered damage as a result of
policyholder’s accident.
The Health segment is a Health Maintenance Organization for prepaid health plans to cater for the health needs of
individuals and corporate organizations. The segment became a full subsidiary of AIICO Insurance Plc on July 1,
2012.
Pension Manager Segment is licensed as a Pension Fund Administrator by the National Pension Commission on
April 13, 2006 provides pension administration services to private and public sector contributors.
The Wealth Management segment is registered and licensed by the Securities & Exchange Commission in 2012,
to carry out portfolio/fund management services. The segment commenced full operations in 2014 through the
provision of bespoke wealth solutions for clients, by adopting a research based approach for every investment
decision. The segment offers portfolio management services, structured investments and mutual funds to suit the
investment needs of corporate and individual clients.
49
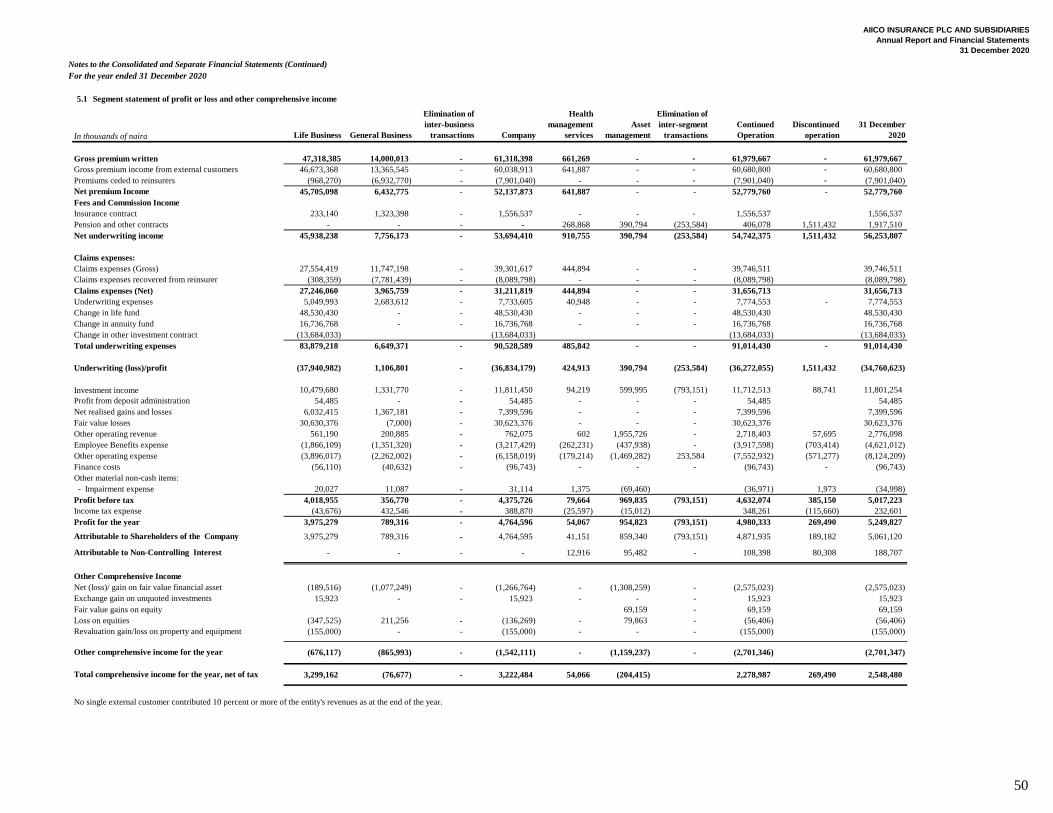
AIICO INSURANCE PLC AND SUBSIDIARIES
Annual Report and Financial Statements
31 December 2020
Notes to the Consolidated and Separate Financial Statements (Continued)
For the year ended 31 December 2020
5.1 Segment statement of profit or loss and other comprehensive income
In thousands of naira Life Business General Business
Elimination of
inter-business
transactions Company
Health
management
services
Asset
management
Elimination of
inter-segment
transactions
Continued
Operation
Discontinued
operation
31 December
2020
Gross premium written 47,318,385 14,000,013 - 61,318,398 661,269 - - 61,979,667 - 61,979,667
46,673,368 13,365,545 - 60,038,913 641,887 - - 60,680,800 - 60,680,800
Premiums ceded to reinsurers (968,270) (6,932,770) - (7,901,040) - - - (7,901,040) - (7,901,040)
45,705,098 6,432,775 - 52,137,873 641,887 - - 52,779,760 - 52,779,760
Fees and Commission Income
Insurance contract 233,140 1,323,398 - 1,556,537 - - - 1,556,537 1,556,537
Pension and other contracts - - - - 268,868 390,794 (253,584) 406,078 1,511,432 1,917,510
Net underwriting income 45,938,238 7,756,173 - 53,694,410 910,755 390,794 (253,584) 54,742,375 1,511,432 56,253,807
Claims expenses:
Claims expenses (Gross) 27,554,419 11,747,198 - 39,301,617 444,894 - - 39,746,511 39,746,511
(308,359) (7,781,439) - (8,089,798) - - - (8,089,798) (8,089,798)
Claims expenses (Net) 27,246,060 3,965,759 - 31,211,819 444,894 - - 31,656,713 31,656,713
Underwriting expenses 5,049,993 2,683,612 - 7,733,605 40,948 - - 7,774,553 - 7,774,553
Change in life fund 48,530,430 - - 48,530,430 - - - 48,530,430 48,530,430
Change in annuity fund 16,736,768 - - 16,736,768 - - - 16,736,768 16,736,768
Change in other investment contract (13,684,033) (13,684,033) (13,684,033) (13,684,033)
Total underwriting expenses 83,879,218 6,649,371 - 90,528,589 485,842 - - 91,014,430 - 91,014,430
Underwriting (loss)/profit (37,940,982) 1,106,801 - (36,834,179) 424,913 390,794 (253,584) (36,272,055) 1,511,432 (34,760,623)
Investment income 10,479,680 1,331,770 - 11,811,450 94,219 599,995 (793,151) 11,712,513 88,741 11,801,254
54,485 - - 54,485 - - - 54,485 54,485
Net realised gains and losses 6,032,415 1,367,181 - 7,399,596 - - - 7,399,596 7,399,596
Fair value losses 30,630,376 (7,000) - 30,623,376 - - - 30,623,376 30,623,376
Other operating revenue 561,190 200,885 - 762,075 602 1,955,726 - 2,718,403 57,695 2,776,098
Employee Benefits expense (1,866,109) (1,351,320) - (3,217,429) (262,231) (437,938) - (3,917,598) (703,414) (4,621,012)
Other operating expense (3,896,017) (2,262,002) - (6,158,019) (179,214) (1,469,282) 253,584 (7,552,932) (571,277) (8,124,209)
Finance costs (56,110) (40,632) - (96,743) - - - (96,743) - (96,743)
Other material non-cash items:
- Impairment expense 20,027 11,087 - 31,114 1,375 (69,460) (36,971) 1,973 (34,998)
Profit before tax 4,018,955 356,770 - 4,375,726 79,664 969,835 (793,151) 4,632,074 385,150 5,017,223
Income tax expense (43,676) 432,546 - 388,870 (25,597) (15,012) 348,261 (115,660) 232,601
Profit for the year 3,975,279 789,316 - 4,764,596 54,067 954,823 (793,151) 4,980,333 269,490 5,249,827
3,975,279 789,316 - 4,764,595 41,151 859,340 (793,151) 4,871,935 189,182 5,061,120
- - - - 12,916 95,482 - 108,398 80,308 188,707
(189,516) (1,077,249) - (1,266,764) - (1,308,259) - (2,575,023) (2,575,023)
15,923 - - 15,923 - - - 15,923 15,923
Fair value gains on equity 69,159 - 69,159 69,159
Loss on equities (347,525) 211,256 - (136,269) - 79,863 - (56,406) (56,406)
(155,000) - - (155,000) - - - (155,000) (155,000)
(676,117) (865,993) - (1,542,111) - (1,159,237) - (2,701,346) (2,701,347)
3,299,162 (76,677) - 3,222,484 54,066 (204,415) 2,278,987 269,490 2,548,480
No single external customer contributed 10 percent or more of the entity's revenues as at the end of the year.
Attributable to Non-Controlling Interest
Gross premium income from external customers
Net premium Income
Claims expenses recovered from reinsurer
Profit from deposit administration
Attributable to Shareholders of the Company
Other Comprehensive Income
Net (loss)/ gain on fair value financial asset
Exchange gain on unquoted investments
Revaluation gain/loss on property and equipment
Other comprehensive income for the year
Total comprehensive income for the year, net of tax
50
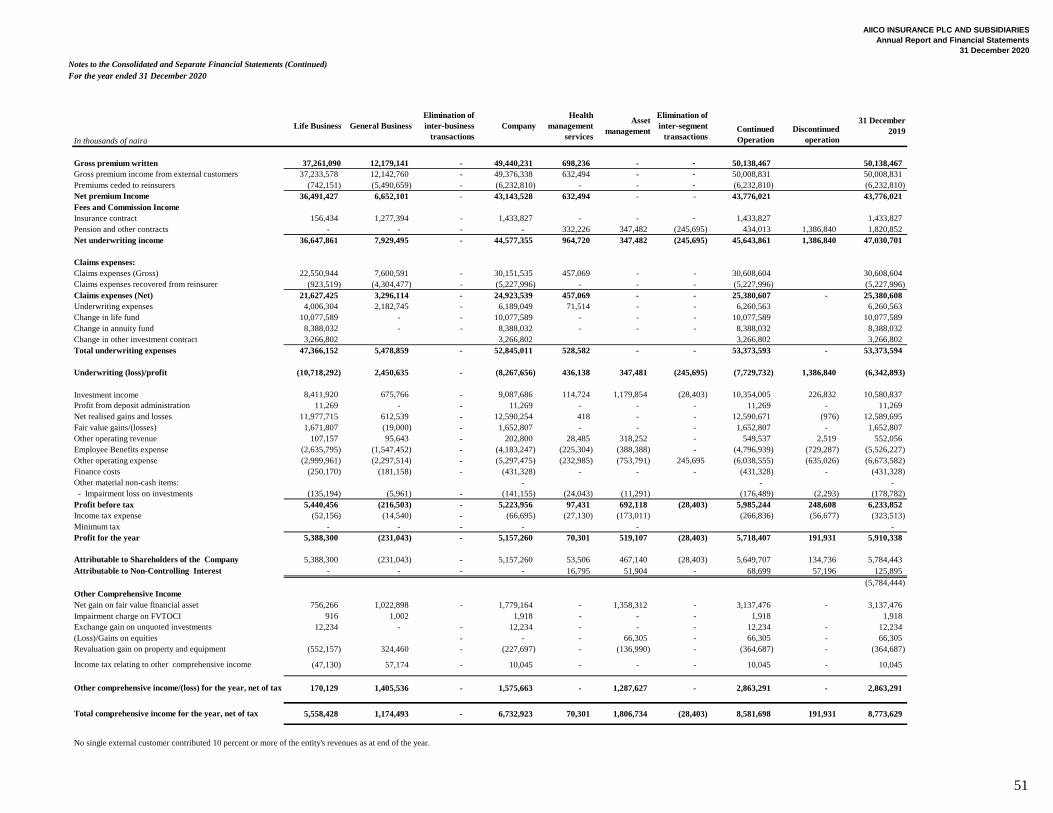
AIICO INSURANCE PLC AND SUBSIDIARIES
Annual Report and Financial Statements
31 December 2020
Notes to the Consolidated and Separate Financial Statements (Continued)
For the year ended 31 December 2020
In thousands of naira
Life Business General Business
Elimination of
inter-business
transactions
Company
Health
management
services
Asset
management
Elimination of
inter-segment
transactionsContinued
Operation
Discontinued
operation
31 December
2019
Gross premium written 37,261,090 12,179,141 - 49,440,231 698,236 - - 50,138,467 50,138,467
37,233,578 12,142,760 - 49,376,338 632,494 - - 50,008,831 50,008,831
Premiums ceded to reinsurers (742,151) (5,490,659) - (6,232,810) - - - (6,232,810) (6,232,810)
36,491,427 6,652,101 - 43,143,528 632,494 - - 43,776,021 43,776,021
Fees and Commission Income
Insurance contract 156,434 1,277,394 - 1,433,827 - - - 1,433,827 1,433,827
Pension and other contracts - - - - 332,226 347,482 (245,695) 434,013 1,386,840 1,820,852
Net underwriting income 36,647,861 7,929,495 - 44,577,355 964,720 347,482 (245,695) 45,643,861 1,386,840 47,030,701
Claims expenses:
Claims expenses (Gross) 22,550,944 7,600,591 - 30,151,535 457,069 - - 30,608,604 30,608,604
(923,519) (4,304,477) - (5,227,996) - - - (5,227,996) (5,227,996)
Claims expenses (Net) 21,627,425 3,296,114 - 24,923,539 457,069 - - 25,380,607 - 25,380,608
Underwriting expenses 4,006,304 2,182,745 - 6,189,049 71,514 - - 6,260,563 6,260,563
Change in life fund 10,077,589 - - 10,077,589 - - - 10,077,589 10,077,589
Change in annuity fund 8,388,032 - - 8,388,032 - - - 8,388,032 8,388,032
Change in other investment contract 3,266,802 3,266,802 3,266,802 3,266,802
Total underwriting expenses 47,366,152 5,478,859 - 52,845,011 528,582 - - 53,373,593 - 53,373,594
Underwriting (loss)/profit (10,718,292) 2,450,635 - (8,267,656) 436,138 347,481 (245,695) (7,729,732) 1,386,840 (6,342,893)
Investment income 8,411,920 675,766 - 9,087,686 114,724 1,179,854 (28,403) 10,354,005 226,832 10,580,837
11,269 - - 11,269 - - - 11,269 - 11,269
Net realised gains and losses 11,977,715 612,539 - 12,590,254 418 - - 12,590,671 (976) 12,589,695
Fair value gains/(losses) 1,671,807 (19,000) - 1,652,807 - - - 1,652,807 - 1,652,807
Other operating revenue 107,157 95,643 - 202,800 28,485 318,252 - 549,537 2,519 552,056
Employee Benefits expense (2,635,795) (1,547,452) - (4,183,247) (225,304) (388,388) - (4,796,939) (729,287) (5,526,227)
Other operating expense (2,999,961) (2,297,514) - (5,297,475) (232,985) (753,791) 245,695 (6,038,555) (635,026) (6,673,582)
Finance costs (250,170) (181,158) - (431,328) - - - (431,328) - (431,328)
Other material non-cash items: - - -
- Impairment loss on investments (135,194) (5,961) - (141,155) (24,043) (11,291) (176,489) (2,293) (178,782)
Profit before tax 5,440,456 (216,503) - 5,223,956 97,431 692,118 (28,403) 5,985,244 248,608 6,233,852
Income tax expense (52,156) (14,540) - (66,695) (27,130) (173,011) (266,836) (56,677) (323,513)
Minimum tax - - - - - -
Profit for the year 5,388,300 (231,043) - 5,157,260 70,301 519,107 (28,403) 5,718,407 191,931 5,910,338
5,388,300 (231,043) - 5,157,260 53,506 467,140 (28,403) 5,649,707 134,736 5,784,443
- - - - 16,795 51,904 - 68,699 57,196 125,895
(5,784,444)
756,266 1,022,898 - 1,779,164 - 1,358,312 - 3,137,476 - 3,137,476
Impairment charge on FVTOCI 916 1,002 1,918 - - - 1,918 1,918
12,234 - - 12,234 - - - 12,234 - 12,234
(Loss)/Gains on equities - - - 66,305 - 66,305 - 66,305
(552,157) 324,460 - (227,697) - (136,990) - (364,687) - (364,687)
(47,130) 57,174 - 10,045 - - - 10,045 - 10,045
170,129 1,405,536 - 1,575,663 - 1,287,627 - 2,863,291 - 2,863,291
5,558,428 1,174,493 - 6,732,923 70,301 1,806,734 (28,403) 8,581,698 191,931 8,773,629
No single external customer contributed 10 percent or more of the entity's revenues as at end of the year.
Attributable to Shareholders of the Company
Gross premium income from external customers
Net premium Income
Claims expenses recovered from reinsurer
Profit from deposit administration
Attributable to Non-Controlling Interest
Other Comprehensive Income
Net gain on fair value financial asset
Exchange gain on unquoted investments
Revaluation gain on property and equipment
Income tax relating to other comprehensive income
Other comprehensive income/(loss) for the year, net of tax
Total comprehensive income for the year, net of tax
51
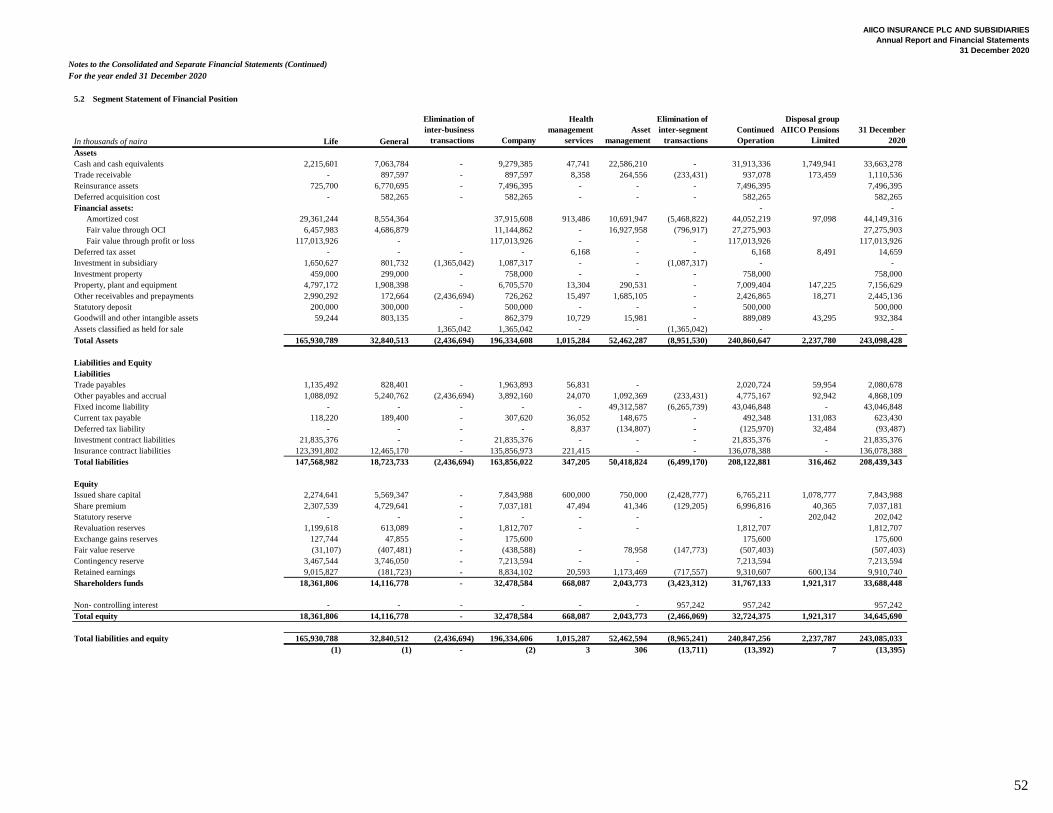
AIICO INSURANCE PLC AND SUBSIDIARIES
Annual Report and Financial Statements
31 December 2020
Notes to the Consolidated and Separate Financial Statements (Continued)
For the year ended 31 December 2020
5.2 Segment Statement of Financial Position
In thousands of naira Life General
Elimination of
inter-business
transactions Company
Health
management
services
Asset
management
Elimination of
inter-segment
transactions
Continued
Operation
Disposal group
AIICO Pensions
Limited
31 December
2020
Assets
Cash and cash equivalents 2,215,601 7,063,784 - 9,279,385 47,741 22,586,210 - 31,913,336 1,749,941 33,663,278
Trade receivable - 897,597 - 897,597 8,358 264,556 (233,431) 937,078 173,459 1,110,536
Reinsurance assets 725,700 6,770,695 - 7,496,395 - - - 7,496,395 7,496,395
Deferred acquisition cost - 582,265 - 582,265 - - - 582,265 582,265
Financial assets: - -
Amortized cost 29,361,244 8,554,364 37,915,608 913,486 10,691,947 (5,468,822) 44,052,219 97,098 44,149,316
Fair value through OCI 6,457,983 4,686,879 11,144,862 - 16,927,958 (796,917) 27,275,903 27,275,903
Fair value through profit or loss 117,013,926 - 117,013,926 - - - 117,013,926 117,013,926
Deferred tax asset - - - - 6,168 - - 6,168 8,491 14,659
Investment in subsidiary 1,650,627 801,732 (1,365,042) 1,087,317 - - (1,087,317) - -
Investment property 459,000 299,000 - 758,000 - - - 758,000 758,000
Property, plant and equipment 4,797,172 1,908,398 - 6,705,570 13,304 290,531 - 7,009,404 147,225 7,156,629
Other receivables and prepayments 2,990,292 172,664 (2,436,694) 726,262 15,497 1,685,105 - 2,426,865 18,271 2,445,136
Statutory deposit 200,000 300,000 - 500,000 - - - 500,000 500,000
59,244 803,135 - 862,379 10,729 15,981 - 889,089 43,295 932,384
Assets classified as held for sale 1,365,042 1,365,042 - - (1,365,042) - -
Total Assets 165,930,789 32,840,513 (2,436,694) 196,334,608 1,015,284 52,462,287 (8,951,530) 240,860,647 2,237,780 243,098,428
Liabilities and Equity
Liabilities
Trade payables 1,135,492 828,401 - 1,963,893 56,831 - 2,020,724 59,954 2,080,678
Other payables and accrual 1,088,092 5,240,762 (2,436,694) 3,892,160 24,070 1,092,369 (233,431) 4,775,167 92,942 4,868,109
Fixed income liability - - - - - 49,312,587 (6,265,739) 43,046,848 - 43,046,848
Current tax payable 118,220 189,400 - 307,620 36,052 148,675 - 492,348 131,083 623,430
Deferred tax liability - - - - 8,837 (134,807) - (125,970) 32,484 (93,487)
Investment contract liabilities 21,835,376 - - 21,835,376 - - - 21,835,376 - 21,835,376
Insurance contract liabilities 123,391,802 12,465,170 - 135,856,973 221,415 - - 136,078,388 - 136,078,388
Total liabilities 147,568,982 18,723,733 (2,436,694) 163,856,022 347,205 50,418,824 (6,499,170) 208,122,881 316,462 208,439,343
Equity
Issued share capital 2,274,641 5,569,347 - 7,843,988 600,000 750,000 (2,428,777) 6,765,211 1,078,777 7,843,988
Share premium 2,307,539 4,729,641 - 7,037,181 47,494 41,346 (129,205) 6,996,816 40,365 7,037,181
Statutory reserve - - - - - - - 202,042 202,042
Revaluation reserves 1,199,618 613,089 - 1,812,707 - - 1,812,707 1,812,707
Exchange gains reserves 127,744 47,855 - 175,600 175,600 175,600
Fair value reserve (31,107) (407,481) - (438,588) - 78,958 (147,773) (507,403) (507,403)
Contingency reserve 3,467,544 3,746,050 - 7,213,594 - - 7,213,594 7,213,594
Retained earnings 9,015,827 (181,723) - 8,834,102 20,593 1,173,469 (717,557) 9,310,607 600,134 9,910,740
Shareholders funds 18,361,806 14,116,778 - 32,478,584 668,087 2,043,773 (3,423,312) 31,767,133 1,921,317 33,688,448
Non- controlling interest - - - - - - 957,242 957,242 957,242
Total equity 18,361,806 14,116,778 - 32,478,584 668,087 2,043,773 (2,466,069) 32,724,375 1,921,317 34,645,690
Total liabilities and equity 165,930,788 32,840,512 (2,436,694) 196,334,606 1,015,287 52,462,594 (8,965,241) 240,847,256 2,237,787 243,085,033
(1) (1) - (2) 3 306 (13,711) (13,392) 7 (13,395)
Goodwill and other intangible assets
52
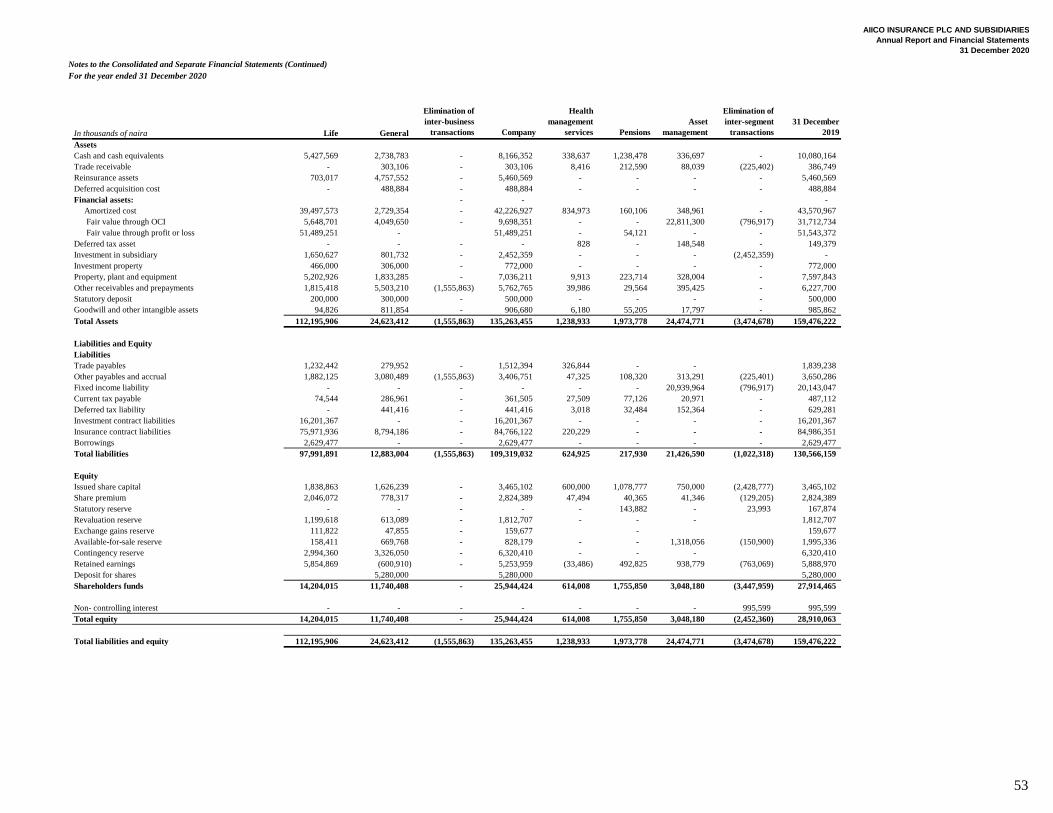
AIICO INSURANCE PLC AND SUBSIDIARIES
Annual Report and Financial Statements
31 December 2020
Notes to the Consolidated and Separate Financial Statements (Continued)
For the year ended 31 December 2020
In thousands of naira Life General
Elimination of
inter-business
transactions Company
Health
management
services Pensions
Asset
management
Elimination of
inter-segment
transactions
31 December
2019
31 December
2017
Assets
Cash and cash equivalents 5,427,569 2,738,783 - 8,166,352 338,637 1,238,478 336,697 - 10,080,164 5,199,385
Trade receivable - 303,106 - 303,106 8,416 212,590 88,039 (225,402) 386,749 301,172
Reinsurance assets 703,017 4,757,552 - 5,460,569 - - - - 5,460,569 3,644,489
Deferred acquisition cost - 488,884 - 488,884 - - - - 488,884 334,935
Financial assets: - - -
Amortized cost 39,497,573 2,729,354 - 42,226,927 834,973 160,106 348,961 - 43,570,967 71,530,090
Fair value through OCI 5,648,701 4,049,650 - 9,698,351 - - 22,811,300 (796,917) 31,712,734 2,105,523
Fair value through profit or loss 51,489,251 - 51,489,251 - 54,121 - - 51,543,372
Deferred tax asset - - - - 828 - 148,548 - 149,379 157,008
Investment in subsidiary 1,650,627 801,732 - 2,452,359 - - - (2,452,359) - -
Investment property 466,000 306,000 - 772,000 - - - - 772,000 582,000
Property, plant and equipment 5,202,926 1,833,285 - 7,036,211 9,913 223,714 328,004 - 7,597,843 6,513,175
Other receivables and prepayments 1,815,418 5,503,210 (1,555,863) 5,762,765 39,986 29,564 395,425 - 6,227,700 454,902
Statutory deposit 200,000 300,000 - 500,000 - - - - 500,000 530,000
94,826 811,854 - 906,680 6,180 55,205 17,797 - 985,862 1,060,451
Total Assets 112,195,906 24,623,412 (1,555,863) 135,263,455 1,238,933 1,973,778 24,474,771 (3,474,678) 159,476,222 92,413,127
Liabilities and Equity
Liabilities
Trade payables 1,232,442 279,952 - 1,512,394 326,844 - - 1,839,238 1,721,918
Other payables and accrual 1,882,125 3,080,489 (1,555,863) 3,406,751 47,325 108,320 313,291 (225,401) 3,650,286 1,325,766
Fixed income liability - - - - - - 20,939,964 (796,917) 20,143,047 3,981,591
Current tax payable 74,544 286,961 - 361,505 27,509 77,126 20,971 - 487,112 826,643
Deferred tax liability - 441,416 - 441,416 3,018 32,484 152,364 - 629,281 547,017
Investment contract liabilities 16,201,367 - - 16,201,367 - - - - 16,201,367 10,909,624
Insurance contract liabilities 75,971,936 8,794,186 - 84,766,122 220,229 - - - 84,986,351 59,959,751
Borrowings 2,629,477 - - 2,629,477 - - - - 2,629,477 2,182,289
Total liabilities 97,991,891 12,883,004 (1,555,863) 109,319,032 624,925 217,930 21,426,590 (1,022,318) 130,566,159 81,454,599
Equity
Issued share capital 1,838,863 1,626,239 - 3,465,102 600,000 1,078,777 750,000 (2,428,777) 3,465,102 3,465,102
Share premium 2,046,072 778,317 - 2,824,389 47,494 40,365 41,346 (129,205) 2,824,389 2,824,389
Statutory reserve - - - - - 143,882 - 23,993 167,874 116,458
Revaluation reserve 1,199,618 613,089 - 1,812,707 - - - 1,812,707 1,802,662
Exchange gains reserve 111,822 47,855 - 159,677 - 159,677 145,640
Available-for-sale reserve 158,411 669,768 - 828,179 - - 1,318,056 (150,900) 1,995,336 5,182,190
Contingency reserve 2,994,360 3,326,050 - 6,320,410 - - - 6,320,410 10,083,426
Retained earnings 5,854,869 (600,910) - 5,253,959 (33,486) 492,825 938,779 (763,069) 5,888,970 23,619,867
Deposit for shares 5,280,000 5,280,000 5,280,000
Shareholders funds 14,204,015 11,740,408 - 25,944,424 614,008 1,755,850 3,048,180 (3,447,959) 27,914,465
411,073
Non- controlling interest - - - - - - - 995,599 995,599 24,030,941
Total equity 14,204,015 11,740,408 - 25,944,424 614,008 1,755,850 3,048,180 (2,452,360) 28,910,063
105,485,540
Total liabilities and equity 112,195,906 24,623,412 (1,555,863) 135,263,455 1,238,933 1,973,778 24,474,771 (3,474,678) 159,476,222 (0)
Goodwill and other intangible assets
53
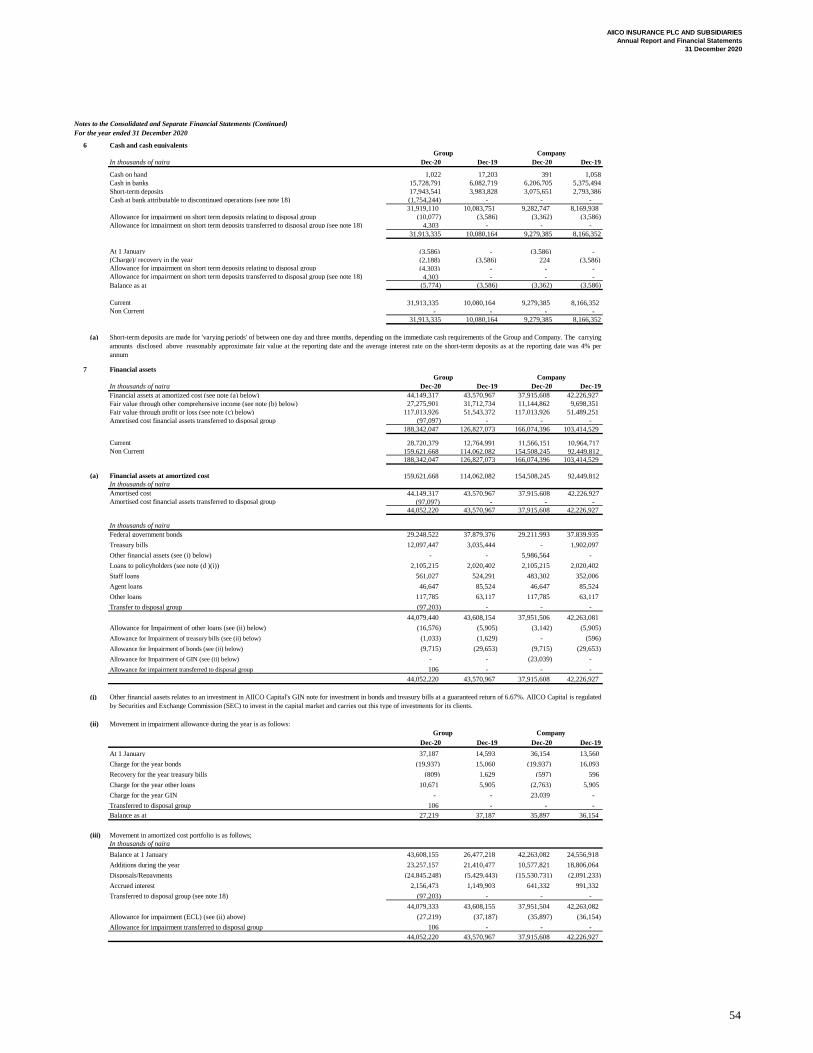
AIICO INSURANCE PLC AND SUBSIDIARIES
Annual Report and Financial Statements
31 December 2020
Notes to the Consolidated and Separate Financial Statements (Continued)
For the year ended 31 December 2020
6 Cash and cash equivalents
In thousands of naira Dec-20 Dec-19 Dec-20 Dec-19
Cash on hand 1,022 17,203 391 1,058
Cash in banks 15,728,791 6,082,719 6,206,705 5,375,494
Short-term deposits 17,943,541 3,983,828 3,075,651 2,793,386
Cash at bank attributable to discontinued operations (see note 18) (1,754,244) - - -
31,919,110 10,083,751 9,282,747 8,169,938
Allowance for impairment on short term deposits relating to disposal group (10,077) (3,586) (3,362) (3,586)
Allowance for impairment on short term deposits transferred to disposal group (see note 18) 4,303 - - -
31,913,335 10,080,164 9,279,385 8,166,352
At 1 January (3,586) - (3,586) -
(Charge)/ recovery in the year (2,188) (3,586) 224 (3,586)
Allowance for impairment on short term deposits relating to disposal group (4,303) - - -
Allowance for impairment on short term deposits transferred to disposal group (see note 18) 4,303 - - -
Balance as at (5,774) (3,586) (3,362) (3,586)
Current 31,913,335 10,080,164 9,279,385 8,166,352
Non Current - - - -
31,913,335 10,080,164 9,279,385 8,166,352
(a)
7 Financial assets
In thousands of naira Dec-20 Dec-19 Dec-20 Dec-19
Financial assets at amortized cost (see note (a) below) 44,149,317 43,570,967 37,915,608 42,226,927
Fair value through other comprehensive income (see note (b) below) 27,275,901 31,712,734 11,144,862 9,698,351
Fair value through profit or loss (see note (c) below) 117,013,926 51,543,372 117,013,926 51,489,251
Amortised cost financial assets transferred to disposal group (97,097) - - -
188,342,047 126,827,073 166,074,396 103,414,529
Current 28,720,379 12,764,991 11,566,151 10,964,717
Non Current 159,621,668 114,062,082 154,508,245 92,449,812
188,342,047 126,827,073 166,074,396 103,414,529
(a) Financial assets at amortized cost 159,621,668 114,062,082 154,508,245 92,449,812
In thousands of naira
Amortised cost 44,149,317 43,570,967 37,915,608 42,226,927
Amortised cost financial assets transferred to disposal group (97,097) - - -
44,052,220 43,570,967 37,915,608 42,226,927
In thousands of naira
Federal government bonds 29,248,522 37,879,376 29,211,993 37,839,935
Treasury bills 12,097,447 3,035,444 - 1,902,097
Other financial assets (see (i) below) - - 5,986,564 -
Loans to policyholders (see note (d )(i)) 2,105,215 2,020,402 2,105,215 2,020,402
Staff loans 561,027 524,291 483,302 352,006
Agent loans 46,647 85,524 46,647 85,524
Other loans 117,785 63,117 117,785 63,117
Transfer to disposal group (97,203) - - -
44,079,440 43,608,154 37,951,506 42,263,081
Allowance for Impairment of other loans (see (ii) below) (16,576) (5,905) (3,142) (5,905)
Allowance for Impairment of treasury bills (see (ii) below) (1,033) (1,629) - (596)
Allowance for Impairment of bonds (see (ii) below) (9,715) (29,653) (9,715) (29,653)
Allowance for Impairment of GIN (see (ii) below) - - (23,039) -
Allowance for impairment transferred to disposal group 106 - - -
44,052,220 43,570,967 37,915,608 42,226,927
(i)
(ii)
Dec-20 Dec-19 Dec-20 Dec-19
37,187 14,593 36,154 13,560
Charge for the year bonds (19,937) 15,060 (19,937) 16,093
Recovery for the year treasury bills (809) 1,629 (597) 596
Charge for the year other loans 10,671 5,905 (2,763) 5,905
Charge for the year GIN - - 23,039 -
Transferred to disposal group 106 - - -
Balance as at 27,219 37,187 35,897 36,154
(iii)
In thousands of naira
43,608,155 26,477,218 42,263,082 24,556,918
23,257,157 21,410,477 10,577,821 18,806,064
Disposals/Repayments (24,845,248) (5,429,443) (15,530,731) (2,091,233)
Accrued interest 2,156,473 1,149,903 641,332 991,332
Transferred to disposal group (see note 18) (97,203) - - -
44,079,333 43,608,155 37,951,504 42,263,082
Allowance for impairment (ECL) (see (ii) above) (27,219) (37,187) (35,897) (36,154)
Allowance for impairment transferred to disposal group 106 - - -
44,052,220 43,570,967 37,915,608 42,226,927
Movement in amortized cost portfolio is as follows;
Group Company
Group Company
At 1 January
Company
Short-term deposits are made for 'varying periods' of between one day and three months, depending on the immediate cash requirements of the Group and Company. The carrying
amounts disclosed above reasonably approximate fair value at the reporting date and the average interest rate on the short-term deposits as at the reporting date was 4% per
annum
Movement in impairment allowance during the year is as follows:
Group
Other financial aasets relates to an investment in AIICO Capital's GIN note for investment in bonds and treasury bills at a guaranteed return of 6.67%. AIICO Capital is regulated
by Securities and Exchange Commission (SEC) to invest in the capital market and carries out this type of investments for its clients.
Additions during the year
Balance at 1 January
54
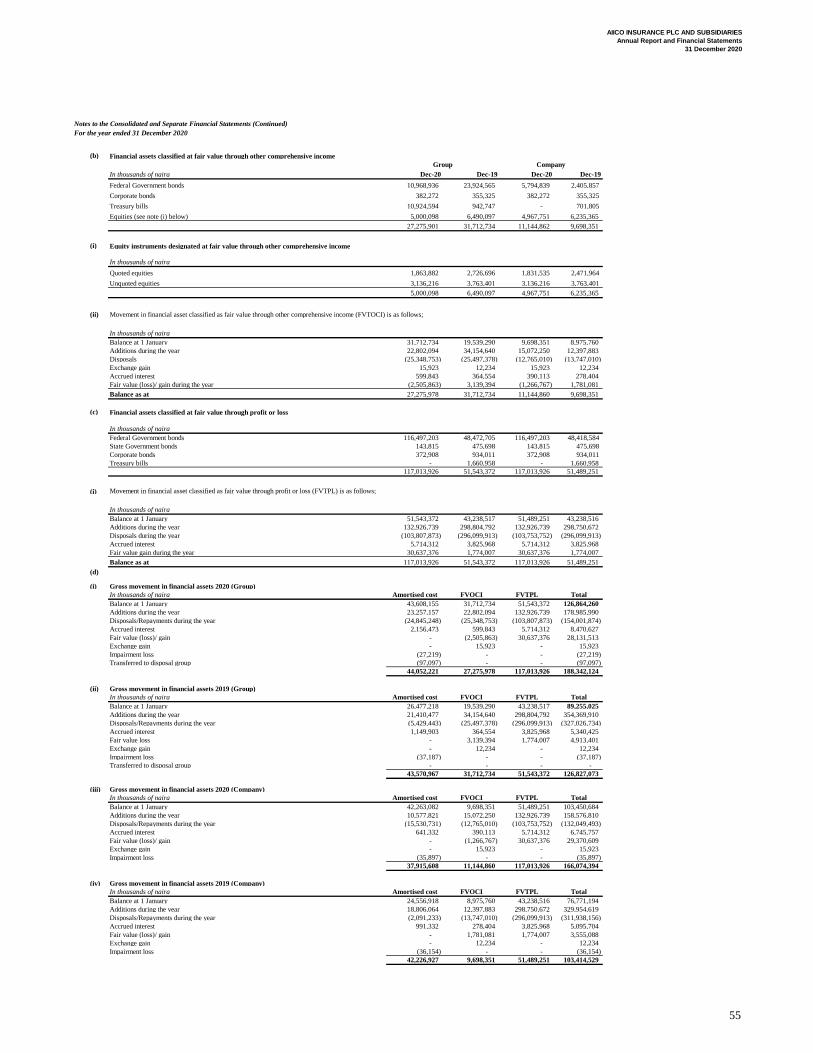
AIICO INSURANCE PLC AND SUBSIDIARIES
Annual Report and Financial Statements
31 December 2020
Notes to the Consolidated and Separate Financial Statements (Continued)
For the year ended 31 December 2020
(b)
In thousands of naira Dec-20 Dec-19 Dec-20 Dec-19
Federal Government bonds 10,968,936 23,924,565 5,794,839 2,405,857
Corporate bonds 382,272 355,325 382,272 355,325
Treasury bills 10,924,594 942,747 - 701,805
Equities (see note (i) below) 5,000,098 6,490,097 4,967,751 6,235,365
27,275,901 31,712,734 11,144,862 9,698,351
(i)
In thousands of naira
Quoted equities 1,863,882 2,726,696 1,831,535 2,471,964
Unquoted equities 3,136,216 3,763,401 3,136,216 3,763,401
5,000,098 6,490,097 4,967,751 6,235,365
(ii)
In thousands of naira
Balance at 1 January 31,712,734 19,539,290 9,698,351 8,975,760
Additions during the year 22,802,094 34,154,640 15,072,250 12,397,883
Disposals (25,348,753) (25,497,378) (12,765,010) (13,747,010)
Exchange gain 15,923 12,234 15,923 12,234
Accrued interest 599,843 364,554 390,113 278,404
Fair value (loss)/ gain during the year (2,505,863) 3,139,394 (1,266,767) 1,781,081
Balance as at 27,275,978 31,712,734 11,144,860 9,698,351
(c)
In thousands of naira
Federal Government bonds 116,497,203 48,472,705 116,497,203 48,418,584
State Government bonds 143,815 475,698 143,815 475,698
Corporate bonds 372,908 934,011 372,908 934,011
Treasury bills - 1,660,958 - 1,660,958
117,013,926 51,543,372 117,013,926 51,489,251
(i)
In thousands of naira
Balance at 1 January 51,543,372 43,238,517 51,489,251 43,238,516
Additions during the year 132,926,739 298,804,792 132,926,739 298,750,672
Disposals during the year (103,807,873) (296,099,913) (103,753,752) (296,099,913)
Accrued interest 5,714,312 3,825,968 5,714,312 3,825,968
Fair value gain during the year 30,637,376 1,774,007 30,637,376 1,774,007
Balance as at 117,013,926 51,543,372 117,013,926 51,489,251
(d)
(i) Gross movement in financial assets 2020 (Group)
In thousands of naira Amortised cost FVOCI FVTPL Total
Balance at 1 January 43,608,155 31,712,734 51,543,372 126,864,260
Additions during the year 23,257,157 22,802,094 132,926,739 178,985,990
Disposals/Repayments during the year (24,845,248) (25,348,753) (103,807,873) (154,001,874)
Accrued interest 2,156,473 599,843 5,714,312 8,470,627
Fair value (loss)/ gain - (2,505,863) 30,637,376 28,131,513
Exchange gain - 15,923 - 15,923
Impairment loss (27,219) - - (27,219)
Transferred to disposal group (97,097) - - (97,097)
44,052,221 27,275,978 117,013,926 188,342,124
(ii) Gross movement in financial assets 2019 (Group)
In thousands of naira Amortised cost FVOCI FVTPL Total
Balance at 1 January 26,477,218 19,539,290 43,238,517 89,255,025
Additions during the year 21,410,477 34,154,640 298,804,792 354,369,910
Disposals/Repayments during the year (5,429,443) (25,497,378) (296,099,913) (327,026,734)
Accrued interest 1,149,903 364,554 3,825,968 5,340,425
Fair value loss - 3,139,394 1,774,007 4,913,401
Exchange gain - 12,234 - 12,234
Impairment loss (37,187) - - (37,187)
Transferred to disposal group - - - -
43,570,967 31,712,734 51,543,372 126,827,073
(iii) Gross movement in financial assets 2020 (Company)
In thousands of naira Amortised cost FVOCI FVTPL Total
Balance at 1 January 42,263,082 9,698,351 51,489,251 103,450,684
Additions during the year 10,577,821 15,072,250 132,926,739 158,576,810
Disposals/Repayments during the year (15,530,731) (12,765,010) (103,753,752) (132,049,493)
Accrued interest 641,332 390,113 5,714,312 6,745,757
Fair value (loss)/ gain - (1,266,767) 30,637,376 29,370,609
Exchange gain - 15,923 - 15,923
Impairment loss (35,897) - - (35,897)
37,915,608 11,144,860 117,013,926 166,074,394
(iv) Gross movement in financial assets 2019 (Company)
In thousands of naira Amortised cost FVOCI FVTPL Total
Balance at 1 January 24,556,918 8,975,760 43,238,516 76,771,194
Additions during the year 18,806,064 12,397,883 298,750,672 329,954,619
Disposals/Repayments during the year (2,091,233) (13,747,010) (296,099,913) (311,938,156)
Accrued interest 991,332 278,404 3,825,968 5,095,704
Fair value (loss)/ gain - 1,781,081 1,774,007 3,555,088
Exchange gain - 12,234 - 12,234
Impairment loss (36,154) - - (36,154)
42,226,927 9,698,351 51,489,251 103,414,529
Financial assets classified at fair value through other comprehensive income
Movement in financial asset classified as fair value through other comprehensive income (FVTOCI) is as follows;
Financial assets classified at fair value through profit or loss
Equity instruments designated at fair value through other comprehensive income
Movement in financial asset classified as fair value through profit or loss (FVTPL) is as follows;
Group Company
55
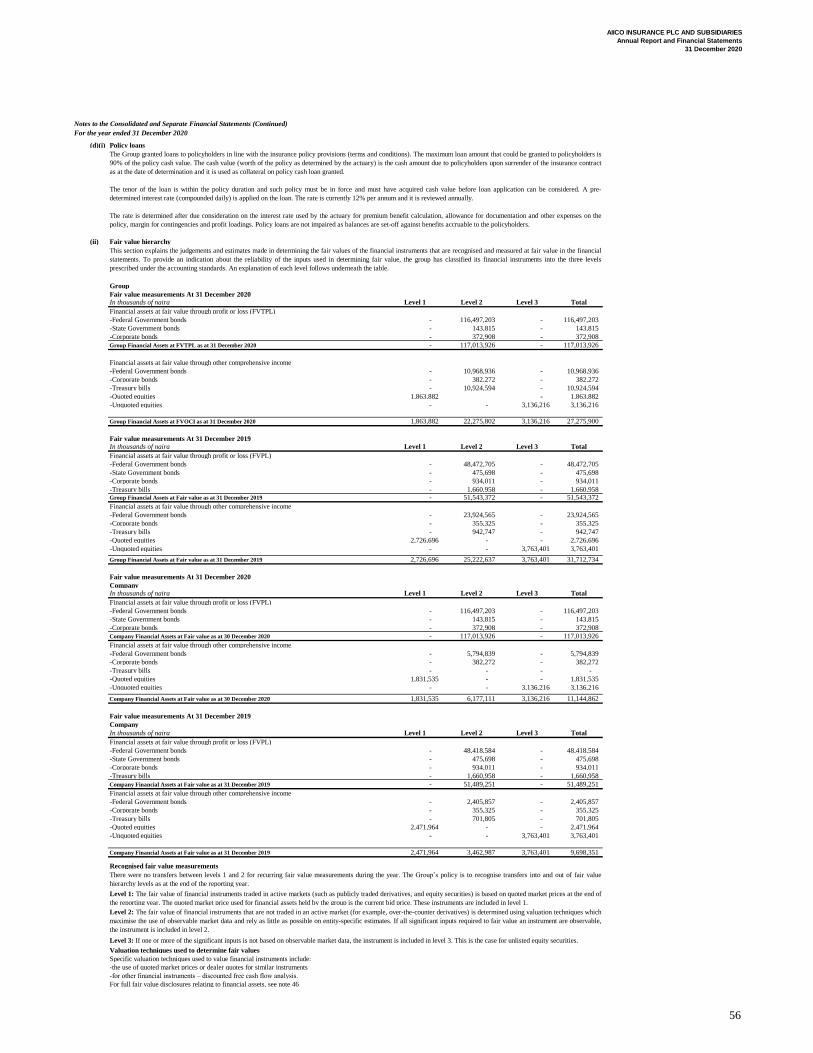
AIICO INSURANCE PLC AND SUBSIDIARIES
Annual Report and Financial Statements
31 December 2020
Notes to the Consolidated and Separate Financial Statements (Continued)
For the year ended 31 December 2020
(d)(i) Policy loans
(ii) Fair value hierarchy
Group
Fair value measurements At 31 December 2020In thousands of naira Level 1 Level 2 Level 3 Total
Financial assets at fair value through profit or loss (FVTPL)
-Federal Government bonds - 116,497,203 - 116,497,203
-State Government bonds - 143,815 - 143,815
-Corporate bonds - 372,908 - 372,908
Group Financial Assets at FVTPL as at 31 December 2020 - 117,013,926 - 117,013,926
Financial assets at fair value through other comprehensive income
-Federal Government bonds - 10,968,936 - 10,968,936
-Corporate bonds - 382,272 - 382,272
-Treasury bills - 10,924,594 - 10,924,594
-Quoted equities 1,863,882 - 1,863,882
-Unquoted equities - - 3,136,216 3,136,216
Group Financial Assets at FVOCI as at 31 December 2020 1,863,882 22,275,802 3,136,216 27,275,900
Fair value measurements At 31 December 2019In thousands of naira Level 1 Level 2 Level 3 Total
Financial assets at fair value through profit or loss (FVPL)
-Federal Government bonds - 48,472,705 - 48,472,705
-State Government bonds - 475,698 - 475,698
-Corporate bonds - 934,011 - 934,011
-Treasury bills - 1,660,958 - 1,660,958 Group Financial Assets at Fair value as at 31 December 2019 - 51,543,372 - 51,543,372
Financial assets at fair value through other comprehensive income
-Federal Government bonds - 23,924,565 - 23,924,565
-Corporate bonds - 355,325 - 355,325
-Treasury bills - 942,747 - 942,747
-Quoted equities 2,726,696 - - 2,726,696
-Unquoted equities - - 3,763,401 3,763,401
Group Financial Assets at Fair value as at 31 December 2019 2,726,696 25,222,637 3,763,401 31,712,734
Fair value measurements At 31 December 2020
CompanyIn thousands of naira Level 1 Level 2 Level 3 Total
Financial assets at fair value through profit or loss (FVPL)
-Federal Government bonds - 116,497,203 - 116,497,203
-State Government bonds - 143,815 - 143,815
-Corporate bonds - 372,908 - 372,908
Company Financial Assets at Fair value as at 30 December 2020 - 117,013,926 - 117,013,926
Financial assets at fair value through other comprehensive income
-Federal Government bonds - 5,794,839 - 5,794,839
-Corporate bonds - 382,272 - 382,272
-Treasury bills - - - -
-Quoted equities 1,831,535 - - 1,831,535
-Unquoted equities - - 3,136,216 3,136,216
Company Financial Assets at Fair value as at 30 December 2020 1,831,535 6,177,111 3,136,216 11,144,862
Fair value measurements At 31 December 2019
Company
In thousands of naira Level 1 Level 2 Level 3 Total
Financial assets at fair value through profit or loss (FVPL)
-Federal Government bonds - 48,418,584 - 48,418,584
-State Government bonds - 475,698 - 475,698
-Corporate bonds - 934,011 - 934,011
-Treasury bills - 1,660,958 - 1,660,958
Company Financial Assets at Fair value as at 31 December 2019 - 51,489,251 - 51,489,251
Financial assets at fair value through other comprehensive income
-Federal Government bonds - 2,405,857 - 2,405,857
-Corporate bonds - 355,325 - 355,325
-Treasury bills - 701,805 - 701,805
-Quoted equities 2,471,964 - - 2,471,964
-Unquoted equities - - 3,763,401 3,763,401
Company Financial Assets at Fair value as at 31 December 2019 2,471,964 3,462,987 3,763,401 9,698,351
Recognised fair value measurements
Valuation techniques used to determine fair values
Specific valuation techniques used to value financial instruments include:
-the use of quoted market prices or dealer quotes for similar instruments
-for other financial instruments – discounted free cash flow analysis.
For full fair value disclosures relating to financial assets, see note 46
The Group granted loans to policyholders in line with the insurance policy provisions (terms and conditions). The maximum loan amount that could be granted to policyholders is
90% of the policy cash value. The cash value (worth of the policy as determined by the actuary) is the cash amount due to policyholders upon surrender of the insurance contract
as at the date of determination and it is used as collateral on policy cash loan granted.
The tenor of the loan is within the policy duration and such policy must be in force and must have acquired cash value before loan application can be considered. A pre-
determined interest rate (compounded daily) is applied on the loan. The rate is currently 12% per annum and it is reviewed annually.
The rate is determined after due consideration on the interest rate used by the actuary for premium benefit calculation, allowance for documentation and other expenses on the
policy, margin for contingencies and profit loadings. Policy loans are not impaired as balances are set-off against benefits accruable to the policyholders.
Level 1: The fair value of financial instruments traded in active markets (such as publicly traded derivatives, and equity securities) is based on quoted market prices at the end of
the reporting year. The quoted market price used for financial assets held by the group is the current bid price. These instruments are included in level 1.
Level 3: If one or more of the significant inputs is not based on observable market data, the instrument is included in level 3. This is the case for unlisted equity securities.
There were no transfers between levels 1 and 2 for recurring fair value measurements during the year. The Group’s policy is to recognise transfers into and out of fair value
hierarchy levels as at the end of the reporting year.
Level 2: The fair value of financial instruments that are not traded in an active market (for example, over-the-counter derivatives) is determined using valuation techniques which
maximise the use of observable market data and rely as little as possible on entity-specific estimates. If all significant inputs required to fair value an instrument are observable,
the instrument is included in level 2.
This section explains the judgements and estimates made in determining the fair values of the financial instruments that are recognised and measured at fair value in the financial
statements. To provide an indication about the reliability of the inputs used in determining fair value, the group has classified its financial instruments into the three levels
prescribed under the accounting standards. An explanation of each level follows underneath the table.
56
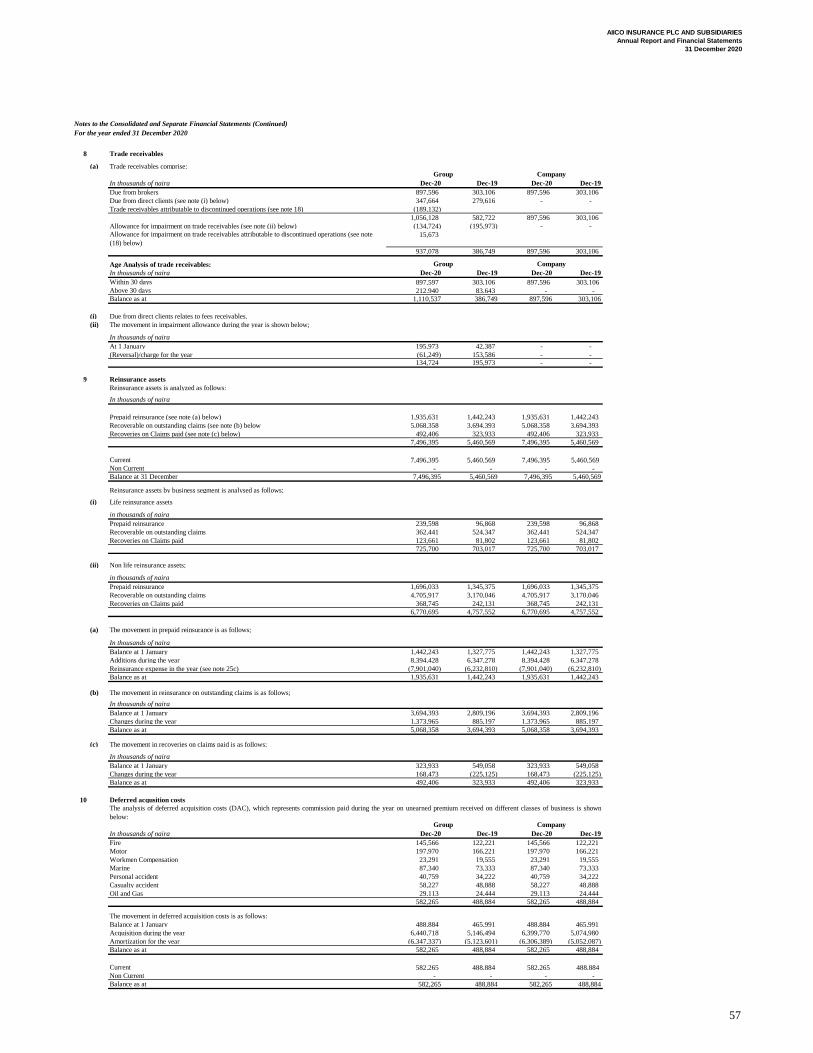
AIICO INSURANCE PLC AND SUBSIDIARIES
Annual Report and Financial Statements
31 December 2020
Notes to the Consolidated and Separate Financial Statements (Continued)
For the year ended 31 December 2020
8 Trade receivables
(a) Trade receivables comprise:
In thousands of naira Dec-20 Dec-19 Dec-20 Dec-19
Due from brokers 897,596 303,106 897,596 303,106
Due from direct clients (see note (i) below) 347,664 279,616 - -
Trade receivables attributable to discontinued operations (see note 18) (189,132)
1,056,128 582,722 897,596 303,106
Allowance for impairment on trade receivables (see note (ii) below) (134,724) (195,973) - -
15,673
937,078 386,749 897,596 303,106
Age Analysis of trade receivables:
In thousands of naira Dec-20 Dec-19 Dec-20 Dec-19
Within 30 days 897,597 303,106 897,596 303,106
Above 30 days 212,940 83,643 - -
Balance as at 1,110,537 386,749 897,596 303,106
(i) Due from direct clients relates to fees receivables.
(ii) The movement in impairment allowance during the year is shown below;
In thousands of naira
At 1 January 195,973 42,387 - -
(Reversal)/charge for the year (61,249) 153,586 - - 134,724 195,973 - -
9 Reinsurance assets
Reinsurance assets is analyzed as follows:
In thousands of naira
Prepaid reinsurance (see note (a) below) 1,935,631 1,442,243 1,935,631 1,442,243
5,068,358 3,694,393 5,068,358 3,694,393
Recoveries on Claims paid (see note (c) below) 492,406 323,933 492,406 323,933
7,496,395 5,460,569 7,496,395 5,460,569
Current 7,496,395 5,460,569 7,496,395 5,460,569
Non Current - - - -
Balance at 31 December 7,496,395 5,460,569 7,496,395 5,460,569
Reinsurance assets by business segment is analysed as follows;
(i) Life reinsurance assets
in thousands of naira
Prepaid reinsurance 239,598 96,868 239,598 96,868
362,441 524,347 362,441 524,347
Recoveries on Claims paid 123,661 81,802 123,661 81,802
725,700 703,017 725,700 703,017
(ii) Non life reinsurance assets;
in thousands of naira
Prepaid reinsurance 1,696,033 1,345,375 1,696,033 1,345,375
4,705,917 3,170,046 4,705,917 3,170,046
Recoveries on Claims paid 368,745 242,131 368,745 242,131
6,770,695 4,757,552 6,770,695 4,757,552
(a) The movement in prepaid reinsurance is as follows;
In thousands of naira
Balance at 1 January 1,442,243 1,327,775 1,442,243 1,327,775
Additions during the year 8,394,428 6,347,278 8,394,428 6,347,278
Reinsurance expense in the year (see note 25c) (7,901,040) (6,232,810) (7,901,040) (6,232,810)
Balance as at 1,935,631 1,442,243 1,935,631 1,442,243
(b) The movement in reinsurance on outstanding claims is as follows;
In thousands of naira
Balance at 1 January 3,694,393 2,809,196 3,694,393 2,809,196
Changes during the year 1,373,965 885,197 1,373,965 885,197
Balance as at 5,068,358 3,694,393 5,068,358 3,694,393
(c) The movement in recoveries on claims paid is as follows;
In thousands of naira
Balance at 1 January 323,933 549,058 323,933 549,058
Changes during the year 168,473 (225,125) 168,473 (225,125)
Balance as at 492,406 323,933 492,406 323,933
10 Deferred acqusition costs
In thousands of naira Dec-20 Dec-19 Dec-20 Dec-19
Fire 145,566 122,221 145,566 122,221
Motor 197,970 166,221 197,970 166,221
Workmen Compensation 23,291 19,555 23,291 19,555
Marine 87,340 73,333 87,340 73,333
Personal accident 40,759 34,222 40,759 34,222
Casualty accident 58,227 48,888 58,227 48,888
Oil and Gas 29,113 24,444 29,113 24,444
582,265 488,884 582,265 488,884
The movement in deferred acquisition costs is as follows:
Balance at 1 January 488,884 465,991 488,884 465,991
Acquisition during the year 6,440,718 5,146,494 6,399,770 5,074,980
Amortization for the year (6,347,337) (5,123,601) (6,306,389) (5,052,087)
Balance as at 582,265 488,884 582,265 488,884
Current 582,265 488,884 582,265 488,884
Non Current - - - -
Balance as at 582,265 488,884 582,265 488,884
Group Company
Recoverable on outstanding claims
Recoverable on outstanding claims
Group Company
Recoverable on outstanding claims (see note (b) below
Group Company
The analysis of deferred acquisition costs (DAC), which represents commission paid during the year on unearned premium received on different classes of business is shown
below:
Allowance for impairment on trade receivables attributable to discontinued operations (see note
(18) below)
57
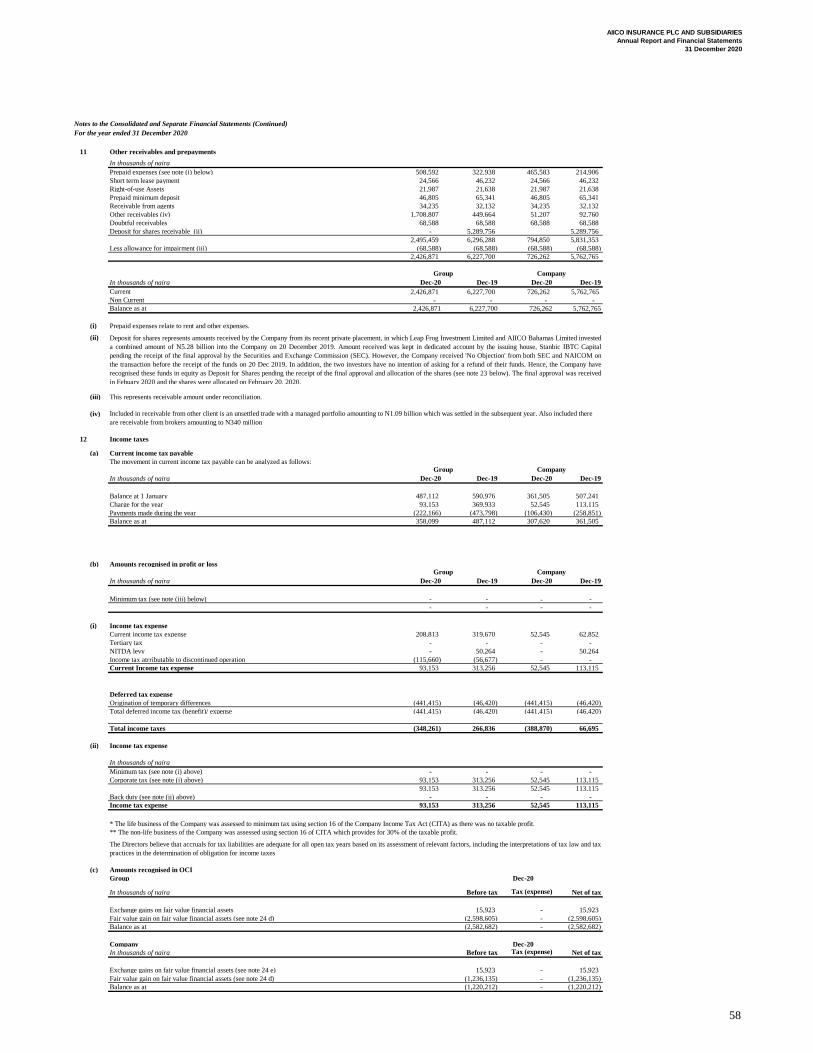
AIICO INSURANCE PLC AND SUBSIDIARIES
Annual Report and Financial Statements
31 December 2020
Notes to the Consolidated and Separate Financial Statements (Continued)
For the year ended 31 December 2020
11 Other receivables and prepayments
In thousands of naira
Prepaid expenses (see note (i) below) 508,592 322,938 465,583 214,906
Short term lease payment 24,566 46,232 24,566 46,232
Right-of-use Assets 21,987 21,638 21,987 21,638
Prepaid minimum deposit 46,805 65,341 46,805 65,341
Receivable from agents 34,235 32,132 34,235 32,132
Other receivables (iv) 1,708,807 449,664 51,207 92,760
Doubtful receivables 68,588 68,588 68,588 68,588
Deposit for shares receivable (ii) - 5,289,756 5,289,756
2,495,459 6,296,288 794,850 5,831,353
Less allowance for impairment (iii) (68,588) (68,588) (68,588) (68,588)
2,426,871 6,227,700 726,262 5,762,765
In thousands of naira Dec-20 Dec-19 Dec-20 Dec-19
Current 2,426,871 6,227,700 726,262 5,762,765
Non Current - - - -
Balance as at 2,426,871 6,227,700 726,262 5,762,765
(i)
(ii)
(iii) This represents receivable amount under reconciliation.
(iv)
12 Income taxes
(a) Current income tax payable
The movement in current income tax payable can be analyzed as follows:
In thousands of naira Dec-20 Dec-19 Dec-20 Dec-19
Balance at 1 January 487,112 590,976 361,505 507,241
Charge for the year 93,153 369,933 52,545 113,115
Payments made during the year (222,166) (473,798) (106,430) (258,851)
Balance as at 358,099 487,112 307,620 361,505
(b) Amounts recognised in profit or loss
In thousands of naira Dec-20 Dec-19 Dec-20 Dec-19
Minimum tax (see note (iii) below) - - - -
- - - -
(i) Income tax expense
Current income tax expense 208,813 319,670 52,545 62,852
Tertiary tax - - - -
NITDA levy - 50,264 - 50,264
Income tax atrributable to discontinued operation (115,660) (56,677) - -
Current Income tax expense 93,153 313,256 52,545 113,115
Deferred tax expense
Origination of temporary differences (441,415) (46,420) (441,415) (46,420)
Total deferred income tax (benefit)/ expense (441,415) (46,420) (441,415) (46,420)
Total income taxes (348,261) 266,836 (388,870) 66,695
(ii) Income tax expense
In thousands of naira
Minimum tax (see note (i) above) - - - -
Corporate tax (see note (i) above) 93,153 313,256 52,545 113,115
93,153 313,256 52,545 113,115
Back duty (see note (ii) above) - - - -
Income tax expense 93,153 313,256 52,545 113,115
(c) Amounts recognised in OCI
Group
In thousands of naira Before tax Tax (expense) Net of tax
Exchange gains on fair value financial assets 15,923 - 15,923
Fair value gain on fair value financial assets (see note 24 d) (2,598,605) - (2,598,605)
Balance as at (2,582,682) - (2,582,682)
Company
In thousands of naira Before tax Tax (expense) Net of tax
Exchange gains on fair value financial assets (see note 24 e) 15,923 - 15,923
Fair value gain on fair value financial assets (see note 24 d) (1,236,135) - (1,236,135)
Balance as at (1,220,212) - (1,220,212)
* The life business of the Company was assessed to minimum tax using section 16 of the Company Income Tax Act (CITA) as there was no taxable profit.
Dec-20
Dec-20
The Directors believe that accruals for tax liabilities are adequate for all open tax years based on its assessment of relevant factors, including the interpretations of tax law and tax
practices in the determination of obligation for income taxes
Prepaid expenses relate to rent and other expenses.
Included in receivable from other client is an unsettled trade with a managed portfolio amounting to N1.09 billion which was settled in the subsequent year. Also included there
are receivable from brokers amounting to N340 million
Group Company
Deposit for shares represents amounts received by the Company from its recent private placement, in which Leap Frog Investment Limited and AIICO Bahamas Limited invested
a combined amount of N5.28 billion into the Company on 20 December 2019. Amount received was kept in dedicated account by the issuing house, Stanbic IBTC Capital
pending the receipt of the final approval by the Securities and Exchange Commission (SEC). However, the Company received 'No Objection' from both SEC and NAICOM on
the transaction before the receipt of the funds on 20 Dec 2019. In addition, the two investors have no intention of asking for a refund of their funds. Hence, the Company have
recognised these funds in equity as Deposit for Shares pending the receipt of the final approval and allocation of the shares (see note 23 below). The final approval was received
in Febuary 2020 and the shares were allocated on February 20, 2020.
** The non-life business of the Company was assessed using section 16 of CITA which provides for 30% of the taxable profit.
Company
Group Company
Group
58
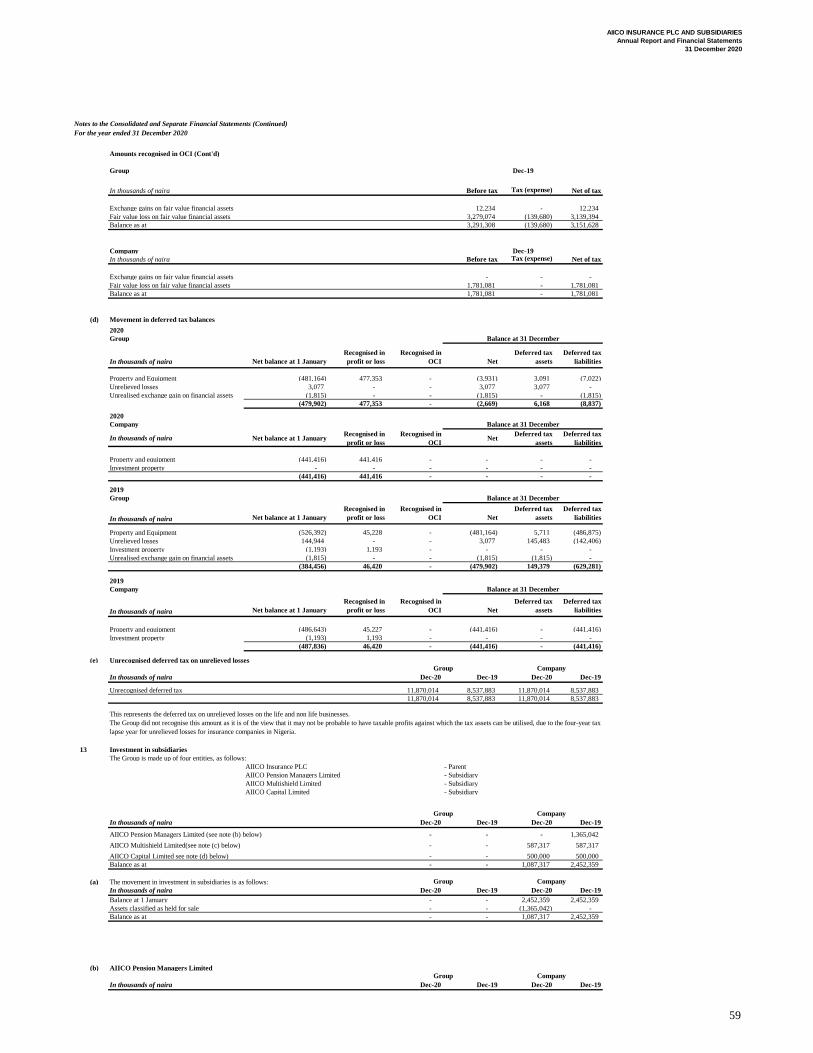
AIICO INSURANCE PLC AND SUBSIDIARIES
Annual Report and Financial Statements
31 December 2020
Notes to the Consolidated and Separate Financial Statements (Continued)
For the year ended 31 December 2020
Amounts recognised in OCI (Cont'd)
Group
In thousands of naira Before tax Tax (expense) Net of tax
Exchange gains on fair value financial assets 12,234 - 12,234
Fair value loss on fair value financial assets 3,279,074 (139,680) 3,139,394
Balance as at 3,291,308 (139,680) 3,151,628
Company
In thousands of naira Before tax Tax (expense) Net of tax
Exchange gains on fair value financial assets - - -
Fair value loss on fair value financial assets 1,781,081 - 1,781,081
Balance as at 1,781,081 - 1,781,081
(d) Movement in deferred tax balances
2020
Group
In thousands of naira Net balance at 1 January
Recognised in
profit or loss
Recognised in
OCI Net
Deferred tax
assets
Deferred tax
liabilities
Property and Equipment (481,164) 477,353 - (3,931) 3,091 (7,022)
Unrelieved losses 3,077 - - 3,077 3,077 -
Unrealised exchange gain on financial assets (1,815) - - (1,815) - (1,815)
(479,902) 477,353 - (2,669) 6,168 (8,837)
2020
Company
In thousands of naira Net balance at 1 JanuaryRecognised in
profit or loss
Recognised in
OCINet
Deferred tax
assets
Deferred tax
liabilities
Property and equipment (441,416) 441,416 - - - -
Investment property - - - - - -
(441,416) 441,416 - - - -
2019
Group
In thousands of naira Net balance at 1 January
Recognised in
profit or loss
Recognised in
OCI Net
Deferred tax
assets
Deferred tax
liabilities
Property and Equipment (526,392) 45,228 - (481,164) 5,711 (486,875)
Unrelieved losses 144,944 - - 3,077 145,483 (142,406)
Investment property (1,193) 1,193 - - - -
Unrealised exchange gain on financial assets (1,815) - - (1,815) (1,815) -
(384,456) 46,420 - (479,902) 149,379 (629,281)
2019
Company
In thousands of naira Net balance at 1 January
Recognised in
profit or loss
Recognised in
OCI Net
Deferred tax
assets
Deferred tax
liabilities
Property and equipment (486,643) 45,227 - (441,416) - (441,416)
Investment property (1,193) 1,193 - - - -
(487,836) 46,420 - (441,416) - (441,416)
(e) Unrecognised deferred tax on unrelieved losses
In thousands of naira Dec-20 Dec-19 Dec-20 Dec-19
Unrecognised deferred tax 11,870,014 8,537,883 11,870,014 8,537,883
11,870,014 8,537,883 11,870,014 8,537,883
This represents the deferred tax on unrelieved losses on the life and non life businesses.
13 Investment in subsidiaries
The Group is made up of four entities, as follows:
AIICO Insurance PLC - Parent
AIICO Pension Managers Limited - Subsidiary
AIICO Multishield Limited - Subsidiary
AIICO Capital Limited - Subsidiary
In thousands of naira Dec-20 Dec-19 Dec-20 Dec-19
AIICO Pension Managers Limited (see note (b) below) - - - 1,365,042
AIICO Multishield Limited(see note (c) below) - - 587,317 587,317
AIICO Capital Limited see note (d) below) - - 500,000 500,000
Balance as at - - 1,087,317 2,452,359
(a) The movement in investment in subsidiaries is as follows:
In thousands of naira Dec-20 Dec-19 Dec-20 Dec-19
Balance at 1 January - - 2,452,359 2,452,359
Assets classified as held for sale - - (1,365,042) -
Balance as at - - 1,087,317 2,452,359
(b) AIICO Pension Managers Limited
In thousands of naira Dec-20 Dec-19 Dec-20 Dec-19
Balance at 31 December
Group Company
Group Company
Group Company
Balance at 31 December
Dec-19
Dec-19
The Group did not recognise this amount as it is of the view that it may not be probable to have taxable profits against which the tax assets can be utilised, due to the four-year tax
lapse year for unrelieved losses for insurance companies in Nigeria.
Balance at 31 December
Group Company
Balance at 31 December
59
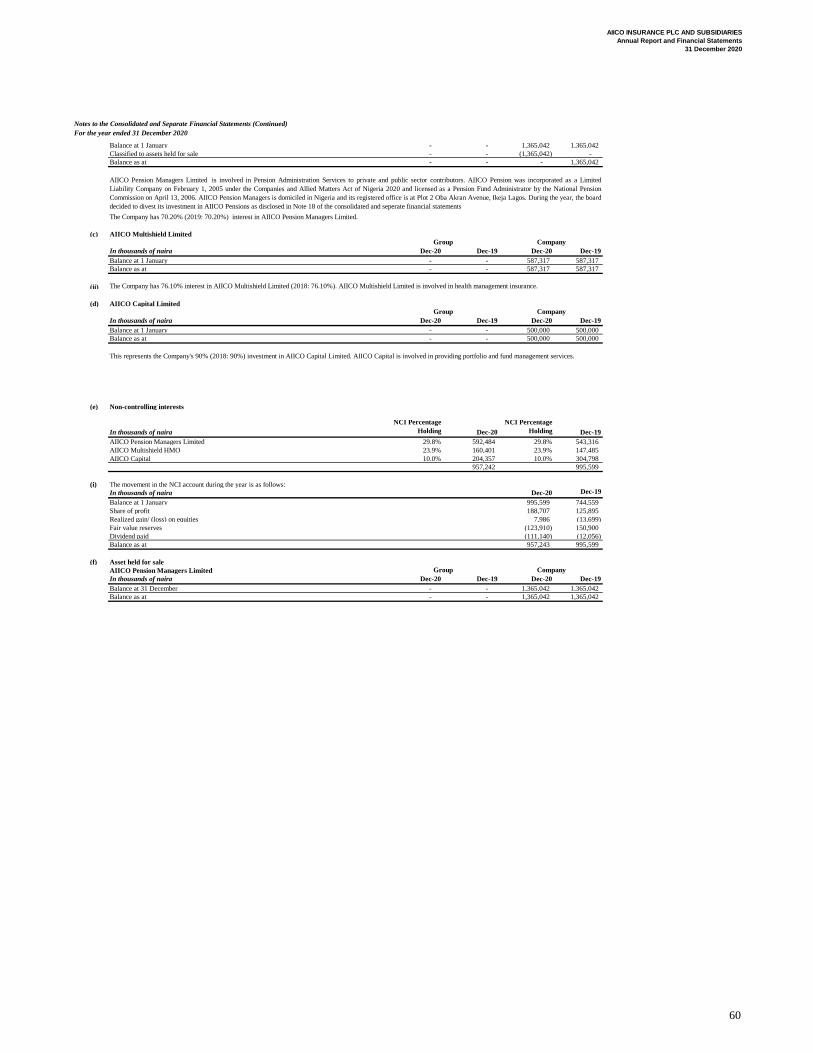
AIICO INSURANCE PLC AND SUBSIDIARIES
Annual Report and Financial Statements
31 December 2020
Notes to the Consolidated and Separate Financial Statements (Continued)
For the year ended 31 December 2020
Balance at 1 January - - 1,365,042 1,365,042
Classified to assets held for sale - - (1,365,042) -
Balance as at - - - 1,365,042
(c) AIICO Multishield Limited
In thousands of naira Dec-20 Dec-19 Dec-20 Dec-19
Balance at 1 January - - 587,317 587,317
Balance as at - - 587,317 587,317
(ii)
(d) AIICO Capital Limited
In thousands of naira Dec-20 Dec-19 Dec-20 Dec-19
Balance at 1 January - - 500,000 500,000
Balance as at - - 500,000 500,000
(e) Non-controlling interests
In thousands of naira
NCI Percentage
Holding Dec-20
NCI Percentage
Holding Dec-19
AIICO Pension Managers Limited 29.8% 592,484 29.8% 543,316
AIICO Multishield HMO 23.9% 160,401 23.9% 147,485
AIICO Capital 10.0% 204,357 10.0% 304,798
957,242 995,599
(i) The movement in the NCI account during the year is as follows:
In thousands of naira Dec-20 Dec-19
Balance at 1 January 995,599 744,559
Share of profit 188,707 125,895
Realized gain/ (loss) on equities 7,986 (13,699)
Fair value reserves (123,910) 150,900
Dividend paid (111,140) (12,056)
Balance as at 957,243 995,599
(f) Asset held for sale
AIICO Pension Managers Limited
In thousands of naira Dec-20 Dec-19 Dec-20 Dec-19
Balance at 31 December - - 1,365,042 1,365,042
Balance as at - - 1,365,042 1,365,042
AIICO Pension Managers Limited is involved in Pension Administration Services to private and public sector contributors. AIICO Pension was incorporated as a Limited
Liability Company on February 1, 2005 under the Companies and Allied Matters Act of Nigeria 2020 and licensed as a Pension Fund Administrator by the National Pension
Commission on April 13, 2006. AIICO Pension Managers is domiciled in Nigeria and its registered office is at Plot 2 Oba Akran Avenue, Ikeja Lagos. During the year, the board
decided to divest its investment in AIICO Pensions as disclosed in Note 18 of the consolidated and seperate financial statements
Group Company
This represents the Company's 90% (2018: 90%) investment in AIICO Capital Limited. AIICO Capital is involved in providing portfolio and fund management services.
The Company has 76.10% interest in AIICO Multishield Limited (2018: 76.10%). AIICO Multishield Limited is involved in health management insurance.
Group Company
The Company has 70.20% (2019: 70.20%) interest in AIICO Pension Managers Limited.
Group Company
60
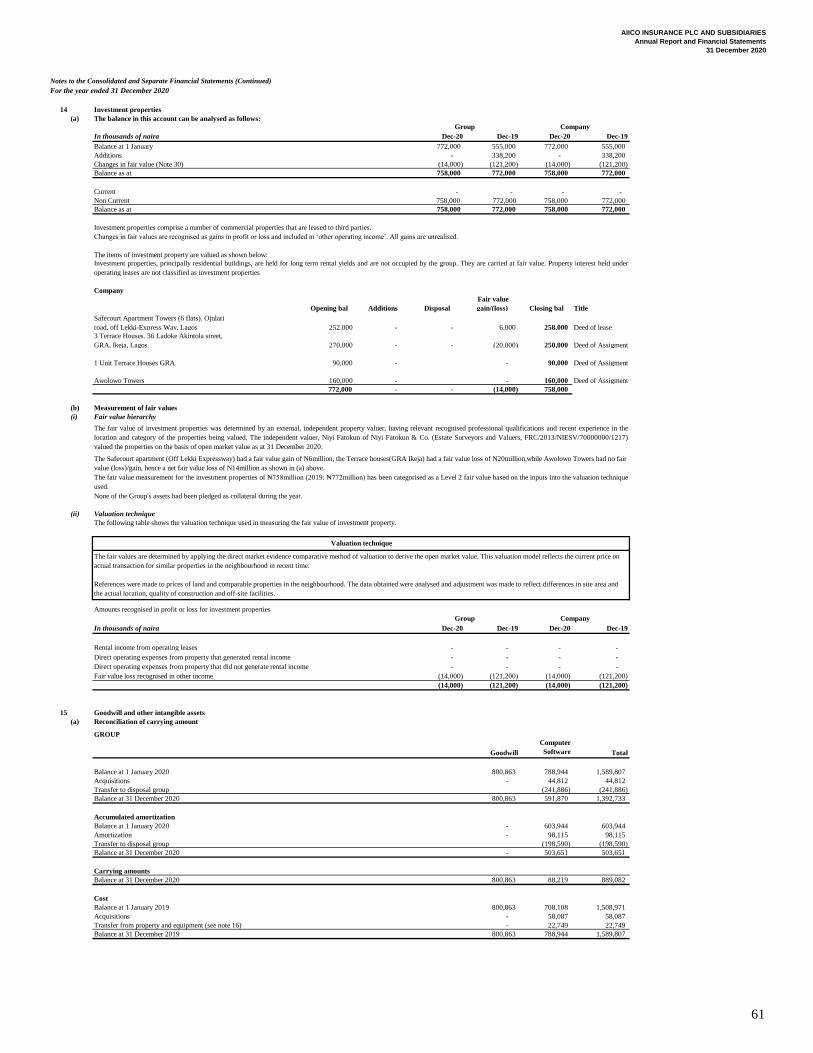
AIICO INSURANCE PLC AND SUBSIDIARIES
Annual Report and Financial Statements
31 December 2020
Notes to the Consolidated and Separate Financial Statements (Continued)
For the year ended 31 December 2020
14 Investment properties
(a) The balance in this account can be analysed as follows:
In thousands of naira Dec-20 Dec-19 Dec-20 Dec-19
Balance at 1 January 772,000 555,000 772,000 555,000
Additions - 338,200 - 338,200
Changes in fair value (Note 30) (14,000) (121,200) (14,000) (121,200)
Balance as at 758,000 772,000 758,000 772,000
Current - - - -
Non Current 758,000 772,000 758,000 772,000
Balance as at 758,000 772,000 758,000 772,000
Investment properties comprise a number of commercial properties that are leased to third parties.
Changes in fair values are recognised as gains in profit or loss and included in ‘other operating income’. All gains are unrealised.
The items of investment property are valued as shown below:
Company
Opening bal Additions Disposal
Fair value
gain/(loss) Closing bal Title
Safecourt Apartment Towers (6 flats). Ojulari
road, off Lekki-Express Way, Lagos 252,000 - - 6,000 258,000 Deed of lease
3 Terrace Houses. 36 Ladoke Akintola street,
GRA, Ikeja, Lagos 270,000 - - (20,000) 250,000 Deed of Assigment
1 Unit Terrace Houses GRA 90,000 - - 90,000 Deed of Assigment
Awolowo Towers 160,000 - - 160,000 Deed of Assigment
772,000 - - (14,000) 758,000
(b) Measurement of fair values
(i) Fair value hierarchy
None of the Group's assets had been pledged as collateral during the year.
(ii) Valuation technique
In thousands of naira Dec-20 Dec-19 Dec-20 Dec-19
Rental income from operating leases - - - -
Direct operating expenses from property that generated rental income - - - -
Direct operating expenses from property that did not generate rental income - - - -
Fair value loss recognised in other income (14,000) (121,200) (14,000) (121,200)
(14,000) (121,200) (14,000) (121,200)
15 Goodwill and other intangible assets
(a) Reconciliation of carrying amount
Goodwill
Computer
Software Total
Balance at 1 January 2020 800,863 788,944 1,589,807
Acquisitions - 44,812 44,812
Transfer to disposal group (241,886) (241,886)
Balance at 31 December 2020 800,863 591,870 1,392,733
Accumulated amortization
Balance at 1 January 2020 - 603,944 603,944
Amortization - 98,115 98,115
Transfer to disposal group (198,590) (198,590)
Balance at 31 December 2020 - 503,651 503,651
Carrying amounts
Balance at 31 December 2020 800,863 88,219 889,082
Cost
Balance at 1 January 2019 800,863 708,108 1,508,971
Acquisitions - 58,087 58,087
Transfer from property and equipment (see note 16) - 22,749 22,749
Balance at 31 December 2019 800,863 788,944 1,589,807
Investment properties, principally residential buildings, are held for long term rental yields and are not occupied by the group. They are carried at fair value. Property interest held under
operating leases are not classified as investment properties
GROUP
The fair values are determined by applying the direct market evidence comparative method of valuation to derive the open market value. This valuation model reflects the current price on
actual transaction for similar properties in the neighbourhood in recent time.
References were made to prices of land and comparable properties in the neighbourhood. The data obtained were analysed and adjustment was made to reflect differences in site area and
the actual location, quality of construction and off-site facilities.
Valuation technique
Amounts recognised in profit or loss for investment properties
Group Company
The fair value of investment properties was determined by an external, independent property valuer, having relevant recognised professional qualifications and recent experience in the
location and category of the properties being valued. The independent valuer, Niyi Fatokun of Niyi Fatokun & Co. (Estate Surveyors and Valuers, FRC/2013/NIESV/70000000/1217)
valued the properties on the basis of open market value as at 31 December 2020.
The fair value measurement for the investment properties of ₦758million (2019: ₦772million) has been categorised as a Level 2 fair value based on the inputs into the valuation technique
used.
The following table shows the valuation technique used in measuring the fair value of investment property.
Group Company
The Safecourt apartment (Off Lekki Expressway) had a fair value gain of N6million, the Terrace houses(GRA Ikeja) had a fair value loss of N20million,while Awolowo Towers had no fair
value (loss)/gain, hence a net fair value loss of N14million as shown in (a) above.
61
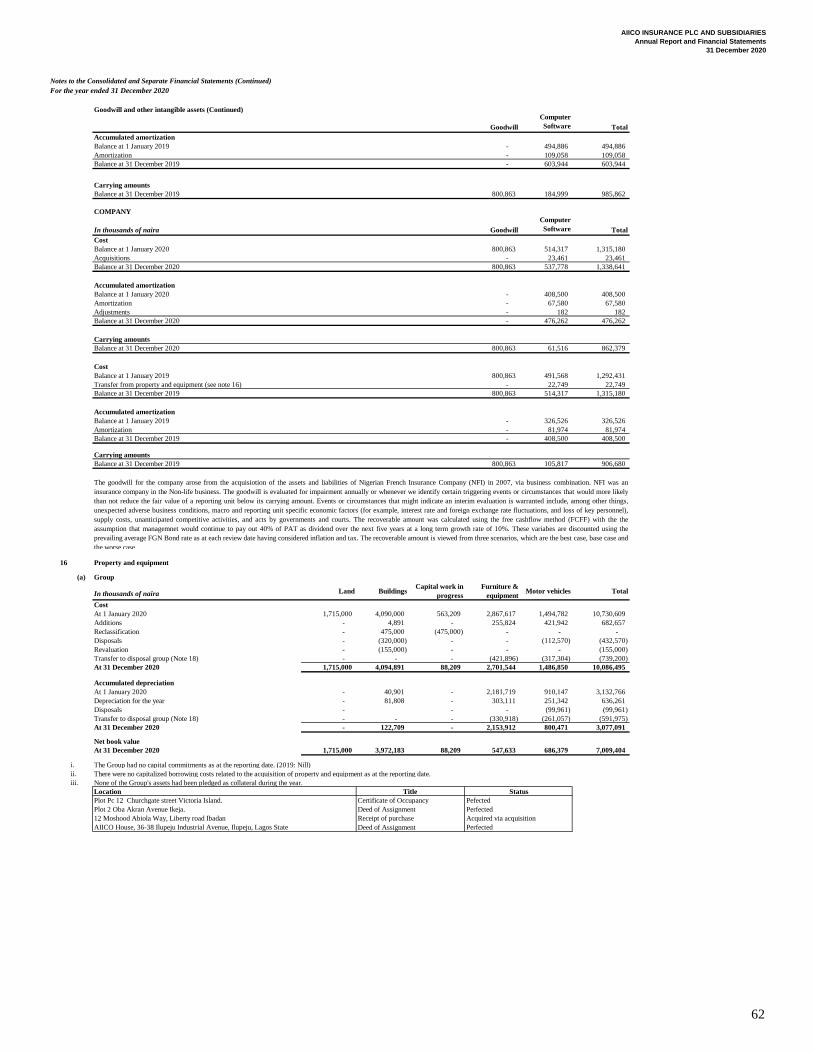
AIICO INSURANCE PLC AND SUBSIDIARIES
Annual Report and Financial Statements
31 December 2020
Notes to the Consolidated and Separate Financial Statements (Continued)
For the year ended 31 December 2020
Goodwill and other intangible assets (Continued)
Goodwill
Computer
Software Total
Accumulated amortization
Balance at 1 January 2019 - 494,886 494,886
Amortization - 109,058 109,058
Balance at 31 December 2019 - 603,944 603,944
Carrying amounts
Balance at 31 December 2019 800,863 184,999 985,862
In thousands of naira Goodwill
Computer
Software Total
Cost
Balance at 1 January 2020 800,863 514,317 1,315,180
Acquisitions - 23,461 23,461
Balance at 31 December 2020 800,863 537,778 1,338,641
Accumulated amortization
Balance at 1 January 2020 - 408,500 408,500
Amortization - 67,580 67,580
Adjustments - 182 182
Balance at 31 December 2020 - 476,262 476,262
Carrying amounts
Balance at 31 December 2020 800,863 61,516 862,379
Cost
Balance at 1 January 2019 800,863 491,568 1,292,431
Transfer from property and equipment (see note 16) - 22,749 22,749
Balance at 31 December 2019 800,863 514,317 1,315,180
Accumulated amortization
Balance at 1 January 2019 - 326,526 326,526
Amortization - 81,974 81,974
Balance at 31 December 2019 - 408,500 408,500
Carrying amounts
Balance at 31 December 2019 800,863 105,817 906,680
16 Property and equipment
(a) Group
In thousands of naira Land BuildingsCapital work in
progress
Furniture &
equipmentMotor vehicles Total
Cost
At 1 January 2020 1,715,000 4,090,000 563,209 2,867,617 1,494,782 10,730,609
Additions - 4,891 - 255,824 421,942 682,657
Reclassification - 475,000 (475,000) - - -
Disposals - (320,000) - - (112,570) (432,570)
Revaluation - (155,000) - - - (155,000)
Transfer to disposal group (Note 18) - - - (421,896) (317,304) (739,200)
At 31 December 2020 1,715,000 4,094,891 88,209 2,701,544 1,486,850 10,086,495
Accumulated depreciation
At 1 January 2020 - 40,901 - 2,181,719 910,147 3,132,766
Depreciation for the year - 81,808 - 303,111 251,342 636,261
Disposals - - - (99,961) (99,961)
Transfer to disposal group (Note 18) - - - (330,918) (261,057) (591,975)
At 31 December 2020 - 122,709 - 2,153,912 800,471 3,077,091
Net book value
At 31 December 2020 1,715,000 3,972,183 88,209 547,633 686,379 7,009,404
i. The Group had no capital commitments as at the reporting date. (2019: Nill)
ii. There were no capitalized borrowing costs related to the acquisition of property and equipment as at the reporting date.
iii.
Deed of Assignment
Certificate of Occupancy
Deed of Assignment
Receipt of purchase
Plot Pc 12 Churchgate street Victoria Island. Pefected
Location
Perfected
Acquired via acquisition
COMPANY
None of the Group's assets had been pledged as collateral during the year.
Title Status
AIICO House, 36-38 Ilupeju Industrial Avenue, Ilupeju, Lagos State Perfected
The goodwill for the company arose from the acquisiotion of the assets and liabilities of Nigerian French Insurance Company (NFI) in 2007, via business combination. NFI was an
insurance company in the Non-life business. The goodwill is evaluated for impairment annually or whenever we identify certain triggering events or circumstances that would more likely
than not reduce the fair value of a reporting unit below its carrying amount. Events or circumstances that might indicate an interim evaluation is warranted include, among other things,
unexpected adverse business conditions, macro and reporting unit specific economic factors (for example, interest rate and foreign exchange rate fluctuations, and loss of key personnel),
supply costs, unanticipated competitive activities, and acts by governments and courts. The recoverable amount was calculated using the free cashflow method (FCFF) with the the
assumption that managemnet would continue to pay out 40% of PAT as dividend over the next five years at a long term growth rate of 10%. These variabes are discounted using the
prevailing average FGN Bond rate as at each review date having considered inflation and tax. The recoverable amount is viewed from three scenarios, which are the best case, base case and
the worse case.
Plot 2 Oba Akran Avenue Ikeja.
12 Moshood Abiola Way, Liberty road Ibadan
62
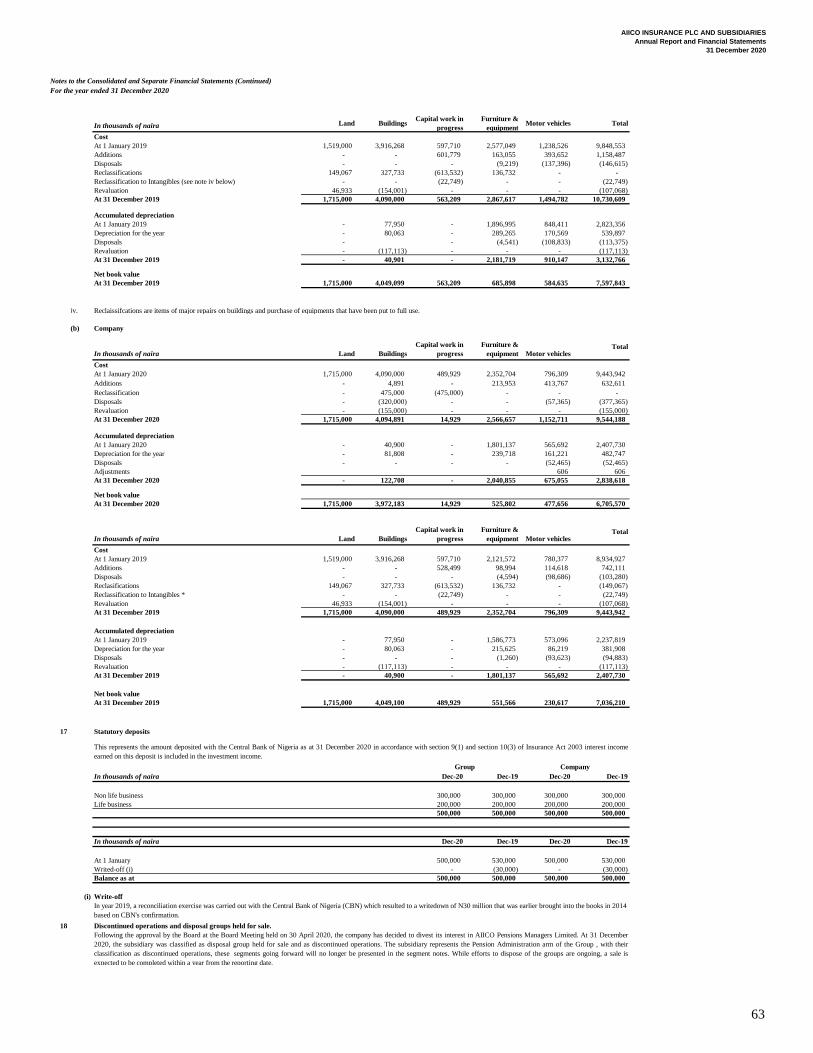
AIICO INSURANCE PLC AND SUBSIDIARIES
Annual Report and Financial Statements
31 December 2020
Notes to the Consolidated and Separate Financial Statements (Continued)
For the year ended 31 December 2020
In thousands of naira Land BuildingsCapital work in
progress
Furniture &
equipmentMotor vehicles Total
Cost
At 1 January 2019 1,519,000 3,916,268 597,710 2,577,049 1,238,526 9,848,553
Additions - - 601,779 163,055 393,652 1,158,487
Disposals - - - (9,219) (137,396) (146,615)
Reclassifications 149,067 327,733 (613,532) 136,732 - -
Reclassification to Intangibles (see note iv below) - - (22,749) - - (22,749)
Revaluation 46,933 (154,001) - - - (107,068)
At 31 December 2019 1,715,000 4,090,000 563,209 2,867,617 1,494,782 10,730,609
Accumulated depreciation
At 1 January 2019 - 77,950 - 1,896,995 848,411 2,823,356
Depreciation for the year - 80,063 - 289,265 170,569 539,897
Disposals - - (4,541) (108,833) (113,375)
Revaluation - (117,113) - - - (117,113)
At 31 December 2019 - 40,901 - 2,181,719 910,147 3,132,766
Net book value
At 31 December 2019 1,715,000 4,049,099 563,209 685,898 584,635 7,597,843
iv. Reclaissifcations are items of major repairs on buildings and purchase of equipments that have been put to full use.
(b) Company
In thousands of naira Land Buildings
Capital work in
progress
Furniture &
equipment Motor vehicles Total
Cost
At 1 January 2020 1,715,000 4,090,000 489,929 2,352,704 796,309 9,443,942
Additions - 4,891 - 213,953 413,767 632,611
Reclassification - 475,000 (475,000) - - -
Disposals - (320,000) - - (57,365) (377,365)
Revaluation - (155,000) - - - (155,000)
At 31 December 2020 1,715,000 4,094,891 14,929 2,566,657 1,152,711 9,544,188
Accumulated depreciation
At 1 January 2020 - 40,900 - 1,801,137 565,692 2,407,730
Depreciation for the year - 81,808 - 239,718 161,221 482,747
Disposals - - - - (52,465) (52,465)
Adjustments 606 606
At 31 December 2020 - 122,708 - 2,040,855 675,055 2,838,618
Net book value
At 31 December 2020 1,715,000 3,972,183 14,929 525,802 477,656 6,705,570
In thousands of naira Land Buildings
Capital work in
progress
Furniture &
equipment Motor vehicles Total
Cost
At 1 January 2019 1,519,000 3,916,268 597,710 2,121,572 780,377 8,934,927
Additions - - 528,499 98,994 114,618 742,111
Disposals - - - (4,594) (98,686) (103,280)
Reclasifications 149,067 327,733 (613,532) 136,732 - (149,067)
Reclassification to Intangibles * - - (22,749) - - (22,749)
Revaluation 46,933 (154,001) - - - (107,068)
At 31 December 2019 1,715,000 4,090,000 489,929 2,352,704 796,309 9,443,942
Accumulated depreciation
At 1 January 2019 - 77,950 - 1,586,773 573,096 2,237,819
Depreciation for the year - 80,063 - 215,625 86,219 381,908
Disposals - - - (1,260) (93,623) (94,883)
Revaluation - (117,113) - - - (117,113)
At 31 December 2019 - 40,900 - 1,801,137 565,692 2,407,730
Net book value
At 31 December 2019 1,715,000 4,049,100 489,929 551,566 230,617 7,036,210
17 Statutory deposits
In thousands of naira Dec-20 Dec-19 Dec-20 Dec-19
Non life business 300,000 300,000 300,000 300,000
Life business 200,000 200,000 200,000 200,000
500,000 500,000 500,000 500,000
In thousands of naira Dec-20 Dec-19 Dec-20 Dec-19
At 1 January 500,000 530,000 500,000 530,000
Writed-off (i) - (30,000) - (30,000)
Balance as at 500,000 500,000 500,000 500,000
(i) Write-off
18 Discontinued operations and disposal groups held for sale.
CompanyGroup
Following the approval by the Board at the Board Meeting held on 30 April 2020, the company has decided to divest its interest in AIICO Pensions Managers Limited. At 31 December
2020, the subsidiary was classified as disposal group held for sale and as discontinued operations. The subsidiary represents the Pension Administration arm of the Group , with their
classification as discontinued operations, these segments going forward will no longer be presented in the segment notes. While efforts to dispose of the groups are ongoing, a sale is
expected to be completed within a year from the reporting date.
This represents the amount deposited with the Central Bank of Nigeria as at 31 December 2020 in accordance with section 9(1) and section 10(3) of Insurance Act 2003 interest income
earned on this deposit is included in the investment income.
In year 2019, a reconciliation exercise was carried out with the Central Bank of Nigeria (CBN) which resulted to a writedown of N30 million that was earlier brought into the books in 2014
based on CBN's confirmation.
63
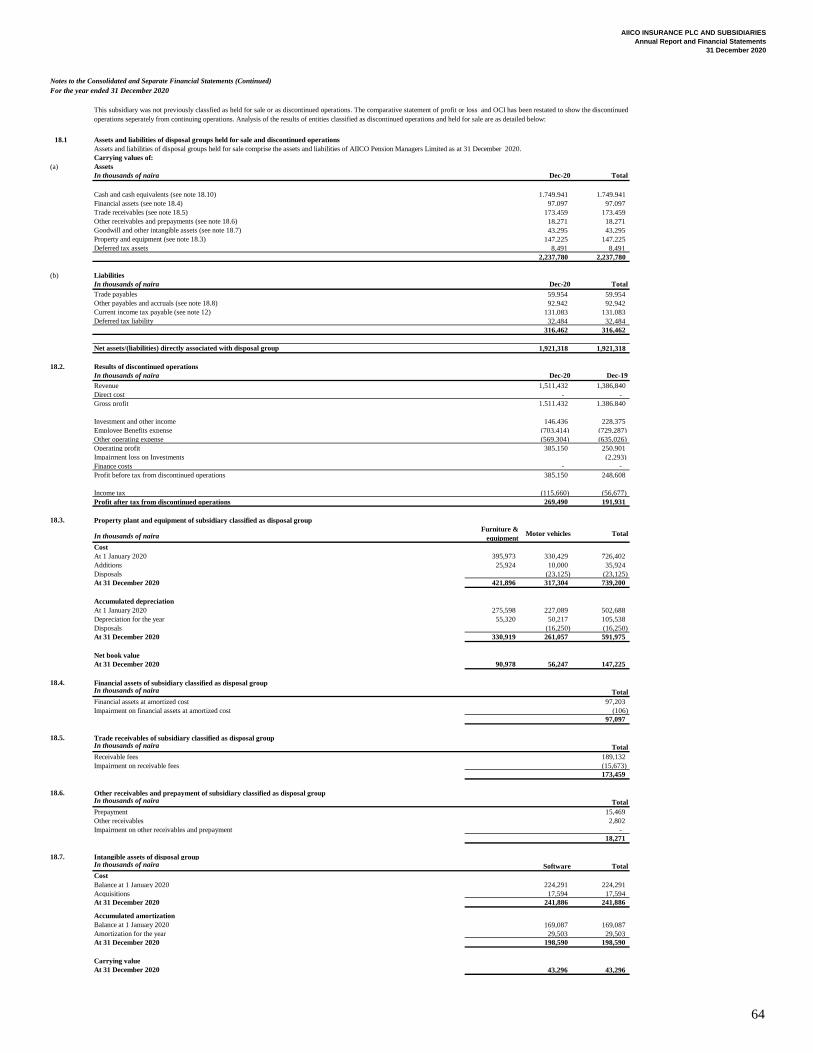
AIICO INSURANCE PLC AND SUBSIDIARIES
Annual Report and Financial Statements
31 December 2020
Notes to the Consolidated and Separate Financial Statements (Continued)
For the year ended 31 December 2020
18.1 Assets and liabilities of disposal groups held for sale and discontinued operations
Assets and liabilities of disposal groups held for sale comprise the assets and liabilities of AIICO Pension Managers Limited as at 31 December 2020.
Carrying values of:
(a) Assets
In thousands of naira Dec-20 Total
Cash and cash equivalents (see note 18.10) 1,749,941 1,749,941
Financial assets (see note 18.4) 97,097 97,097
Trade receivables (see note 18.5) 173,459 173,459
Other receivables and prepayments (see note 18.6) 18,271 18,271
Goodwill and other intangible assets (see note 18.7) 43,295 43,295
Property and equipment (see note 18.3) 147,225 147,225
Deferred tax assets 8,491 8,491
2,237,780 2,237,780
(b) Liabilities
In thousands of naira Dec-20 Total
Trade payables 59,954 59,954
Other payables and accruals (see note 18.8) 92,942 92,942
Current income tax payable (see note 12) 131,083 131,083
Deferred tax liability 32,484 32,484
316,462 316,462
Net assets/(liabilities) directly associated with disposal group 1,921,318 1,921,318
18.2. Results of discontinued operations
In thousands of naira Dec-20 Dec-19
Revenue 1,511,432 1,386,840
Direct cost - -
Gross profit 1,511,432 1,386,840
Investment and other income 146,436 228,375
Employee Benefits expense (703,414) (729,287)
Other operating expense (569,304) (635,026)
Operating profit 385,150 250,901
Impairment loss on Investments (2,293)
Finance costs - -
Profit before tax from discontinued operations 385,150 248,608
Income tax (115,660) (56,677)
Profit after tax from discontinued operations 269,490 191,931
18.3. Property plant and equipment of subsidiary classified as disposal group
In thousands of nairaFurniture &
equipmentMotor vehicles Total
Cost
At 1 January 2020 395,973 330,429 726,402
Additions 25,924 10,000 35,924
Disposals (23,125) (23,125)
At 31 December 2020 421,896 317,304 739,200
Accumulated depreciation
At 1 January 2020 275,598 227,089 502,688
Depreciation for the year 55,320 50,217 105,538
Disposals (16,250) (16,250)
At 31 December 2020 330,919 261,057 591,975
Net book value
At 31 December 2020 90,978 56,247 147,225
18.4. Financial assets of subsidiary classified as disposal groupIn thousands of naira Total
Financial assets at amortized cost 97,203
Impairment on financial assets at amortized cost (106)
97,097
18.5. Trade receivables of subsidiary classified as disposal groupIn thousands of naira Total
Receivable fees 189,132
Impairment on receivable fees (15,673)
173,459
18.6. Other receivables and prepayment of subsidiary classified as disposal groupIn thousands of naira Total
Prepayment 15,469
Other receivables 2,802
Impairment on other receivables and prepayment -
18,271
18.7. Intangible assets of disposal groupIn thousands of naira Software Total
Cost
Balance at 1 January 2020 224,291 224,291
Acquisitions 17,594 17,594
At 31 December 2020 241,886 241,886
Accumulated amortization
Balance at 1 January 2020 169,087 169,087
Amortization for the year 29,503 29,503
At 31 December 2020 198,590 198,590
Carrying value
At 31 December 2020 43,296 43,296
This subsidiary was not previously classfied as held for sale or as discontinued operations. The comparative statement of profit or loss and OCI has been restated to show the discontinued
operations seperately from continuing operations. Analysis of the results of entities classified as discontinued operations and held for sale are as detailed below:
64
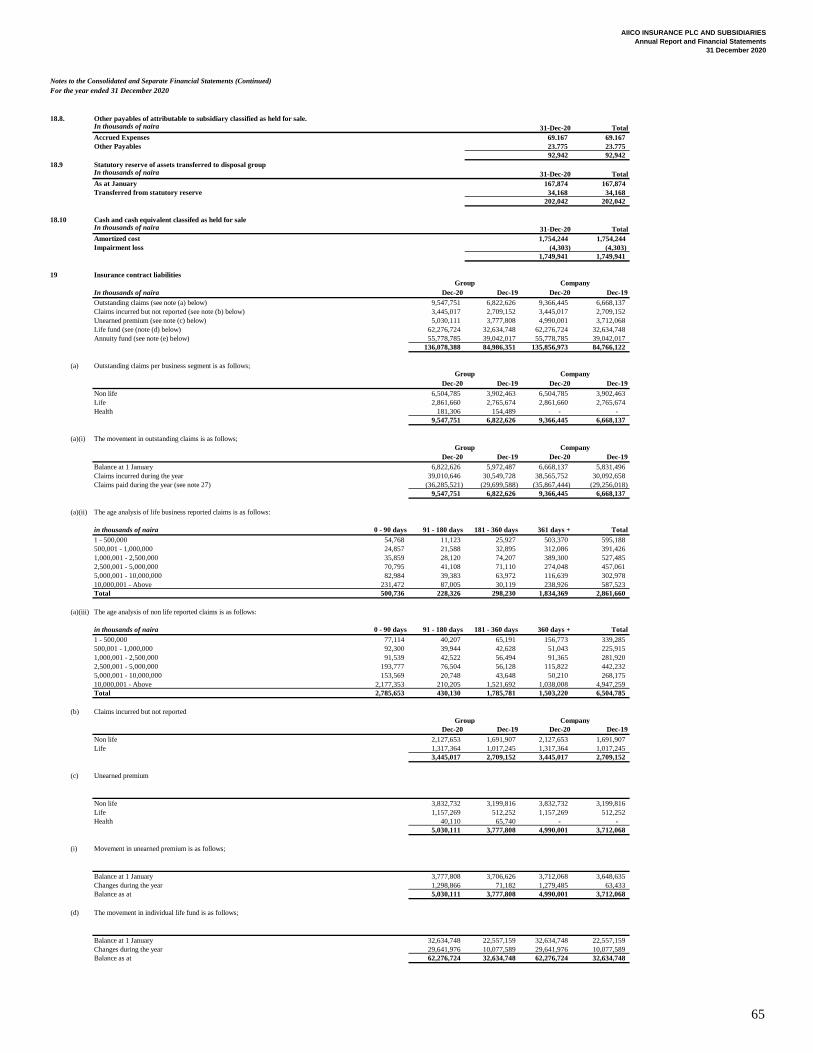
AIICO INSURANCE PLC AND SUBSIDIARIES
Annual Report and Financial Statements
31 December 2020
Notes to the Consolidated and Separate Financial Statements (Continued)
For the year ended 31 December 2020
18.8. Other payables of attributable to subsidiary classified as held for sale.In thousands of naira 31-Dec-20 Total
Accrued Expenses 69,167 69,167
Other Payables 23,775 23,775
92,942 92,942
18.9 Statutory reserve of assets transferred to disposal groupIn thousands of naira 31-Dec-20 Total
As at January 167,874 167,874
Transferred from statutory reserve 34,168 34,168
202,042 202,042
18.10 Cash and cash equivalent classifed as held for saleIn thousands of naira 31-Dec-20 Total
Amortized cost 1,754,244 1,754,244
Impairment loss (4,303) (4,303)
1,749,941 1,749,941
19 Insurance contract liabilities
In thousands of naira Dec-20 Dec-19 Dec-20 Dec-19
Outstanding claims (see note (a) below) 9,547,751 6,822,626 9,366,445 6,668,137
Claims incurred but not reported (see note (b) below) 3,445,017 2,709,152 3,445,017 2,709,152
Unearned premium (see note (c) below) 5,030,111 3,777,808 4,990,001 3,712,068
Life fund (see (note (d) below) 62,276,724 32,634,748 62,276,724 32,634,748
Annuity fund (see note (e) below) 55,778,785 39,042,017 55,778,785 39,042,017
136,078,388 84,986,351 135,856,973 84,766,122
(a) Outstanding claims per business segment is as follows;
Dec-20 Dec-19 Dec-20 Dec-19
Non life 6,504,785 3,902,463 6,504,785 3,902,463
Life 2,861,660 2,765,674 2,861,660 2,765,674
Health 181,306 154,489 - -
9,547,751 6,822,626 9,366,445 6,668,137
(a)(i) The movement in outstanding claims is as follows;
Dec-20 Dec-19 Dec-20 Dec-19
Balance at 1 January 6,822,626 5,972,487 6,668,137 5,831,496
Claims incurred during the year 39,010,646 30,549,728 38,565,752 30,092,658
Claims paid during the year (see note 27) (36,285,521) (29,699,588) (35,867,444) (29,256,018)
9,547,751 6,822,626 9,366,445 6,668,137
(a)(ii) The age analysis of life business reported claims is as follows:
in thousands of naira 0 - 90 days 91 - 180 days 181 - 360 days 361 days + Total
1 - 500,000 54,768 11,123 25,927 503,370 595,188
500,001 - 1,000,000 24,857 21,588 32,895 312,086 391,426
1,000,001 - 2,500,000 35,859 28,120 74,207 389,300 527,485
2,500,001 - 5,000,000 70,795 41,108 71,110 274,048 457,061
5,000,001 - 10,000,000 82,984 39,383 63,972 116,639 302,978
10,000,001 - Above 231,472 87,005 30,119 238,926 587,523
Total 500,736 228,326 298,230 1,834,369 2,861,660
(a)(iii) The age analysis of non life reported claims is as follows:
in thousands of naira 0 - 90 days 91 - 180 days 181 - 360 days 360 days + Total
1 - 500,000 77,114 40,207 65,191 156,773 339,285
500,001 - 1,000,000 92,300 39,944 42,628 51,043 225,915
1,000,001 - 2,500,000 91,539 42,522 56,494 91,365 281,920
2,500,001 - 5,000,000 193,777 76,504 56,128 115,822 442,232
5,000,001 - 10,000,000 153,569 20,748 43,648 50,210 268,175
10,000,001 - Above 2,177,353 210,205 1,521,692 1,038,008 4,947,259
Total 2,785,653 430,130 1,785,781 1,503,220 6,504,785
(b) Claims incurred but not reported
Dec-20 Dec-19 Dec-20 Dec-19
Non life 2,127,653 1,691,907 2,127,653 1,691,907
Life 1,317,364 1,017,245 1,317,364 1,017,245
3,445,017 2,709,152 3,445,017 2,709,152
(c) Unearned premium
Non life 3,832,732 3,199,816 3,832,732 3,199,816
Life 1,157,269 512,252 1,157,269 512,252
Health 40,110 65,740 - -
5,030,111 3,777,808 4,990,001 3,712,068
(i) Movement in unearned premium is as follows;
Balance at 1 January 3,777,808 3,706,626 3,712,068 3,648,635
Changes during the year 1,298,866 71,182 1,279,485 63,433
Balance as at 5,030,111 3,777,808 4,990,001 3,712,068
(d) The movement in individual life fund is as follows;
Balance at 1 January 32,634,748 22,557,159 32,634,748 22,557,159
Changes during the year 29,641,976 10,077,589 29,641,976 10,077,589
Balance as at 62,276,724 32,634,748 62,276,724 32,634,748
Company
Group Company
Group Company
Group Company
Group
65
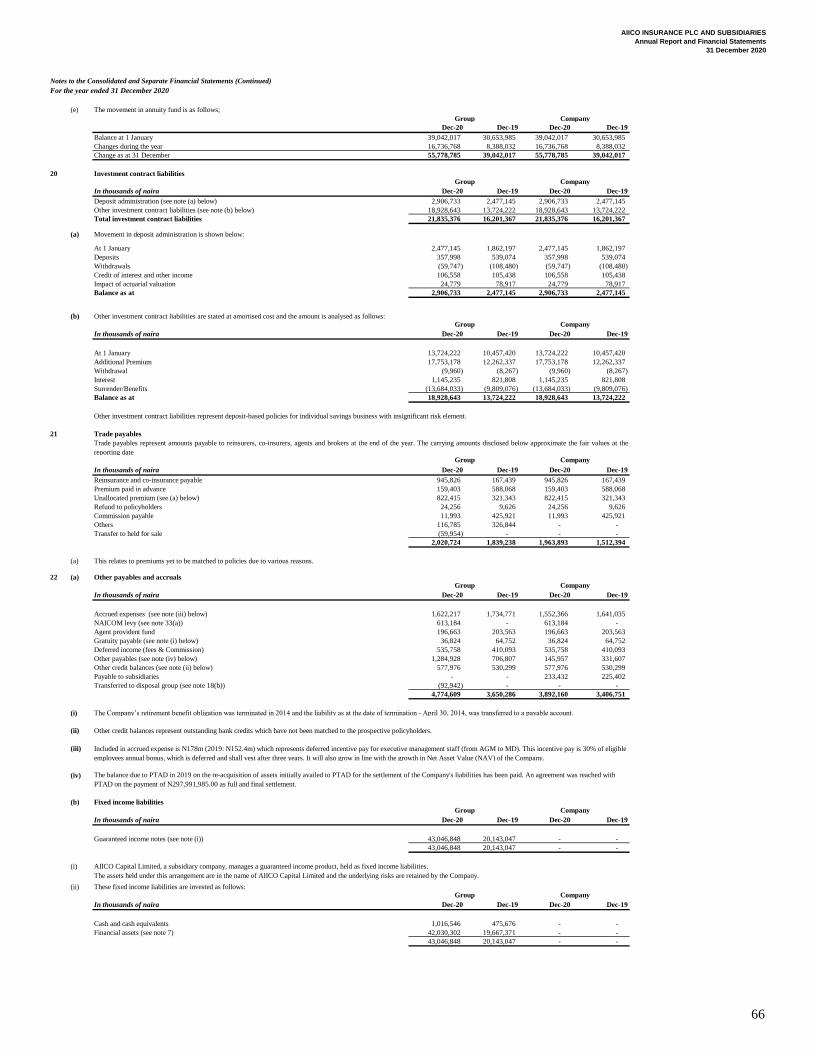
AIICO INSURANCE PLC AND SUBSIDIARIES
Annual Report and Financial Statements
31 December 2020
Notes to the Consolidated and Separate Financial Statements (Continued)
For the year ended 31 December 2020
(e) The movement in annuity fund is as follows;
Dec-20 Dec-19 Dec-20 Dec-19
Balance at 1 January 39,042,017 30,653,985 39,042,017 30,653,985
Changes during the year 16,736,768 8,388,032 16,736,768 8,388,032
Change as at 31 December 55,778,785 39,042,017 55,778,785 39,042,017
20 Investment contract liabilities
In thousands of naira Dec-20 Dec-19 Dec-20 Dec-19
Deposit administration (see note (a) below) 2,906,733 2,477,145 2,906,733 2,477,145
Other investment contract liabilities (see note (b) below) 18,928,643 13,724,222 18,928,643 13,724,222
Total investment contract liabilities 21,835,376 16,201,367 21,835,376 16,201,367
(a) Movement in deposit administration is shown below:
At 1 January 2,477,145 1,862,197 2,477,145 1,862,197
Deposits 357,998 539,074 357,998 539,074
Withdrawals (59,747) (108,480) (59,747) (108,480)
Credit of interest and other income 106,558 105,438 106,558 105,438
Impact of actuarial valuation 24,779 78,917 24,779 78,917
Balance as at 2,906,733 2,477,145 2,906,733 2,477,145
(b) Other investment contract liabilities are stated at amortised cost and the amount is analysed as follows:
In thousands of naira Dec-20 Dec-19 Dec-20 Dec-19
At 1 January 13,724,222 10,457,420 13,724,222 10,457,420
Additional Premium 17,753,178 12,262,337 17,753,178 12,262,337
Withdrawal (9,960) (8,267) (9,960) (8,267)
Interest 1,145,235 821,808 1,145,235 821,808
Surrender/Benefits (13,684,033) (9,809,076) (13,684,033) (9,809,076)
Balance as at 18,928,643 13,724,222 18,928,643 13,724,222
Other investment contract liabilities represent deposit-based policies for individual savings business with insignificant risk element.
21 Trade payables
In thousands of naira Dec-20 Dec-19 Dec-20 Dec-19
Reinsurance and co-insurance payable 945,826 167,439 945,826 167,439
Premium paid in advance 159,403 588,068 159,403 588,068
Unallocated premium (see (a) below) 822,415 321,343 822,415 321,343
Refund to policyholders 24,256 9,626 24,256 9,626
Commission payable 11,993 425,921 11,993 425,921
Others 116,785 326,844 - -
Transfer to held for sale (59,954) - - -
2,020,724 1,839,238 1,963,893 1,512,394
(a) This relates to premiums yet to be matched to policies due to various reasons.
22 (a) Other payables and accruals
In thousands of naira Dec-20 Dec-19 Dec-20 Dec-19
Accrued expenses (see note (iii) below) 1,622,217 1,734,771 1,552,366 1,641,035
NAICOM levy (see note 33(a)) 613,184 - 613,184 -
Agent provident fund 196,663 203,563 196,663 203,563
Gratuity payable (see note (i) below) 36,824 64,752 36,824 64,752
Deferred income (fees & Commission) 535,758 410,093 535,758 410,093
Other payables (see note (iv) below) 1,284,928 706,807 145,957 331,607
Other credit balances (see note (ii) below) 577,976 530,299 577,976 530,299
Payable to subsidiaries - - 233,432 225,402
Transferred to disposal group (see note 18(b)) (92,942) - - -
4,774,609 3,650,286 3,892,160 3,406,751
(i)
(ii) Other credit balances represent outstanding bank credits which have not been matched to the prospective policyholders.
(iii)
(iv)
(b) Fixed income liabilities
In thousands of naira Dec-20 Dec-19 Dec-20 Dec-19
Guaranteed income notes (see note (i)) 43,046,848 20,143,047 - -
43,046,848 20,143,047 - -
(i)
(ii)
In thousands of naira Dec-20 Dec-19 Dec-20 Dec-19
Cash and cash equivalents 1,016,546 475,676 - -
Financial assets (see note 7) 42,030,302 19,667,371 - -
43,046,848 20,143,047 - -
Group
AIICO Capital Limited, a subsidiary company, manages a guaranteed income product, held as fixed income liabilities.
The assets held under this arrangement are in the name of AIICO Capital Limited and the underlying risks are retained by the Company.
These fixed income liabilities are invested as follows:
Company
Group Company
Group
Company
Group Company
Group Company
Group
Group
Included in accrued expense is N178m (2019: N152.4m) which represents deferred incentive pay for executive management staff (from AGM to MD). This incentive pay is 30% of eligible
employees annual bonus, which is deferred and shall vest after three years. It will also grow in line with the growth in Net Asset Value (NAV) of the Company.
Trade payables represent amounts payable to reinsurers, co-insurers, agents and brokers at the end of the year. The carrying amounts disclosed below approximate the fair values at the
reporting date
Company
Company
The Company’s retirement benefit obligation was terminated in 2014 and the liability as at the date of termination - April 30, 2014, was transferred to a payable account.
The balance due to PTAD in 2019 on the re-acquisition of assets initially availed to PTAD for the settlement of the Company's liabilities has been paid. An agreement was reached with
PTAD on the payment of N297,991,985.00 as full and final settlement.
66
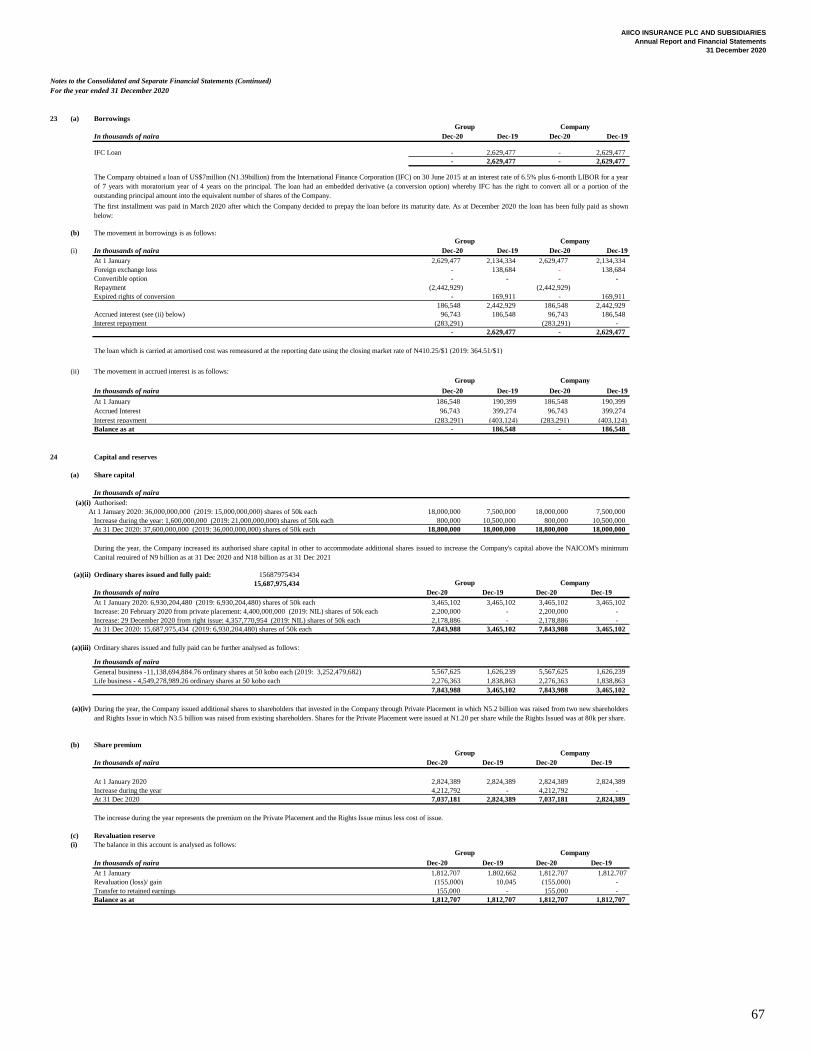
AIICO INSURANCE PLC AND SUBSIDIARIES
Annual Report and Financial Statements
31 December 2020
Notes to the Consolidated and Separate Financial Statements (Continued)
For the year ended 31 December 2020
23 (a) Borrowings
In thousands of naira Dec-20 Dec-19 Dec-20 Dec-19
IFC Loan - 2,629,477 - 2,629,477
- 2,629,477 - 2,629,477
(b) The movement in borrowings is as follows:
(i) In thousands of naira Dec-20 Dec-19 Dec-20 Dec-19
At 1 January 2,629,477 2,134,334 2,629,477 2,134,334
Foreign exchange loss - 138,684 - 138,684
Convertible option - - - -
Repayment (2,442,929) (2,442,929)
Expired rights of conversion - 169,911 - 169,911
186,548 2,442,929 186,548 2,442,929
Accrued interest (see (ii) below) 96,743 186,548 96,743 186,548
Interest repayment (283,291) (283,291) -
- 2,629,477 - 2,629,477
(ii) The movement in accrued interest is as follows:
In thousands of naira Dec-20 Dec-19 Dec-20 Dec-19
At 1 January 186,548 190,399 186,548 190,399
Accrued Interest 96,743 399,274 96,743 399,274
Interest repayment (283,291) (403,124) (283,291) (403,124)
Balance as at - 186,548 - 186,548
24 Capital and reserves
(a) Share capital
In thousands of naira
(a)(i) Authorised:
At 1 January 2020: 36,000,000,000 (2019: 15,000,000,000) shares of 50k each 18,000,000 7,500,000 18,000,000 7,500,000
Increase during the year: 1,600,000,000 (2019: 21,000,000,000) shares of 50k each 800,000 10,500,000 800,000 10,500,000
At 31 Dec 2020: 37,600,000,000 (2019: 36,000,000,000) shares of 50k each 18,800,000 18,000,000 18,800,000 18,000,000
(a)(ii) Ordinary shares issued and fully paid: 15687975434
15,687,975,434
In thousands of naira Dec-20 Dec-19 Dec-20 Dec-19
At 1 January 2020: 6,930,204,480 (2019: 6,930,204,480) shares of 50k each 3,465,102 3,465,102 3,465,102 3,465,102
Increase: 20 February 2020 from private placement: 4,400,000,000 (2019: NIL) shares of 50k each 2,200,000 - 2,200,000 -
Increase: 29 December 2020 from right issue: 4,357,770,954 (2019: NIL) shares of 50k each 2,178,886 - 2,178,886 -
At 31 Dec 2020: 15,687,975,434 (2019: 6,930,204,480) shares of 50k each 7,843,988 3,465,102 7,843,988 3,465,102
(a)(iii) Ordinary shares issued and fully paid can be further analysed as follows:
In thousands of naira
General business -11,138,694,884.76 ordinary shares at 50 kobo each (2019: 3,252,479,682) 5,567,625 1,626,239 5,567,625 1,626,239
Life business - 4,549,278,989.26 ordinary shares at 50 kobo each 2,276,363 1,838,863 2,276,363 1,838,863
7,843,988 3,465,102 7,843,988 3,465,102
(a)(iv)
(b) Share premium
In thousands of naira Dec-20 Dec-19 Dec-20 Dec-19
At 1 January 2020 2,824,389 2,824,389 2,824,389 2,824,389
Increase during the year 4,212,792 - 4,212,792 -
At 31 Dec 2020 7,037,181 2,824,389 7,037,181 2,824,389
The increase during the year represents the premium on the Private Placement and the Rights Issue minus less cost of issue.
(c) Revaluation reserve
(i) The balance in this account is analysed as follows:
In thousands of naira Dec-20 Dec-19 Dec-20 Dec-19
At 1 January 1,812,707 1,802,662 1,812,707 1,812,707
Revaluation (loss)/ gain (155,000) 10,045 (155,000) -
Transfer to retained earnings 155,000 - 155,000 -
Balance as at 1,812,707 1,812,707 1,812,707 1,812,707
Group Company
Group Company
During the year, the Company issued additional shares to shareholders that invested in the Company through Private Placement in which N5.2 billion was raised from two new shareholders
and Rights Issue in which N3.5 billion was raised from existing shareholders. Shares for the Private Placement were issued at N1.20 per share while the Rights Issued was at 80k per share.
During the year, the Company increased its authorised share capital in other to accommodate additional shares issued to increase the Company's capital above the NAICOM's minimum
Capital required of N9 billion as at 31 Dec 2020 and N18 billion as at 31 Dec 2021
Group Company
The loan which is carried at amortised cost was remeasured at the reporting date using the closing market rate of N410.25/$1 (2019: 364.51/$1)
The Company obtained a loan of US$7million (N1.39billion) from the International Finance Corporation (IFC) on 30 June 2015 at an interest rate of 6.5% plus 6-month LIBOR for a year
of 7 years with moratorium year of 4 years on the principal. The loan had an embedded derivative (a conversion option) whereby IFC has the right to convert all or a portion of the
outstanding principal amount into the equivalent number of shares of the Company.
Group Company
Group Company
Group Company
The first installment was paid in March 2020 after which the Company decided to prepay the loan before its maturity date. As at December 2020 the loan has been fully paid as shown
below:
67
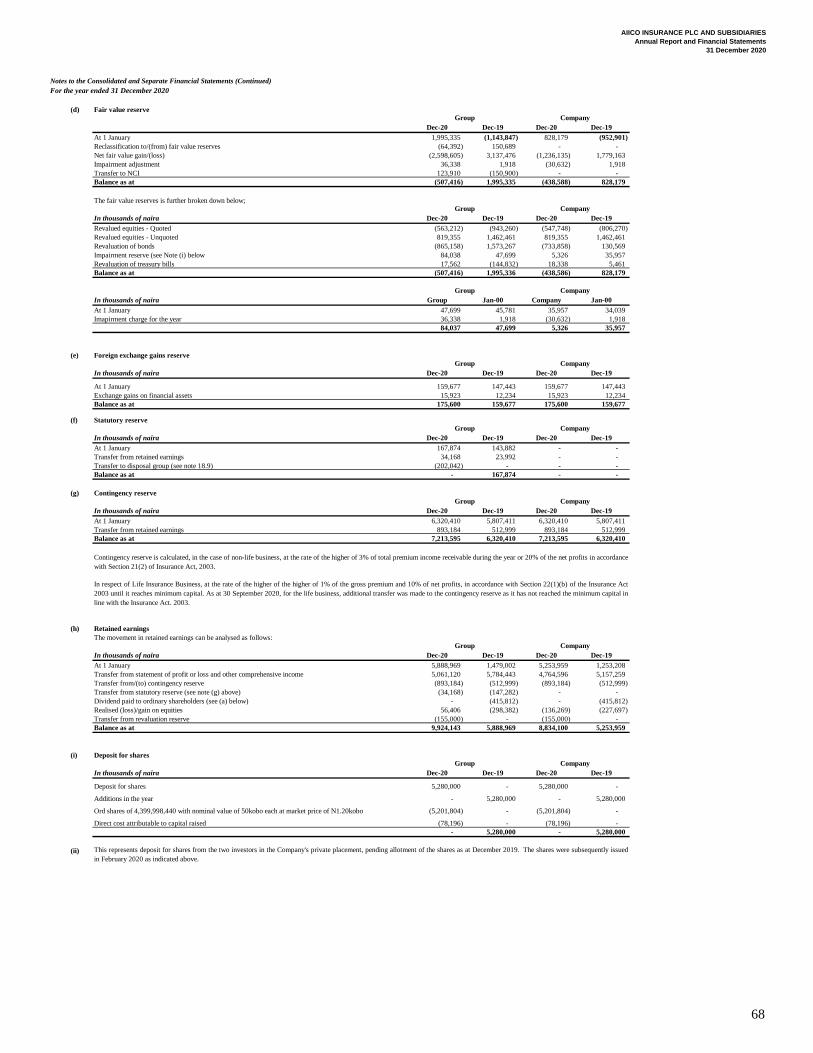
AIICO INSURANCE PLC AND SUBSIDIARIES
Annual Report and Financial Statements
31 December 2020
Notes to the Consolidated and Separate Financial Statements (Continued)
For the year ended 31 December 2020
(d) Fair value reserve
Dec-20 Dec-19 Dec-20 Dec-19
At 1 January 1,995,335 (1,143,847) 828,179 (952,901)
Reclassification to/(from) fair value reserves (64,392) 150,689 - -
Net fair value gain/(loss) (2,598,605) 3,137,476 (1,236,135) 1,779,163
Impairment adjustment 36,338 1,918 (30,632) 1,918
Transfer to NCI 123,910 (150,900) - -
Balance as at (507,416) 1,995,335 (438,588) 828,179
The fair value reserves is further broken down below;
In thousands of naira Dec-20 Dec-19 Dec-20 Dec-19
Revalued equities - Quoted (563,212) (943,260) (547,748) (806,270)
Revalued equities - Unquoted 819,355 1,462,461 819,355 1,462,461
Revaluation of bonds (865,158) 1,573,267 (733,858) 130,569
Impairment reserve (see Note (i) below 84,038 47,699 5,326 35,957
Revaluation of treasury bills 17,562 (144,832) 18,338 5,461
Balance as at (507,416) 1,995,336 (438,586) 828,179
In thousands of naira Group Jan-00 Company Jan-00
At 1 January 47,699 45,781 35,957 34,039
Imapirment charge for the year 36,338 1,918 (30,632) 1,918
84,037 47,699 5,326 35,957
(e) Foreign exchange gains reserve
In thousands of naira Dec-20 Dec-19 Dec-20 Dec-19
At 1 January 159,677 147,443 159,677 147,443
Exchange gains on financial assets 15,923 12,234 15,923 12,234
Balance as at 175,600 159,677 175,600 159,677
(f) Statutory reserve
In thousands of naira Dec-20 Dec-19 Dec-20 Dec-19
At 1 January 167,874 143,882 - -
Transfer from retained earnings 34,168 23,992 - -
Transfer to disposal group (see note 18.9) (202,042) - - -
Balance as at - 167,874 - -
(g) Contingency reserve
In thousands of naira Dec-20 Dec-19 Dec-20 Dec-19
At 1 January 6,320,410 5,807,411 6,320,410 5,807,411
Transfer from retained earnings 893,184 512,999 893,184 512,999
Balance as at 7,213,595 6,320,410 7,213,595 6,320,410
(h) Retained earnings
The movement in retained earnings can be analysed as follows:
In thousands of naira Dec-20 Dec-19 Dec-20 Dec-19
At 1 January 5,888,969 1,479,002 5,253,959 1,253,208
Transfer from statement of profit or loss and other comprehensive income 5,061,120 5,784,443 4,764,596 5,157,259
Transfer from/(to) contingency reserve (893,184) (512,999) (893,184) (512,999)
Transfer from statutory reserve (see note (g) above) (34,168) (147,282) - -
Dividend paid to ordinary shareholders (see (a) below) - (415,812) - (415,812)
Realised (loss)/gain on equities 56,406 (298,382) (136,269) (227,697)
Transfer from revaluation reserve (155,000) - (155,000) -
Balance as at 9,924,143 5,888,969 8,834,100 5,253,959
(i) Deposit for shares
In thousands of naira Dec-20 Dec-19 Dec-20 Dec-19
Deposit for shares 5,280,000 - 5,280,000 -
Additions in the year - 5,280,000 - 5,280,000
Ord shares of 4,399,998,440 with nominal value of 50kobo each at market price of N1.20kobo (5,201,804) - (5,201,804) -
Direct cost attributable to capital raised (78,196) - (78,196) -
- 5,280,000 - 5,280,000
(ii) This represents deposit for shares from the two investors in the Company's private placement, pending allotment of the shares as at December 2019. The shares were subsequently issued
in February 2020 as indicated above.
Group Company
Company
Group Company
Group Company
Group Company
Group Company
Group
Group Company
Contingency reserve is calculated, in the case of non-life business, at the rate of the higher of 3% of total premium income receivable during the year or 20% of the net profits in accordance
with Section 21(2) of Insurance Act, 2003.
In respect of Life Insurance Business, at the rate of the higher of the higher of 1% of the gross premium and 10% of net profits, in accordance with Section 22(1)(b) of the Insurance Act
2003 until it reaches minimum capital. As at 30 September 2020, for the life business, additional transfer was made to the contingency reserve as it has not reached the minimum capital in
line with the Insurance Act, 2003.
Group Company
68
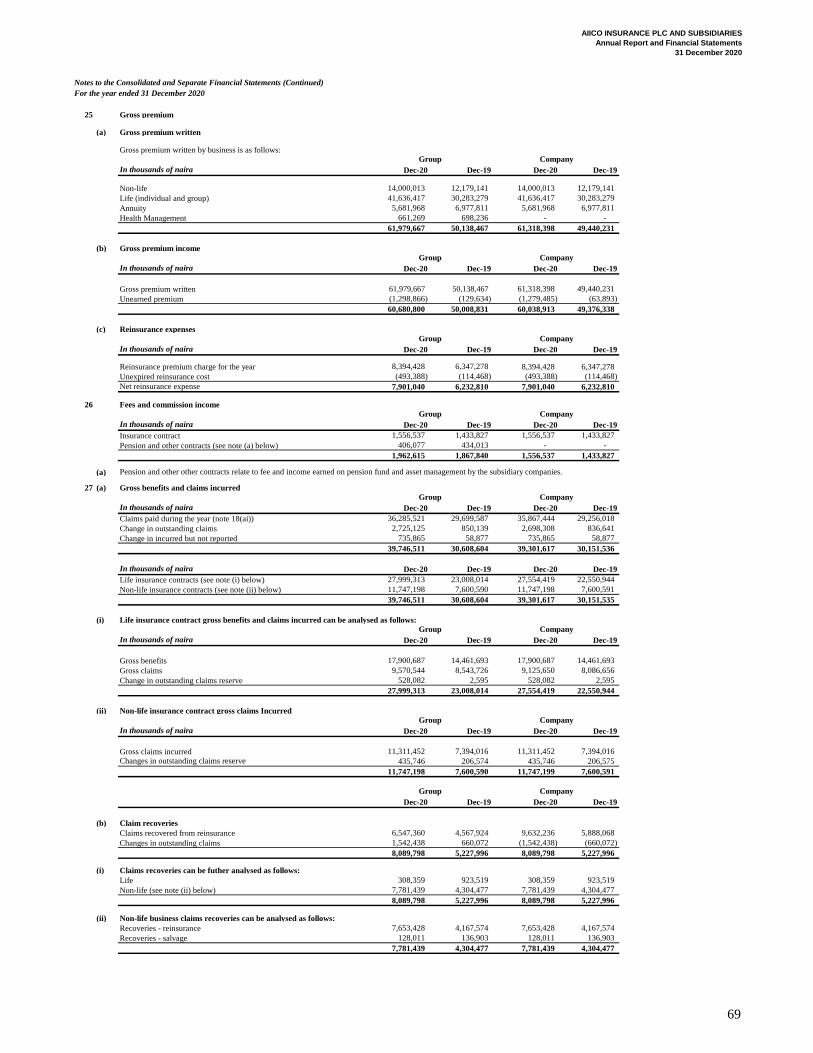
AIICO INSURANCE PLC AND SUBSIDIARIES
Annual Report and Financial Statements
31 December 2020
Notes to the Consolidated and Separate Financial Statements (Continued)
For the year ended 31 December 2020
25 Gross premium
(a) Gross premium written
Gross premium written by business is as follows:
In thousands of naira Dec-20 Dec-19 Dec-20 Dec-19
Non-life 14,000,013 12,179,141 14,000,013 12,179,141
Life (individual and group) 41,636,417 30,283,279 41,636,417 30,283,279
Annuity 5,681,968 6,977,811 5,681,968 6,977,811
Health Management 661,269 698,236 - -
61,979,667 50,138,467 61,318,398 49,440,231
(b) Gross premium income
In thousands of naira Dec-20 Dec-19 Dec-20 Dec-19
Gross premium written 61,979,667 50,138,467 61,318,398 49,440,231
Unearned premium (1,298,866) (129,634) (1,279,485) (63,893)
60,680,800 50,008,831 60,038,913 49,376,338
(c) Reinsurance expenses
In thousands of naira Dec-20 Dec-19 Dec-20 Dec-19
Reinsurance premium charge for the year 8,394,428 6,347,278 8,394,428 6,347,278
Unexpired reinsurance cost (493,388) (114,468) (493,388) (114,468)
Net reinsurance expense 7,901,040 6,232,810 7,901,040 6,232,810
26 Fees and commission income
In thousands of naira Dec-20 Dec-19 Dec-20 Dec-19
Insurance contract 1,556,537 1,433,827 1,556,537 1,433,827
Pension and other contracts (see note (a) below) 406,077 434,013 - -
1,962,615 1,867,840 1,556,537 1,433,827
(a)
27 (a) Gross benefits and claims incurred
In thousands of naira Dec-20 Dec-19 Dec-20 Dec-19
Claims paid during the year (note 18(ai)) 36,285,521 29,699,587 35,867,444 29,256,018
Change in outstanding claims 2,725,125 850,139 2,698,308 836,641
Change in incurred but not reported 735,865 58,877 735,865 58,877
39,746,511 30,608,604 39,301,617 30,151,536
In thousands of naira Dec-20 Dec-19 Dec-20 Dec-19
Life insurance contracts (see note (i) below) 27,999,313 23,008,014 27,554,419 22,550,944
Non-life insurance contracts (see note (ii) below) 11,747,198 7,600,590 11,747,198 7,600,591
39,746,511 30,608,604 39,301,617 30,151,535
(i) Life insurance contract gross benefits and claims incurred can be analysed as follows:
In thousands of naira Dec-20 Dec-19 Dec-20 Dec-19
Gross benefits 17,900,687 14,461,693 17,900,687 14,461,693
Gross claims 9,570,544 8,543,726 9,125,650 8,086,656
Change in outstanding claims reserve 528,082 2,595 528,082 2,595
27,999,313 23,008,014 27,554,419 22,550,944
(ii) Non-life insurance contract gross claims Incurred
In thousands of naira Dec-20 Dec-19 Dec-20 Dec-19
Gross claims incurred 11,311,452 7,394,016 11,311,452 7,394,016
435,746 206,574 435,746 206,575
11,747,198 7,600,590 11,747,199 7,600,591
Dec-20 Dec-19 Dec-20 Dec-19
(b) Claim recoveries
Claims recovered from reinsurance 6,547,360 4,567,924 9,632,236 5,888,068
Changes in outstanding claims 1,542,438 660,072 (1,542,438) (660,072)
8,089,798 5,227,996 8,089,798 5,227,996
(i) Claims recoveries can be futher analysed as follows:
Life 308,359 923,519 308,359 923,519
Non-life (see note (ii) below) 7,781,439 4,304,477 7,781,439 4,304,477
8,089,798 5,227,996 8,089,798 5,227,996
(ii) Non-life business claims recoveries can be analysed as follows:
Recoveries - reinsurance 7,653,428 4,167,574 7,653,428 4,167,574
Recoveries - salvage 128,011 136,903 128,011 136,903
7,781,439 4,304,477 7,781,439 4,304,477
Company
Company
Company
Group
Group
Group
Group
Group
Group
Pension and other other contracts relate to fee and income earned on pension fund and asset management by the subsidiary companies.
Company
Company
Company
Changes in outstanding claims reserve
Company
Group
Group Company
69
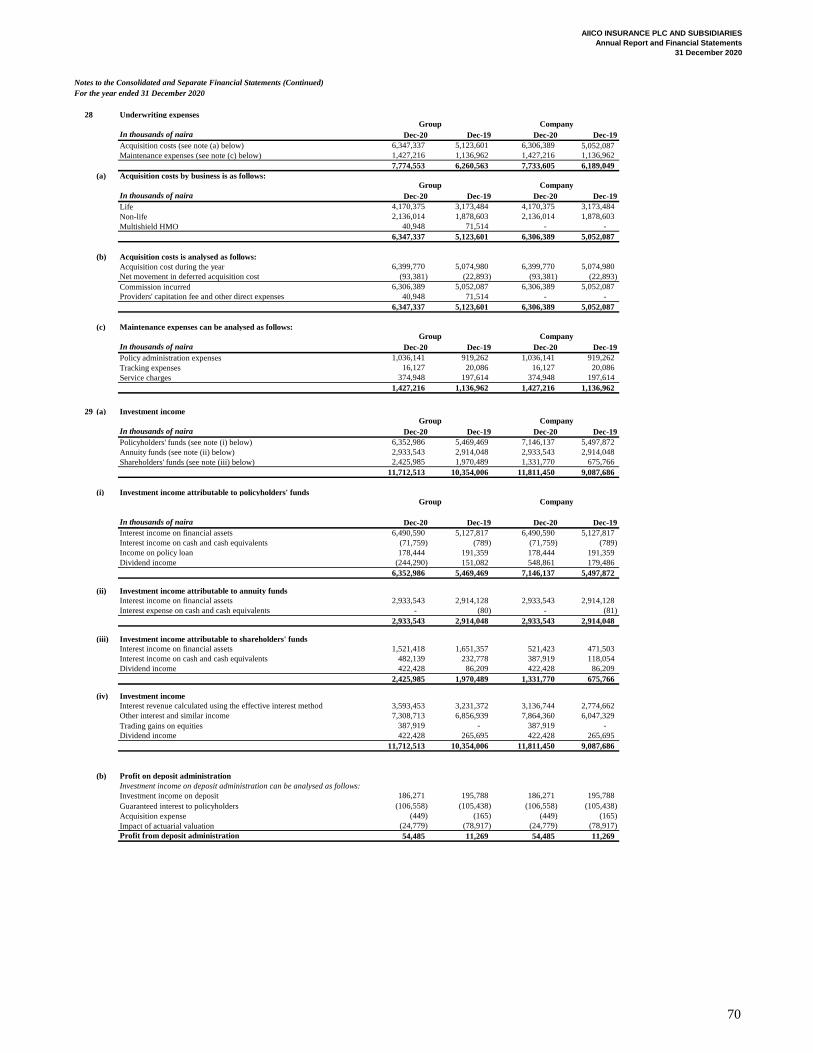
AIICO INSURANCE PLC AND SUBSIDIARIES
Annual Report and Financial Statements
31 December 2020
Notes to the Consolidated and Separate Financial Statements (Continued)
For the year ended 31 December 2020
28 Underwriting expenses
In thousands of naira Dec-20 Dec-19 Dec-20 Dec-19
Acquisition costs (see note (a) below) 6,347,337 5,123,601 6,306,389 5,052,087
Maintenance expenses (see note (c) below) 1,427,216 1,136,962 1,427,216 1,136,962
7,774,553 6,260,563 7,733,605 6,189,049
(a) Acquisition costs by business is as follows:
In thousands of naira Dec-20 Dec-19 Dec-20 Dec-19
Life 4,170,375 3,173,484 4,170,375 3,173,484
Non-life 2,136,014 1,878,603 2,136,014 1,878,603
Multishield HMO 40,948 71,514 - -
6,347,337 5,123,601 6,306,389 5,052,087
(b) Acquisition costs is analysed as follows:
Acquisition cost during the year 6,399,770 5,074,980 6,399,770 5,074,980
Net movement in deferred acquisition cost (93,381) (22,893) (93,381) (22,893)
Commission incurred 6,306,389 5,052,087 6,306,389 5,052,087
Providers' capitation fee and other direct expenses 40,948 71,514 - -
6,347,337 5,123,601 6,306,389 5,052,087
(c) Maintenance expenses can be analysed as follows:
In thousands of naira Dec-20 Dec-19 Dec-20 Dec-19
Policy administration expenses 1,036,141 919,262 1,036,141 919,262
Tracking expenses 16,127 20,086 16,127 20,086
Service charges 374,948 197,614 374,948 197,614
1,427,216 1,136,962 1,427,216 1,136,962
29 (a) Investment income
In thousands of naira Dec-20 Dec-19 Dec-20 Dec-19
Policyholders' funds (see note (i) below) 6,352,986 5,469,469 7,146,137 5,497,872
Annuity funds (see note (ii) below) 2,933,543 2,914,048 2,933,543 2,914,048
Shareholders' funds (see note (iii) below) 2,425,985 1,970,489 1,331,770 675,766
11,712,513 10,354,006 11,811,450 9,087,686
(i) Investment income attributable to policyholders' funds
In thousands of naira Dec-20 Dec-19 Dec-20 Dec-19
Interest income on financial assets 6,490,590 5,127,817 6,490,590 5,127,817
Interest income on cash and cash equivalents (71,759) (789) (71,759) (789)
Income on policy loan 178,444 191,359 178,444 191,359
Dividend income (244,290) 151,082 548,861 179,486
6,352,986 5,469,469 7,146,137 5,497,872
(ii) Investment income attributable to annuity funds
Interest income on financial assets 2,933,543 2,914,128 2,933,543 2,914,128
Interest expense on cash and cash equivalents - (80) - (81)
2,933,543 2,914,048 2,933,543 2,914,048
(iii) Investment income attributable to shareholders' funds
Interest income on financial assets 1,521,418 1,651,357 521,423 471,503
Interest income on cash and cash equivalents 482,139 232,778 387,919 118,054
Dividend income 422,428 86,209 422,428 86,209
2,425,985 1,970,489 1,331,770 675,766
(iv) Investment income
Interest revenue calculated using the effective interest method 3,593,453 3,231,372 3,136,744 2,774,662
Other interest and similar income 7,308,713 6,856,939 7,864,360 6,047,329
Trading gains on equities 387,919 - 387,919 -
Dividend income 422,428 265,695 422,428 265,695
11,712,513 10,354,006 11,811,450 9,087,686
(b) Profit on deposit administration
Investment income on deposit administration can be analysed as follows:
Investment income on deposit 186,271 195,788 186,271 195,788 Other income generated from the fund- - - -
Guaranteed interest to policyholders (106,558) (105,438) (106,558) (105,438)
Acquisition expense (449) (165) (449) (165)
Impact of actuarial valuation (24,779) (78,917) (24,779) (78,917)
Profit from deposit administration 54,485 11,269 54,485 11,269
Company
Company
Group
Group
Group Company
Company
Company
Group
Group
70
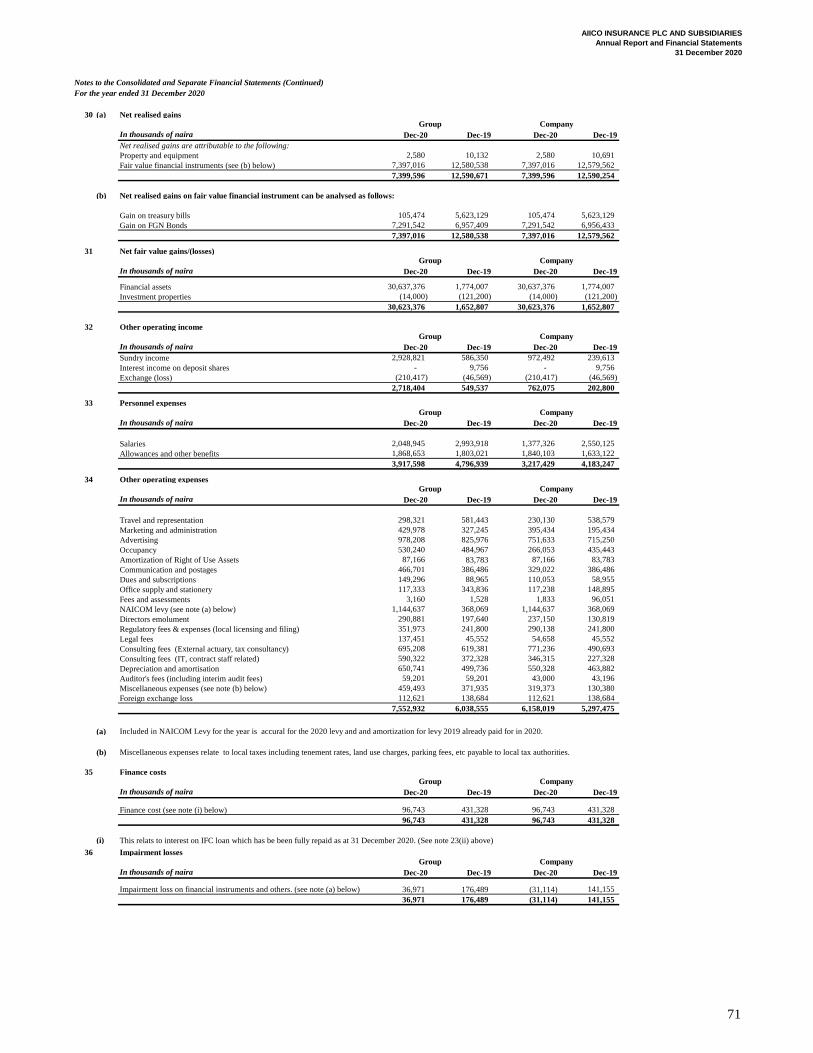
AIICO INSURANCE PLC AND SUBSIDIARIES
Annual Report and Financial Statements
31 December 2020
Notes to the Consolidated and Separate Financial Statements (Continued)
For the year ended 31 December 2020
30 (a) Net realised gains
In thousands of naira Dec-20 Dec-19 Dec-20 Dec-19
Net realised gains are attributable to the following:
Property and equipment 2,580 10,132 2,580 10,691
Fair value financial instruments (see (b) below) 7,397,016 12,580,538 7,397,016 12,579,562
7,399,596 12,590,671 7,399,596 12,590,254
(b) Net realised gains on fair value financial instrument can be analysed as follows:
Gain on treasury bills 105,474 5,623,129 105,474 5,623,129
Gain on FGN Bonds 7,291,542 6,957,409 7,291,542 6,956,433
7,397,016 12,580,538 7,397,016 12,579,562
31 Net fair value gains/(losses)
In thousands of naira Dec-20 Dec-19 Dec-20 Dec-19
Financial assets 30,637,376 1,774,007 30,637,376 1,774,007
Investment properties (14,000) (121,200) (14,000) (121,200)
30,623,376 1,652,807 30,623,376 1,652,807
32 Other operating income
In thousands of naira Dec-20 Dec-19 Dec-20 Dec-19
Sundry income 2,928,821 586,350 972,492 239,613
Interest income on deposit shares - 9,756 - 9,756
Exchange (loss) (210,417) (46,569) (210,417) (46,569)
2,718,404 549,537 762,075 202,800
33 Personnel expenses
In thousands of naira Dec-20 Dec-19 Dec-20 Dec-19
Salaries 2,048,945 2,993,918 1,377,326 2,550,125
Allowances and other benefits 1,868,653 1,803,021 1,840,103 1,633,122
3,917,598 4,796,939 3,217,429 4,183,247
34 Other operating expenses
In thousands of naira Dec-20 Dec-19 Dec-20 Dec-19
Travel and representation 298,321 581,443 230,130 538,579
Marketing and administration 429,978 327,245 395,434 195,434
Advertising 978,208 825,976 751,633 715,250
Occupancy 530,240 484,967 266,053 435,443
Amortization of Right of Use Assets 87,166 83,783 87,166 83,783
Communication and postages 466,701 386,486 329,022 386,486
Dues and subscriptions 149,296 88,965 110,053 58,955
Office supply and stationery 117,333 343,836 117,238 148,895
Fees and assessments 3,160 1,528 1,833 96,051
NAICOM levy (see note (a) below) 1,144,637 368,069 1,144,637 368,069
Directors emolument 290,881 197,640 237,150 130,819
Regulatory fees & expenses (local licensing and filing) 351,973 241,800 290,138 241,800
Legal fees 137,451 45,552 54,658 45,552
Consulting fees (External actuary, tax consultancy) 695,208 619,381 771,236 490,693
Consulting fees (IT, contract staff related) 590,322 372,328 346,315 227,328
Depreciation and amortisation 650,741 499,736 550,328 463,882
Auditor's fees (including interim audit fees) 59,201 59,201 43,000 43,196
Miscellaneous expenses (see note (b) below) 459,493 371,935 319,373 130,380
Foreign exchange loss 112,621 138,684 112,621 138,684
7,552,932 6,038,555 6,158,019 5,297,475
(a)
(b)
35 Finance costs
In thousands of naira Dec-20 Dec-19 Dec-20 Dec-19
Finance cost (see note (i) below) 96,743 431,328 96,743 431,328
96,743 431,328 96,743 431,328
(i)
36 Impairment losses
In thousands of naira Dec-20 Dec-19 Dec-20 Dec-19
36,971 176,489 (31,114) 141,155
36,971 176,489 (31,114) 141,155
Group
Group
Impairment loss on financial instruments and others. (see note (a) below)
Miscellaneous expenses relate to local taxes including tenement rates, land use charges, parking fees, etc payable to local tax authorities.
Group
Group
CompanyGroup
Company
Company
Company
Company
Company
Group
This relats to interest on IFC loan which has be been fully repaid as at 31 December 2020. (See note 23(ii) above)
Group Company
Included in NAICOM Levy for the year is accural for the 2020 levy and and amortization for levy 2019 already paid for in 2020.
71
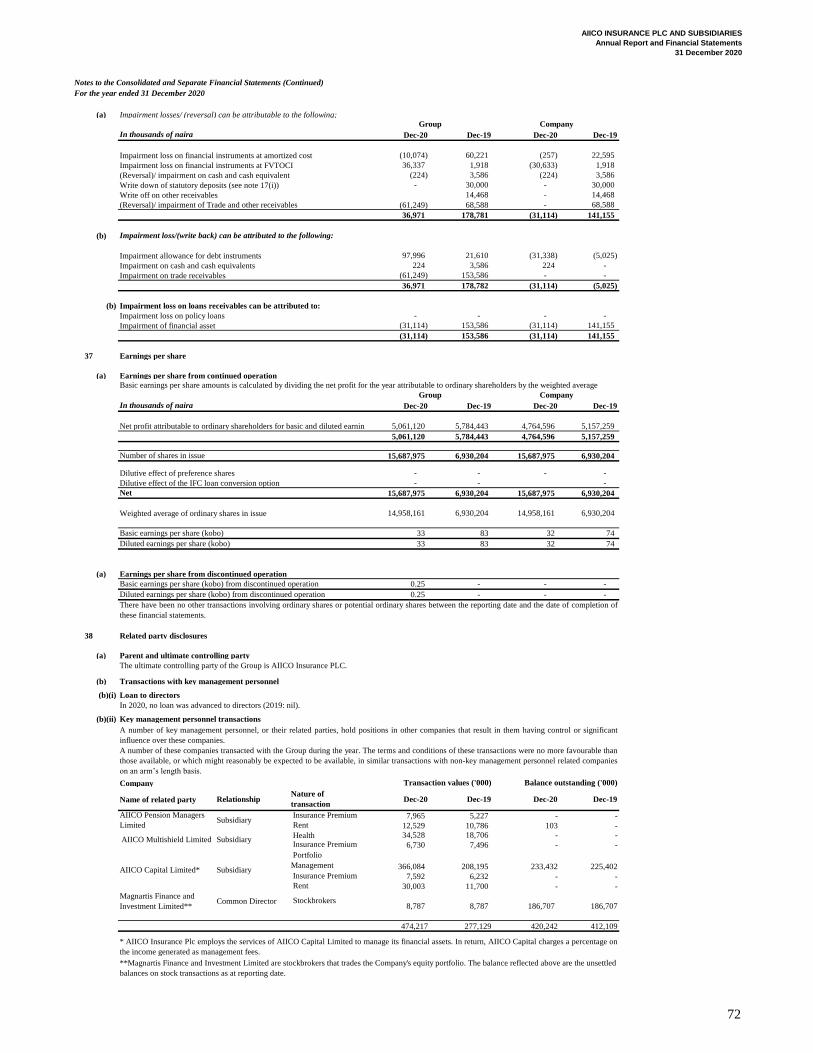
AIICO INSURANCE PLC AND SUBSIDIARIES
Annual Report and Financial Statements
31 December 2020
Notes to the Consolidated and Separate Financial Statements (Continued)
For the year ended 31 December 2020
(a) Impairment losses/ (reversal) can be attributable to the following;
In thousands of naira Dec-20 Dec-19 Dec-20 Dec-19
Impairment loss on financial instruments at amortized cost (10,074) 60,221 (257) 22,595
Impairment loss on financial instruments at FVTOCI 36,337 1,918 (30,633) 1,918
(Reversal)/ impairment on cash and cash equivalent (224) 3,586 (224) 3,586
Write down of statutory deposits (see note 17(i)) - 30,000 - 30,000
Write off on other receivables 14,468 - 14,468
(61,249) 68,588 - 68,588
36,971 178,781 (31,114) 141,155
(b) Impairment loss/(write back) can be attributed to the following:
Impairment allowance for debt instruments 97,996 21,610 (31,338) (5,025)
Impairment on cash and cash equivalents 224 3,586 224 -
Impairment on trade receivables (61,249) 153,586 - -
36,971 178,782 (31,114) (5,025)
(b) Impairment loss on loans receivables can be attributed to:
Impairment loss on policy loans - - - -
Impairment of financial asset (31,114) 153,586 (31,114) 141,155
(31,114) 153,586 (31,114) 141,155
37 Earnings per share
(a) Earnings per share from continued operation
In thousands of naira Dec-20 Dec-19 Dec-20 Dec-19
Net profit attributable to ordinary shareholders for basic and diluted earnings 5,061,120 5,784,443 4,764,596 5,157,259
5,061,120 5,784,443 4,764,596 5,157,259
Number of shares in issue 15,687,975 6,930,204 15,687,975 6,930,204
Dilutive effect of preference shares - - - -
Dilutive effect of the IFC loan conversion option - - -
Net 15,687,975 6,930,204 15,687,975 6,930,204
Weighted average of ordinary shares in issue 14,958,161 6,930,204 14,958,161 6,930,204
Basic earnings per share (kobo) 33 83 32 74
Diluted earnings per share (kobo) 33 83 32 74
(a) Earnings per share from discontinued operation
Basic earnings per share (kobo) from discontinued operation 0.25 - - -
Diluted earnings per share (kobo) from discontinued operation 0.25 - - -
38 Related party disclosures
(a) Parent and ultimate controlling party
The ultimate controlling party of the Group is AIICO Insurance PLC.
(b) Transactions with key management personnel
(b)(i) Loan to directors
(b)(ii) Key management personnel transactions
Company
Name of related party Relationship Dec-20 Dec-19 Dec-20 Dec-19
7,965 5,227 - -
12,529 10,786 103 -
Health 34,528 18,706 - -
6,730 7,496 - -
366,084 208,195 233,432 225,402
7,592 6,232 - -
30,003 11,700 - -
Magnartis Finance and
Investment Limited**Common Director
8,787 8,787 186,707 186,707
474,217 277,129 420,242 412,109
Group Company
There have been no other transactions involving ordinary shares or potential ordinary shares between the reporting date and the date of completion of
these financial statements.
A number of key management personnel, or their related parties, hold positions in other companies that result in them having control or significant
influence over these companies.
A number of these companies transacted with the Group during the year. The terms and conditions of these transactions were no more favourable than
those available, or which might reasonably be expected to be available, in similar transactions with non-key management personnel related companies
on an arm’s length basis.
Insurance Premium
AIICO Capital Limited* Subsidiary Insurance Premium
Rent
Group
AIICO Multishield Limited Subsidiary
**Magnartis Finance and Investment Limited are stockbrokers that trades the Company's equity portfolio. The balance reflected above are the unsettled
balances on stock transactions as at reporting date.
Portfolio
Management
Company
In 2020, no loan was advanced to directors (2019: nil).
(Reversal)/ impairment of Trade and other receivables
Subsidiary Rent
Transaction values ('000) Balance outstanding ('000)
Stockbrokers
* AIICO Insurance Plc employs the services of AIICO Capital Limited to manage its financial assets. In return, AIICO Capital charges a percentage on
the income generated as management fees.
Basic earnings per share amounts is calculated by dividing the net profit for the year attributable to ordinary shareholders by the weighted average
AIICO Pension Managers
Limited
Insurance Premium
Nature of
transaction
72
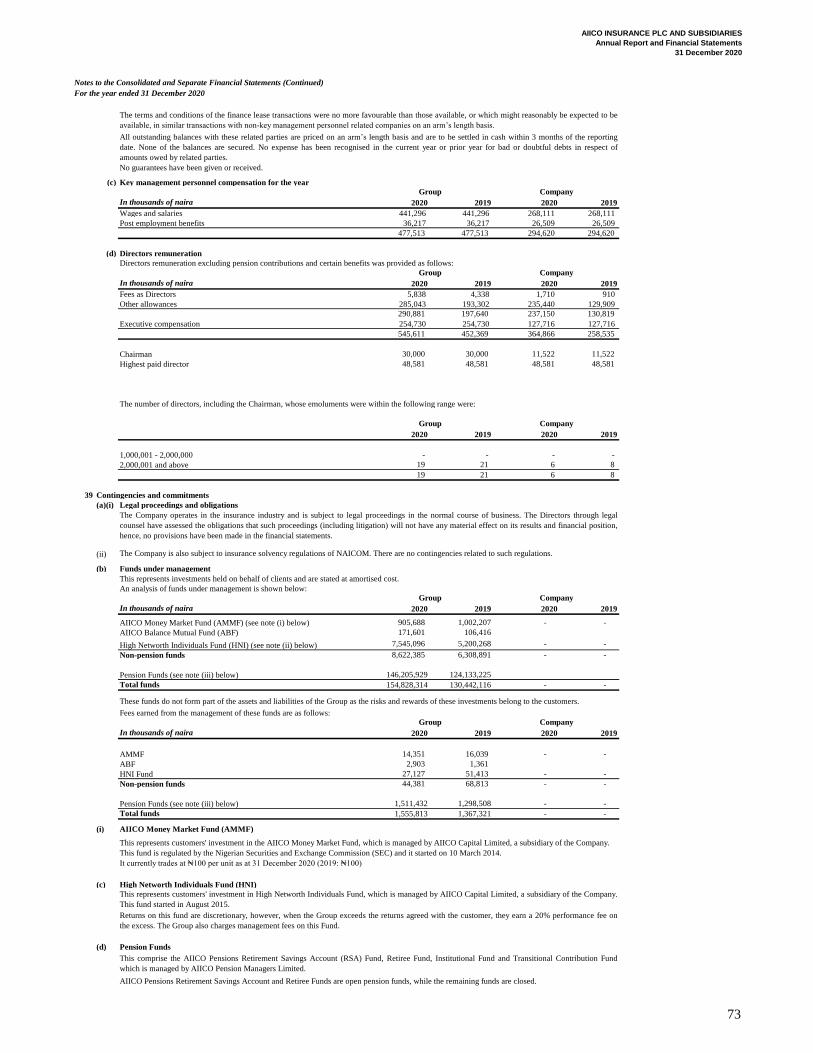
AIICO INSURANCE PLC AND SUBSIDIARIES
Annual Report and Financial Statements
31 December 2020
Notes to the Consolidated and Separate Financial Statements (Continued)
For the year ended 31 December 2020
(c) Key management personnel compensation for the year
In thousands of naira 2020 2019 2020 2019
Wages and salaries 441,296 441,296 268,111 268,111
Post employment benefits 36,217 36,217 26,509 26,509
477,513 477,513 294,620 294,620
(d) Directors remuneration
Directors remuneration excluding pension contributions and certain benefits was provided as follows:
In thousands of naira 2020 2019 2020 2019
Fees as Directors 5,838 4,338 1,710 910
Other allowances 285,043 193,302 235,440 129,909
290,881 197,640 237,150 130,819
Executive compensation 254,730 254,730 127,716 127,716
545,611 452,369 364,866 258,535
Chairman 30,000 30,000 11,522 11,522
Highest paid director 48,581 48,581 48,581 48,581
2020 2019 2020 2019
1,000,001 - 2,000,000 - - - -
2,000,001 and above 19 21 6 8
19 21 6 8
39 Contingencies and commitments
(a)(i) Legal proceedings and obligations
(ii)
(b) Funds under management
This represents investments held on behalf of clients and are stated at amortised cost.
An analysis of funds under management is shown below:
In thousands of naira 2020 2019 2020 2019
AIICO Money Market Fund (AMMF) (see note (i) below) 905,688 1,002,207 - -
AIICO Balance Mutual Fund (ABF) 171,601 106,416
High Networth Individuals Fund (HNI) (see note (ii) below) 7,545,096 5,200,268 - -
Non-pension funds 8,622,385 6,308,891 - -
Pension Funds (see note (iii) below) 146,205,929 124,133,225
Total funds 154,828,314 130,442,116 - -
Fees earned from the management of these funds are as follows:
In thousands of naira 2020 2019 2020 2019
AMMF 14,351 16,039 - -
ABF 2,903 1,361
HNI Fund 27,127 51,413 - -
Non-pension funds 44,381 68,813 - -
Pension Funds (see note (iii) below) 1,511,432 1,298,508 - -
Total funds 1,555,813 1,367,321 - -
(i) AIICO Money Market Fund (AMMF)
(c) High Networth Individuals Fund (HNI)
(d) Pension Funds
AIICO Pensions Retirement Savings Account and Retiree Funds are open pension funds, while the remaining funds are closed.
The terms and conditions of the finance lease transactions were no more favourable than those available, or which might reasonably be expected to be
available, in similar transactions with non-key management personnel related companies on an arm’s length basis.
Group
Group Company
The number of directors, including the Chairman, whose emoluments were within the following range were:
Company
This comprise the AIICO Pensions Retirement Savings Account (RSA) Fund, Retiree Fund, Institutional Fund and Transitional Contribution Fund
which is managed by AIICO Pension Managers Limited.
All outstanding balances with these related parties are priced on an arm’s length basis and are to be settled in cash within 3 months of the reporting
date. None of the balances are secured. No expense has been recognised in the current year or prior year for bad or doubtful debts in respect of
amounts owed by related parties.
No guarantees have been given or received.
Group Company
This represents customers' investment in High Networth Individuals Fund, which is managed by AIICO Capital Limited, a subsidiary of the Company.
This fund started in August 2015.
Company
Company
The Company operates in the insurance industry and is subject to legal proceedings in the normal course of business. The Directors through legal
counsel have assessed the obligations that such proceedings (including litigation) will not have any material effect on its results and financial position,
hence, no provisions have been made in the financial statements.
The Company is also subject to insurance solvency regulations of NAICOM. There are no contingencies related to such regulations.
This represents customers' investment in the AIICO Money Market Fund, which is managed by AIICO Capital Limited, a subsidiary of the Company.
This fund is regulated by the Nigerian Securities and Exchange Commission (SEC) and it started on 10 March 2014.
It currently trades at ₦100 per unit as at 31 December 2020 (2019: ₦100)
Returns on this fund are discretionary, however, when the Group exceeds the returns agreed with the customer, they earn a 20% performance fee on
the excess. The Group also charges management fees on this Fund.
These funds do not form part of the assets and liabilities of the Group as the risks and rewards of these investments belong to the customers.
Group
Group
73
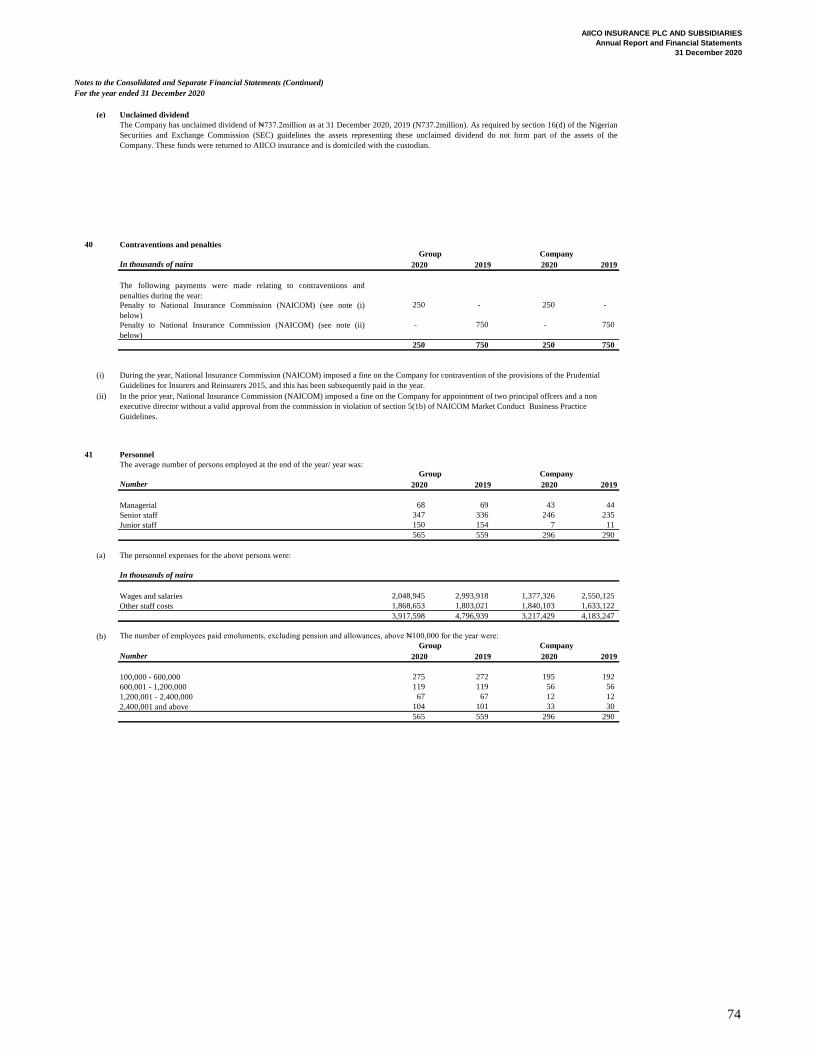
AIICO INSURANCE PLC AND SUBSIDIARIES
Annual Report and Financial Statements
31 December 2020
Notes to the Consolidated and Separate Financial Statements (Continued)
For the year ended 31 December 2020
(e) Unclaimed dividend
40 Contraventions and penalties
In thousands of naira 2020 2019 2020 2019
250 - 250 -
- 750 - 750
250 750 250 750
(i)
(ii)
41 Personnel
The average number of persons employed at the end of the year/ year was:
Number 2020 2019 2020 2019
Managerial 68 69 43 44
Senior staff 347 336 246 235
Junior staff 150 154 7 11
565 559 296 290
(a) The personnel expenses for the above persons were:
In thousands of naira
Wages and salaries 2,048,945 2,993,918 1,377,326 2,550,125
Other staff costs 1,868,653 1,803,021 1,840,103 1,633,122
3,917,598 4,796,939 3,217,429 4,183,247
(b)
Number 2020 2019 2020 2019
100,000 - 600,000 275 272 195 192
600,001 - 1,200,000 119 119 56 56
1,200,001 - 2,400,000 67 67 12 12
2,400,001 and above 104 101 33 30
565 559 296 290
The Company has unclaimed dividend of ₦737.2million as at 31 December 2020, 2019 (N737.2million). As required by section 16(d) of the Nigerian
Securities and Exchange Commission (SEC) guidelines the assets representing these unclaimed dividend do not form part of the assets of the
Company. These funds were returned to AIICO insurance and is domiciled with the custodian.
Group
Penalty to National Insurance Commission (NAICOM) (see note (ii)
below)
Group
The number of employees paid emoluments, excluding pension and allowances, above ₦100,000 for the year were:
Company
Company
In the prior year, National Insurance Commission (NAICOM) imposed a fine on the Company for appointment of two principal offcers and a non
executive director without a valid approval from the commission in violation of section 5(1b) of NAICOM Market Conduct Business Practice
Guidelines.
CompanyGroup
During the year, National Insurance Commission (NAICOM) imposed a fine on the Company for contravention of the provisions of the Prudential
Guidelines for Insurers and Reinsurers 2015, and this has been subsequently paid in the year.
The following payments were made relating to contraventions and
penalties during the year:
Penalty to National Insurance Commission (NAICOM) (see note (i)
below)
74
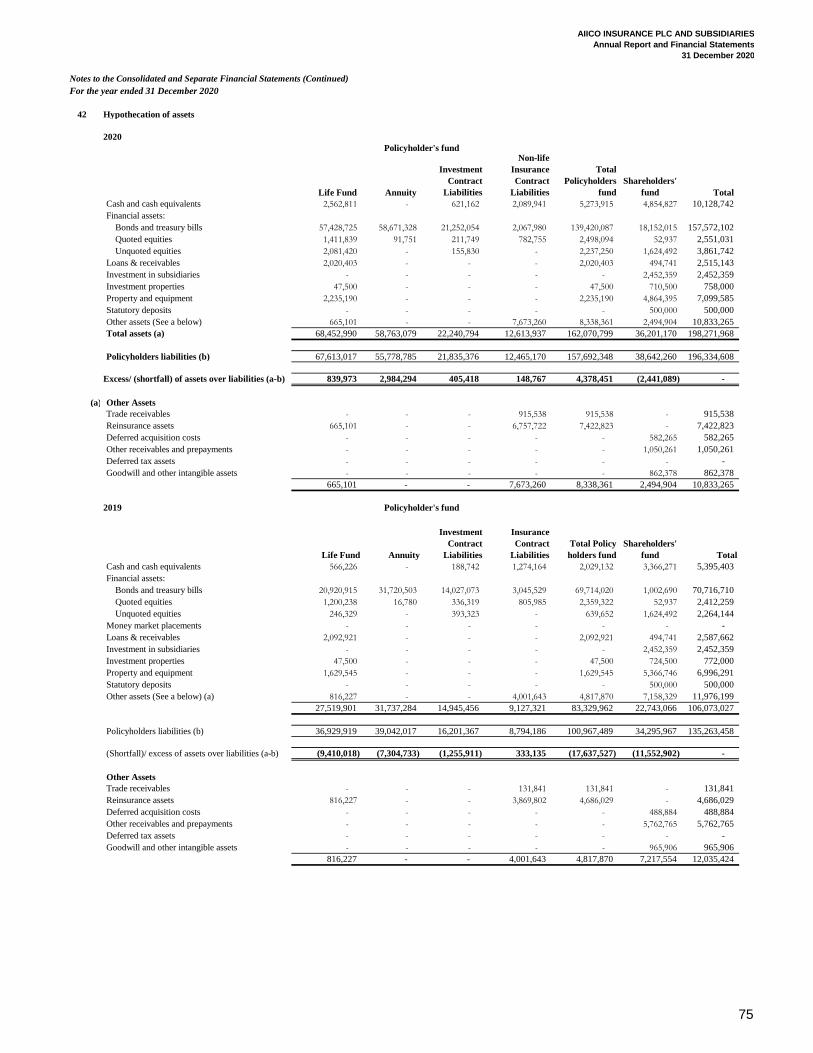
AIICO INSURANCE PLC AND SUBSIDIARIES
Annual Report and Financial Statements
31 December 2020
Notes to the Consolidated and Separate Financial Statements (Continued)
For the year ended 31 December 2020
42 Hypothecation of assets
2020
Life Fund Annuity
Investment
Contract
Liabilities
Non-life
Insurance
Contract
Liabilities
Total
Policyholders
fund
Shareholders'
fund Total
Cash and cash equivalents 2,562,811 - 621,162 2,089,941 5,273,915 4,854,827 10,128,742
Financial assets:
Bonds and treasury bills 57,428,725 58,671,328 21,252,054 2,067,980 139,420,087 18,152,015 157,572,102
Quoted equities 1,411,839 91,751 211,749 782,755 2,498,094 52,937 2,551,031
Unquoted equities 2,081,420 - 155,830 - 2,237,250 1,624,492 3,861,742
Loans & receivables 2,020,403 - - - 2,020,403 494,741 2,515,143
Investment in subsidiaries - - - - - 2,452,359 2,452,359
Investment properties 47,500 - - - 47,500 710,500 758,000
Property and equipment 2,235,190 - - - 2,235,190 4,864,395 7,099,585
Statutory deposits - - - - - 500,000 500,000
Other assets (See a below) 665,101 - - 7,673,260 8,338,361 2,494,904 10,833,265
Total assets (a) 68,452,990 58,763,079 22,240,794 12,613,937 162,070,799 36,201,170 198,271,968
Policyholders liabilities (b) 67,613,017 55,778,785 21,835,376 12,465,170 157,692,348 38,642,260 196,334,608
Excess/ (shortfall) of assets over liabilities (a-b) 839,973 2,984,294 405,418 148,767 4,378,451 (2,441,089) -
(a) Other Assets
Trade receivables - - - 915,538 915,538 - 915,538
Reinsurance assets 665,101 - - 6,757,722 7,422,823 - 7,422,823
Deferred acquisition costs - - - - - 582,265 582,265
Other receivables and prepayments - - - - - 1,050,261 1,050,261
Deferred tax assets - - - - - - -
Goodwill and other intangible assets - - - - - 862,378 862,378
665,101 - - 7,673,260 8,338,361 2,494,904 10,833,265
2019
Life Fund Annuity
Investment
Contract
Liabilities
Insurance
Contract
Liabilities
Total Policy
holders fund
Shareholders'
fund Total
Cash and cash equivalents 566,226 - 188,742 1,274,164 2,029,132 3,366,271 5,395,403
Financial assets:
Bonds and treasury bills 20,920,915 31,720,503 14,027,073 3,045,529 69,714,020 1,002,690 70,716,710
Quoted equities 1,200,238 16,780 336,319 805,985 2,359,322 52,937 2,412,259
Unquoted equities 246,329 - 393,323 - 639,652 1,624,492 2,264,144
Money market placements - - - - - - -
Loans & receivables 2,092,921 - - - 2,092,921 494,741 2,587,662
Investment in subsidiaries - - - - - 2,452,359 2,452,359
Investment properties 47,500 - - - 47,500 724,500 772,000
Property and equipment 1,629,545 - - - 1,629,545 5,366,746 6,996,291
Statutory deposits - - - - - 500,000 500,000
Other assets (See a below) (a) 816,227 - - 4,001,643 4,817,870 7,158,329 11,976,199
27,519,901 31,737,284 14,945,456 9,127,321 83,329,962 22,743,066 106,073,027
Policyholders liabilities (b) 36,929,919 39,042,017 16,201,367 8,794,186 100,967,489 34,295,967 135,263,458
(Shortfall)/ excess of assets over liabilities (a-b) (9,410,018) (7,304,733) (1,255,911) 333,135 (17,637,527) (11,552,902) -
Other Assets
Trade receivables - - - 131,841 131,841 - 131,841
Reinsurance assets 816,227 - - 3,869,802 4,686,029 - 4,686,029
Deferred acquisition costs - - - - - 488,884 488,884
Other receivables and prepayments - - - - - 5,762,765 5,762,765
Deferred tax assets - - - - - - -
Goodwill and other intangible assets - - - - - 965,906 965,906
816,227 - - 4,001,643 4,817,870 7,217,554 12,035,424
Policyholder's fund
Policyholder's fund
75
AIICO INSURANCE PLC AND SUBSIDIARIES
Annual Report and Financial Statements
31 December 2020
Notes to the Consolidated and Separate Financial Statements (Continued)
For the year ended 31 December 2020
43 Disclosure on the impact of COVID 19
Impact of the pandemic on the business
The Company assessed the financial and capital impact on its business across its Life and Non-Life businesses with varying scenarios
ranging from two-month year to a six-month of lockdown. We have assessed the impact of COVID-19 on the Company’s operations, cash
flow, liquidity, capital resources, strategic and brand as well as risks and uncertainties about the impact on future years. The outcome of the
assessment does not suggest any significant adverse impact on the Company’s survival and sustainability. Our core businesses, however,
were affected as the pandemic hindered business development, disrupted plans for effective product mix, with consequent impact on our
overall profit position.
Additionally, the general downward movement and volatility in financial market, particularly bond and currency markets have impacted our
investment earnings by increasing the fair value gains on our investment portfolios with a corresponding increase in the fair valuation of our
actuarial liabilities, while reducing the interest income attainable on our new investments. These developments have also necessitated a
review of our projected earnings/Budget for FY2020 to reflect current market realities.
Within our Corporate Business unit, there was also considerable impact on the Oil and Gas product lines as oil prices crashed due to lower
expected demand and a potential flooding of supply. Locally, this led to a stall in several major energy projects and streamline of larger sized
energy projects. New business was constrained by movement restrictions, which affected the team’s ability to carry out on-site risk
inspections and evaluations.
To effectively navigate these challenges brought about by COVID -19, we will continue to work closely with our agents and brokers to
define and deliver unique, simplified, cost-effective value propositions to our teeming customers across markets. We are also prioritising the
adoption of digital tools and new tech to adequately surmount the constraints imposed on offline sales by COVID -19.
The World Health Organization (WHO), following the widespread of the virus over the globe declared the coronavirus (COVID-19) a global
pandemic. The spread and its impact has generated a degree of uncertainty and anxiety, as governments and health experts attempt to curtail
the proliferation of the virus. Consequently, the Company has put in place measures to mitigate the risk on its operations and services to its
stakeholders.
Prior to the advent of COVID-19, the Company has consistently tested and evaluated its Business Continuity Management System (BCMS)
with the support and guidance of the British Standard Institutions (BSI), having granted the Company certification of the system under ISO
22301 standard since 2012. The BSI conducts annual and three-year continuous assessment visit and recertification audit respectively of the
ISO 22301 standard certification maintenance.
At the advent of the pandemic and upon the continued COVID-19 scourge, in order to manage its impact on the business operations, the
Company adapted and evoked the BCMS to proactively manage, the possible impact of the COVID -19 incident on the Company’s business
continuity. Within this framework, the Company swiftly reviewed its organizational–wide and departmental COVID 19 Incident
Management Plan (IMP) and Business Continuity Plan (BCPs) respectively , which details a systematic approach to responding to and
managing exigencies that may bring about business interruptions or cause a complete or partial system shut down.
In line with Nigeria and the World Health Organization (WHO) protocols, the Company rolled out precautionary measures to protect our
employees, customers and other stakeholders as well as ensure business operations continued with minimal interruption. These include:
• Enforced basic infection prevention measures, as advised by the World Health Organization (WHO) and government agencies.
• Continuous employees enlightenment and education on COVID-19 precautionary measures
• Communication with customers and partners (brokers, agents, etc.) on the continuation of service delivery via e-business solutions.
• Sustained factual and effective communications to stakeholders
• Continuous assessment of the COVID-19 risks. In particular, as it affects employees, workplace facilities, customers, business operations,
and community.
• A continued to monitor compliance to all COVID-19 strategies implemented to forestall any eventualities.
• Establishment of a cross-functional COVID-19 response team that reports to the Incident Management Team, and headed by one of the
Executive Directors.
• Entrenchment of extant remote working strategy. This include including advising employees to temporarily work remotely and providing
required resources for both onsite and offsite employees to facilitate optimal operations and customer satisfaction.
Specifically, our Retail Life business saw a decline in uptake of multiyear and large case size policies across the board. Endowment, travel
and Deferred Annuity product lines, which were positioned for growth at beginning of the year, were particularly impacted by the pandemic.
Key trigger points were a slowed economic environment, increased business uncertainty and job disruption of targeted customers.
Summarily, customers were simply unwilling to commit to longer term, higher premium risk-based policies.
76
AIICO INSURANCE PLC AND SUBSIDIARIES
Annual Report and Financial Statements
31 December 2020
Notes to the Consolidated and Separate Financial Statements (Continued)
For the year ended 31 December 2020
Impact of the pandemic on the business (Cont'd)
44 Securities trading policy
To effectively navigate these challenges brought about by COVID -19, we will be working closely with our agents and brokers to define and
deliver unique, simplified, cost-effective value propositions to our teeming customers across markets. We are also prioritising the adoption of
digital tools and new tech to adequately surmount the constraints imposed on offline sales by COVID -19.
In compliance with Rule 17.15 Disclosure of Dealings in Issuers’ Shares, Rulebook of the Exchange 2015 (Issuers Rule) AIICO
Insurance Plc maintains a Security Trading Policy which guides Directors, Audit Committee members, employees and all individuals
categorized as insiders as to their dealing in the Company’s shares. The Policy undergoes yearic reviews by the Board and is updated
accordingly. The Company has made specific inquiries of all its directors and other insiders and is not aware of any infringement of the
policy during the year.
As the economy gradually reopens, our strategy will be to propel our performance for enhanced profitability through customer led innovation
and deep market partnerships amongst other business recovery strategies.
As a socially responsible organization, we supported the Federal Government and Lagos State Government in the fight against the pandemic
by providing life insurance to over 5,000 frontline Healthcare workers. In addition, we provided hygiene kits to pregnant women and
established a feeding program, targeted at less privileged in vulnerable communities within Lagos State.
The Company will continue to make adequate mitigations and continuously ensure it proactively manages the impact of COVID-19 on its
corporate existence and objectives. The Company will continue to monitor all the business risks and effectively mitigate these risks as they
unfold. The management of AIICO Insurance PLC remains committed to meeting stakeholders’ interests whilst taking the Company above
and beyond
77
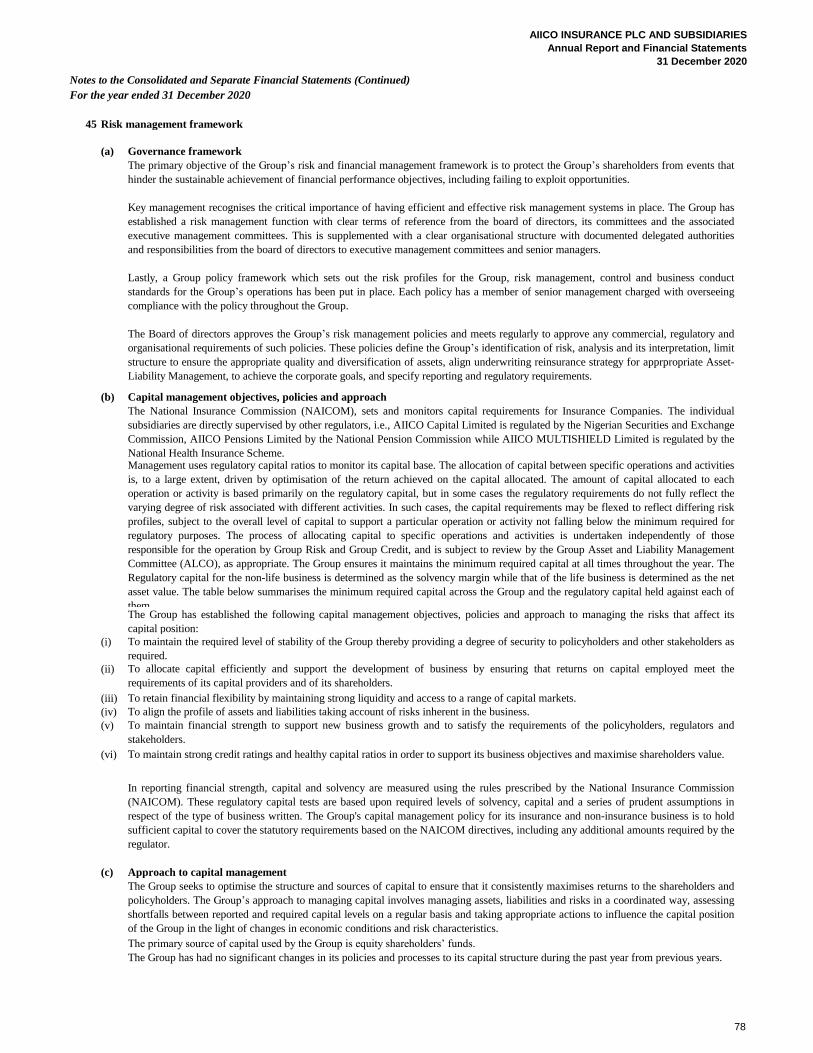
AIICO INSURANCE PLC AND SUBSIDIARIES
Annual Report and Financial Statements
31 December 2020
Notes to the Consolidated and Separate Financial Statements (Continued)
For the year ended 31 December 2020
45 Risk management framework
(a) Governance framework
(b) Capital management objectives, policies and approach
(i)
(ii)
(iii)
(iv)
(v)
(vi)
(c) Approach to capital management
The Group has established the following capital management objectives, policies and approach to managing the risks that affect its
capital position:
The primary objective of the Group’s risk and financial management framework is to protect the Group’s shareholders from events that
hinder the sustainable achievement of financial performance objectives, including failing to exploit opportunities.
Key management recognises the critical importance of having efficient and effective risk management systems in place. The Group has
established a risk management function with clear terms of reference from the board of directors, its committees and the associated
executive management committees. This is supplemented with a clear organisational structure with documented delegated authorities
and responsibilities from the board of directors to executive management committees and senior managers.
Lastly, a Group policy framework which sets out the risk profiles for the Group, risk management, control and business conduct
standards for the Group’s operations has been put in place. Each policy has a member of senior management charged with overseeing
compliance with the policy throughout the Group.
The Board of directors approves the Group’s risk management policies and meets regularly to approve any commercial, regulatory and
organisational requirements of such policies. These policies define the Group’s identification of risk, analysis and its interpretation, limit
structure to ensure the appropriate quality and diversification of assets, align underwriting reinsurance strategy for apprpropriate Asset-
Liability Management, to achieve the corporate goals, and specify reporting and regulatory requirements.
To maintain financial strength to support new business growth and to satisfy the requirements of the policyholders, regulators and
stakeholders.
To maintain strong credit ratings and healthy capital ratios in order to support its business objectives and maximise shareholders value.
In reporting financial strength, capital and solvency are measured using the rules prescribed by the National Insurance Commission
(NAICOM). These regulatory capital tests are based upon required levels of solvency, capital and a series of prudent assumptions in
respect of the type of business written. The Group's capital management policy for its insurance and non-insurance business is to hold
sufficient capital to cover the statutory requirements based on the NAICOM directives, including any additional amounts required by the
regulator.
The Group seeks to optimise the structure and sources of capital to ensure that it consistently maximises returns to the shareholders and
policyholders. The Group’s approach to managing capital involves managing assets, liabilities and risks in a coordinated way, assessing
shortfalls between reported and required capital levels on a regular basis and taking appropriate actions to influence the capital position
of the Group in the light of changes in economic conditions and risk characteristics.
The primary source of capital used by the Group is equity shareholders’ funds.
The Group has had no significant changes in its policies and processes to its capital structure during the past year from previous years.
The National Insurance Commission (NAICOM), sets and monitors capital requirements for Insurance Companies. The individual
subsidiaries are directly supervised by other regulators, i.e., AIICO Capital Limited is regulated by the Nigerian Securities and Exchange
Commission, AIICO Pensions Limited by the National Pension Commission while AIICO MULTISHIELD Limited is regulated by the
National Health Insurance Scheme. Management uses regulatory capital ratios to monitor its capital base. The allocation of capital between specific operations and activities
is, to a large extent, driven by optimisation of the return achieved on the capital allocated. The amount of capital allocated to each
operation or activity is based primarily on the regulatory capital, but in some cases the regulatory requirements do not fully reflect the
varying degree of risk associated with different activities. In such cases, the capital requirements may be flexed to reflect differing risk
profiles, subject to the overall level of capital to support a particular operation or activity not falling below the minimum required for
regulatory purposes. The process of allocating capital to specific operations and activities is undertaken independently of those
responsible for the operation by Group Risk and Group Credit, and is subject to review by the Group Asset and Liability Management
Committee (ALCO), as appropriate. The Group ensures it maintains the minimum required capital at all times throughout the year. The
Regulatory capital for the non-life business is determined as the solvency margin while that of the life business is determined as the net
asset value. The table below summarises the minimum required capital across the Group and the regulatory capital held against each of
them.
To align the profile of assets and liabilities taking account of risks inherent in the business.
To allocate capital efficiently and support the development of business by ensuring that returns on capital employed meet the
requirements of its capital providers and of its shareholders.
To retain financial flexibility by maintaining strong liquidity and access to a range of capital markets.
To maintain the required level of stability of the Group thereby providing a degree of security to policyholders and other stakeholders as
required.
78
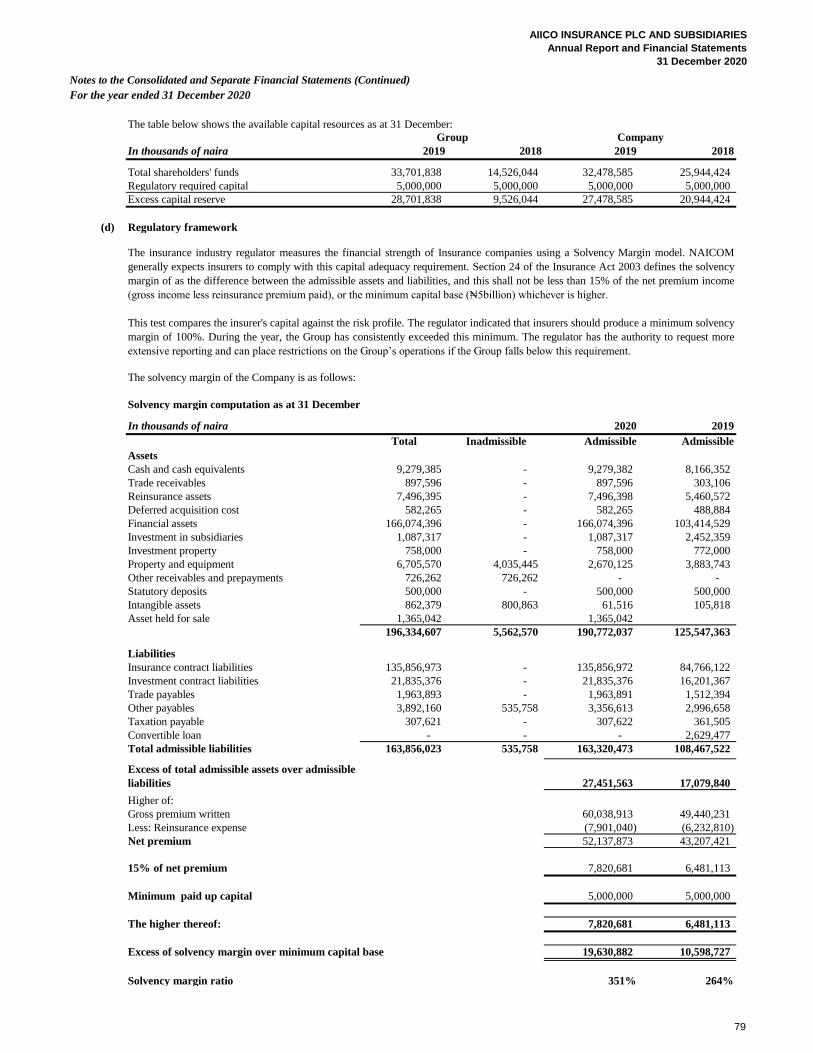
AIICO INSURANCE PLC AND SUBSIDIARIES
Annual Report and Financial Statements
31 December 2020
Notes to the Consolidated and Separate Financial Statements (Continued)
For the year ended 31 December 2020
The table below shows the available capital resources as at 31 December:
In thousands of naira 2019 2018 2019 2018
Total shareholders' funds 33,701,838 14,526,044 32,478,585 25,944,424
Regulatory required capital 5,000,000 5,000,000 5,000,000 5,000,000
Excess capital reserve 28,701,838 9,526,044 27,478,585 20,944,424
(d) Regulatory framework
The solvency margin of the Company is as follows:
Solvency margin computation as at 31 December
In thousands of naira 2020 2019
Total Inadmissible Admissible Admissible
Assets
Cash and cash equivalents 9,279,385 - 9,279,382 8,166,352
Trade receivables 897,596 - 897,596 303,106
Reinsurance assets 7,496,395 - 7,496,398 5,460,572
Deferred acquisition cost 582,265 - 582,265 488,884
Financial assets 166,074,396 - 166,074,396 103,414,529
Investment in subsidiaries 1,087,317 - 1,087,317 2,452,359
Investment property 758,000 - 758,000 772,000
Property and equipment 6,705,570 4,035,445 2,670,125 3,883,743
Other receivables and prepayments 726,262 726,262 - -
Statutory deposits 500,000 - 500,000 500,000
Intangible assets 862,379 800,863 61,516 105,818
Asset held for sale 1,365,042 1,365,042
196,334,607 5,562,570 190,772,037 125,547,363
Liabilities
Insurance contract liabilities 135,856,973 - 135,856,972 84,766,122
Investment contract liabilities 21,835,376 - 21,835,376 16,201,367
Trade payables 1,963,893 - 1,963,891 1,512,394
Other payables 3,892,160 535,758 3,356,613 2,996,658
Taxation payable 307,621 - 307,622 361,505
Convertible loan - - - 2,629,477
Total admissible liabilities 163,856,023 535,758 163,320,473 108,467,522
27,451,563 17,079,840
Higher of:
Gross premium written 60,038,913 49,440,231
Less: Reinsurance expense (7,901,040) (6,232,810)
Net premium 52,137,873 43,207,421
15% of net premium 7,820,681 6,481,113
Minimum paid up capital 5,000,000 5,000,000
The higher thereof: 7,820,681 6,481,113
Excess of solvency margin over minimum capital base 19,630,882 10,598,727
Solvency margin ratio 351% 264%
The insurance industry regulator measures the financial strength of Insurance companies using a Solvency Margin model. NAICOM
generally expects insurers to comply with this capital adequacy requirement. Section 24 of the Insurance Act 2003 defines the solvency
margin of as the difference between the admissible assets and liabilities, and this shall not be less than 15% of the net premium income
(gross income less reinsurance premium paid), or the minimum capital base (₦5billion) whichever is higher.
This test compares the insurer's capital against the risk profile. The regulator indicated that insurers should produce a minimum solvency
margin of 100%. During the year, the Group has consistently exceeded this minimum. The regulator has the authority to request more
extensive reporting and can place restrictions on the Group’s operations if the Group falls below this requirement.
Group Company
Excess of total admissible assets over admissible
liabilities
79
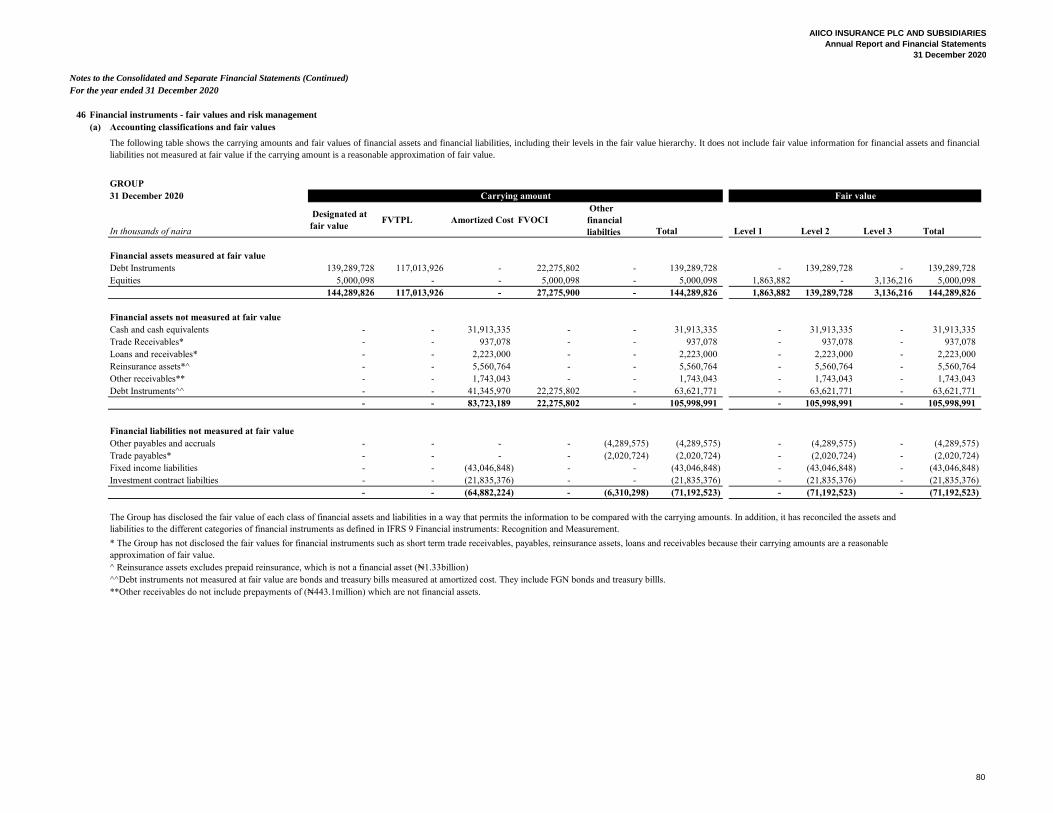
AIICO INSURANCE PLC AND SUBSIDIARIES
Annual Report and Financial Statements
31 December 2020
Notes to the Consolidated and Separate Financial Statements (Continued)
For the year ended 31 December 2020
46 Financial instruments - fair values and risk management
(a) Accounting classifications and fair values
GROUP
31 December 2020
In thousands of naira
Designated at
fair value FVTPL Amortized Cost FVOCI
Other
financial
liabilties Total Level 1 Level 2 Level 3 Total
Financial assets measured at fair value
Debt Instruments 139,289,728 117,013,926 - 22,275,802 - 139,289,728 - 139,289,728 - 139,289,728
Equities 5,000,098 - - 5,000,098 - 5,000,098 1,863,882 - 3,136,216 5,000,098
144,289,826 117,013,926 - 27,275,900 - 144,289,826 1,863,882 139,289,728 3,136,216 144,289,826
Financial assets not measured at fair value
Cash and cash equivalents - - 31,913,335 - - 31,913,335 - 31,913,335 - 31,913,335
Trade Receivables* - - 937,078 - - 937,078 - 937,078 - 937,078
Loans and receivables* - - 2,223,000 - - 2,223,000 - 2,223,000 - 2,223,000
Reinsurance assets*^ - - 5,560,764 - - 5,560,764 - 5,560,764 - 5,560,764
Other receivables** - - 1,743,043 - - 1,743,043 - 1,743,043 - 1,743,043
Debt Instruments^^ - - 41,345,970 22,275,802 - 63,621,771 - 63,621,771 - 63,621,771
- - 83,723,189 22,275,802 - 105,998,991 - 105,998,991 - 105,998,991
Financial liabilities not measured at fair value
Other payables and accruals - - - - (4,289,575) (4,289,575) - (4,289,575) - (4,289,575)
Trade payables* - - - - (2,020,724) (2,020,724) - (2,020,724) - (2,020,724)
Fixed income liabilities - - (43,046,848) - - (43,046,848) - (43,046,848) - (43,046,848)
Investment contract liabilties - - (21,835,376) - - (21,835,376) - (21,835,376) - (21,835,376)
- - (64,882,224) - (6,310,298) (71,192,523) - (71,192,523) - (71,192,523)
**Other receivables do not include prepayments of (₦443.1million) which are not financial assets.
The following table shows the carrying amounts and fair values of financial assets and financial liabilities, including their levels in the fair value hierarchy. It does not include fair value information for financial assets and financial
liabilities not measured at fair value if the carrying amount is a reasonable approximation of fair value.
Carrying amount Fair value
The Group has disclosed the fair value of each class of financial assets and liabilities in a way that permits the information to be compared with the carrying amounts. In addition, it has reconciled the assets and
liabilities to the different categories of financial instruments as defined in IFRS 9 Financial instruments: Recognition and Measurement.
* The Group has not disclosed the fair values for financial instruments such as short term trade receivables, payables, reinsurance assets, loans and receivables because their carrying amounts are a reasonable
approximation of fair value.
^ Reinsurance assets excludes prepaid reinsurance, which is not a financial asset (₦1.33billion)
^^Debt instruments not measured at fair value are bonds and treasury bills measured at amortized cost. They include FGN bonds and treasury billls.
80
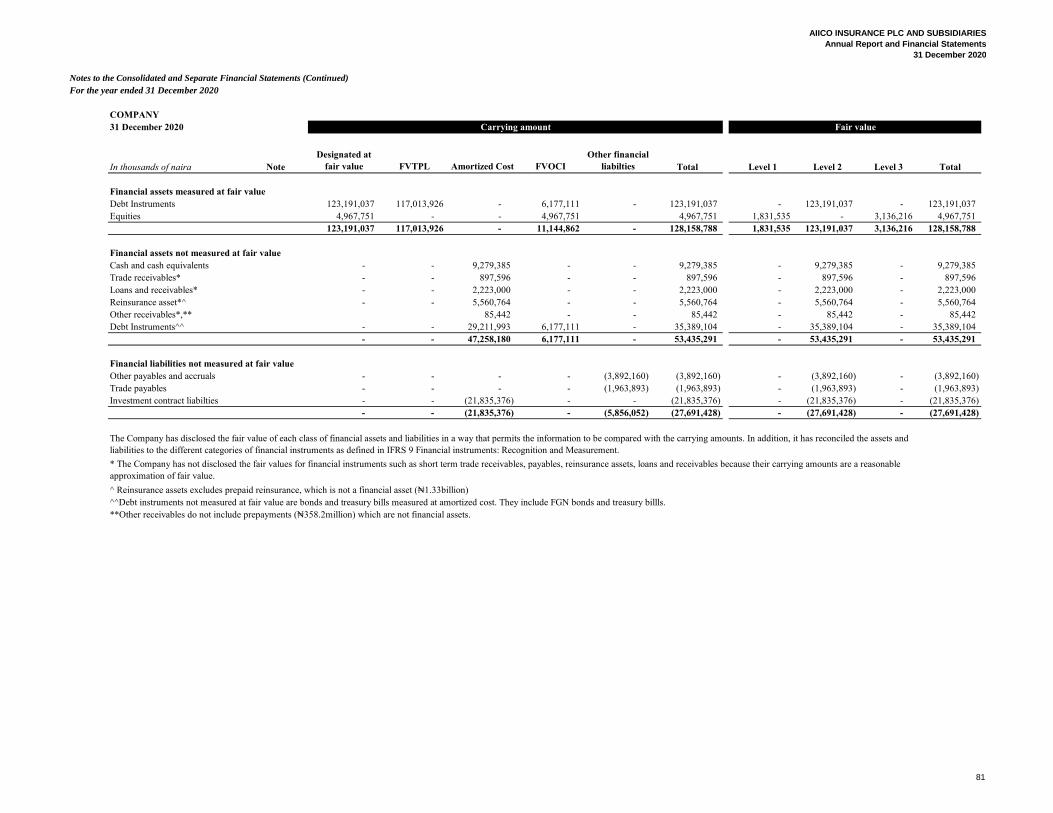
AIICO INSURANCE PLC AND SUBSIDIARIES
Annual Report and Financial Statements
31 December 2020
Notes to the Consolidated and Separate Financial Statements (Continued)
For the year ended 31 December 2020
COMPANY
31 December 2020
In thousands of naira Note
Designated at
fair value FVTPL Amortized Cost FVOCI
Other financial
liabilties Total Level 1 Level 2 Level 3 Total
Financial assets measured at fair value
Debt Instruments 123,191,037 117,013,926 - 6,177,111 - 123,191,037 - 123,191,037 - 123,191,037
Equities 4,967,751 - - 4,967,751 4,967,751 1,831,535 - 3,136,216 4,967,751
123,191,037 117,013,926 - 11,144,862 - 128,158,788 1,831,535 123,191,037 3,136,216 128,158,788
Financial assets not measured at fair value
Cash and cash equivalents - - 9,279,385 - - 9,279,385 - 9,279,385 - 9,279,385
Trade receivables* - - 897,596 - - 897,596 - 897,596 - 897,596
Loans and receivables* - - 2,223,000 - - 2,223,000 - 2,223,000 - 2,223,000
Reinsurance asset*^ - - 5,560,764 - - 5,560,764 - 5,560,764 - 5,560,764
Other receivables*,** 85,442 - - 85,442 - 85,442 - 85,442
Debt Instruments^^ - - 29,211,993 6,177,111 - 35,389,104 - 35,389,104 - 35,389,104
- - 47,258,180 6,177,111 - 53,435,291 - 53,435,291 - 53,435,291
Financial liabilities not measured at fair value
Other payables and accruals - - - - (3,892,160) (3,892,160) - (3,892,160) - (3,892,160)
Trade payables - - - - (1,963,893) (1,963,893) - (1,963,893) - (1,963,893)
Investment contract liabilties - - (21,835,376) - - (21,835,376) - (21,835,376) - (21,835,376)
- - (21,835,376) - (5,856,052) (27,691,428) - (27,691,428) - (27,691,428)
**Other receivables do not include prepayments (₦358.2million) which are not financial assets.
Carrying amount Fair value
The Company has disclosed the fair value of each class of financial assets and liabilities in a way that permits the information to be compared with the carrying amounts. In addition, it has reconciled the assets and
liabilities to the different categories of financial instruments as defined in IFRS 9 Financial instruments: Recognition and Measurement.
* The Company has not disclosed the fair values for financial instruments such as short term trade receivables, payables, reinsurance assets, loans and receivables because their carrying amounts are a reasonable
approximation of fair value.
^ Reinsurance assets excludes prepaid reinsurance, which is not a financial asset (₦1.33billion)
^^Debt instruments not measured at fair value are bonds and treasury bills measured at amortized cost. They include FGN bonds and treasury billls.
81
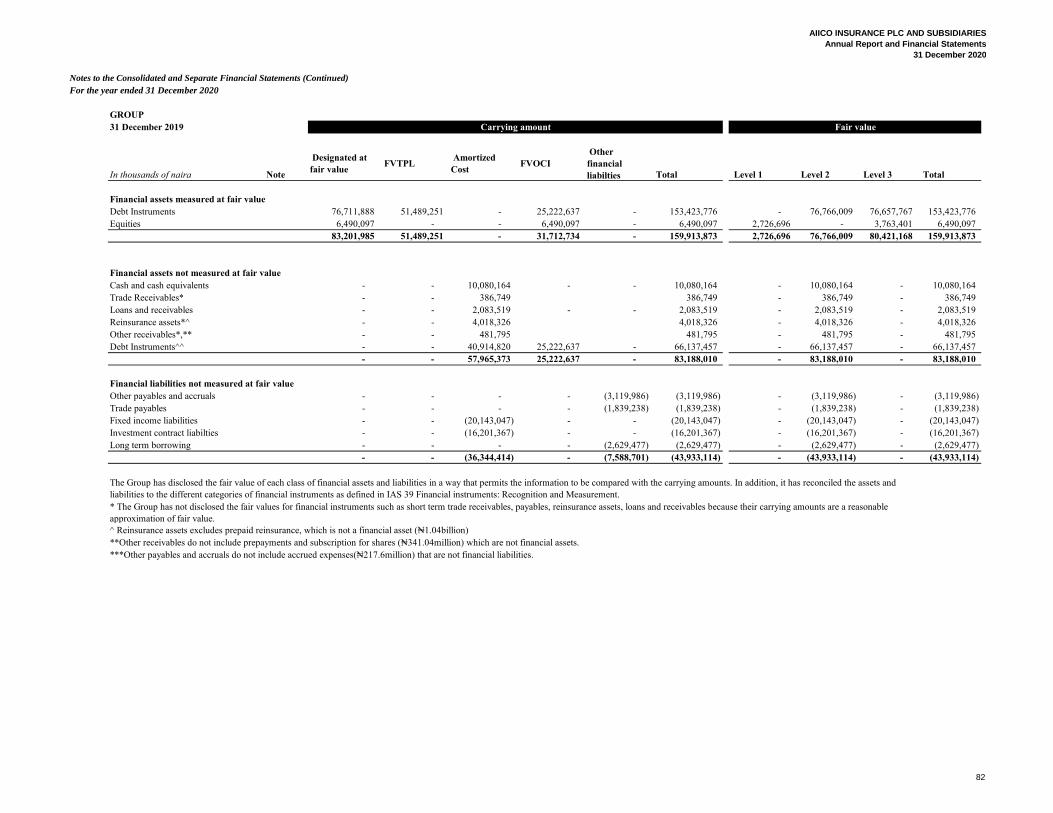
AIICO INSURANCE PLC AND SUBSIDIARIES
Annual Report and Financial Statements
31 December 2020
Notes to the Consolidated and Separate Financial Statements (Continued)
For the year ended 31 December 2020
GROUP
31 December 2019
In thousands of naira Note
Designated at
fair value FVTPL
Amortized
Cost FVOCI
Other
financial
liabilties Total Level 1 Level 2 Level 3 Total
Financial assets measured at fair value
Debt Instruments 76,711,888 51,489,251 - 25,222,637 - 153,423,776 - 76,766,009 76,657,767 153,423,776
Equities 6,490,097 - - 6,490,097 - 6,490,097 2,726,696 - 3,763,401 6,490,097
83,201,985 51,489,251 - 31,712,734 - 159,913,873 2,726,696 76,766,009 80,421,168 159,913,873
Financial assets not measured at fair value
Cash and cash equivalents - - 10,080,164 - - 10,080,164 - 10,080,164 - 10,080,164
Trade Receivables* - - 386,749 386,749 - 386,749 - 386,749
Loans and receivables - - 2,083,519 - - 2,083,519 - 2,083,519 - 2,083,519
Reinsurance assets*^ - - 4,018,326 4,018,326 - 4,018,326 - 4,018,326
Other receivables*,** - - 481,795 481,795 - 481,795 - 481,795
Debt Instruments^^ - - 40,914,820 25,222,637 - 66,137,457 - 66,137,457 - 66,137,457
- - 57,965,373 25,222,637 - 83,188,010 - 83,188,010 - 83,188,010
Financial liabilities not measured at fair value
Other payables and accruals - - - - (3,119,986) (3,119,986) - (3,119,986) - (3,119,986)
Trade payables - - - - (1,839,238) (1,839,238) - (1,839,238) - (1,839,238)
Fixed income liabilities - - (20,143,047) - - (20,143,047) - (20,143,047) - (20,143,047)
Investment contract liabilties - - (16,201,367) - - (16,201,367) - (16,201,367) - (16,201,367)
Long term borrowing - - - - (2,629,477) (2,629,477) - (2,629,477) - (2,629,477)
- - (36,344,414) - (7,588,701) (43,933,114) - (43,933,114) - (43,933,114)
**Other receivables do not include prepayments and subscription for shares (₦341.04million) which are not financial assets.
***Other payables and accruals do not include accrued expenses(₦217.6million) that are not financial liabilities.
Carrying amount Fair value
The Group has disclosed the fair value of each class of financial assets and liabilities in a way that permits the information to be compared with the carrying amounts. In addition, it has reconciled the assets and
liabilities to the different categories of financial instruments as defined in IAS 39 Financial instruments: Recognition and Measurement.
* The Group has not disclosed the fair values for financial instruments such as short term trade receivables, payables, reinsurance assets, loans and receivables because their carrying amounts are a reasonable
approximation of fair value.
^ Reinsurance assets excludes prepaid reinsurance, which is not a financial asset (₦1.04billion)
82
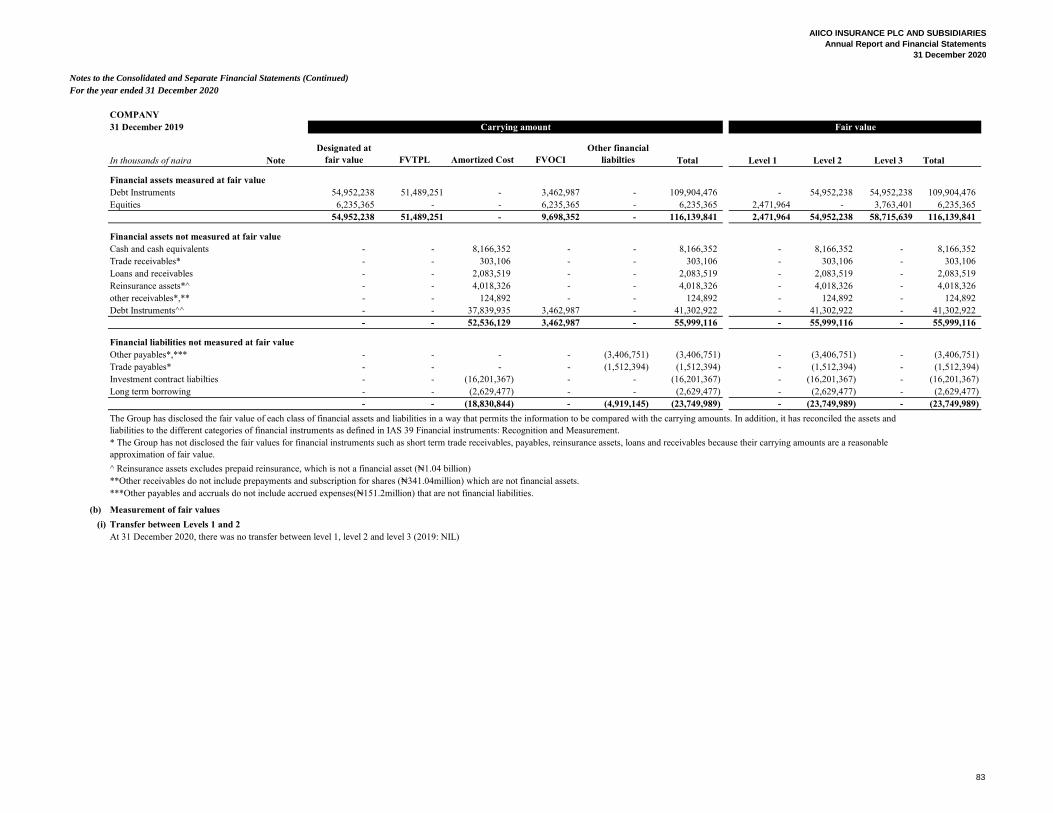
AIICO INSURANCE PLC AND SUBSIDIARIES
Annual Report and Financial Statements
31 December 2020
Notes to the Consolidated and Separate Financial Statements (Continued)
For the year ended 31 December 2020
COMPANY
31 December 2019
In thousands of naira Note
Designated at
fair value FVTPL Amortized Cost FVOCI
Other financial
liabilties Total Level 1 Level 2 Level 3 Total
Financial assets measured at fair value
Debt Instruments 54,952,238 51,489,251 - 3,462,987 - 109,904,476 - 54,952,238 54,952,238 109,904,476
Equities 6,235,365 - - 6,235,365 - 6,235,365 2,471,964 - 3,763,401 6,235,365
54,952,238 51,489,251 - 9,698,352 - 116,139,841 2,471,964 54,952,238 58,715,639 116,139,841
Financial assets not measured at fair value
Cash and cash equivalents - - 8,166,352 - - 8,166,352 - 8,166,352 - 8,166,352
Trade receivables* - - 303,106 - - 303,106 - 303,106 - 303,106
Loans and receivables - - 2,083,519 - - 2,083,519 - 2,083,519 - 2,083,519
Reinsurance assets*^ - - 4,018,326 - - 4,018,326 - 4,018,326 - 4,018,326
other receivables*,** - - 124,892 - - 124,892 - 124,892 - 124,892
Debt Instruments^^ - - 37,839,935 3,462,987 - 41,302,922 - 41,302,922 - 41,302,922
- - 52,536,129 3,462,987 - 55,999,116 - 55,999,116 - 55,999,116
Financial liabilities not measured at fair value
Other payables*,*** - - - - (3,406,751) (3,406,751) - (3,406,751) - (3,406,751)
Trade payables* - - - - (1,512,394) (1,512,394) - (1,512,394) - (1,512,394)
Investment contract liabilties - - (16,201,367) - - (16,201,367) - (16,201,367) - (16,201,367)
Long term borrowing - - (2,629,477) - - (2,629,477) - (2,629,477) - (2,629,477)
- - (18,830,844) - (4,919,145) (23,749,989) - (23,749,989) - (23,749,989)
^ Reinsurance assets excludes prepaid reinsurance, which is not a financial asset (₦1.04 billion)
**Other receivables do not include prepayments and subscription for shares (₦341.04million) which are not financial assets.
***Other payables and accruals do not include accrued expenses(₦151.2million) that are not financial liabilities.
(b) Measurement of fair values
(i) Transfer between Levels 1 and 2
At 31 December 2020, there was no transfer between level 1, level 2 and level 3 (2019: NIL)
* The Group has not disclosed the fair values for financial instruments such as short term trade receivables, payables, reinsurance assets, loans and receivables because their carrying amounts are a reasonable
approximation of fair value.
The Group has disclosed the fair value of each class of financial assets and liabilities in a way that permits the information to be compared with the carrying amounts. In addition, it has reconciled the assets and
liabilities to the different categories of financial instruments as defined in IAS 39 Financial instruments: Recognition and Measurement.
Carrying amount Fair value
83
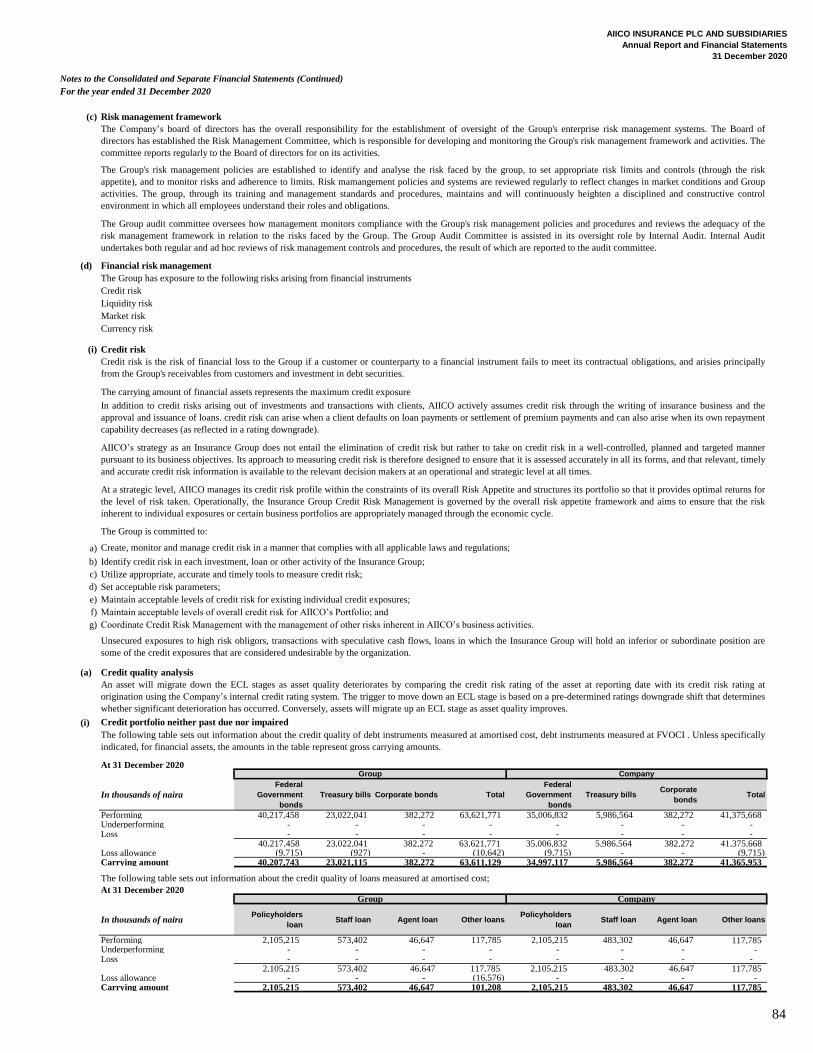
AIICO INSURANCE PLC AND SUBSIDIARIES
Annual Report and Financial Statements
31 December 2020
Notes to the Consolidated and Separate Financial Statements (Continued)
For the year ended 31 December 2020
(c) Risk management framework
(d) Financial risk management
The Group has exposure to the following risks arising from financial instruments
Credit risk
Liquidity risk
Market risk
Currency risk
(i) Credit risk
The carrying amount of financial assets represents the maximum credit exposure
The Group is committed to:
a) Create, monitor and manage credit risk in a manner that complies with all applicable laws and regulations;
b) Identify credit risk in each investment, loan or other activity of the Insurance Group;
c) Utilize appropriate, accurate and timely tools to measure credit risk;
d) Set acceptable risk parameters;
e) Maintain acceptable levels of credit risk for existing individual credit exposures;
f) Maintain acceptable levels of overall credit risk for AIICO’s Portfolio; and
g) Coordinate Credit Risk Management with the management of other risks inherent in AIICO’s business activities.
(a) Credit quality analysis
(i)
At 31 December 2020
In thousands of naira
Federal
Government
bonds
Treasury bills Corporate bonds Total
Federal
Government
bonds
Treasury billsCorporate
bondsTotal
Performing 40,217,458 23,022,041 382,272 63,621,771 35,006,832 5,986,564 382,272 41,375,668 Underperforming - - - - - - - - Loss - - - - - - - -
40,217,458 23,022,041 382,272 63,621,771 35,006,832 5,986,564 382,272 41,375,668 Loss allowance (9,715) (927) - (10,642) (9,715) - - (9,715) Carrying amount 40,207,743 23,021,115 382,272 63,611,129 34,997,117 5,986,564 382,272 41,365,953
At 31 December 2020
In thousands of nairaPolicyholders
loanStaff loan Agent loan Other loans
Policyholders
loanStaff loan Agent loan Other loans
Performing 2,105,215 573,402 46,647 117,785 2,105,215 483,302 46,647 117,785 Underperforming - - - - - - - - Loss - - - - - - - -
2,105,215 573,402 46,647 117,785 2,105,215 483,302 46,647 117,785 Loss allowance - - - (16,576) - - - - Carrying amount 2,105,215 573,402 46,647 101,208 2,105,215 483,302 46,647 117,785
The Company’s board of directors has the overall responsibility for the establishment of oversight of the Group's enterprise risk management systems. The Board of
directors has established the Risk Management Committee, which is responsible for developing and monitoring the Group's risk management framework and activities. The
committee reports regularly to the Board of directors for on its activities.
The Group's risk management policies are established to identify and analyse the risk faced by the group, to set appropriate risk limits and controls (through the risk
appetite), and to monitor risks and adherence to limits. Risk mamangement policies and systems are reviewed regularly to reflect changes in market conditions and Group
activities. The group, through its training and management standards and procedures, maintains and will continuously heighten a disciplined and constructive control
environment in which all employees understand their roles and obligations.
The Group audit committee oversees how management monitors compliance with the Group's risk management policies and procedures and reviews the adequacy of the
risk management framework in relation to the risks faced by the Group. The Group Audit Committee is assisted in its oversight role by Internal Audit. Internal Audit
undertakes both regular and ad hoc reviews of risk management controls and procedures, the result of which are reported to the audit committee.
Credit risk is the risk of financial loss to the Group if a customer or counterparty to a financial instrument fails to meet its contractual obligations, and arisies principally
from the Group's receivables from customers and investment in debt securities.
In addition to credit risks arising out of investments and transactions with clients, AIICO actively assumes credit risk through the writing of insurance business and the
approval and issuance of loans. credit risk can arise when a client defaults on loan payments or settlement of premium payments and can also arise when its own repayment
capability decreases (as reflected in a rating downgrade).
AIICO’s strategy as an Insurance Group does not entail the elimination of credit risk but rather to take on credit risk in a well-controlled, planned and targeted manner
pursuant to its business objectives. Its approach to measuring credit risk is therefore designed to ensure that it is assessed accurately in all its forms, and that relevant, timely
and accurate credit risk information is available to the relevant decision makers at an operational and strategic level at all times.
At a strategic level, AIICO manages its credit risk profile within the constraints of its overall Risk Appetite and structures its portfolio so that it provides optimal returns for
the level of risk taken. Operationally, the Insurance Group Credit Risk Management is governed by the overall risk appetite framework and aims to ensure that the risk
inherent to individual exposures or certain business portfolios are appropriately managed through the economic cycle.
Unsecured exposures to high risk obligors, transactions with speculative cash flows, loans in which the Insurance Group will hold an inferior or subordinate position are
some of the credit exposures that are considered undesirable by the organization.
An asset will migrate down the ECL stages as asset quality deteriorates by comparing the credit risk rating of the asset at reporting date with its credit risk rating at
origination using the Company’s internal credit rating system. The trigger to move down an ECL stage is based on a pre-determined ratings downgrade shift that determines
whether significant deterioration has occurred. Conversely, assets will migrate up an ECL stage as asset quality improves.
The following table sets out information about the credit quality of loans measured at amortised cost;
The following table sets out information about the credit quality of debt instruments measured at amortised cost, debt instruments measured at FVOCI . Unless specifically
indicated, for financial assets, the amounts in the table represent gross carrying amounts.
Credit portfolio neither past due nor impaired
Group Company
Group Company
84
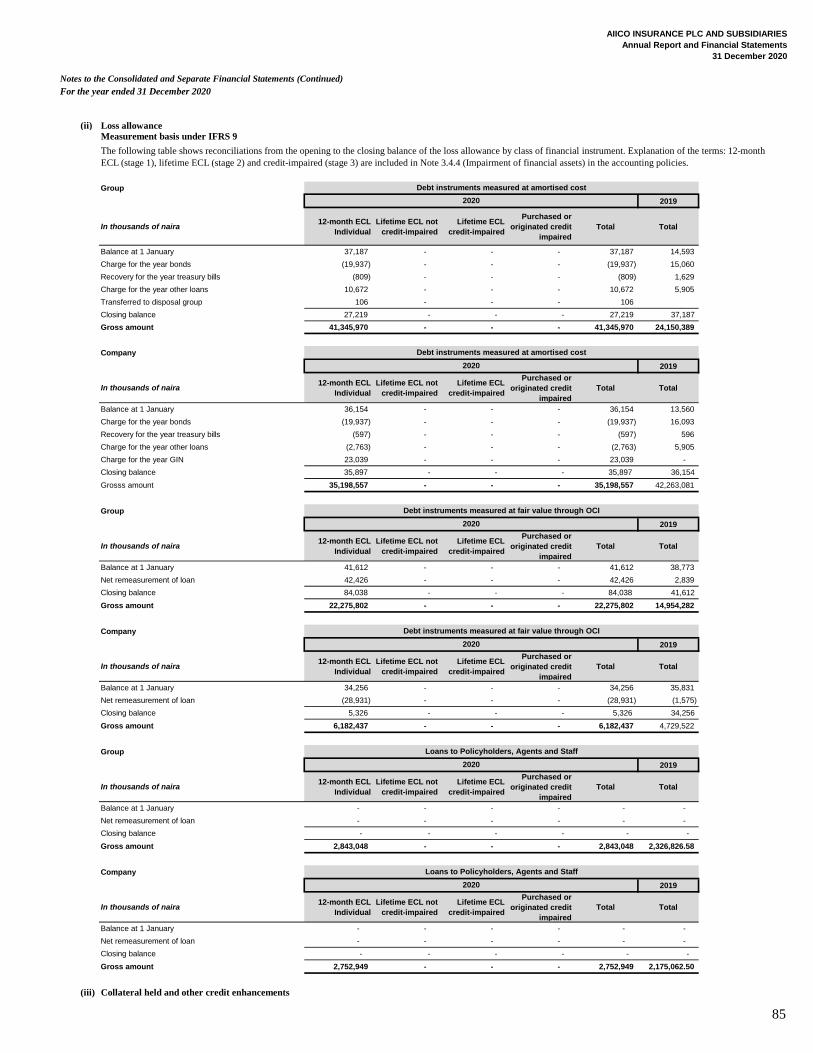
AIICO INSURANCE PLC AND SUBSIDIARIES
Annual Report and Financial Statements
31 December 2020
Notes to the Consolidated and Separate Financial Statements (Continued)
For the year ended 31 December 2020
(ii) Loss allowance
Group
2019
In thousands of naira12-month ECL
Individual
Lifetime ECL not
credit-impaired
Lifetime ECL
credit-impaired
Purchased or
originated credit-
impaired
Total Total
Balance at 1 January 37,187 - - - 37,187 14,593
Charge for the year bonds (19,937) - - - (19,937) 15,060
Recovery for the year treasury bills (809) - - - (809) 1,629
Charge for the year other loans 10,672 - - - 10,672 5,905
Transferred to disposal group 106 - - - 106
Closing balance 27,219 - - - 27,219 37,187
Gross amount 41,345,970 - - - 41,345,970 24,150,389
Company
2019
In thousands of naira12-month ECL
Individual
Lifetime ECL not
credit-impaired
Lifetime ECL
credit-impaired
Purchased or
originated credit-
impaired
Total Total
Balance at 1 January 36,154 - - - 36,154 13,560
Charge for the year bonds (19,937) - - - (19,937) 16,093
Recovery for the year treasury bills (597) - - - (597) 596
Charge for the year other loans (2,763) - - - (2,763) 5,905
Charge for the year GIN 23,039 - - - 23,039 -
Closing balance 35,897 - - - 35,897 36,154
Grosss amount 35,198,557 - - - 35,198,557 42,263,081
Group
2019
In thousands of naira12-month ECL
Individual
Lifetime ECL not
credit-impaired
Lifetime ECL
credit-impaired
Purchased or
originated credit-
impaired
Total Total
Balance at 1 January 41,612 - - - 41,612 38,773
Net remeasurement of loan 42,426 - - - 42,426 2,839
Closing balance 84,038 - - - 84,038 41,612
Gross amount 22,275,802 - - - 22,275,802 14,954,282
Company
2019
In thousands of naira12-month ECL
Individual
Lifetime ECL not
credit-impaired
Lifetime ECL
credit-impaired
Purchased or
originated credit-
impaired
Total Total
Balance at 1 January 34,256 - - - 34,256 35,831
Net remeasurement of loan (28,931) - - - (28,931) (1,575)
Closing balance 5,326 - - - 5,326 34,256
Gross amount 6,182,437 - - - 6,182,437 4,729,522
Group
2019
In thousands of naira12-month ECL
Individual
Lifetime ECL not
credit-impaired
Lifetime ECL
credit-impaired
Purchased or
originated credit-
impaired
Total Total
Balance at 1 January - - - - - -
Net remeasurement of loan - - - - - -
Closing balance - - - - - -
Gross amount 2,843,048 - - - 2,843,048 2,326,826.58
Company
2019
In thousands of naira12-month ECL
Individual
Lifetime ECL not
credit-impaired
Lifetime ECL
credit-impaired
Purchased or
originated credit-
impaired
Total Total
Balance at 1 January - - - - - -
Net remeasurement of loan - - - - - -
Closing balance - - - - - -
Gross amount 2,752,949 - - - 2,752,949 2,175,062.50
(iii) Collateral held and other credit enhancements
2020
2020
Debt instruments measured at amortised cost
Debt instruments measured at amortised cost
Measurement basis under IFRS 9
The following table shows reconciliations from the opening to the closing balance of the loss allowance by class of financial instrument. Explanation of the terms: 12-month
ECL (stage 1), lifetime ECL (stage 2) and credit-impaired (stage 3) are included in Note 3.4.4 (Impairment of financial assets) in the accounting policies.
Debt instruments measured at fair value through OCI
2020
Debt instruments measured at fair value through OCI
2020
Loans to Policyholders, Agents and Staff
2020
Loans to Policyholders, Agents and Staff
2020
85
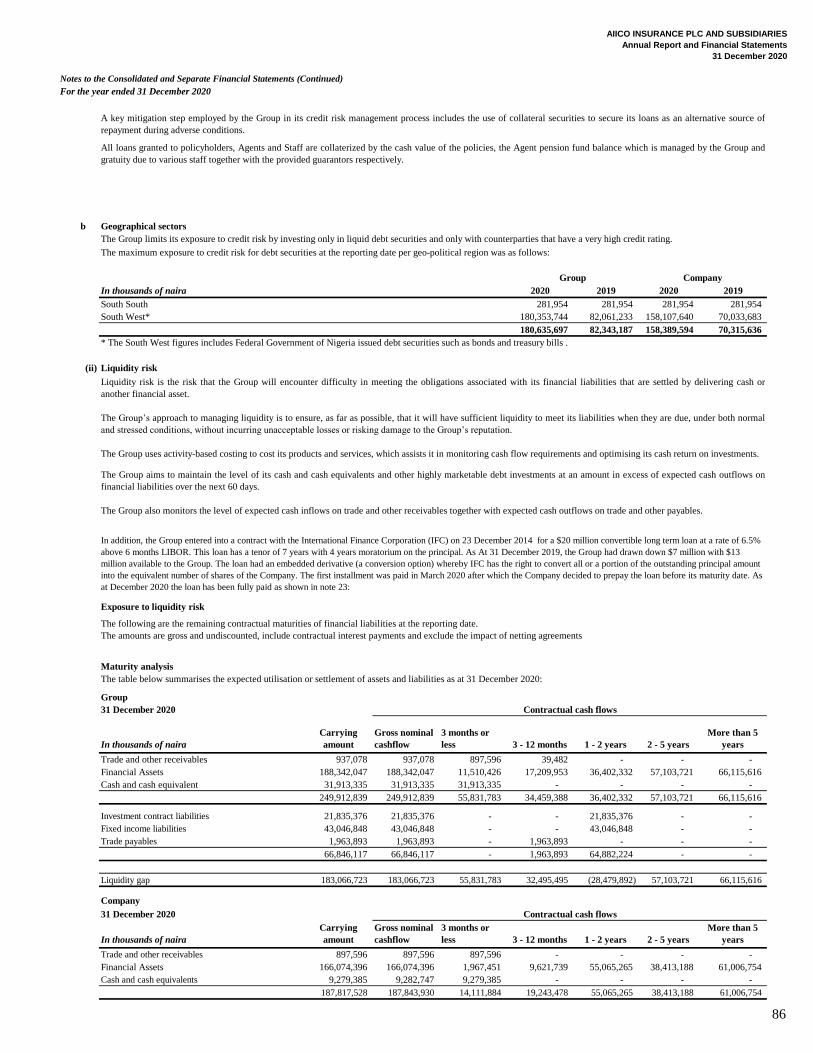
AIICO INSURANCE PLC AND SUBSIDIARIES
Annual Report and Financial Statements
31 December 2020
Notes to the Consolidated and Separate Financial Statements (Continued)
For the year ended 31 December 2020
b Geographical sectors
In thousands of naira 2020 2019 2020 2019
South South 281,954 281,954 281,954 281,954
South West* 180,353,744 82,061,233 158,107,640 70,033,683
180,635,697 82,343,187 158,389,594 70,315,636
* The South West figures includes Federal Government of Nigeria issued debt securities such as bonds and treasury bills .
(ii) Liquidity risk
Exposure to liquidity risk
Maturity analysis
The table below summarises the expected utilisation or settlement of assets and liabilities as at 31 December 2020:
Group
31 December 2020
In thousands of naira
Carrying
amount
Gross nominal
cashflow
3 months or
less 3 - 12 months 1 - 2 years 2 - 5 years
More than 5
years
Trade and other receivables 937,078 937,078 897,596 39,482 - - -
Financial Assets 188,342,047 188,342,047 11,510,426 17,209,953 36,402,332 57,103,721 66,115,616
Cash and cash equivalent 31,913,335 31,913,335 31,913,335 - - - -
249,912,839 249,912,839 55,831,783 34,459,388 36,402,332 57,103,721 66,115,616
Investment contract liabilities 21,835,376 21,835,376 - - 21,835,376 - -
Fixed income liabilities 43,046,848 43,046,848 - - 43,046,848 - -
Trade payables 1,963,893 1,963,893 - 1,963,893 - - -
66,846,117 66,846,117 - 1,963,893 64,882,224 - -
Liquidity gap 183,066,723 183,066,723 55,831,783 32,495,495 (28,479,892) 57,103,721 66,115,616
Company
31 December 2020
In thousands of naira
Carrying
amount
Gross nominal
cashflow
3 months or
less 3 - 12 months 1 - 2 years 2 - 5 years
More than 5
years
Trade and other receivables 897,596 897,596 897,596 - - - -
Financial Assets 166,074,396 166,074,396 1,967,451 9,621,739 55,065,265 38,413,188 61,006,754
Cash and cash equivalents 9,279,385 9,282,747 9,279,385 - - - -
187,817,528 187,843,930 14,111,884 19,243,478 55,065,265 38,413,188 61,006,754
The following are the remaining contractual maturities of financial liabilities at the reporting date.
The amounts are gross and undiscounted, include contractual interest payments and exclude the impact of netting agreements
Contractual cash flows
Contractual cash flows
In addition, the Group entered into a contract with the International Finance Corporation (IFC) on 23 December 2014 for a $20 million convertible long term loan at a rate of 6.5%
above 6 months LIBOR. This loan has a tenor of 7 years with 4 years moratorium on the principal. As At 31 December 2019, the Group had drawn down $7 million with $13
million available to the Group. The loan had an embedded derivative (a conversion option) whereby IFC has the right to convert all or a portion of the outstanding principal amount
into the equivalent number of shares of the Company. The first installment was paid in March 2020 after which the Company decided to prepay the loan before its maturity date. As
at December 2020 the loan has been fully paid as shown in note 23:
The Group aims to maintain the level of its cash and cash equivalents and other highly marketable debt investments at an amount in excess of expected cash outflows on
financial liabilities over the next 60 days.
The Group also monitors the level of expected cash inflows on trade and other receivables together with expected cash outflows on trade and other payables.
The Group limits its exposure to credit risk by investing only in liquid debt securities and only with counterparties that have a very high credit rating.
The maximum exposure to credit risk for debt securities at the reporting date per geo-political region was as follows:
Group Company
Liquidity risk is the risk that the Group will encounter difficulty in meeting the obligations associated with its financial liabilities that are settled by delivering cash or
another financial asset.
The Group’s approach to managing liquidity is to ensure, as far as possible, that it will have sufficient liquidity to meet its liabilities when they are due, under both normal
and stressed conditions, without incurring unacceptable losses or risking damage to the Group’s reputation.
The Group uses activity-based costing to cost its products and services, which assists it in monitoring cash flow requirements and optimising its cash return on investments.
A key mitigation step employed by the Group in its credit risk management process includes the use of collateral securities to secure its loans as an alternative source of
repayment during adverse conditions.
All loans granted to policyholders, Agents and Staff are collaterized by the cash value of the policies, the Agent pension fund balance which is managed by the Group and
gratuity due to various staff together with the provided guarantors respectively.
86
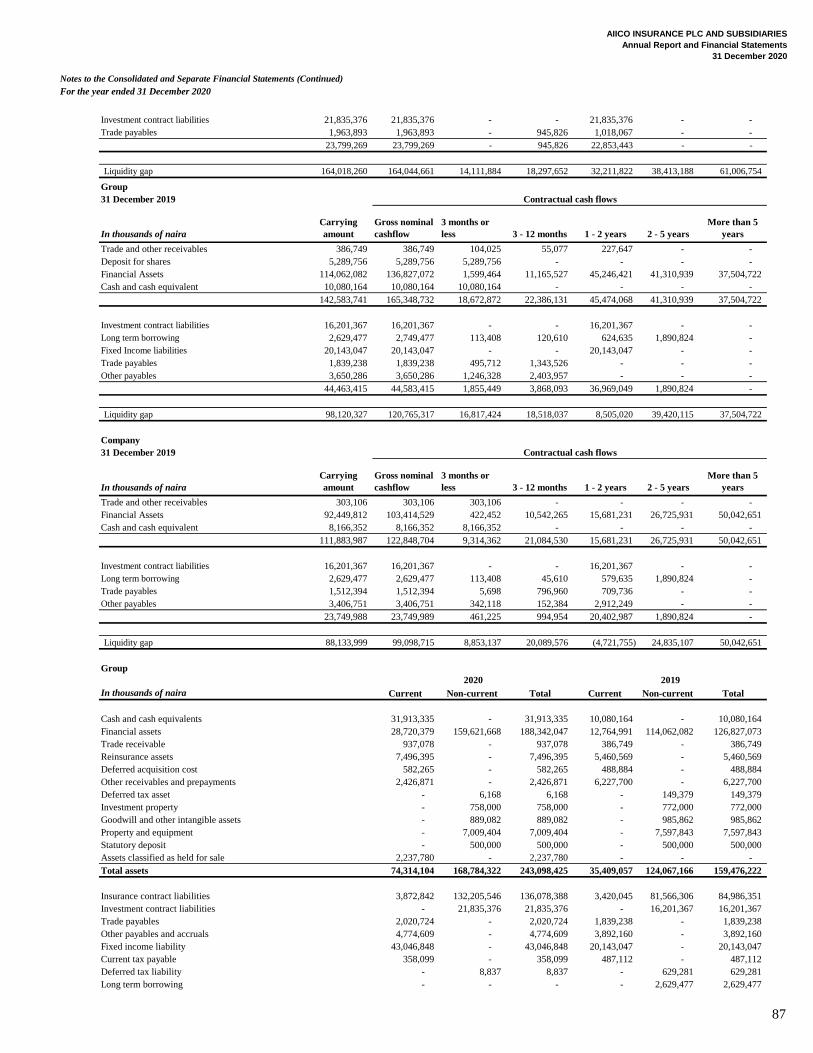
AIICO INSURANCE PLC AND SUBSIDIARIES
Annual Report and Financial Statements
31 December 2020
Notes to the Consolidated and Separate Financial Statements (Continued)
For the year ended 31 December 2020
Investment contract liabilities 21,835,376 21,835,376 - - 21,835,376 - -
Trade payables 1,963,893 1,963,893 - 945,826 1,018,067 - -
23,799,269 23,799,269 - 945,826 22,853,443 - -
Liquidity gap 164,018,260 164,044,661 14,111,884 18,297,652 32,211,822 38,413,188 61,006,754
Group
31 December 2019
In thousands of naira
Carrying
amount
Gross nominal
cashflow
3 months or
less 3 - 12 months 1 - 2 years 2 - 5 years
More than 5
years
Trade and other receivables 386,749 386,749 104,025 55,077 227,647 - -
Deposit for shares 5,289,756 5,289,756 5,289,756 - - - -
Financial Assets 114,062,082 136,827,072 1,599,464 11,165,527 45,246,421 41,310,939 37,504,722
Cash and cash equivalent 10,080,164 10,080,164 10,080,164 - - - -
142,583,741 165,348,732 18,672,872 22,386,131 45,474,068 41,310,939 37,504,722
Investment contract liabilities 16,201,367 16,201,367 - - 16,201,367 - -
Long term borrowing 2,629,477 2,749,477 113,408 120,610 624,635 1,890,824 -
Fixed Income liabilities 20,143,047 20,143,047 - - 20,143,047 - -
Trade payables 1,839,238 1,839,238 495,712 1,343,526 - - -
Other payables 3,650,286 3,650,286 1,246,328 2,403,957 - - -
44,463,415 44,583,415 1,855,449 3,868,093 36,969,049 1,890,824 -
Liquidity gap 98,120,327 120,765,317 16,817,424 18,518,037 8,505,020 39,420,115 37,504,722
Company
31 December 2019
In thousands of naira
Carrying
amount
Gross nominal
cashflow
3 months or
less 3 - 12 months 1 - 2 years 2 - 5 years
More than 5
years
Trade and other receivables 303,106 303,106 303,106 - - - -
Financial Assets 92,449,812 103,414,529 422,452 10,542,265 15,681,231 26,725,931 50,042,651
Cash and cash equivalent 8,166,352 8,166,352 8,166,352 - - - -
111,883,987 122,848,704 9,314,362 21,084,530 15,681,231 26,725,931 50,042,651
Investment contract liabilities 16,201,367 16,201,367 - - 16,201,367 - -
Long term borrowing 2,629,477 2,629,477 113,408 45,610 579,635 1,890,824 -
Trade payables 1,512,394 1,512,394 5,698 796,960 709,736 - -
Other payables 3,406,751 3,406,751 342,118 152,384 2,912,249 - -
23,749,988 23,749,989 461,225 994,954 20,402,987 1,890,824 -
Liquidity gap 88,133,999 99,098,715 8,853,137 20,089,576 (4,721,755) 24,835,107 50,042,651
Group
In thousands of naira Current Non-current Total Current Non-current Total
Cash and cash equivalents 31,913,335 - 31,913,335 10,080,164 - 10,080,164
Financial assets 28,720,379 159,621,668 188,342,047 12,764,991 114,062,082 126,827,073
Trade receivable 937,078 - 937,078 386,749 - 386,749
Reinsurance assets 7,496,395 - 7,496,395 5,460,569 - 5,460,569
Deferred acquisition cost 582,265 - 582,265 488,884 - 488,884
Other receivables and prepayments 2,426,871 - 2,426,871 6,227,700 - 6,227,700
Deferred tax asset - 6,168 6,168 - 149,379 149,379
Investment property - 758,000 758,000 - 772,000 772,000
Goodwill and other intangible assets - 889,082 889,082 - 985,862 985,862
Property and equipment - 7,009,404 7,009,404 - 7,597,843 7,597,843
Statutory deposit - 500,000 500,000 - 500,000 500,000
Assets classified as held for sale 2,237,780 - 2,237,780 - - -
Total assets 74,314,104 168,784,322 243,098,425 35,409,057 124,067,166 159,476,222
Insurance contract liabilities 3,872,842 132,205,546 136,078,388 3,420,045 81,566,306 84,986,351
Investment contract liabilities - 21,835,376 21,835,376 - 16,201,367 16,201,367
Trade payables 2,020,724 - 2,020,724 1,839,238 - 1,839,238
Other payables and accruals 4,774,609 - 4,774,609 3,892,160 - 3,892,160
Fixed income liability 43,046,848 - 43,046,848 20,143,047 - 20,143,047
Current tax payable 358,099 - 358,099 487,112 - 487,112
Deferred tax liability - 8,837 8,837 - 629,281 629,281
Long term borrowing - - - - 2,629,477 2,629,477
Contractual cash flows
Contractual cash flows
2020 2019
87
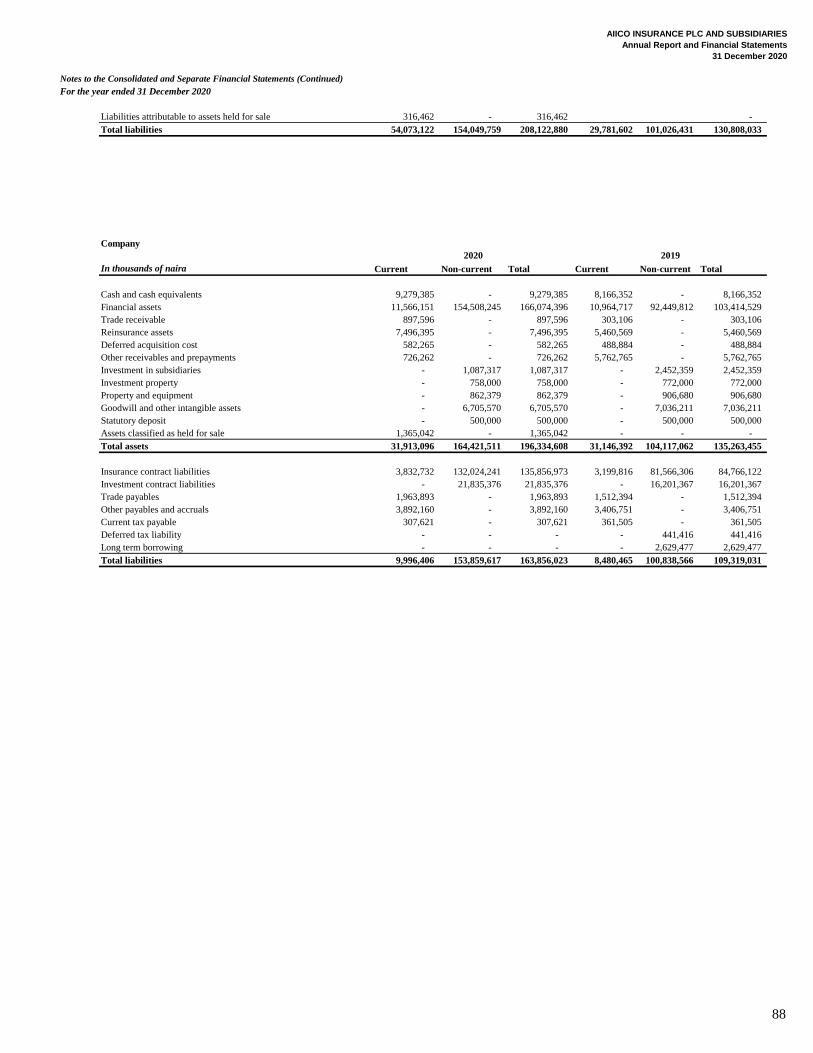
AIICO INSURANCE PLC AND SUBSIDIARIES
Annual Report and Financial Statements
31 December 2020
Notes to the Consolidated and Separate Financial Statements (Continued)
For the year ended 31 December 2020
Liabilities attributable to assets held for sale 316,462 - 316,462 -
Total liabilities 54,073,122 154,049,759 208,122,880 29,781,602 101,026,431 130,808,033
Company
In thousands of naira Current Non-current Total Current Non-current Total
Cash and cash equivalents 9,279,385 - 9,279,385 8,166,352 - 8,166,352
Financial assets 11,566,151 154,508,245 166,074,396 10,964,717 92,449,812 103,414,529
Trade receivable 897,596 - 897,596 303,106 - 303,106
Reinsurance assets 7,496,395 - 7,496,395 5,460,569 - 5,460,569
Deferred acquisition cost 582,265 - 582,265 488,884 - 488,884
Other receivables and prepayments 726,262 - 726,262 5,762,765 - 5,762,765
Investment in subsidiaries - 1,087,317 1,087,317 - 2,452,359 2,452,359
Investment property - 758,000 758,000 - 772,000 772,000
Property and equipment - 862,379 862,379 - 906,680 906,680
Goodwill and other intangible assets - 6,705,570 6,705,570 - 7,036,211 7,036,211
Statutory deposit - 500,000 500,000 - 500,000 500,000
Assets classified as held for sale 1,365,042 - 1,365,042 - - -
Total assets 31,913,096 164,421,511 196,334,608 31,146,392 104,117,062 135,263,455
Insurance contract liabilities 3,832,732 132,024,241 135,856,973 3,199,816 81,566,306 84,766,122
Investment contract liabilities - 21,835,376 21,835,376 - 16,201,367 16,201,367
Trade payables 1,963,893 - 1,963,893 1,512,394 - 1,512,394
Other payables and accruals 3,892,160 - 3,892,160 3,406,751 - 3,406,751
Current tax payable 307,621 - 307,621 361,505 - 361,505
Deferred tax liability - - - - 441,416 441,416
Long term borrowing - - - - 2,629,477 2,629,477
Total liabilities 9,996,406 153,859,617 163,856,023 8,480,465 100,838,566 109,319,031
2020 2019
88
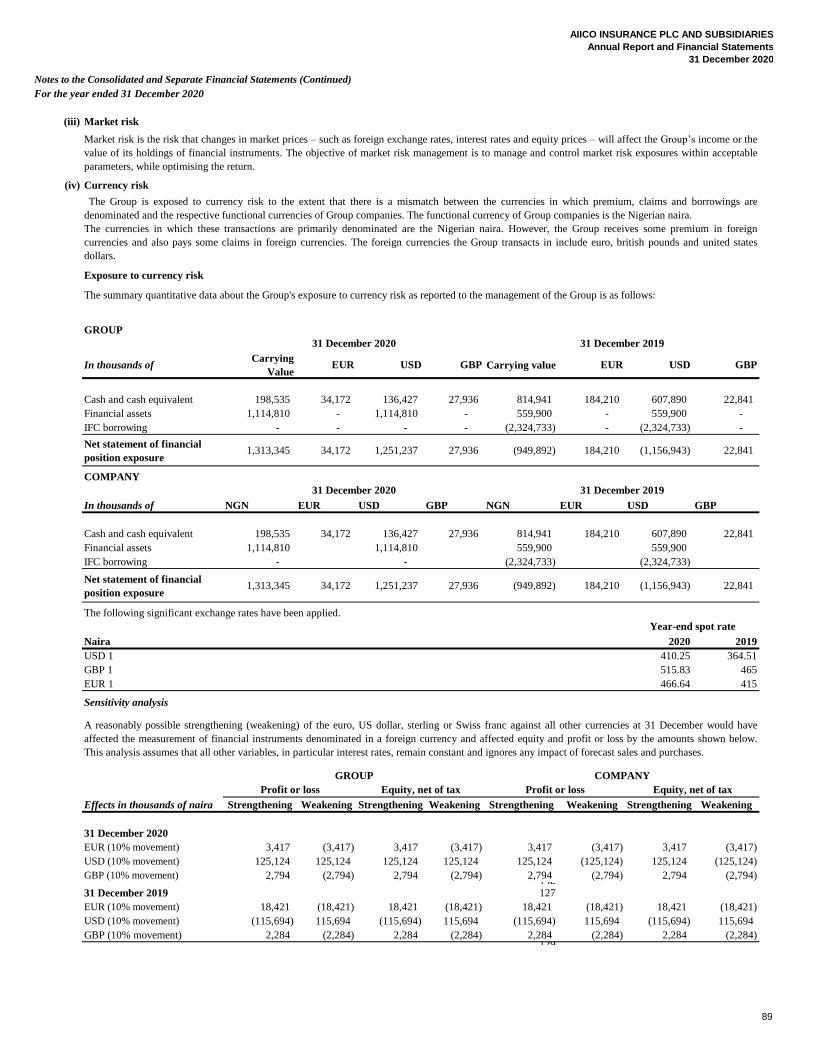
AIICO INSURANCE PLC AND SUBSIDIARIES
Annual Report and Financial Statements
31 December 2020
Notes to the Consolidated and Separate Financial Statements (Continued)
For the year ended 31 December 2020
(iii) Market risk
(iv) Currency risk
Exposure to currency risk
GROUP
In thousands of Carrying
ValueEUR USD GBP Carrying value EUR USD GBP
Cash and cash equivalent 198,535 34,172 136,427 27,936 814,941 184,210 607,890 22,841
Financial assets 1,114,810 - 1,114,810 - 559,900 - 559,900 -
IFC borrowing - - - - (2,324,733) - (2,324,733) -
Net statement of financial
position exposure1,313,345 34,172 1,251,237 27,936 (949,892) 184,210 (1,156,943) 22,841
COMPANY
In thousands of NGN EUR USD GBP NGN EUR USD GBP
Cash and cash equivalent 198,535 34,172 136,427 27,936 814,941 184,210 607,890 22,841
Financial assets 1,114,810 1,114,810 559,900 559,900
IFC borrowing - - (2,324,733) (2,324,733)
Net statement of financial
position exposure1,313,345 34,172 1,251,237 27,936 (949,892) 184,210 (1,156,943) 22,841
The following significant exchange rates have been applied.
Naira 2020 2019
USD 1 410.25 364.51
GBP 1 515.83 465
EUR 1 466.64 415
Sensitivity analysis
Effects in thousands of naira Strengthening Weakening Strengthening Weakening Strengthening Weakening Strengthening Weakening
31 December 2020
EUR (10% movement) 3,417 (3,417) 3,417 (3,417) 3,417 (3,417) 3,417 (3,417)
USD (10% movement) 125,124 125,124 125,124 125,124 125,124 (125,124) 125,124 (125,124)
GBP (10% movement) 2,794 (2,794) 2,794 (2,794) 2,794 (2,794) 2,794 (2,794) 126
31 December 2019 127
EUR (10% movement) 18,421 (18,421) 18,421 (18,421) 18,421 (18,421) 18,421 (18,421)
USD (10% movement) (115,694) 115,694 (115,694) 115,694 (115,694) 115,694 (115,694) 115,694
GBP (10% movement) 2,284 (2,284) 2,284 (2,284) 2,284 (2,284) 2,284 (2,284) 129
Equity, net of tax Profit or loss Equity, net of tax
Market risk is the risk that changes in market prices – such as foreign exchange rates, interest rates and equity prices – will affect the Group’s income or the
value of its holdings of financial instruments. The objective of market risk management is to manage and control market risk exposures within acceptable
parameters, while optimising the return.
The Group is exposed to currency risk to the extent that there is a mismatch between the currencies in which premium, claims and borrowings are
denominated and the respective functional currencies of Group companies. The functional currency of Group companies is the Nigerian naira.
The currencies in which these transactions are primarily denominated are the Nigerian naira. However, the Group receives some premium in foreign
currencies and also pays some claims in foreign currencies. The foreign currencies the Group transacts in include euro, british pounds and united states
dollars.
The summary quantitative data about the Group's exposure to currency risk as reported to the management of the Group is as follows:
31 December 2020 31 December 2019
31 December 2020 31 December 2019
Year-end spot rate
A reasonably possible strengthening (weakening) of the euro, US dollar, sterling or Swiss franc against all other currencies at 31 December would have
affected the measurement of financial instruments denominated in a foreign currency and affected equity and profit or loss by the amounts shown below.
This analysis assumes that all other variables, in particular interest rates, remain constant and ignores any impact of forecast sales and purchases.
GROUP COMPANY
Profit or loss
89
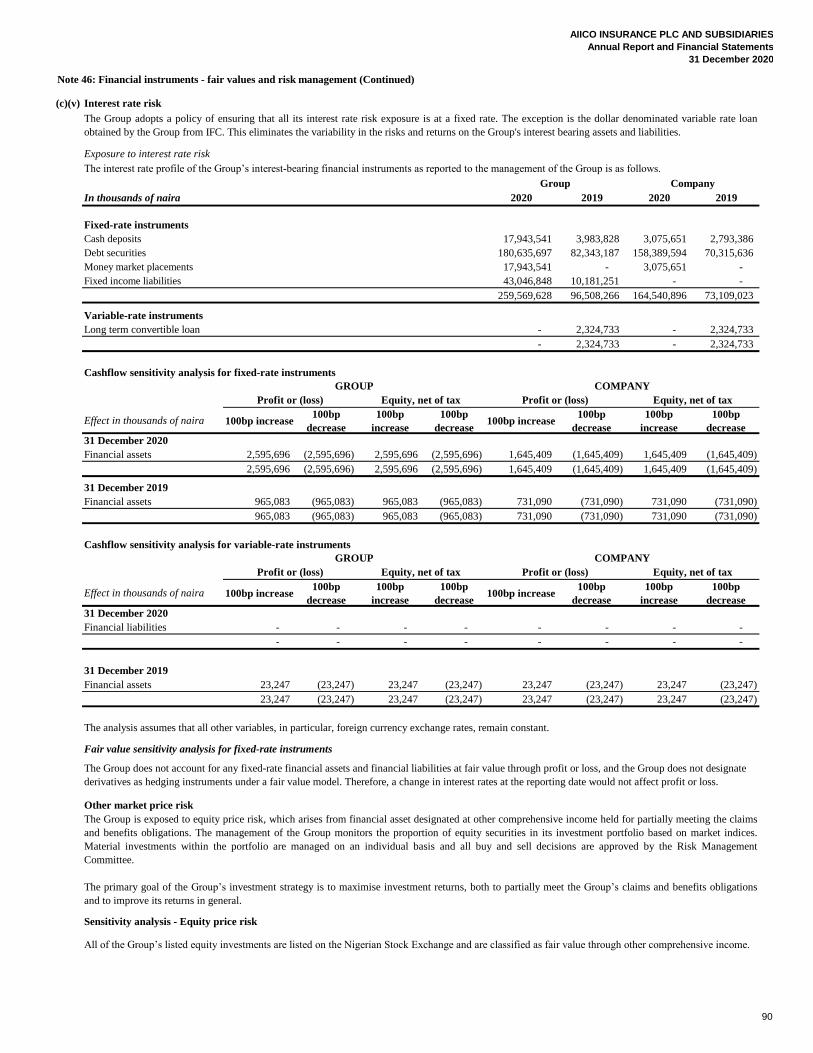
AIICO INSURANCE PLC AND SUBSIDIARIES
Annual Report and Financial Statements
31 December 2020
Note 46: Financial instruments - fair values and risk management (Continued)
(c)(v) Interest rate risk
Exposure to interest rate risk
In thousands of naira 2020 2019 2020 2019
Fixed-rate instruments
Cash deposits 17,943,541 3,983,828 3,075,651 2,793,386
Debt securities 180,635,697 82,343,187 158,389,594 70,315,636
Money market placements 17,943,541 - 3,075,651 -
Fixed income liabilities 43,046,848 10,181,251 - -
259,569,628 96,508,266 164,540,896 73,109,023
Variable-rate instruments
Long term convertible loan - 2,324,733 - 2,324,733
- 2,324,733 - 2,324,733
Cashflow sensitivity analysis for fixed-rate instruments
Effect in thousands of naira 100bp increase100bp
decrease
100bp
increase
100bp
decrease100bp increase
100bp
decrease
100bp
increase
100bp
decrease
31 December 2020
Financial assets 2,595,696 (2,595,696) 2,595,696 (2,595,696) 1,645,409 (1,645,409) 1,645,409 (1,645,409)
2,595,696 (2,595,696) 2,595,696 (2,595,696) 1,645,409 (1,645,409) 1,645,409 (1,645,409)
31 December 2019
Financial assets 965,083 (965,083) 965,083 (965,083) 731,090 (731,090) 731,090 (731,090)
965,083 (965,083) 965,083 (965,083) 731,090 (731,090) 731,090 (731,090)
Cashflow sensitivity analysis for variable-rate instruments
Effect in thousands of naira 100bp increase100bp
decrease
100bp
increase
100bp
decrease100bp increase
100bp
decrease
100bp
increase
100bp
decrease
31 December 2020
Financial liabilities - - - - - - - -
- - - - - - - -
31 December 2019
Financial assets 23,247 (23,247) 23,247 (23,247) 23,247 (23,247) 23,247 (23,247)
23,247 (23,247) 23,247 (23,247) 23,247 (23,247) 23,247 (23,247)
The analysis assumes that all other variables, in particular, foreign currency exchange rates, remain constant.
Fair value sensitivity analysis for fixed-rate instruments
Other market price risk
Sensitivity analysis - Equity price risk
The Group is exposed to equity price risk, which arises from financial asset designated at other comprehensive income held for partially meeting the claims
and benefits obligations. The management of the Group monitors the proportion of equity securities in its investment portfolio based on market indices.
Material investments within the portfolio are managed on an individual basis and all buy and sell decisions are approved by the Risk Management
Committee.
The primary goal of the Group’s investment strategy is to maximise investment returns, both to partially meet the Group’s claims and benefits obligations
and to improve its returns in general.
All of the Group’s listed equity investments are listed on the Nigerian Stock Exchange and are classified as fair value through other comprehensive income.
GROUP COMPANY
Profit or (loss) Equity, net of tax Profit or (loss) Equity, net of tax
GROUP COMPANY
Profit or (loss) Equity, net of tax Profit or (loss) Equity, net of tax
The Group adopts a policy of ensuring that all its interest rate risk exposure is at a fixed rate. The exception is the dollar denominated variable rate loan
obtained by the Group from IFC. This eliminates the variability in the risks and returns on the Group's interest bearing assets and liabilities.
Group Company
The Group does not account for any fixed-rate financial assets and financial liabilities at fair value through profit or loss, and the Group does not designate
derivatives as hedging instruments under a fair value model. Therefore, a change in interest rates at the reporting date would not affect profit or loss.
The interest rate profile of the Group’s interest-bearing financial instruments as reported to the management of the Group is as follows.
90
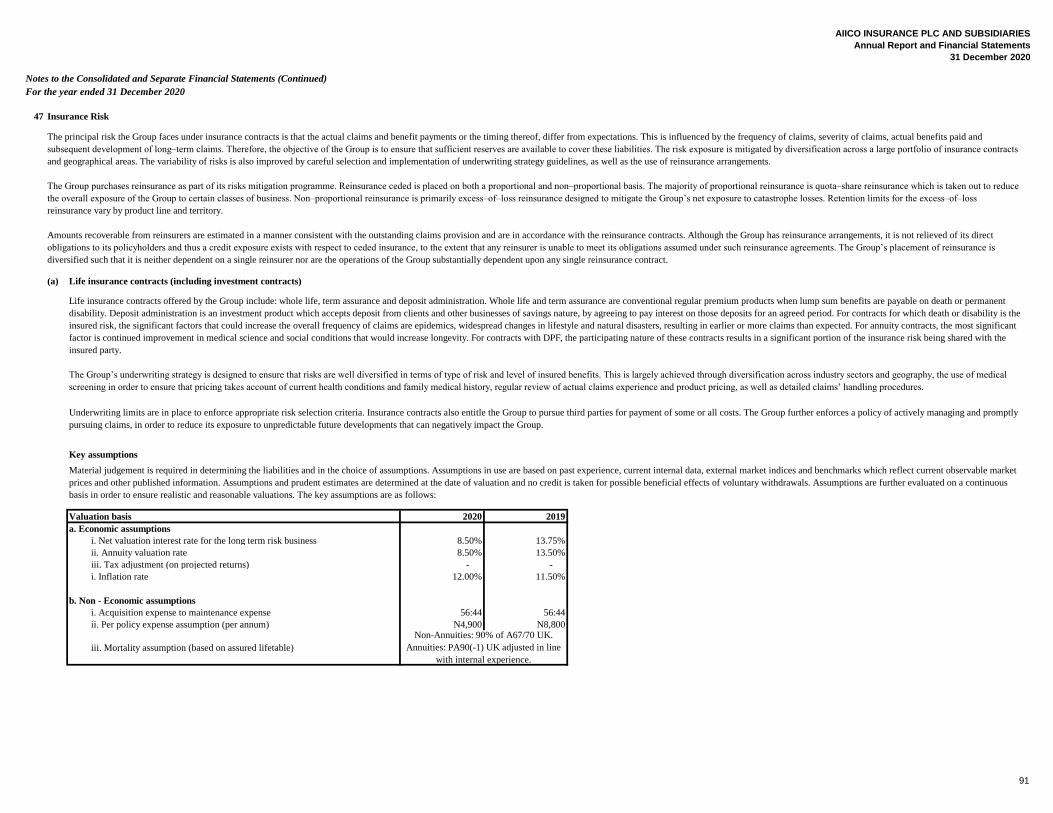
AIICO INSURANCE PLC AND SUBSIDIARIES
Annual Report and Financial Statements
31 December 2020
Notes to the Consolidated and Separate Financial Statements (Continued)
For the year ended 31 December 2020
47 Insurance Risk
(a) Life insurance contracts (including investment contracts)
Key assumptions
Valuation basis 2020 2019
a. Economic assumptions
i. Net valuation interest rate for the long term risk business 8.50% 13.75%
ii. Annuity valuation rate 8.50% 13.50%
iii. Tax adjustment (on projected returns) - -
i. Inflation rate 12.00% 11.50%
b. Non - Economic assumptions
i. Acquisition expense to maintenance expense 56:44 56:44
ii. Per policy expense assumption (per annum) N4,900 N8,800
iii. Mortality assumption (based on assured lifetable)
Life insurance contracts offered by the Group include: whole life, term assurance and deposit administration. Whole life and term assurance are conventional regular premium products when lump sum benefits are payable on death or permanent
disability. Deposit administration is an investment product which accepts deposit from clients and other businesses of savings nature, by agreeing to pay interest on those deposits for an agreed period. For contracts for which death or disability is the
insured risk, the significant factors that could increase the overall frequency of claims are epidemics, widespread changes in lifestyle and natural disasters, resulting in earlier or more claims than expected. For annuity contracts, the most significant
factor is continued improvement in medical science and social conditions that would increase longevity. For contracts with DPF, the participating nature of these contracts results in a significant portion of the insurance risk being shared with the
insured party.
The Group’s underwriting strategy is designed to ensure that risks are well diversified in terms of type of risk and level of insured benefits. This is largely achieved through diversification across industry sectors and geography, the use of medical
screening in order to ensure that pricing takes account of current health conditions and family medical history, regular review of actual claims experience and product pricing, as well as detailed claims’ handling procedures.
Material judgement is required in determining the liabilities and in the choice of assumptions. Assumptions in use are based on past experience, current internal data, external market indices and benchmarks which reflect current observable market
prices and other published information. Assumptions and prudent estimates are determined at the date of valuation and no credit is taken for possible beneficial effects of voluntary withdrawals. Assumptions are further evaluated on a continuous
basis in order to ensure realistic and reasonable valuations. The key assumptions are as follows:
The principal risk the Group faces under insurance contracts is that the actual claims and benefit payments or the timing thereof, differ from expectations. This is influenced by the frequency of claims, severity of claims, actual benefits paid and
subsequent development of long–term claims. Therefore, the objective of the Group is to ensure that sufficient reserves are available to cover these liabilities. The risk exposure is mitigated by diversification across a large portfolio of insurance contracts
and geographical areas. The variability of risks is also improved by careful selection and implementation of underwriting strategy guidelines, as well as the use of reinsurance arrangements.
The Group purchases reinsurance as part of its risks mitigation programme. Reinsurance ceded is placed on both a proportional and non–proportional basis. The majority of proportional reinsurance is quota–share reinsurance which is taken out to reduce
the overall exposure of the Group to certain classes of business. Non–proportional reinsurance is primarily excess–of–loss reinsurance designed to mitigate the Group’s net exposure to catastrophe losses. Retention limits for the excess–of–loss
reinsurance vary by product line and territory.
Amounts recoverable from reinsurers are estimated in a manner consistent with the outstanding claims provision and are in accordance with the reinsurance contracts. Although the Group has reinsurance arrangements, it is not relieved of its direct
obligations to its policyholders and thus a credit exposure exists with respect to ceded insurance, to the extent that any reinsurer is unable to meet its obligations assumed under such reinsurance agreements. The Group’s placement of reinsurance is
diversified such that it is neither dependent on a single reinsurer nor are the operations of the Group substantially dependent upon any single reinsurance contract.
Underwriting limits are in place to enforce appropriate risk selection criteria. Insurance contracts also entitle the Group to pursue third parties for payment of some or all costs. The Group further enforces a policy of actively managing and promptly
pursuing claims, in order to reduce its exposure to unpredictable future developments that can negatively impact the Group.
Non-Annuities: 90% of A67/70 UK.
Annuities: PA90(-1) UK adjusted in line
with internal experience.
91
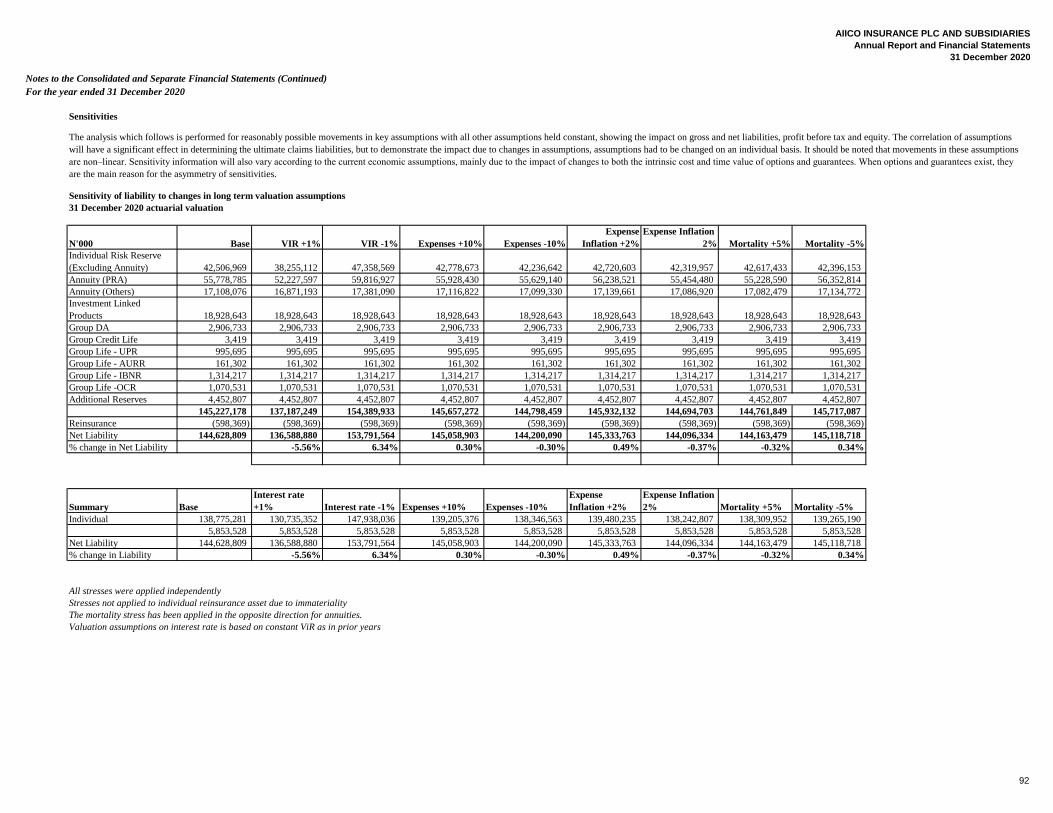
AIICO INSURANCE PLC AND SUBSIDIARIES
Annual Report and Financial Statements
31 December 2020
Notes to the Consolidated and Separate Financial Statements (Continued)
For the year ended 31 December 2020
Sensitivities
Sensitivity of liability to changes in long term valuation assumptions
31 December 2020 actuarial valuation
N'000 Base VIR +1% VIR -1% Expenses +10% Expenses -10%
Expense
Inflation +2%
Expense Inflation -
2% Mortality +5% Mortality -5%
Individual Risk Reserve
(Excluding Annuity) 42,506,969 38,255,112 47,358,569 42,778,673 42,236,642 42,720,603 42,319,957 42,617,433 42,396,153
Annuity (PRA) 55,778,785 52,227,597 59,816,927 55,928,430 55,629,140 56,238,521 55,454,480 55,228,590 56,352,814
Annuity (Others) 17,108,076 16,871,193 17,381,090 17,116,822 17,099,330 17,139,661 17,086,920 17,082,479 17,134,772
Investment Linked
Products 18,928,643 18,928,643 18,928,643 18,928,643 18,928,643 18,928,643 18,928,643 18,928,643 18,928,643
Group DA 2,906,733 2,906,733 2,906,733 2,906,733 2,906,733 2,906,733 2,906,733 2,906,733 2,906,733
Group Credit Life 3,419 3,419 3,419 3,419 3,419 3,419 3,419 3,419 3,419
Group Life - UPR 995,695 995,695 995,695 995,695 995,695 995,695 995,695 995,695 995,695
Group Life - AURR 161,302 161,302 161,302 161,302 161,302 161,302 161,302 161,302 161,302
Group Life - IBNR 1,314,217 1,314,217 1,314,217 1,314,217 1,314,217 1,314,217 1,314,217 1,314,217 1,314,217
Group Life -OCR 1,070,531 1,070,531 1,070,531 1,070,531 1,070,531 1,070,531 1,070,531 1,070,531 1,070,531
Additional Reserves 4,452,807 4,452,807 4,452,807 4,452,807 4,452,807 4,452,807 4,452,807 4,452,807 4,452,807
145,227,178 137,187,249 154,389,933 145,657,272 144,798,459 145,932,132 144,694,703 144,761,849 145,717,087
Reinsurance (598,369) (598,369) (598,369) (598,369) (598,369) (598,369) (598,369) (598,369) (598,369)
Net Liability 144,628,809 136,588,880 153,791,564 145,058,903 144,200,090 145,333,763 144,096,334 144,163,479 145,118,718
% change in Net Liability -5.56% 6.34% 0.30% -0.30% 0.49% -0.37% -0.32% 0.34%
Summary Base
Interest rate
+1% Interest rate -1% Expenses +10% Expenses -10%
Expense
Inflation +2%
Expense Inflation -
2% Mortality +5% Mortality -5%
Individual 138,775,281 130,735,352 147,938,036 139,205,376 138,346,563 139,480,235 138,242,807 138,309,952 139,265,190
5,853,528 5,853,528 5,853,528 5,853,528 5,853,528 5,853,528 5,853,528 5,853,528 5,853,528
Net Liability 144,628,809 136,588,880 153,791,564 145,058,903 144,200,090 145,333,763 144,096,334 144,163,479 145,118,718
% change in Liability -5.56% 6.34% 0.30% -0.30% 0.49% -0.37% -0.32% 0.34%
All stresses were applied independently
Stresses not applied to individual reinsurance asset due to immateriality
The mortality stress has been applied in the opposite direction for annuities.
Valuation assumptions on interest rate is based on constant ViR as in prior years
The analysis which follows is performed for reasonably possible movements in key assumptions with all other assumptions held constant, showing the impact on gross and net liabilities, profit before tax and equity. The correlation of assumptions
will have a significant effect in determining the ultimate claims liabilities, but to demonstrate the impact due to changes in assumptions, assumptions had to be changed on an individual basis. It should be noted that movements in these assumptions
are non–linear. Sensitivity information will also vary according to the current economic assumptions, mainly due to the impact of changes to both the intrinsic cost and time value of options and guarantees. When options and guarantees exist, they
are the main reason for the asymmetry of sensitivities.
92
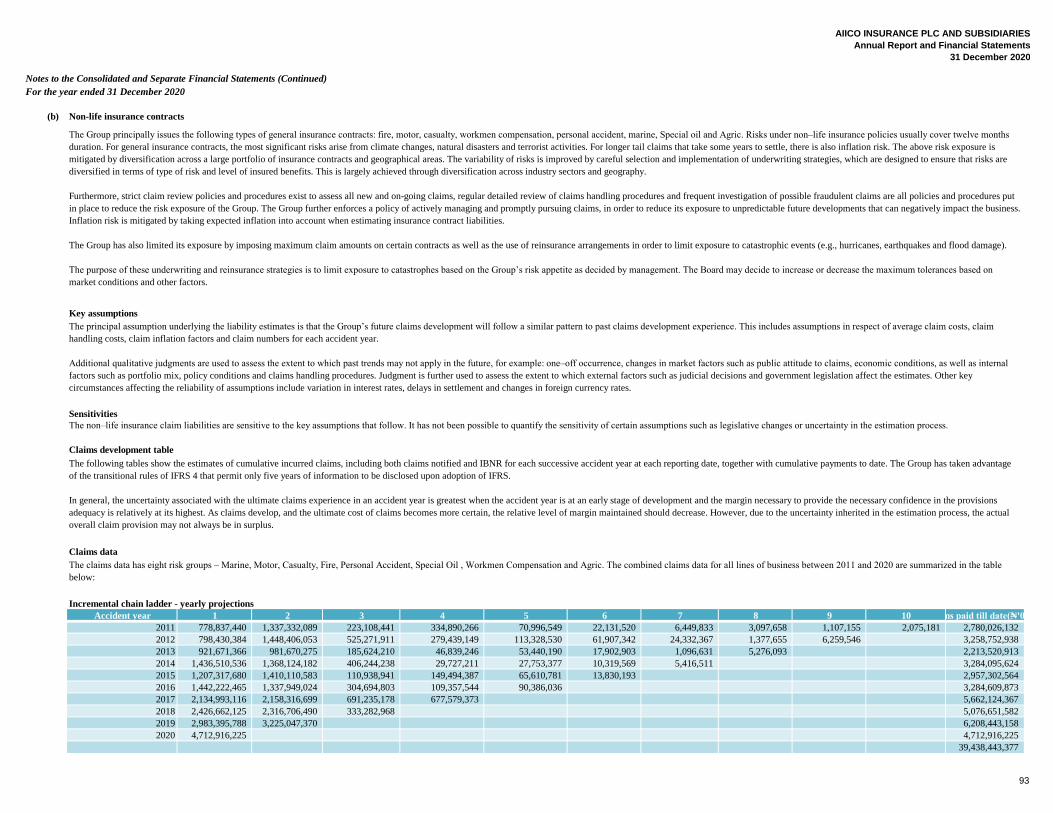
AIICO INSURANCE PLC AND SUBSIDIARIES
Annual Report and Financial Statements
31 December 2020
Notes to the Consolidated and Separate Financial Statements (Continued)
For the year ended 31 December 2020
(b) Non-life insurance contracts
Key assumptions
Sensitivities
Claims development table
Claims data
Incremental chain ladder - yearly projections
Accident year 1 2 3 4 5 6 7 8 9 10 Claims paid till date(₦'000)
2011 778,837,440 1,337,332,089 223,108,441 334,890,266 70,996,549 22,131,520 6,449,833 3,097,658 1,107,155 2,075,181 2,780,026,132
2012 798,430,384 1,448,406,053 525,271,911 279,439,149 113,328,530 61,907,342 24,332,367 1,377,655 6,259,546 3,258,752,938
2013 921,671,366 981,670,275 185,624,210 46,839,246 53,440,190 17,902,903 1,096,631 5,276,093 2,213,520,913
2014 1,436,510,536 1,368,124,182 406,244,238 29,727,211 27,753,377 10,319,569 5,416,511 3,284,095,624
2015 1,207,317,680 1,410,110,583 110,938,941 149,494,387 65,610,781 13,830,193 2,957,302,564
2016 1,442,222,465 1,337,949,024 304,694,803 109,357,544 90,386,036 3,284,609,873
2017 2,134,993,116 2,158,316,699 691,235,178 677,579,373 5,662,124,367
2018 2,426,662,125 2,316,706,490 333,282,968 5,076,651,582
2019 2,983,395,788 3,225,047,370 6,208,443,158
2020 4,712,916,225 4,712,916,225
39,438,443,377
The principal assumption underlying the liability estimates is that the Group’s future claims development will follow a similar pattern to past claims development experience. This includes assumptions in respect of average claim costs, claim
handling costs, claim inflation factors and claim numbers for each accident year.
Additional qualitative judgments are used to assess the extent to which past trends may not apply in the future, for example: one–off occurrence, changes in market factors such as public attitude to claims, economic conditions, as well as internal
factors such as portfolio mix, policy conditions and claims handling procedures. Judgment is further used to assess the extent to which external factors such as judicial decisions and government legislation affect the estimates. Other key
circumstances affecting the reliability of assumptions include variation in interest rates, delays in settlement and changes in foreign currency rates.
The non–life insurance claim liabilities are sensitive to the key assumptions that follow. It has not been possible to quantify the sensitivity of certain assumptions such as legislative changes or uncertainty in the estimation process.
The following tables show the estimates of cumulative incurred claims, including both claims notified and IBNR for each successive accident year at each reporting date, together with cumulative payments to date. The Group has taken advantage
of the transitional rules of IFRS 4 that permit only five years of information to be disclosed upon adoption of IFRS.
In general, the uncertainty associated with the ultimate claims experience in an accident year is greatest when the accident year is at an early stage of development and the margin necessary to provide the necessary confidence in the provisions
adequacy is relatively at its highest. As claims develop, and the ultimate cost of claims becomes more certain, the relative level of margin maintained should decrease. However, due to the uncertainty inherited in the estimation process, the actual
overall claim provision may not always be in surplus.
The claims data has eight risk groups – Marine, Motor, Casualty, Fire, Personal Accident, Special Oil , Workmen Compensation and Agric. The combined claims data for all lines of business between 2011 and 2020 are summarized in the table
below:
The Group principally issues the following types of general insurance contracts: fire, motor, casualty, workmen compensation, personal accident, marine, Special oil and Agric. Risks under non–life insurance policies usually cover twelve months
duration. For general insurance contracts, the most significant risks arise from climate changes, natural disasters and terrorist activities. For longer tail claims that take some years to settle, there is also inflation risk. The above risk exposure is
mitigated by diversification across a large portfolio of insurance contracts and geographical areas. The variability of risks is improved by careful selection and implementation of underwriting strategies, which are designed to ensure that risks are
diversified in terms of type of risk and level of insured benefits. This is largely achieved through diversification across industry sectors and geography.
Furthermore, strict claim review policies and procedures exist to assess all new and on-going claims, regular detailed review of claims handling procedures and frequent investigation of possible fraudulent claims are all policies and procedures put
in place to reduce the risk exposure of the Group. The Group further enforces a policy of actively managing and promptly pursuing claims, in order to reduce its exposure to unpredictable future developments that can negatively impact the business.
Inflation risk is mitigated by taking expected inflation into account when estimating insurance contract liabilities.
The Group has also limited its exposure by imposing maximum claim amounts on certain contracts as well as the use of reinsurance arrangements in order to limit exposure to catastrophic events (e.g., hurricanes, earthquakes and flood damage).
The purpose of these underwriting and reinsurance strategies is to limit exposure to catastrophes based on the Group’s risk appetite as decided by management. The Board may decide to increase or decrease the maximum tolerances based on
market conditions and other factors.
93
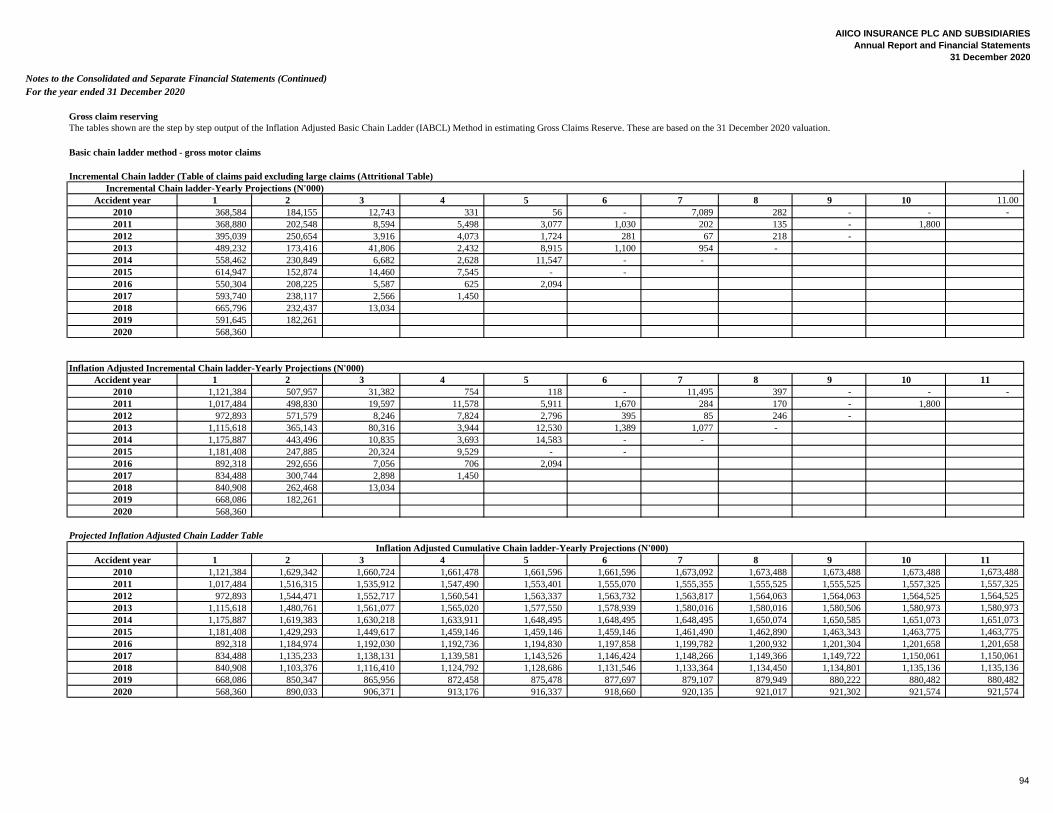
AIICO INSURANCE PLC AND SUBSIDIARIES
Annual Report and Financial Statements
31 December 2020
Notes to the Consolidated and Separate Financial Statements (Continued)
For the year ended 31 December 2020
Gross claim reserving
Basic chain ladder method - gross motor claims
Incremental Chain ladder (Table of claims paid excluding large claims (Attritional Table)
Incremental Chain ladder-Yearly Projections (N'000)
Accident year 1 2 3 4 5 6 7 8 9 10 11.00
2010 368,584 184,155 12,743 331 56 - 7,089 282 - - -
2011 368,880 202,548 8,594 5,498 3,077 1,030 202 135 - 1,800
2012 395,039 250,654 3,916 4,073 1,724 281 67 218 -
2013 489,232 173,416 41,806 2,432 8,915 1,100 954 -
2014 558,462 230,849 6,682 2,628 11,547 - -
2015 614,947 152,874 14,460 7,545 - -
2016 550,304 208,225 5,587 625 2,094
2017 593,740 238,117 2,566 1,450
2018 665,796 232,437 13,034
2019 591,645 182,261
2020 568,360
Inflation Adjusted Incremental Chain ladder-Yearly Projections (N'000)
Accident year 1 2 3 4 5 6 7 8 9 10 11
2010 1,121,384 507,957 31,382 754 118 - 11,495 397 - - -
2011 1,017,484 498,830 19,597 11,578 5,911 1,670 284 170 - 1,800
2012 972,893 571,579 8,246 7,824 2,796 395 85 246 -
2013 1,115,618 365,143 80,316 3,944 12,530 1,389 1,077 -
2014 1,175,887 443,496 10,835 3,693 14,583 - -
2015 1,181,408 247,885 20,324 9,529 - -
2016 892,318 292,656 7,056 706 2,094
2017 834,488 300,744 2,898 1,450
2018 840,908 262,468 13,034
2019 668,086 182,261
2020 568,360
Projected Inflation Adjusted Chain Ladder Table
Accident year 1 2 3 4 5 6 7 8 9 10 11
2010 1,121,384 1,629,342 1,660,724 1,661,478 1,661,596 1,661,596 1,673,092 1,673,488 1,673,488 1,673,488 1,673,488
2011 1,017,484 1,516,315 1,535,912 1,547,490 1,553,401 1,555,070 1,555,355 1,555,525 1,555,525 1,557,325 1,557,325
2012 972,893 1,544,471 1,552,717 1,560,541 1,563,337 1,563,732 1,563,817 1,564,063 1,564,063 1,564,525 1,564,525
2013 1,115,618 1,480,761 1,561,077 1,565,020 1,577,550 1,578,939 1,580,016 1,580,016 1,580,506 1,580,973 1,580,973
2014 1,175,887 1,619,383 1,630,218 1,633,911 1,648,495 1,648,495 1,648,495 1,650,074 1,650,585 1,651,073 1,651,073
2015 1,181,408 1,429,293 1,449,617 1,459,146 1,459,146 1,459,146 1,461,490 1,462,890 1,463,343 1,463,775 1,463,775
2016 892,318 1,184,974 1,192,030 1,192,736 1,194,830 1,197,858 1,199,782 1,200,932 1,201,304 1,201,658 1,201,658
2017 834,488 1,135,233 1,138,131 1,139,581 1,143,526 1,146,424 1,148,266 1,149,366 1,149,722 1,150,061 1,150,061
2018 840,908 1,103,376 1,116,410 1,124,792 1,128,686 1,131,546 1,133,364 1,134,450 1,134,801 1,135,136 1,135,136
2019 668,086 850,347 865,956 872,458 875,478 877,697 879,107 879,949 880,222 880,482 880,482
2020 568,360 890,033 906,371 913,176 916,337 918,660 920,135 921,017 921,302 921,574 921,574
Inflation Adjusted Cumulative Chain ladder-Yearly Projections (N'000)
The tables shown are the step by step output of the Inflation Adjusted Basic Chain Ladder (IABCL) Method in estimating Gross Claims Reserve. These are based on the 31 December 2020 valuation.
94
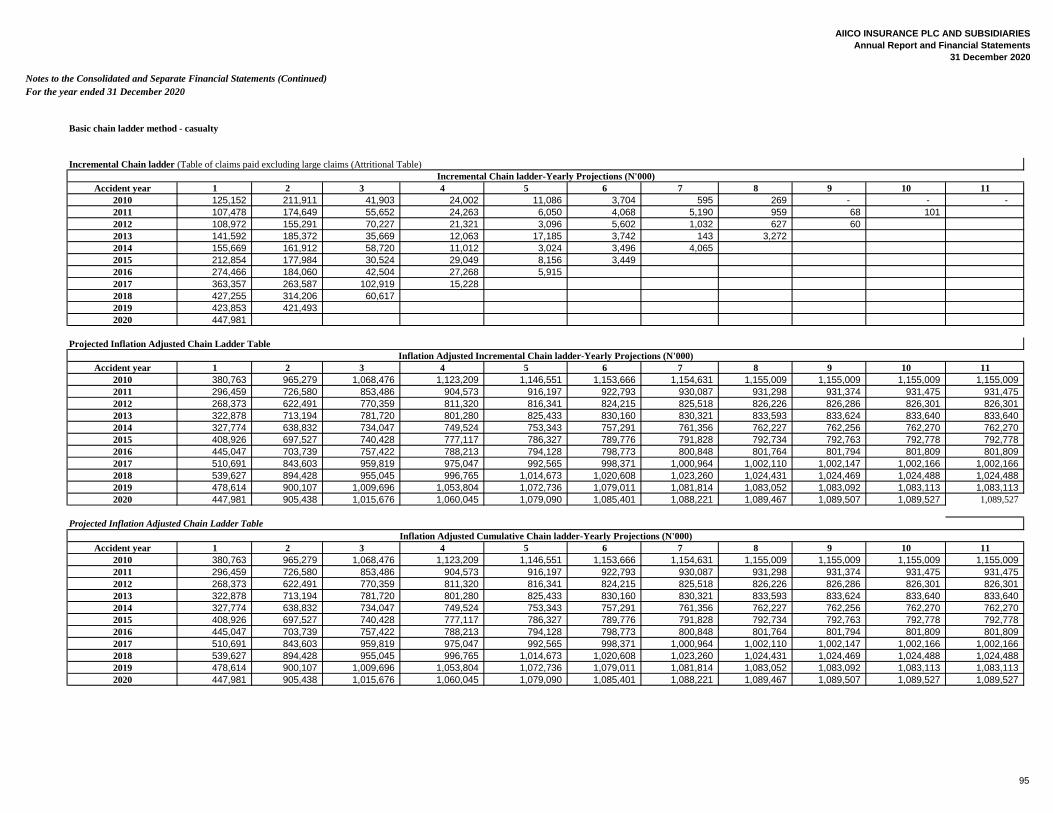
AIICO INSURANCE PLC AND SUBSIDIARIES
Annual Report and Financial Statements
31 December 2020
Notes to the Consolidated and Separate Financial Statements (Continued)
For the year ended 31 December 2020
Basic chain ladder method - casualty
Incremental Chain ladder (Table of claims paid excluding large claims (Attritional Table)
Accident year 1 2 3 4 5 6 7 8 9 10 11
2010 125,152 211,911 41,903 24,002 11,086 3,704 595 269 - - -
2011 107,478 174,649 55,652 24,263 6,050 4,068 5,190 959 68 101
2012 108,972 155,291 70,227 21,321 3,096 5,602 1,032 627 60
2013 141,592 185,372 35,669 12,063 17,185 3,742 143 3,272
2014 155,669 161,912 58,720 11,012 3,024 3,496 4,065
2015 212,854 177,984 30,524 29,049 8,156 3,449
2016 274,466 184,060 42,504 27,268 5,915
2017 363,357 263,587 102,919 15,228
2018 427,255 314,206 60,617
2019 423,853 421,493
2020 447,981
Projected Inflation Adjusted Chain Ladder Table
Accident year 1 2 3 4 5 6 7 8 9 10 11
2010 380,763 965,279 1,068,476 1,123,209 1,146,551 1,153,666 1,154,631 1,155,009 1,155,009 1,155,009 1,155,009
2011 296,459 726,580 853,486 904,573 916,197 922,793 930,087 931,298 931,374 931,475 931,475
2012 268,373 622,491 770,359 811,320 816,341 824,215 825,518 826,226 826,286 826,301 826,301
2013 322,878 713,194 781,720 801,280 825,433 830,160 830,321 833,593 833,624 833,640 833,640
2014 327,774 638,832 734,047 749,524 753,343 757,291 761,356 762,227 762,256 762,270 762,270
2015 408,926 697,527 740,428 777,117 786,327 789,776 791,828 792,734 792,763 792,778 792,778
2016 445,047 703,739 757,422 788,213 794,128 798,773 800,848 801,764 801,794 801,809 801,809
2017 510,691 843,603 959,819 975,047 992,565 998,371 1,000,964 1,002,110 1,002,147 1,002,166 1,002,166
2018 539,627 894,428 955,045 996,765 1,014,673 1,020,608 1,023,260 1,024,431 1,024,469 1,024,488 1,024,488
2019 478,614 900,107 1,009,696 1,053,804 1,072,736 1,079,011 1,081,814 1,083,052 1,083,092 1,083,113 1,083,113
2020 447,981 905,438 1,015,676 1,060,045 1,079,090 1,085,401 1,088,221 1,089,467 1,089,507 1,089,527 1,089,527
Inflation Adjusted Cumulative Chain ladder-Yearly Projections (N'000)
Inflation Adjusted Incremental Chain ladder-Yearly Projections (N'000)
Incremental Chain ladder-Yearly Projections (N'000)
95
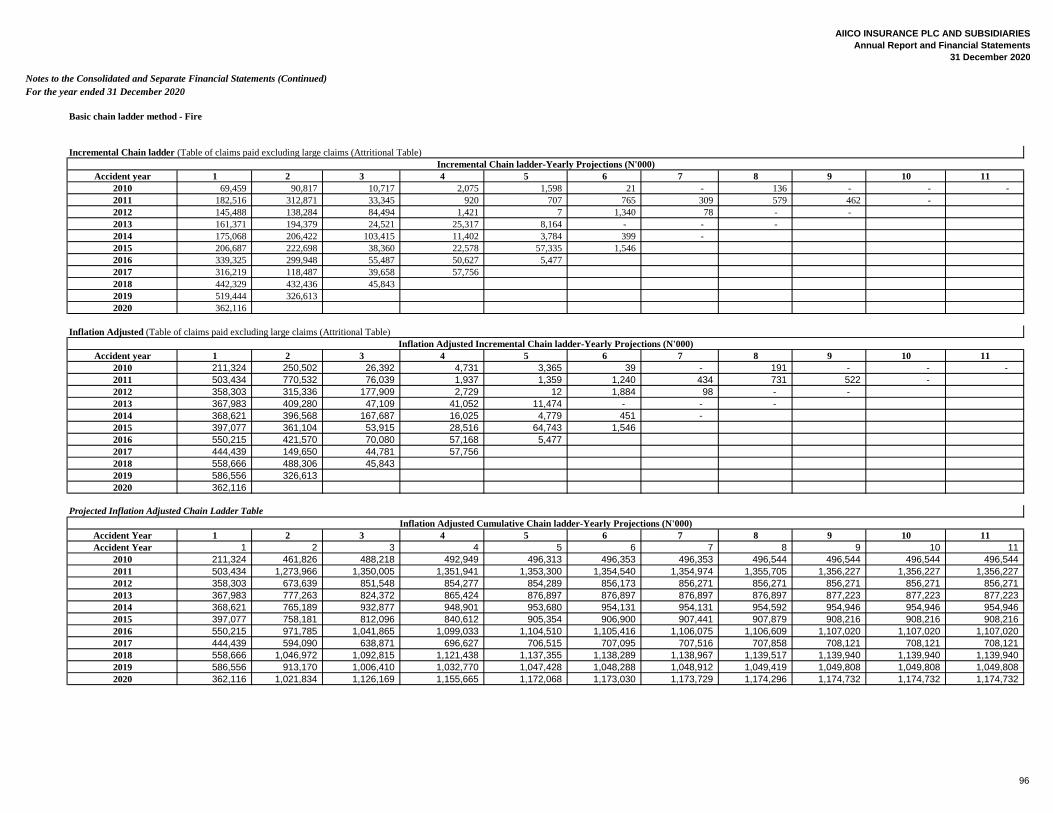
AIICO INSURANCE PLC AND SUBSIDIARIES
Annual Report and Financial Statements
31 December 2020
Notes to the Consolidated and Separate Financial Statements (Continued)
For the year ended 31 December 2020
Basic chain ladder method - Fire
Incremental Chain ladder (Table of claims paid excluding large claims (Attritional Table)
Accident year 1 2 3 4 5 6 7 8 9 10 11
2010 69,459 90,817 10,717 2,075 1,598 21 - 136 - - -
2011 182,516 312,871 33,345 920 707 765 309 579 462 -
2012 145,488 138,284 84,494 1,421 7 1,340 78 - -
2013 161,371 194,379 24,521 25,317 8,164 - - -
2014 175,068 206,422 103,415 11,402 3,784 399 -
2015 206,687 222,698 38,360 22,578 57,335 1,546
2016 339,325 299,948 55,487 50,627 5,477
2017 316,219 118,487 39,658 57,756
2018 442,329 432,436 45,843
2019 519,444 326,613
2020 362,116
Inflation Adjusted (Table of claims paid excluding large claims (Attritional Table)
Accident year 1 2 3 4 5 6 7 8 9 10 11
2010 211,324 250,502 26,392 4,731 3,365 39 - 191 - - -
2011 503,434 770,532 76,039 1,937 1,359 1,240 434 731 522 -
2012 358,303 315,336 177,909 2,729 12 1,884 98 - -
2013 367,983 409,280 47,109 41,052 11,474 - - -
2014 368,621 396,568 167,687 16,025 4,779 451 -
2015 397,077 361,104 53,915 28,516 64,743 1,546
2016 550,215 421,570 70,080 57,168 5,477
2017 444,439 149,650 44,781 57,756
2018 558,666 488,306 45,843
2019 586,556 326,613
2020 362,116
Projected Inflation Adjusted Chain Ladder Table
Accident Year 1 2 3 4 5 6 7 8 9 10 11
Accident Year 1 2 3 4 5 6 7 8 9 10 11
2010 211,324 461,826 488,218 492,949 496,313 496,353 496,353 496,544 496,544 496,544 496,544
2011 503,434 1,273,966 1,350,005 1,351,941 1,353,300 1,354,540 1,354,974 1,355,705 1,356,227 1,356,227 1,356,227
2012 358,303 673,639 851,548 854,277 854,289 856,173 856,271 856,271 856,271 856,271 856,271
2013 367,983 777,263 824,372 865,424 876,897 876,897 876,897 876,897 877,223 877,223 877,223
2014 368,621 765,189 932,877 948,901 953,680 954,131 954,131 954,592 954,946 954,946 954,946
2015 397,077 758,181 812,096 840,612 905,354 906,900 907,441 907,879 908,216 908,216 908,216
2016 550,215 971,785 1,041,865 1,099,033 1,104,510 1,105,416 1,106,075 1,106,609 1,107,020 1,107,020 1,107,020
2017 444,439 594,090 638,871 696,627 706,515 707,095 707,516 707,858 708,121 708,121 708,121
2018 558,666 1,046,972 1,092,815 1,121,438 1,137,355 1,138,289 1,138,967 1,139,517 1,139,940 1,139,940 1,139,940
2019 586,556 913,170 1,006,410 1,032,770 1,047,428 1,048,288 1,048,912 1,049,419 1,049,808 1,049,808 1,049,808
2020 362,116 1,021,834 1,126,169 1,155,665 1,172,068 1,173,030 1,173,729 1,174,296 1,174,732 1,174,732 1,174,732
Inflation Adjusted Incremental Chain ladder-Yearly Projections (N'000)
Inflation Adjusted Cumulative Chain ladder-Yearly Projections (N'000)
Incremental Chain ladder-Yearly Projections (N'000)
96
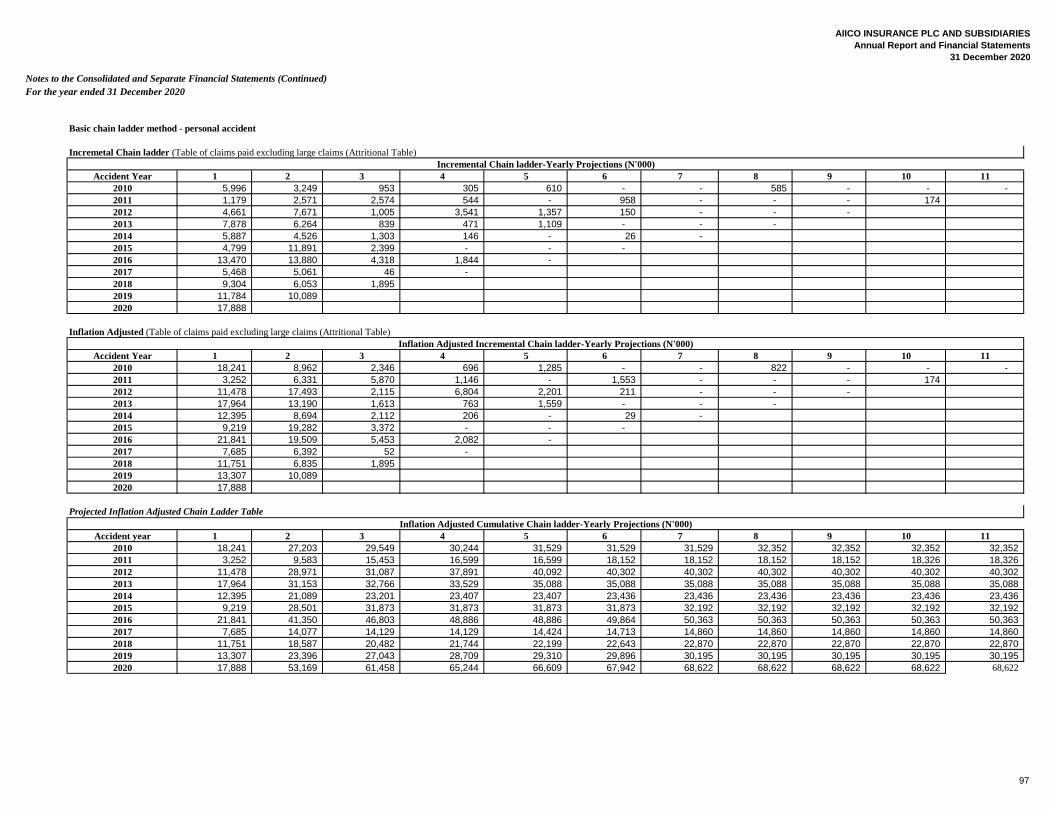
AIICO INSURANCE PLC AND SUBSIDIARIES
Annual Report and Financial Statements
31 December 2020
Notes to the Consolidated and Separate Financial Statements (Continued)
For the year ended 31 December 2020
Basic chain ladder method - personal accident
Incremetal Chain ladder (Table of claims paid excluding large claims (Attritional Table)
Accident Year 1 2 3 4 5 6 7 8 9 10 11
2010 5,996 3,249 953 305 610 - - 585 - - -
2011 1,179 2,571 2,574 544 - 958 - - - 174
2012 4,661 7,671 1,005 3,541 1,357 150 - - -
2013 7,878 6,264 839 471 1,109 - - -
2014 5,887 4,526 1,303 146 - 26 -
2015 4,799 11,891 2,399 - - -
2016 13,470 13,880 4,318 1,844 -
2017 5,468 5,061 46 -
2018 9,304 6,053 1,895
2019 11,784 10,089
2020 17,888
Inflation Adjusted (Table of claims paid excluding large claims (Attritional Table)
Accident Year 1 2 3 4 5 6 7 8 9 10 11
2010 18,241 8,962 2,346 696 1,285 - - 822 - - -
2011 3,252 6,331 5,870 1,146 - 1,553 - - - 174
2012 11,478 17,493 2,115 6,804 2,201 211 - - -
2013 17,964 13,190 1,613 763 1,559 - - -
2014 12,395 8,694 2,112 206 - 29 -
2015 9,219 19,282 3,372 - - -
2016 21,841 19,509 5,453 2,082 -
2017 7,685 6,392 52 -
2018 11,751 6,835 1,895
2019 13,307 10,089
2020 17,888
Projected Inflation Adjusted Chain Ladder Table
Accident year 1 2 3 4 5 6 7 8 9 10 11
2010 18,241 27,203 29,549 30,244 31,529 31,529 31,529 32,352 32,352 32,352 32,352
2011 3,252 9,583 15,453 16,599 16,599 18,152 18,152 18,152 18,152 18,326 18,326
2012 11,478 28,971 31,087 37,891 40,092 40,302 40,302 40,302 40,302 40,302 40,302
2013 17,964 31,153 32,766 33,529 35,088 35,088 35,088 35,088 35,088 35,088 35,088
2014 12,395 21,089 23,201 23,407 23,407 23,436 23,436 23,436 23,436 23,436 23,436
2015 9,219 28,501 31,873 31,873 31,873 31,873 32,192 32,192 32,192 32,192 32,192
2016 21,841 41,350 46,803 48,886 48,886 49,864 50,363 50,363 50,363 50,363 50,363
2017 7,685 14,077 14,129 14,129 14,424 14,713 14,860 14,860 14,860 14,860 14,860
2018 11,751 18,587 20,482 21,744 22,199 22,643 22,870 22,870 22,870 22,870 22,870
2019 13,307 23,396 27,043 28,709 29,310 29,896 30,195 30,195 30,195 30,195 30,195
2020 17,888 53,169 61,458 65,244 66,609 67,942 68,622 68,622 68,622 68,622 68,622
Incremental Chain ladder-Yearly Projections (N'000)
Inflation Adjusted Incremental Chain ladder-Yearly Projections (N'000)
Inflation Adjusted Cumulative Chain ladder-Yearly Projections (N'000)
97
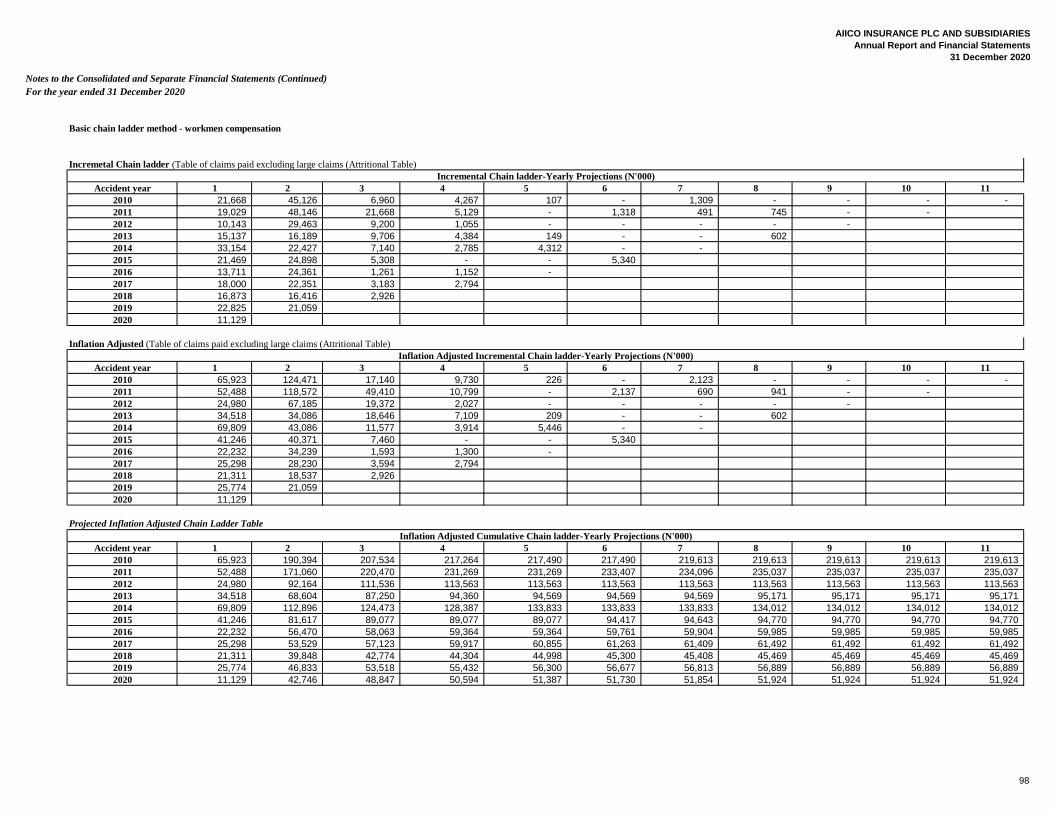
AIICO INSURANCE PLC AND SUBSIDIARIES
Annual Report and Financial Statements
31 December 2020
Notes to the Consolidated and Separate Financial Statements (Continued)
For the year ended 31 December 2020
Basic chain ladder method - workmen compensation
Incremetal Chain ladder (Table of claims paid excluding large claims (Attritional Table)
Accident year 1 2 3 4 5 6 7 8 9 10 11
2010 21,668 45,126 6,960 4,267 107 - 1,309 - - - -
2011 19,029 48,146 21,668 5,129 - 1,318 491 745 - -
2012 10,143 29,463 9,200 1,055 - - - - -
2013 15,137 16,189 9,706 4,384 149 - - 602
2014 33,154 22,427 7,140 2,785 4,312 - -
2015 21,469 24,898 5,308 - - 5,340
2016 13,711 24,361 1,261 1,152 -
2017 18,000 22,351 3,183 2,794
2018 16,873 16,416 2,926
2019 22,825 21,059
2020 11,129
Inflation Adjusted (Table of claims paid excluding large claims (Attritional Table)
Accident year 1 2 3 4 5 6 7 8 9 10 11
2010 65,923 124,471 17,140 9,730 226 - 2,123 - - - -
2011 52,488 118,572 49,410 10,799 - 2,137 690 941 - -
2012 24,980 67,185 19,372 2,027 - - - - -
2013 34,518 34,086 18,646 7,109 209 - - 602
2014 69,809 43,086 11,577 3,914 5,446 - -
2015 41,246 40,371 7,460 - - 5,340
2016 22,232 34,239 1,593 1,300 -
2017 25,298 28,230 3,594 2,794
2018 21,311 18,537 2,926
2019 25,774 21,059
2020 11,129
Projected Inflation Adjusted Chain Ladder Table
Accident year 1 2 3 4 5 6 7 8 9 10 11
2010 65,923 190,394 207,534 217,264 217,490 217,490 219,613 219,613 219,613 219,613 219,613
2011 52,488 171,060 220,470 231,269 231,269 233,407 234,096 235,037 235,037 235,037 235,037
2012 24,980 92,164 111,536 113,563 113,563 113,563 113,563 113,563 113,563 113,563 113,563
2013 34,518 68,604 87,250 94,360 94,569 94,569 94,569 95,171 95,171 95,171 95,171
2014 69,809 112,896 124,473 128,387 133,833 133,833 133,833 134,012 134,012 134,012 134,012
2015 41,246 81,617 89,077 89,077 89,077 94,417 94,643 94,770 94,770 94,770 94,770
2016 22,232 56,470 58,063 59,364 59,364 59,761 59,904 59,985 59,985 59,985 59,985
2017 25,298 53,529 57,123 59,917 60,855 61,263 61,409 61,492 61,492 61,492 61,492
2018 21,311 39,848 42,774 44,304 44,998 45,300 45,408 45,469 45,469 45,469 45,469
2019 25,774 46,833 53,518 55,432 56,300 56,677 56,813 56,889 56,889 56,889 56,889
2020 11,129 42,746 48,847 50,594 51,387 51,730 51,854 51,924 51,924 51,924 51,924
Incremental Chain ladder-Yearly Projections (N'000)
Inflation Adjusted Incremental Chain ladder-Yearly Projections (N'000)
Inflation Adjusted Cumulative Chain ladder-Yearly Projections (N'000)
98
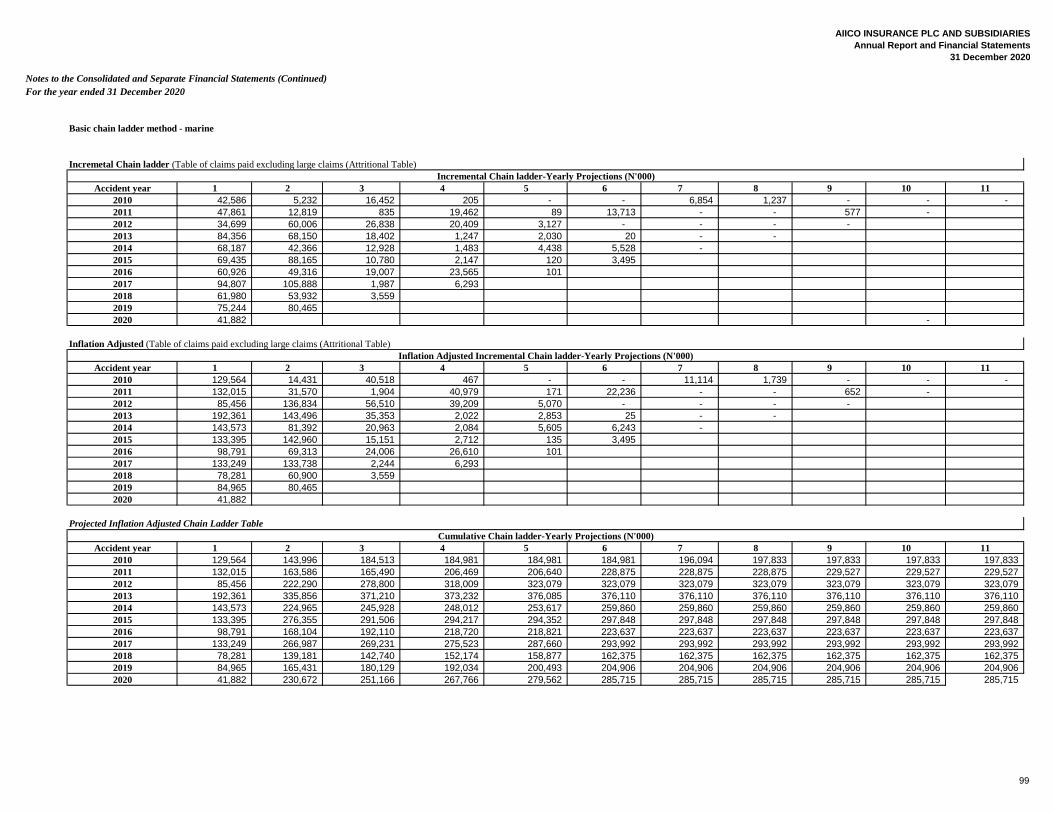
AIICO INSURANCE PLC AND SUBSIDIARIES
Annual Report and Financial Statements
31 December 2020
Notes to the Consolidated and Separate Financial Statements (Continued)
For the year ended 31 December 2020
Basic chain ladder method - marine
Incremetal Chain ladder (Table of claims paid excluding large claims (Attritional Table)
Accident year 1 2 3 4 5 6 7 8 9 10 11
2010 42,586 5,232 16,452 205 - - 6,854 1,237 - - -
2011 47,861 12,819 835 19,462 89 13,713 - - 577 -
2012 34,699 60,006 26,838 20,409 3,127 - - - -
2013 84,356 68,150 18,402 1,247 2,030 20 - -
2014 68,187 42,366 12,928 1,483 4,438 5,528 -
2015 69,435 88,165 10,780 2,147 120 3,495
2016 60,926 49,316 19,007 23,565 101
2017 94,807 105,888 1,987 6,293
2018 61,980 53,932 3,559
2019 75,244 80,465
2020 41,882 -
Inflation Adjusted (Table of claims paid excluding large claims (Attritional Table)
Accident year 1 2 3 4 5 6 7 8 9 10 11
2010 129,564 14,431 40,518 467 - - 11,114 1,739 - - -
2011 132,015 31,570 1,904 40,979 171 22,236 - - 652 -
2012 85,456 136,834 56,510 39,209 5,070 - - - -
2013 192,361 143,496 35,353 2,022 2,853 25 - -
2014 143,573 81,392 20,963 2,084 5,605 6,243 -
2015 133,395 142,960 15,151 2,712 135 3,495
2016 98,791 69,313 24,006 26,610 101
2017 133,249 133,738 2,244 6,293
2018 78,281 60,900 3,559
2019 84,965 80,465
2020 41,882
Projected Inflation Adjusted Chain Ladder Table
Accident year 1 2 3 4 5 6 7 8 9 10 11
2010 129,564 143,996 184,513 184,981 184,981 184,981 196,094 197,833 197,833 197,833 197,833
2011 132,015 163,586 165,490 206,469 206,640 228,875 228,875 228,875 229,527 229,527 229,527
2012 85,456 222,290 278,800 318,009 323,079 323,079 323,079 323,079 323,079 323,079 323,079
2013 192,361 335,856 371,210 373,232 376,085 376,110 376,110 376,110 376,110 376,110 376,110
2014 143,573 224,965 245,928 248,012 253,617 259,860 259,860 259,860 259,860 259,860 259,860
2015 133,395 276,355 291,506 294,217 294,352 297,848 297,848 297,848 297,848 297,848 297,848
2016 98,791 168,104 192,110 218,720 218,821 223,637 223,637 223,637 223,637 223,637 223,637
2017 133,249 266,987 269,231 275,523 287,660 293,992 293,992 293,992 293,992 293,992 293,992
2018 78,281 139,181 142,740 152,174 158,877 162,375 162,375 162,375 162,375 162,375 162,375
2019 84,965 165,431 180,129 192,034 200,493 204,906 204,906 204,906 204,906 204,906 204,906
2020 41,882 230,672 251,166 267,766 279,562 285,715 285,715 285,715 285,715 285,715 285,715
Cumulative Chain ladder-Yearly Projections (N'000)
Incremental Chain ladder-Yearly Projections (N'000)
Inflation Adjusted Incremental Chain ladder-Yearly Projections (N'000)
99
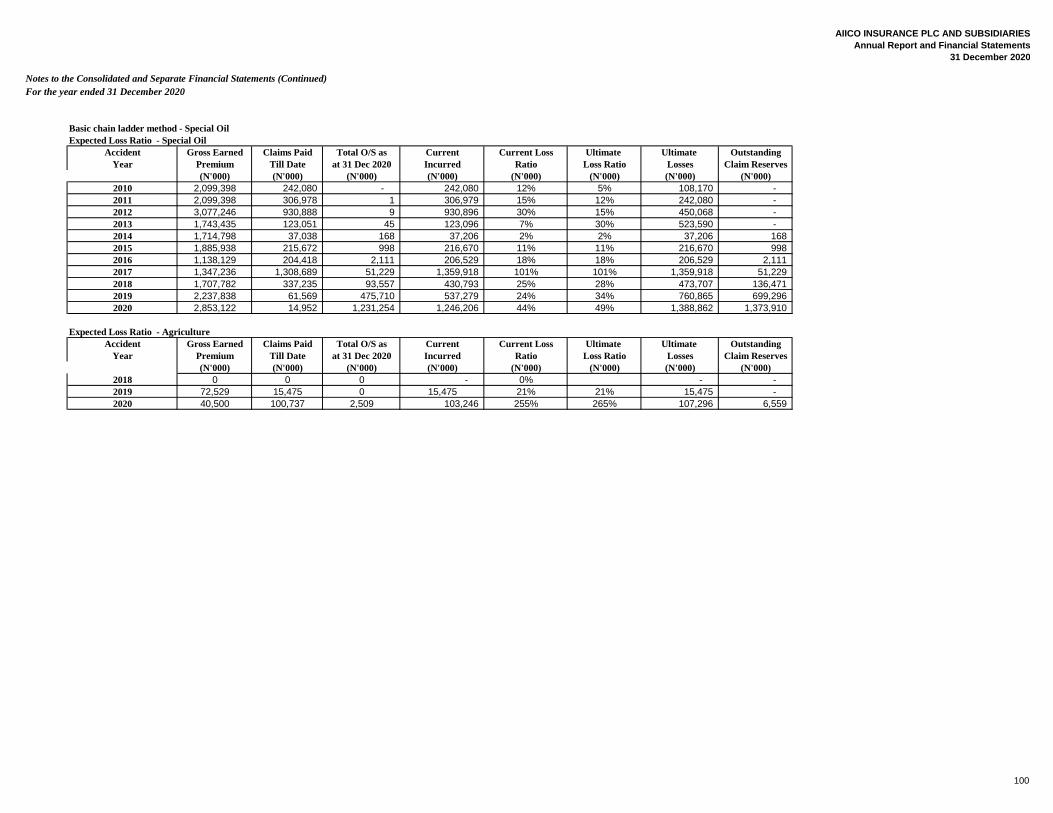
AIICO INSURANCE PLC AND SUBSIDIARIES
Annual Report and Financial Statements
31 December 2020
Notes to the Consolidated and Separate Financial Statements (Continued)
For the year ended 31 December 2020
Basic chain ladder method - Special Oil
Expected Loss Ratio - Special Oil
Accident Gross Earned Claims Paid Total O/S as Current Current Loss Ultimate Ultimate Outstanding
Year Premium Till Date at 31 Dec 2020 Incurred Ratio Loss Ratio Losses Claim Reserves
(N'000) (N'000) (N'000) (N'000) (N'000) (N'000) (N'000) (N'000)
2010 2,099,398 242,080 - 242,080 12% 5% 108,170 -
2011 2,099,398 306,978 1 306,979 15% 12% 242,080 -
2012 3,077,246 930,888 9 930,896 30% 15% 450,068 -
2013 1,743,435 123,051 45 123,096 7% 30% 523,590 -
2014 1,714,798 37,038 168 37,206 2% 2% 37,206 168
2015 1,885,938 215,672 998 216,670 11% 11% 216,670 998
2016 1,138,129 204,418 2,111 206,529 18% 18% 206,529 2,111
2017 1,347,236 1,308,689 51,229 1,359,918 101% 101% 1,359,918 51,229
2018 1,707,782 337,235 93,557 430,793 25% 28% 473,707 136,471
2019 2,237,838 61,569 475,710 537,279 24% 34% 760,865 699,296
2020 2,853,122 14,952 1,231,254 1,246,206 44% 49% 1,388,862 1,373,910
Expected Loss Ratio - Agriculture
Accident Gross Earned Claims Paid Total O/S as Current Current Loss Ultimate Ultimate Outstanding
Year Premium Till Date at 31 Dec 2020 Incurred Ratio Loss Ratio Losses Claim Reserves
(N'000) (N'000) (N'000) (N'000) (N'000) (N'000) (N'000) (N'000)
2018 0 0 0 - 0% - -
2019 72,529 15,475 0 15,475 21% 21% 15,475 -
2020 40,500 100,737 2,509 103,246 255% 265% 107,296 6,559
100
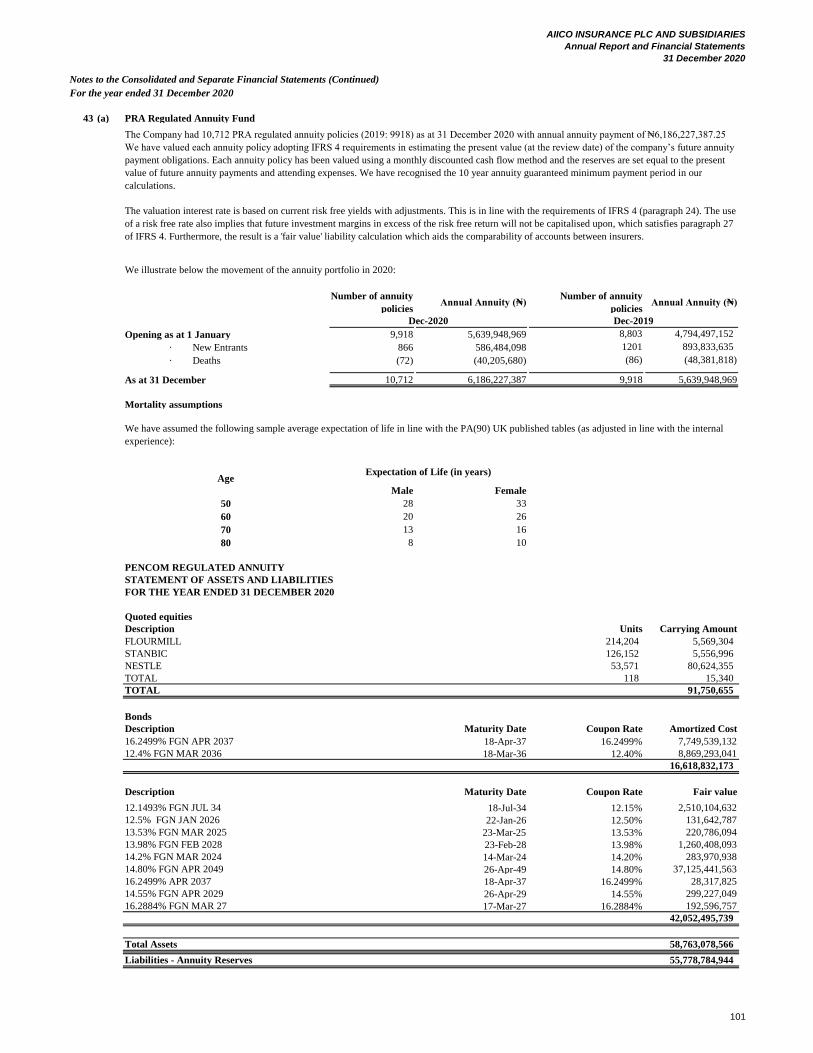
AIICO INSURANCE PLC AND SUBSIDIARIES
Annual Report and Financial Statements
31 December 2020
Notes to the Consolidated and Separate Financial Statements (Continued)
For the year ended 31 December 2020
43 (a) PRA Regulated Annuity Fund
We illustrate below the movement of the annuity portfolio in 2020:
Number of annuity
policiesAnnual Annuity (₦)
Number of annuity
policiesAnnual Annuity (₦)
Opening as at 1 January 9,918 5,639,948,969 8,803 4,794,497,152
· New Entrants 866 586,484,098 1201 893,833,635
· Deaths (72) (40,205,680) (86) (48,381,818)
As at 31 December 10,712 6,186,227,387 9,918 5,639,948,969
Mortality assumptions
Male Female
50 28 33
60 20 26
70 13 16
80 8 10
PENCOM REGULATED ANNUITY
STATEMENT OF ASSETS AND LIABILITIES
FOR THE YEAR ENDED 31 DECEMBER 2020
Quoted equities
Description Units Carrying Amount
FLOURMILL 214,204 5,569,304
STANBIC 126,152 5,556,996
NESTLE 53,571 80,624,355
TOTAL 118 15,340
TOTAL 91,750,655
Bonds
Description Maturity Date Coupon Rate Amortized Cost
16.2499% FGN APR 2037 18-Apr-37 16.2499% 7,749,539,132
12.4% FGN MAR 2036 18-Mar-36 12.40% 8,869,293,041
16,618,832,173
Description Maturity Date Coupon Rate Fair value
12.1493% FGN JUL 34 18-Jul-34 12.15% 2,510,104,632
12.5% FGN JAN 2026 22-Jan-26 12.50% 131,642,787
13.53% FGN MAR 2025 23-Mar-25 13.53% 220,786,094
13.98% FGN FEB 2028 23-Feb-28 13.98% 1,260,408,093
14.2% FGN MAR 2024 14-Mar-24 14.20% 283,970,938
14.80% FGN APR 2049 26-Apr-49 14.80% 37,125,441,563
16.2499% APR 2037 18-Apr-37 16.2499% 28,317,825
14.55% FGN APR 2029 26-Apr-29 14.55% 299,227,049
16.2884% FGN MAR 27 17-Mar-27 16.2884% 192,596,757
42,052,495,739
Total Assets 58,763,078,566
Liabilities - Annuity Reserves 55,778,784,944
AgeExpectation of Life (in years)
The Company had 10,712 PRA regulated annuity policies (2019: 9918) as at 31 December 2020 with annual annuity payment of ₦6,186,227,387.25
We have valued each annuity policy adopting IFRS 4 requirements in estimating the present value (at the review date) of the company’s future annuity
payment obligations. Each annuity policy has been valued using a monthly discounted cash flow method and the reserves are set equal to the present
value of future annuity payments and attending expenses. We have recognised the 10 year annuity guaranteed minimum payment period in our
calculations.
The valuation interest rate is based on current risk free yields with adjustments. This is in line with the requirements of IFRS 4 (paragraph 24). The use
of a risk free rate also implies that future investment margins in excess of the risk free return will not be capitalised upon, which satisfies paragraph 27
of IFRS 4. Furthermore, the result is a 'fair value' liability calculation which aids the comparability of accounts between insurers.
Dec-2020 Dec-2019
We have assumed the following sample average expectation of life in line with the PA(90) UK published tables (as adjusted in line with the internal
experience):
101

OTHER NATIONAL DISCLOSURES
99
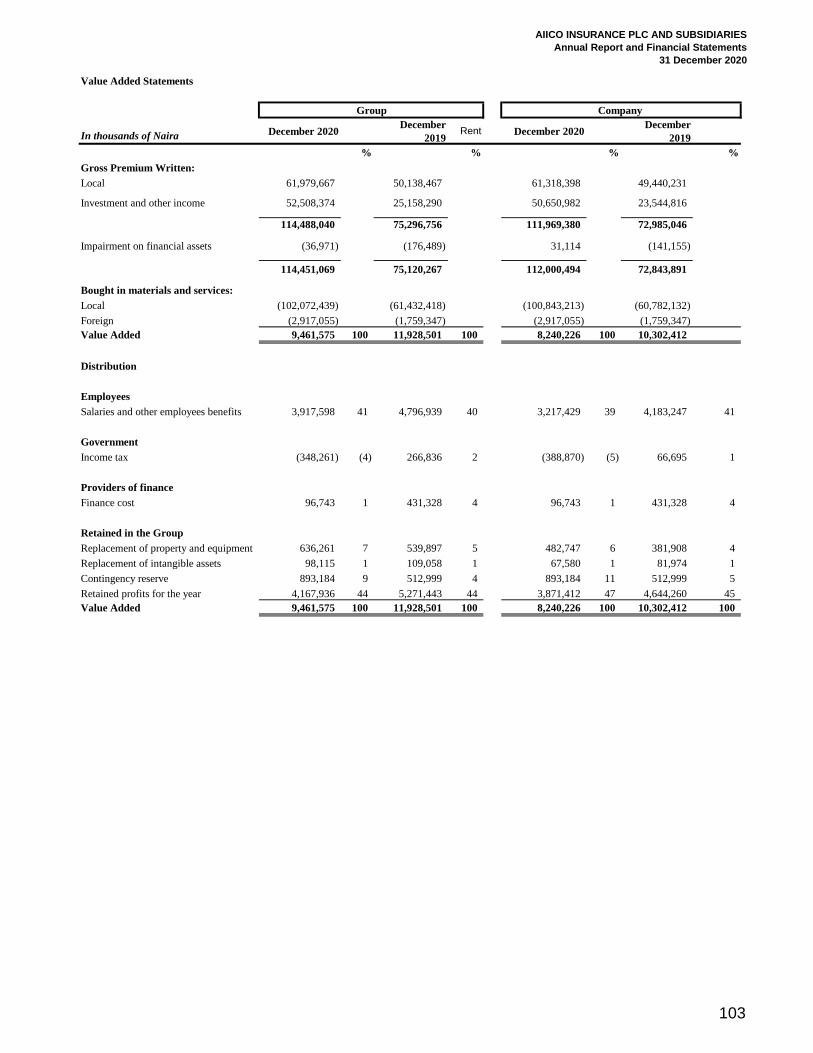
AIICO INSURANCE PLC AND SUBSIDIARIES
Annual Report and Financial Statements
31 December 2020
Value Added Statements
In thousands of Naira December 2020 December
2019Rent December 2020
December
2019
% % % %
Gross Premium Written:
Local 61,979,667 50,138,467 61,318,398 49,440,231
Investment and other income 52,508,374 25,158,290 50,650,982 23,544,816
114,488,040 75,296,756 111,969,380 72,985,046
Impairment on financial assets (36,971) (176,489) 31,114 (141,155)
114,451,069 75,120,267 112,000,494 72,843,891
Bought in materials and services:
Local (102,072,439) (61,432,418) (100,843,213) (60,782,132)
Foreign (2,917,055) (1,759,347) (2,917,055) (1,759,347)
Value Added 9,461,575 100 11,928,501 100 8,240,226 100 10,302,412
Distribution
Employees
Salaries and other employees benefits 3,917,598 41 4,796,939 40 3,217,429 39 4,183,247 41
Government
Income tax (348,261) (4) 266,836 2 (388,870) (5) 66,695 1
Providers of finance
Finance cost 96,743 1 431,328 4 96,743 1 431,328 4
Retained in the Group
Replacement of property and equipment 636,261 7 539,897 5 482,747 6 381,908 4
Replacement of intangible assets 98,115 1 109,058 1 67,580 1 81,974 1
Contingency reserve 893,184 9 512,999 4 893,184 11 512,999 5
Retained profits for the year 4,167,936 44 5,271,443 44 3,871,412 47 4,644,260 45
Value Added 9,461,575 100 11,928,501 100 8,240,226 100 10,302,412 100
Company Group
103
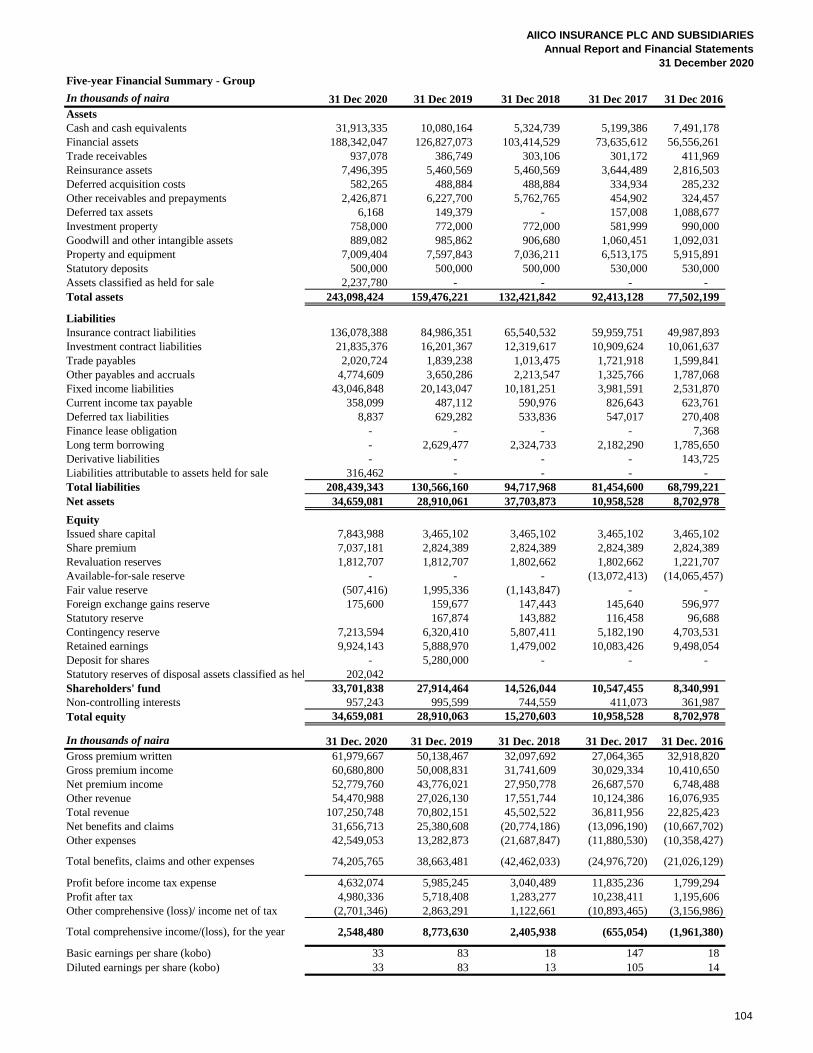
AIICO INSURANCE PLC AND SUBSIDIARIES
Annual Report and Financial Statements
31 December 2020
Five-year Financial Summary - Group
In thousands of naira 31 Dec 2020 31 Dec 2019 31 Dec 2018 31 Dec 2017 31 Dec 2016
Assets
Cash and cash equivalents 31,913,335 10,080,164 5,324,739 5,199,386 7,491,178
Financial assets 188,342,047 126,827,073 103,414,529 73,635,612 56,556,261
Trade receivables 937,078 386,749 303,106 301,172 411,969
Reinsurance assets 7,496,395 5,460,569 5,460,569 3,644,489 2,816,503
Deferred acquisition costs 582,265 488,884 488,884 334,934 285,232
Other receivables and prepayments 2,426,871 6,227,700 5,762,765 454,902 324,457
Deferred tax assets 6,168 149,379 - 157,008 1,088,677
Investment property 758,000 772,000 772,000 581,999 990,000
Goodwill and other intangible assets 889,082 985,862 906,680 1,060,451 1,092,031
Property and equipment 7,009,404 7,597,843 7,036,211 6,513,175 5,915,891
Statutory deposits 500,000 500,000 500,000 530,000 530,000
Assets classified as held for sale 2,237,780 - - - -
Total assets 243,098,424 159,476,221 132,421,842 92,413,128 77,502,199
Liabilities
Insurance contract liabilities 136,078,388 84,986,351 65,540,532 59,959,751 49,987,893
Investment contract liabilities 21,835,376 16,201,367 12,319,617 10,909,624 10,061,637
Trade payables 2,020,724 1,839,238 1,013,475 1,721,918 1,599,841
Other payables and accruals 4,774,609 3,650,286 2,213,547 1,325,766 1,787,068
Fixed income liabilities 43,046,848 20,143,047 10,181,251 3,981,591 2,531,870
Current income tax payable 358,099 487,112 590,976 826,643 623,761
Deferred tax liabilities 8,837 629,282 533,836 547,017 270,408
Finance lease obligation - - - - 7,368
Long term borrowing - 2,629,477 2,324,733 2,182,290 1,785,650
Derivative liabilities - - - - 143,725
Liabilities attributable to assets held for sale 316,462 - - - -
Total liabilities 208,439,343 130,566,160 94,717,968 81,454,600 68,799,221
Net assets 34,659,081 28,910,061 37,703,873 10,958,528 8,702,978
Equity
Issued share capital 7,843,988 3,465,102 3,465,102 3,465,102 3,465,102
Share premium 7,037,181 2,824,389 2,824,389 2,824,389 2,824,389
Revaluation reserves 1,812,707 1,812,707 1,802,662 1,802,662 1,221,707
Available-for-sale reserve - - - (13,072,413) (14,065,457)
Fair value reserve (507,416) 1,995,336 (1,143,847) - -
Foreign exchange gains reserve 175,600 159,677 147,443 145,640 596,977
Statutory reserve 167,874 143,882 116,458 96,688
Contingency reserve 7,213,594 6,320,410 5,807,411 5,182,190 4,703,531
Retained earnings 9,924,143 5,888,970 1,479,002 10,083,426 9,498,054
Deposit for shares - 5,280,000 - - -
Statutory reserves of disposal assets classified as held for sale202,042
Shareholders' fund 33,701,838 27,914,464 14,526,044 10,547,455 8,340,991
Non-controlling interests 957,243 995,599 744,559 411,073 361,987
Total equity 34,659,081 28,910,063 15,270,603 10,958,528 8,702,978
In thousands of naira 31 Dec. 2020 31 Dec. 2019 31 Dec. 2018 31 Dec. 2017 31 Dec. 2016
Gross premium written 61,979,667 50,138,467 32,097,692 27,064,365 32,918,820
Gross premium income 60,680,800 50,008,831 31,741,609 30,029,334 10,410,650
Net premium income 52,779,760 43,776,021 27,950,778 26,687,570 6,748,488
Other revenue 54,470,988 27,026,130 17,551,744 10,124,386 16,076,935
Total revenue 107,250,748 70,802,151 45,502,522 36,811,956 22,825,423
Net benefits and claims 31,656,713 25,380,608 (20,774,186) (13,096,190) (10,667,702)
Other expenses 42,549,053 13,282,873 (21,687,847) (11,880,530) (10,358,427)
74,205,765 38,663,481 (42,462,033) (24,976,720) (21,026,129)
Profit before income tax expense 4,632,074 5,985,245 3,040,489 11,835,236 1,799,294
Profit after tax 4,980,336 5,718,408 1,283,277 10,238,411 1,195,606
Other comprehensive (loss)/ income net of tax (2,701,346) 2,863,291 1,122,661 (10,893,465) (3,156,986)
2,548,480 8,773,630 2,405,938 (655,054) (1,961,380)
Basic earnings per share (kobo) 33 83 18 147 18
Diluted earnings per share (kobo) 33 83 13 105 14
Total benefits, claims and other expenses
Total comprehensive income/(loss), for the year
104
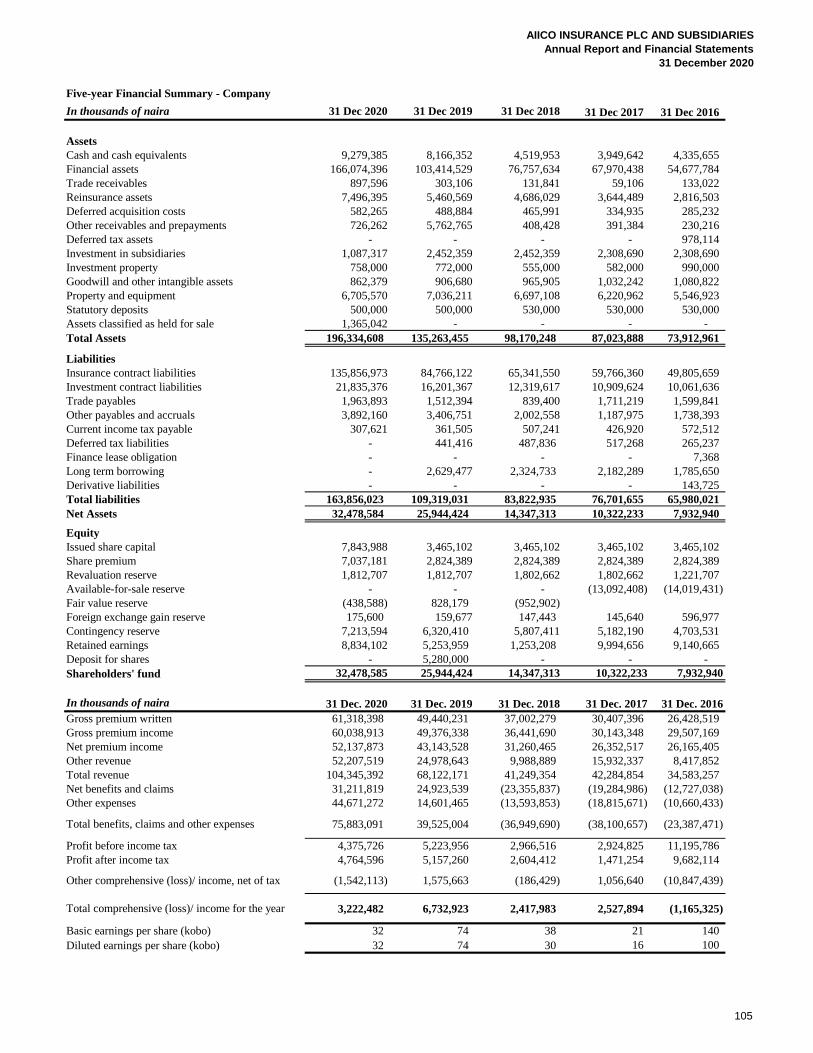
AIICO INSURANCE PLC AND SUBSIDIARIES
Annual Report and Financial Statements
31 December 2020
Five-year Financial Summary - Company
In thousands of naira 31 Dec 2020 31 Dec 2019 31 Dec 2018 31 Dec 2017 31 Dec 2016
Assets
Cash and cash equivalents 9,279,385 8,166,352 4,519,953 3,949,642 4,335,655
Financial assets 166,074,396 103,414,529 76,757,634 67,970,438 54,677,784
Trade receivables 897,596 303,106 131,841 59,106 133,022
Reinsurance assets 7,496,395 5,460,569 4,686,029 3,644,489 2,816,503
Deferred acquisition costs 582,265 488,884 465,991 334,935 285,232
Other receivables and prepayments 726,262 5,762,765 408,428 391,384 230,216
Deferred tax assets - - - - 978,114
Investment in subsidiaries 1,087,317 2,452,359 2,452,359 2,308,690 2,308,690
Investment property 758,000 772,000 555,000 582,000 990,000
Goodwill and other intangible assets 862,379 906,680 965,905 1,032,242 1,080,822
Property and equipment 6,705,570 7,036,211 6,697,108 6,220,962 5,546,923
Statutory deposits 500,000 500,000 530,000 530,000 530,000
Assets classified as held for sale 1,365,042 - - - -
Total Assets 196,334,608 135,263,455 98,170,248 87,023,888 73,912,961
Liabilities
Insurance contract liabilities 135,856,973 84,766,122 65,341,550 59,766,360 49,805,659
Investment contract liabilities 21,835,376 16,201,367 12,319,617 10,909,624 10,061,636
Trade payables 1,963,893 1,512,394 839,400 1,711,219 1,599,841
Other payables and accruals 3,892,160 3,406,751 2,002,558 1,187,975 1,738,393
Current income tax payable 307,621 361,505 507,241 426,920 572,512
Deferred tax liabilities - 441,416 487,836 517,268 265,237
Finance lease obligation - - - - 7,368
Long term borrowing - 2,629,477 2,324,733 2,182,289 1,785,650
Derivative liabilities - - - - 143,725
Total liabilities 163,856,023 109,319,031 83,822,935 76,701,655 65,980,021
Net Assets 32,478,584 25,944,424 14,347,313 10,322,233 7,932,940
Equity
Issued share capital 7,843,988 3,465,102 3,465,102 3,465,102 3,465,102
Share premium 7,037,181 2,824,389 2,824,389 2,824,389 2,824,389
Revaluation reserve 1,812,707 1,812,707 1,802,662 1,802,662 1,221,707
Available-for-sale reserve - - - (13,092,408) (14,019,431)
Fair value reserve (438,588) 828,179 (952,902)
Foreign exchange gain reserve 175,600 159,677 147,443 145,640 596,977
Contingency reserve 7,213,594 6,320,410 5,807,411 5,182,190 4,703,531
Retained earnings 8,834,102 5,253,959 1,253,208 9,994,656 9,140,665
Deposit for shares - 5,280,000 - - -
Shareholders' fund 32,478,585 25,944,424 14,347,313 10,322,233 7,932,940
In thousands of naira 31 Dec. 2020 31 Dec. 2019 31 Dec. 2018 31 Dec. 2017 31 Dec. 2016
Gross premium written 61,318,398 49,440,231 37,002,279 30,407,396 26,428,519
Gross premium income 60,038,913 49,376,338 36,441,690 30,143,348 29,507,169
Net premium income 52,137,873 43,143,528 31,260,465 26,352,517 26,165,405
Other revenue 52,207,519 24,978,643 9,988,889 15,932,337 8,417,852
Total revenue 104,345,392 68,122,171 41,249,354 42,284,854 34,583,257
Net benefits and claims 31,211,819 24,923,539 (23,355,837) (19,284,986) (12,727,038)
Other expenses 44,671,272 14,601,465 (13,593,853) (18,815,671) (10,660,433)
75,883,091 39,525,004 (36,949,690) (38,100,657) (23,387,471)
Profit before income tax 4,375,726 5,223,956 2,966,516 2,924,825 11,195,786
Profit after income tax 4,764,596 5,157,260 2,604,412 1,471,254 9,682,114
Other comprehensive (loss)/ income, net of tax (1,542,113) 1,575,663 (186,429) 1,056,640 (10,847,439)
3,222,482 6,732,923 2,417,983 2,527,894 (1,165,325)
Basic earnings per share (kobo) 32 74 38 21 140
Diluted earnings per share (kobo) 32 74 30 16 100
Total benefits, claims and other expenses
Total comprehensive (loss)/ income for the year
105
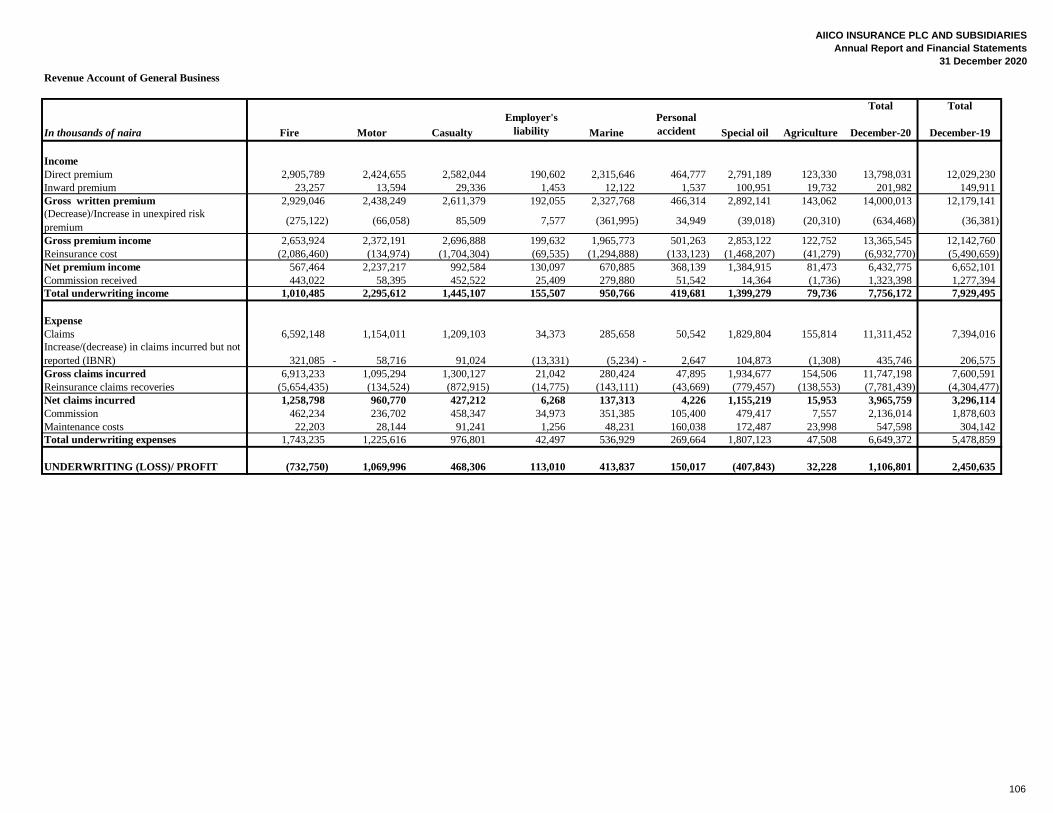
AIICO INSURANCE PLC AND SUBSIDIARIES
Annual Report and Financial Statements
31 December 2020
Revenue Account of General Business
Total Total
In thousands of naira Fire Motor Casualty
Employer's
liability Marine
Personal
accident Special oil Agriculture December-20 December-19
Income
Direct premium 2,905,789 2,424,655 2,582,044 190,602 2,315,646 464,777 2,791,189 123,330 13,798,031 12,029,230
Inward premium 23,257 13,594 29,336 1,453 12,122 1,537 100,951 19,732 201,982 149,911
Gross written premium 2,929,046 2,438,249 2,611,379 192,055 2,327,768 466,314 2,892,141 143,062 14,000,013 12,179,141
(Decrease)/Increase in unexpired risk
premium(275,122) (66,058) 85,509 7,577 (361,995) 34,949 (39,018) (20,310) (634,468) (36,381)
Gross premium income 2,653,924 2,372,191 2,696,888 199,632 1,965,773 501,263 2,853,122 122,752 13,365,545 12,142,760
Reinsurance cost (2,086,460) (134,974) (1,704,304) (69,535) (1,294,888) (133,123) (1,468,207) (41,279) (6,932,770) (5,490,659)
Net premium income 567,464 2,237,217 992,584 130,097 670,885 368,139 1,384,915 81,473 6,432,775 6,652,101
Commission received 443,022 58,395 452,522 25,409 279,880 51,542 14,364 (1,736) 1,323,398 1,277,394
Total underwriting income 1,010,485 2,295,612 1,445,107 155,507 950,766 419,681 1,399,279 79,736 7,756,172 7,929,495
Expense
Claims 6,592,148 1,154,011 1,209,103 34,373 285,658 50,542 1,829,804 155,814 11,311,452 7,394,016
Increase/(decrease) in claims incurred but not
reported (IBNR) 321,085 58,716- 91,024 (13,331) (5,234) 2,647- 104,873 (1,308) 435,746 206,575
Gross claims incurred 6,913,233 1,095,294 1,300,127 21,042 280,424 47,895 1,934,677 154,506 11,747,198 7,600,591
Reinsurance claims recoveries (5,654,435) (134,524) (872,915) (14,775) (143,111) (43,669) (779,457) (138,553) (7,781,439) (4,304,477)
Net claims incurred 1,258,798 960,770 427,212 6,268 137,313 4,226 1,155,219 15,953 3,965,759 3,296,114
Commission 462,234 236,702 458,347 34,973 351,385 105,400 479,417 7,557 2,136,014 1,878,603
Maintenance costs 22,203 28,144 91,241 1,256 48,231 160,038 172,487 23,998 547,598 304,142
Total underwriting expenses 1,743,235 1,225,616 976,801 42,497 536,929 269,664 1,807,123 47,508 6,649,372 5,478,859
UNDERWRITING (LOSS)/ PROFIT (732,750) 1,069,996 468,306 113,010 413,837 150,017 (407,843) 32,228 1,106,801 2,450,635
106
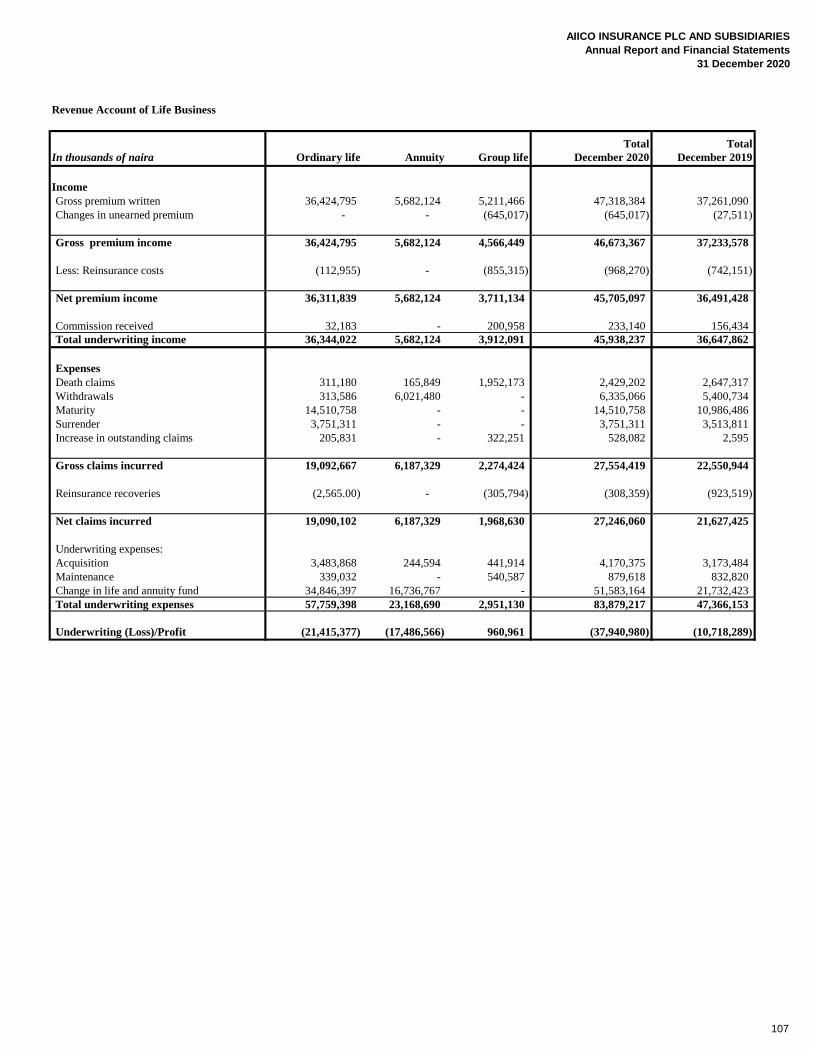
AIICO INSURANCE PLC AND SUBSIDIARIES
Annual Report and Financial Statements
31 December 2020
Revenue Account of Life Business
Total Total
In thousands of naira Ordinary life Annuity Group life December 2020 December 2019
Income
Gross premium written 36,424,795 5,682,124 5,211,466 47,318,384 37,261,090
Changes in unearned premium - - (645,017) (645,017) (27,511)
Gross premium income 36,424,795 5,682,124 4,566,449 46,673,367 37,233,578
Less: Reinsurance costs (112,955) - (855,315) (968,270) (742,151)
Net premium income 36,311,839 5,682,124 3,711,134 45,705,097 36,491,428
Commission received 32,183 - 200,958 233,140 156,434
Total underwriting income 36,344,022 5,682,124 3,912,091 45,938,237 36,647,862
Expenses
Death claims 311,180 165,849 1,952,173 2,429,202 2,647,317
Withdrawals 313,586 6,021,480 - 6,335,066 5,400,734
Maturity 14,510,758 - - 14,510,758 10,986,486
Surrender 3,751,311 - - 3,751,311 3,513,811
Increase in outstanding claims 205,831 - 322,251 528,082 2,595
Gross claims incurred 19,092,667 6,187,329 2,274,424 27,554,419 22,550,944
Reinsurance recoveries (2,565.00) - (305,794) (308,359) (923,519)
Net claims incurred 19,090,102 6,187,329 1,968,630 27,246,060 21,627,425
Underwriting expenses:
Acquisition 3,483,868 244,594 441,914 4,170,375 3,173,484
Maintenance 339,032 - 540,587 879,618 832,820
Change in life and annuity fund 34,846,397 16,736,767 - 51,583,164 21,732,423
Total underwriting expenses 57,759,398 23,168,690 2,951,130 83,879,217 47,366,153
Underwriting (Loss)/Profit (21,415,377) (17,486,566) 960,961 (37,940,980) (10,718,289)
107