Embed Size (px)
Citation preview

Aid for Trade and Regional Integration as Means for Accelerating Development of LLDCs
2nd UN CONFERENCE ON LLDCs
Vienna, Austria – 4 November 2014 (8.15 - 9.45)
Jaime de Melo
FERDI
1

2 2
AID FOR TRADE What have we learnt? Which way ahead?
(e-book at http://www.ferdi.fr/en/publication/ouv-aid-trade-what-have-we-learnt-which-way-ahead )
What do we know about LLDC needs? Any Lessons?
I - Aid for Trade: Looking Ahead Olivier Cadot and Jaime de Melo
II - Evaluation in Aid for Trade: From Case Study Counting to Measuring
Olivier Cadot and Jaime de Melo
III - Aid for Trade: What can we Learn from the Case Studies? Richard Newfarmer
IV - Diagnostic Trade Integration Studies and their Updates under the
Enhanced Integrated Framework – A Retrospective Paul Brenton and Ian Gillson

3
What Have we Learnt about Trade Costs? Reduction in trade costs account for about 1/3 of growth in trade
Evolution of simulated trade costs from a gravity equation (sample of 118 countries) Trade Costs have fallen less rapidly for low income countries….
Low income
High Income
4
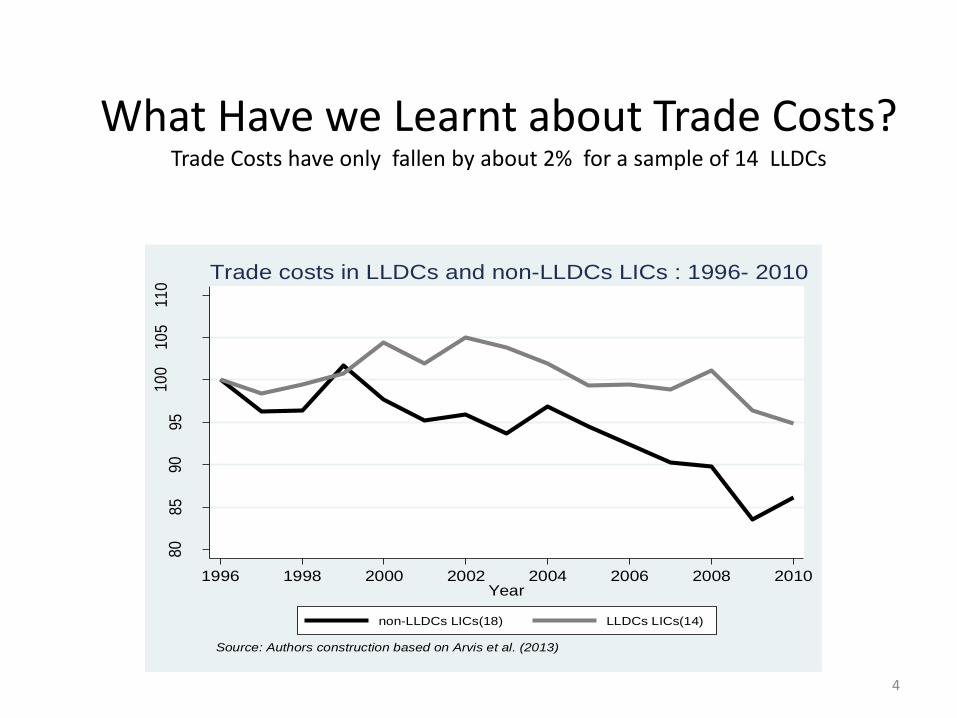
What Have we Learnt about Trade Costs? Trade Costs have only fallen by about 2% for a sample of 14 LLDCs
80
85
90
95
10
010
511
0
Tra
de
co
sts
1996 1998 2000 2002 2004 2006 2008 2010Year
non-LLDCs LICs(18) LLDCs LICs(14)
Source: Authors construction based on Arvis et al. (2013)
Trade costs in LLDCs and non-LLDCs LICs : 1996- 2010

5 5
THE VICIOUS CIRCLE OF LLDCS INFRASTRUCTURE NETWORKS

6
0.2
.4.6
.8
Perc
ent
1985 1987 1989 1991 1993 1995 1997 1999 2001 2003 2005 2007 2009 2011Year (Three year moving average)
non-oil LLDCs (27) Oil LLDCs (4)
Source: World Bank data : Oil LLDCs : Azerbaijan, Chad, Kazakhstan, and Turkmenistan
LLDC share of exports of Goods and Services : 1985- 2011
…so non-oil LLDCs trade shares have stagnated

0
10
20
30
40
50
60
Co
snta
nt
US
Do
llars
pe
r ca
pit
a
Aid for Trade per capita - country average (Commitments in constant US Dollars per Capita)
Landlocked Developing Countries
Least Developed Countries
Low Income Countries
AFT per capita trends have remained fairly constant through time

0
5
10
15
20
25
Landlocked DevelopingCountries
Least Developed Countries Low Income Countries
US
do
llars
pe
r ca
pit
a
Aid for Trade per capita (commitments, average over 1995-2012)
…Per capita AFT shares of LLDCs remained low

0
20
40
60
80
100
120
140
160
Bh
uta
n
Mo
ngo
lia
Arm
enia
Lao
PD
R
Kyr
gyzs
tan
Afg
han
ista
n
Bo
livia
Kyr
gyz
Rep
ub
lic
Mal
i
Zam
bia
Lao
Peo
ple
's D
emo
crat
ic
Mo
ldo
va
Bu
rkin
a Fa
so
Leso
tho
Ce
ntr
al A
fric
an R
ep
ub
lic
Aze
rbai
jan
Tajik
ista
n
Uga
nd
a
Rw
and
a
Nep
al
Mal
awi
Swaz
ilan
d
Bo
tsw
ana
Par
agu
ay
Eth
iop
ia
Ch
ad
Bu
run
di
Nig
er
Kaz
akh
stan
Uzb
eki
stan
Zim
bab
we
Turk
men
ista
n
Per Capita Aid: Total Aid and Aid for Trade (Average Commitments over 1995-2012)
Countries ranked in descending order of per capita AFT
Other Types of Aid
Aid for Trade
For most countries, the share of AFT is less than the share of other types of aid

0
1000
2000
3000
4000
5000
6000
7000
8000
9000
Mill
ion
s o
f U
S D
olla
rs
Aid for Trade in Landlocked Countries (Commitments in constant millions of US Dollars)
Trade Related Adjustments
Trade Policy Related
Building Productive Capacities
Economic Infrastructures
Most AFT is allocated to infrastructure

0%
10%
20%
30%
40%
50%
60%
19
95
19
96
19
97
19
98
19
99
20
00
20
01
20
02
20
03
20
04
20
05
20
06
20
07
20
08
20
09
20
10
20
11
20
12
Share of Aid for Trade in Total Aid (Commitments, 1995-2012)
Landlocked DevelopingCountries
Other Developing Countries
…so have components of AFT
AFT shares to LL countries have remained fairly constant

12
20.0%
25.0%
30.0%
35.0%
40.0%
45.0%
50.0%
55.0%
60.0%
1995 1997 1999 2001 2003 2005 2007 2009
DAC countries
Multilateral
0
5
10
15
20
25
30
35
40
45
50
1995 1996 1997 1998 1999 2000 2001 2002 2003 2004 2005 2006 2007 2008 2009 2010
Co
nsta
nt
pric
e b
illi
on
s U
SD
DAC countries Multilateral Other
Following the Paris declaration of 2005, the decline of the share of AFT in ODA has been arrested.
AFT: What Have we Learnt? Some apparent success in mobilizing funding…

13
What Have we Learnt?
… and some success in mainstreaming trade in national development strategies (…sometimes)
Applying OECD word-count approach to Uganda’s budget speeches

14
0.0%
20.0%
40.0%
60.0%
80.0%
100.0%
120.0%
Low High Low High Low High Low High Low High
Q1 Q2 Q3 Q4 Q5
Quintiles of the export/capita distribution
Weakest exporters
Strongest exporters
o Split countries by the median in terms of 2000-2005 AFT receipts (per dollar of export) o Check if high-receivers’ exports grew more over subsequent 5-year period (2005-10)
What Have we Learnt? … but no faster export growth for large recipients of AFT flows

15
What have we Learnt? Macro and Micro face different trade-offs so we need both
15
Internal validity (ability to identify a causal relation)
External validity (ability to derive generalizable results)
Impact Evaluation
Cross-country econometrics
Relevance of outcomes
Identification of causal chain
TRADE-OFF 1
TRADE-OFF 2
Micro studies face trade-off 1: they identify causal chains fairly extensively at the cost of less relevant (i.e. less easily transposable) outcomes
Cross-country studies have greater external validity but have less internal validity (omission of important factors)

16
Which way ahead? Randomista or not, evaluate
RCT is not the alpha and omega of impact evaluation o What matters is baseline data collection + control group o Wealth of quasi-experimental methods available, even ex post
«RCT controversy» should not be an excuse to not evaluate o Every intervention left un-evaluated is a missed learning opportunity o Evaluation raises incentive issues; incentive-compatible setups can be designed (e.g.
making IE the «default» in all cases; decoupling IE results from project manager’s performance evaluation, …)
Toward an «evaluation-friendly» AFT o Cut costs; e.g. use existing stats as much as possible; put pressure on governments to
share statistics, in particular firm-level data o Encourage a culture of project design for evaluation (all projects designed like Progresa?)

17
Which way ahead? Streamline the initiative
Exploit the opportunity offered by the Trade Facilitation Agreement o Help make trade portals useful repositories of NTMs o Provide technical assistance to Trade Facilitation Committees (Art. 13) to develop trade-
related regulatory-oversight capabilities (not just counting documents to export)
Better use Diagnostic Trade Integration Studies o DTIS updates already a crude form of progress monitoring; clear learning curve from
first generation o Still lack of ownership (government side) and visibility (donor side) o Need for leaner, more focused action matrices (already largely the case) o Mainstream regional integration in trade policy; region-level DTISs
18
Which way ahead? In sum…
AFT’s broad achievements… o Mainstreaming of trade in national development strategies o Creating a crude form of donor coordination around «competitiveness
strategies» o Mobilizing funding
… are at risk unless a «culture of evaluation» builds up o Donor budget pressures require credible identification of outcome
improvements + causation; the instruments are there to use o Successful globalizers have all experimented with policy, but no learning from
experimentation without evaluation
… and the initiative gets a second wind from the TFA o A tool for the TFA’s application, focused on NTMs o A vehicle to foster deep regional integration