Embed Size (px)
Citation preview

Aid for CSOsStatistics based on DAC Members’ reporting to the Creditor Reporting System database
December 2015

AID AT A GLANCE
Flows of official development assistance to and through civil society organisations in 2013
October 2015, OECD Development Co-operation Directorate
Statistics based on DAC Members’ reporting to the Creditor Reporting System database

©OECD 2015 2
Definitions
Two forms of official development assistance for NGOs/CSOs
DAC members report their spending on NGOs/CSOs1 to the OECD creditor reporting system in two ways:
• Aid to NGOs: core contributions and pooled programmes and funds. These aid funds are programmed by the NGOs and include contributions to finance the NGO's projects (core support)
• Aid channelled through NGOs: funds channelled through NGOs and other private bodies to implement donor-initiated projects (earmarked funding)
Types of NGOs/CSOs receiving ODA
The OECD's creditor reporting system for official development assistance and other flows allows members to report ODA flows to and through four types of civil society organisations, which it calls non-governmental organisations (NGOs):
1) Donor-country based NGOs (Channel Code 22000): an NGO organised at the national level, based and operated either in the donor country or another developed (non-ODA eligible) country.
2) International NGOs (Channel Code 21000): an NGO organised on an
international level. Some INGOs may act as umbrella organizations with affiliations in several donor and/or recipient countries;
3) Developing country-based NGOs (Channel Code 23000): an NGO
organised at the national level, based and operated in a developing (ODA-eligible country);
4) Undefined (Channel Code 20000): NGOs in this category are reported
under a category of 20000 in the DAC questionnaire by donors.
More information about the terms and channel codes in the creditor reporting system and DAC Statistics is available here: http://www.oecd.org/dac/stats/dacandcrscodelists.htm
1 While the DAC Creditor Reporting System uses the term non-governmental organisation (NGO), it can be used synonymously with the term civil society organisation (CSO). This paper uses the term CSO.

3 ©OECD 2015
Flows of official development assistance to and through civil society organisations, 2013 DAC data
Key facts
• In 2013, USD 19.6 billion of official development assistance (ODA) was allocated to and through CSOs by DAC members compared to USD 18.2 billion in 2009.
• The equivalent of 11.6% of DAC Members' total gross ODA was channelled to and through CSOs in 2013.
• In 2013, 15.4% of total bilateral ODA was channelled to or through CSOs.
• CSOs based in DAC member countries raised, at least, USD 29.7 billion in 2013 from private sources.
• There is wide variation in the share of ODA that DAC members allocate to and through CSOs – ranging from 40% in Ireland to 1% in France.
• In terms of volume, the top providers of ODA to and through CSOs are the United States (USD 6.3 billion), followed by the United Kingdom (USD 2.1 billion), the EU Institutions (USD 2 billion), the Netherlands (USD 1.3 billion), and Sweden, Germany and Norway (all around USD 1 billion). Combined, these seven members account for 77 % of ODA channelled to and through CSOs.
• In 2013, DAC members provided around seven and a half times more ODA (USD 12.6 billion) to and through CSOs based in their countries than to developing country-based CSOs (USD 1.6 billion). There has been a small but positive 2% increase in the share of flows to and through CSOs going to developing country CSOs.
• Social infrastructure and services was the main sector of intervention for bilateral ODA channelled through CSOs in 2013: 57% of bilateral ODA (USD 9.6 billion) channelled through CSOs. Twenty-two per cent (USD 3.7 billion in 201) of CSO interventions were for activities falling under the sub-sector Government and Civil Society. Humanitarian assistance – emergency response - is the second most important area of intervention with 22% of aid channelled through CSOs going to it.

©OECD 2015 4
Introduction
This paper presents the most up-to-date official data (2013) on the flows of official development assistance (ODA) to and through CSOs. 2 It also identifies trends emerging from a comparative analysis of the aid that DAC members provide to CSOs between 2009 and 2013.
The six sections in this paper cover:
1. Official development assistance to and through CSOs: aggregate data for DAC members 2. Funds raised by CSOs from private sources 3. ODA flows to CSOs by DAC member 4. DAC members channel more ODA through CSOs headquartered in OECD countries 5. Sectoral trends for bilateral ODA channelled through CSOs 6. Statistical annex
The figures here cover only amounts collected and reported by DAC members to DAC statistical systems.
2 Olivier Bouret and Ida Mc Donnell of the OECD's Development Co-operation Directorate researched and drafted this paper. The paper will be updated using data for 2014 in early 2016. For further information contact [email protected]

5 ©OECD 2015
1. ODA to and through CSOs: aggregate data for DAC members
In 2013, 29 DAC members, including the EU institutions, channelled USD 19.6 billion in official development assistance to and through CSOs. The share of total ODA allocated to and through CSOs stabilised at around 11.5% (15.4% of bilateral aid) between 2009 and 2013. However, the volume of ODA managed and delivered by civil society organisations increased from USD 18.2 billion in 2009 to USD 19.6 billion in 2013 (Figures 1 and 2). This represents an increase of about 8% in volume (USD 1.5 billion) from 2009-2013, which is slightly lower than the 11% increase in total gross ODA over the same period.
ODA channelled through CSOs, that is, financing that is earmarked for donors' projects, continues to be significantly higher than core aid, implying that DAC members work with civil society organisations mostly as implementing partners or contractors. CSOs are important implementing partners for multilateral organisations, however data on multilateral aid outflows to CSOs is not available.
Source for Figures 1 and 2: OECD Creditor Reporting System Notes: 1) Totals do not always add up due to rounding.
2) The figures include aid allocated to and through CSOs by EU institutions.
12% 12% 11.8% 12% 11.6 %
0
2
4
6
8
10
12
14
16
18
20
2009 2010 2011 2012 2013
% o
f tot
al O
DA
Figure 1. Share (%) of total ODA allocated to and through CSOs, 2009 - 2013 (gross disbursements, constant prices)
ODA 'to' CSOs ODA 'through' CSOs ODA to and through CSOs
2.5 2.4 2.3 2.3 2.8
15.6 16.7 17.0 16.7 16.8
0
5
10
15
20
25
2009 2010 2011 2012 2013
Vol
ume
USD
bill
ion
Figure 2. Volume of ODA channelled to and through CSOs, 2009 - 2013 (USD billion, constant prices)
ODA 'through' CSOs ODA 'to' CSOs
Total: USD 18.1 bn Total: USD 19.1 bn Total: USD 19.3 bn Total: USD 19 bn Total: USD 19.6 bn

©OECD 2015 6
2. USD 29.7 billion: funds raised by CSOs from private sources in 2013
Funds raised privately by civil society organisations based in DAC member countries appear to have stabilised at around USD 30 billion since 2010. The funds amounted to USD 29.7 billion in 2013, compared with USD 30.3 billion in 2012. These funds have represented the equivalent of 24% of total net ODA between 2010 and 2013. The United States alone accounted for 70% of these flows in 2013. It should be noted, however, that DAC members report these flows to the OECD based on estimates or calculations including from CSOs’ annual statistical reports/data provided by NGO platforms, and they probably understate what CSOs raise in funding, in reality. Twelve DAC members did not report on these flows in 2013. There is no centralised, comparable international database for CSO financing for development. According to Development Initiatives (2015), private development assistance – the resources committed to development purposes by non-governmental organisations, foundations and philanthropists – is estimated at USD 44.9 billion in 2013.
There are clearly gaps in the data on the resources that CSOs raise privately for development – CSOs and DAC members need to improve the transparency of this significant source of development finance through better quality reporting.
3. Wide variation in DAC members’ ODA flows to and through CSOs
As shown in Figure 4 flows of official development assistance to and through CSOs as a share of bilateral aid differ widely among DAC members. In 2013, the share of bilateral aid channelled to and through CSOs ranged from 1% in France to 40% in Ireland. Fifteen members channelled 20% or more of their bilateral aid to and through CSOs, while five members spent 4% or less of their bilateral aid in this way (see also Table A.3, page 14). The majority of DAC members allocate earmarked funding to core support for CSOs. Belgium, Denmark, Ireland and Italy stand out for providing a higher share of aid to (progamme aid) CSOs than through them.
Figure 4. Percentage of bilateral ODA allocated to and through CSOs, by DAC member, 2013
Source: DAC Creditor Reporting System (CRS)

7 ©OECD 2015
It should be noted that yearly fluctuations in the bilateral share of aid delivered to and through CSOs do not necessarily correspond to an increase or decrease in aid allocated to these organisations. Fluctuations can also reflect changes in the volume of total ODA and improvements in the quality of reporting by DAC members from one year to another.
Main trends in aid volumes for CSOs by DAC member
Over the period 2009-2013 the volume of ODA allocated to and through CSOs increased in 11 DAC members. The most significant increases in volume were in the United Kingdom which increased ODA for CSOs by almost USD 1 billion between 2009 and 2013 (81% increase compared to a 45% overall increase in its ODA over that period ). ODA to and through CSOs also increased in the EU Institutions (42%), Australia (50%), and in Korea and Portugal - although from low levels.
The greatest decrease in volume was in Spain by 58%, the volume of ODA to and through CSOs also fell in Greece, Ireland, the Netherlands and New Zealand.
Table 1. Volume of ODA to and through CSOs, 2009 – 2013 (constant USD million, disbursement)
2009 2010 2011 2012 2013
United States 6,657 6,705 6,803 6,233 6,252
United Kingdom 1,165 1,247 1,701 1,932 2,112
EU Institutions 1,448 1,712 1,832 1,951 2,057
Netherlands 1,464 1,598 1,448 1,300 1,302
Sweden 949 931 1,018 1,081 1,144
Germany 999 992 945 1,066 1,114
Norway 1,102 975 959 950 1,050
Canada 772 817 764 754 837
Switzerland 563 548 569 655 722
Australia 348 459 555 583 522
Denmark 231 460 461 503 493
Spain 911 941 689 438 385
Belgium 346 340 348 314 323
Japan 291 398 297 409 319
Ireland 247 236 226 216 220
Finland 181 187 184 184 204
Italy 126 93 112 70 159
France 120 160 128 148 111
Luxembourg 92 89 80 86 89
Austria 69 74 63 51 72
New Zealand 70 50 61 50 55
Korea 14 19 23 27 28
Czech Republic 0 0 16 15 16
Portugal 8 23 20 17 15
Poland 0 0 0 0 13
Slovak Republic 0 0 0 0 5
Slovenia 0 5 5 5 4
Iceland 0 0 1 2 3
Greece 4 3 0 0 0
Total 18,177 19,063 19,307 19,041 19,625 Source: DAC CRS; Note: Shading denotes where 25% or more of channel codes in the creditor reporting system are blank/not completed.

©OECD 2015 8
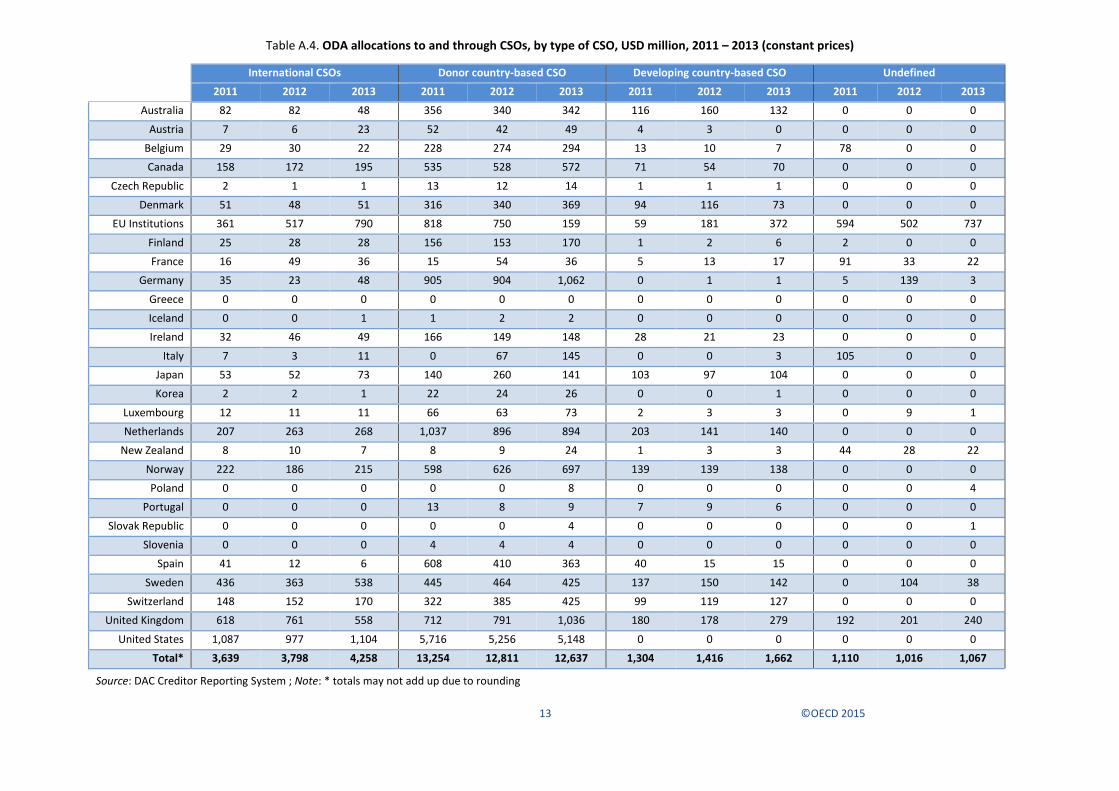
4. DAC members channel more ODA through CSOs based or operated in OECD countries
All DAC members fund and partner with donor country-based CSOs and international CSOs while fewer members support developing country CSOs directly. In 2013, DAC members provided around seven and a half times more aid to and through CSOs based in donor countries than through developing country CSOs and three times more aid through donor country CSOs than international CSOs (Figure 5 and Table A.5 flows to and through different types of CSOs by DAC member).
Source: DAC CRS The data suggest that DAC members continue to have a strong preference for supporting donor country-based CSOs over other types (Figures 5 and 6).
While there has been a small increase in the volume of ODA flowing to and through developing country CSOs between 2011 – 2013 (Figure 5), the share of total ODA to going to and through these CSOs remains very low at about 9% in 2013 compared to 7% in 2011. The share flowing to international CSOs increased from 19% to 22%, while the donor country based CSOs received 64% of total (a 5 point fall from 69% in 2011) (see also Annex A.4).
Ten DAC members allocate over 80% or more of their funding for CSOs to and through their national CSOs, notably the United States, Germany, Spain, Finland, and Belgium (Figure 6).
It should be noted that while developing country CSOs may not have direct access to ODA funding from OECD countries, several DAC members require CSOs based in the donor country to work with local organisations in developing countries (OECD, 2011: 25).
0
2
4
6
8
10
12
14
Donor countryCSO
International CSO Developingcountry CSO
Undefined
USD
Bill
ion
Figure 5. ODA flows to and through CSOs by type of CSO, 2011 - 2013, USD billion, constant prices
2011 2012 2013

9 ©OECD 2015
Source: DAC CRS * the amount, across categories, for Greece is zero.
0% 20% 40% 60% 80% 100%
Austria
Greece*
Poland
Slovenia
United States
Iceland
Slovak Republic
Korea
Germany
Czech Republic
New Zealand
Luxembourg
Italy
Finland
Portugal
Belgium
Spain
France
Ireland
Canada
Denmark
Japan
Switzerland
Australia
Norway
Netherlands
Sweden
United Kingdom
EU Institutions
Figure 6. % share of DAC members' ODA for CSOs by type of CSO, 2013
Developing country CSO International CSO Donor country CSO Undefined

©OECD 2015 10
5. Sectoral trends for bilateral ODA channelled through CSOs
In 2013, the sector "social infrastructure and services" continued to be the main sector of intervention for ODA channelled through CSOs. Fifty-seven per cent (USD 9.6 billion) of bilateral ODA channelled through CSOs went to this sector in 2013 which is 5 percentage points (or 7.7%) increase compared to 2011. Humanitarian assistance is the second most important area of intervention for aid channelled through CSOs (Figures 7 and Figure 8 – emergency response). The volumes of ODA received by CSOs in the key sectors have been relatively stable between over the period 2009 - 2013 with a slight decrease in Food Aid and some fluctuation of 2 – 3 percentage points in the Social infrastructure category and the ‘other’ category (see also Annex A.5).
Source: DAC Creditor Reporting System
In 2013, the main sub-sectors of intervention for bilateral aid channelled through CSOs continue to be Government & Civil Society (22% of total aid channelled through CSOs), Emergency Response (20%), Population Policies & Reproductive health (16%), and Health (8%). There appears to be stability in the shares/allocations to these sub-sectors in the period 2009-2013 (Figure 8 and Table A.5).
Source: DAC Creditor Reporting System Note: Government & Civil Society sub-sector includes support to women’s equality organisations
0 20 40 60
Social infrastructure and services
Economic infrastructure and services
Production
General Environment Protection
Food Aid
Humanitarian assistance
Refugees in Donor Countries
Other
Figure 7. Main sectors of intervention for ODA channelled through CSOs, 2011 - 2013, %
2013 2012 2011
%
3,688
3,321
2,765
1,405
1,081
855
788
511
403
394
Government & Civil SocietyEmergency Response
Population Policies & Reproductive healthHealth
Others (not identified)Education
Agriculture Forestry & FishingSocial Infrastructures & Services
Food AidGeneral Environment Protection
Figure 8. Top ten sub-sectors of intervention for bilateral aid channelled through CSOs, 2013, USD million, disbursements

11 ©OECD 2015
Statistical annex
Table A.1. Official development assistance channelled through CSOs,
2009-2013 (USD million, disbursements, constant prices)
2009 2010 2011 2012 2013
Australia 268 311 357 494 346 Austria 67 72 61 50 71
Belgium 160 140 142 124 108 Canada 707 778 703 714 793
Czech Republic 0 0 15 14 16 Denmark 129 298 282 353 245
EU Institutions 1,448 1,712 1,832 1,948 2,054 Finland 179 173 171 168 188 France 105 159 127 148 109
Germany 999 992 945 1,066 1,114 Greece 4 3 0 0 0 Iceland 0 0 0 2 3 Ireland 148 97 84 85 86
Italy 118 74 103 67 55 Japan 74 150 107 211 105 Korea 5 18 23 26 27
Luxembourg 83 66 73 78 69 Netherlands 448 1,384 1,401 1,258 1,232
New Zealand 35 28 45 34 41 Norway 1,102 661 641 645 715 Poland 0 0 0 0 12
Portugal 8 22 20 17 15 Slovak Republic 0 0 0 0 5
Slovenia 0 3 3 3 3
Spain 889 894 676 435 382
Sweden 781 730 865 698 743
Switzerland 399 350 377 459 498
United Kingdom 812 856 1,162 1,388 1,558
United States 6,657 6,705 6,803 6,207 6,252
Total 15,627 16,678 17,019 16,695 16,846 Source: DAC Creditor Reporting System Note: Shading denotes where 25% or more of channel codes in the creditor reporting system are blank/not completed.
Table A.2. Official development assistance channelled to CSOs, 2009-2013
(USD million, disbursements, constant prices)
2009 2010 2011 2012 2013
Australia 80 148 198 88 176 Austria 2 2 2 1 2
Belgium 186 199 206 190 215 Canada 65 39 61 40 45
Czech Republic 0 0 1 1 1 Denmark 101 161 179 150 248
EU Institutions 0 0 0 3 4 Finland 3 14 12 15 16 France 15 2 1 0 2
Germany 0 0 0 0 0 Greece 0 0 0 0 0 Iceland 0 0 1 0 0 Ireland 99 140 142 131 134
Italy 8 19 9 3 104 Japan 217 248 189 198 213 Korea 10 1 1 1 1
Luxembourg 8 24 7 8 20 Netherlands 1,016 214 46 43 70
New Zealand 34 22 15 16 14 Norway 0 314 318 305 334 Poland 0 0 0 0 0
Portugal 0 0 1 0 0 Slovak Republic 0 0 0 0 0
Slovenia 0 2 1 1 1
Spain 21 47 13 3 2
Sweden 168 201 153 383 400
Switzerland 164 198 192 196 224
United Kingdom 353 392 539 544 553
United States 0 0 0 26 0
Total 2,550 2,385 2,288 2,347 2,779 Source: DAC Creditor Reporting System Note: Shading denotes where 25% or more of channel codes in the creditor reporting system are blank/not completed.

©OECD 2015 12
Table A.3. Share of bilateral aid channelled to and through CSOs, DAC members, 2013
ODA To CSOs
(% of bilateral aid) ODA Through CSOs (%
of bilateral aid) Sum of % to and through
Australia 4.2 8.2 12.4 Austria 0.3 12.9 13.2
Belgium 15.8 7.9 23.7 Canada 1.3 22.3 23.6
Czech Republic 1.2 27.3 28.5 Denmark 10.7 10.6 21.4
EU Institutions 0.0 12.0 12.0 Finland 2.0 22.9 24.9 France 0.0 1.3 1.3
Germany 0.0 9.7 9.7 Greece 0.2 0.0 0.2 Iceland 0.7 8.7 9.4 Ireland 24.7 15.8 40.5
Italy 10.6 5.6 16.2 Japan 1.1 0.5 1.6 Korea 0.1 2.0 2.0
Luxembourg 6.6 22.8 29.4 Netherlands 1.8 32.2 34.0
New Zealand 3.9 11.5 15.5 Norway 7.6 16.2 23.8 Poland 0.2 8.4 8.6
Portugal 0.0 4.4 4.4 Slovak Republic 0.2 30.3 30.5
Slovenia 4.9 15.2 20.1 Spain 0.2 32.6 32.7
Sweden 10.0 18.7 28.7 Switzerland 8.8 19.5 28.3
United Kingdom 5.1 14.2 19.3 United States 0.0 23.1 23.1
Total DAC member 2.2 13.2 15.4
Source: DAC Creditor Reporting System
13 ©OECD 2015
Table A.4. ODA allocations to and through CSOs, by type of CSO, USD million, 2011 – 2013 (constant prices)
International CSOs Donor country-based CSO Developing country-based CSO Undefined
2011 2012 2013 2011 2012 2013 2011 2012 2013 2011 2012 2013
Australia 82 82 48 356 340 342 116 160 132 0 0 0
Austria 7 6 23 52 42 49 4 3 0 0 0 0
Belgium 29 30 22 228 274 294 13 10 7 78 0 0
Canada 158 172 195 535 528 572 71 54 70 0 0 0
Czech Republic 2 1 1 13 12 14 1 1 1 0 0 0
Denmark 51 48 51 316 340 369 94 116 73 0 0 0
EU Institutions 361 517 790 818 750 159 59 181 372 594 502 737
Finland 25 28 28 156 153 170 1 2 6 2 0 0
France 16 49 36 15 54 36 5 13 17 91 33 22
Germany 35 23 48 905 904 1,062 0 1 1 5 139 3
Greece 0 0 0 0 0 0 0 0 0 0 0 0
Iceland 0 0 1 1 2 2 0 0 0 0 0 0
Ireland 32 46 49 166 149 148 28 21 23 0 0 0
Italy 7 3 11 0 67 145 0 0 3 105 0 0
Japan 53 52 73 140 260 141 103 97 104 0 0 0
Korea 2 2 1 22 24 26 0 0 1 0 0 0
Luxembourg 12 11 11 66 63 73 2 3 3 0 9 1
Netherlands 207 263 268 1,037 896 894 203 141 140 0 0 0
New Zealand 8 10 7 8 9 24 1 3 3 44 28 22
Norway 222 186 215 598 626 697 139 139 138 0 0 0
Poland 0 0 0 0 0 8 0 0 0 0 0 4
Portugal 0 0 0 13 8 9 7 9 6 0 0 0
Slovak Republic 0 0 0 0 0 4 0 0 0 0 0 1
Slovenia 0 0 0 4 4 4 0 0 0 0 0 0
Spain 41 12 6 608 410 363 40 15 15 0 0 0
Sweden 436 363 538 445 464 425 137 150 142 0 104 38
Switzerland 148 152 170 322 385 425 99 119 127 0 0 0
United Kingdom 618 761 558 712 791 1,036 180 178 279 192 201 240
United States 1,087 977 1,104 5,716 5,256 5,148 0 0 0 0 0 0
Total* 3,639 3,798 4,258 13,254 12,811 12,637 1,304 1,416 1,662 1,110 1,016 1,067
Source: DAC Creditor Reporting System ; Note: * totals may not add up due to rounding

©OECD 2015 14
Table A.5. Volume of DAC member ODA channelled through CSOs by sector, 2009-2013 (USD million, disbursement, constant prices)
DAC Sectors and sub-sectors 2009 2010 2011 2012 2013 Social infrastructure and services 8,676 8,749 8,896 9,760 9,588
Education 991 964 898 991 855 Health 1,045 1,010 1,224 1,260 1,405
Population Policies & Reproductive health 2,258 2,500 2,623 2,746 2,765 Water Supply & Sanitation 299 349 340 378 364
Government & Civil Society 3,559 3,248 3,203 3,834 3,688 - Of Which support to women's equality organisations 142 166 139 184 178
Social Infrastructures & Services 525 678 607 553 511 Economic infrastructure and services 628 595 556 463 536
Transport & Storage 192 170 103 53 95 Communications 25 30 44 26 23
Energy 58 69 101 95 98 Banking Financial Services 156 101 95 135 106
Business & Others Services 197 225 213 155 214 Production 977 1,114 1,112 1,095 1,060
Agriculture Forestry & Fishing 794 829 854 846 788 Industry Mining & Construction 122 171 151 119 145
Trade Policies & Tourism 61 114 107 130 127 General Environment Protection 335 330 354 351 394
Food Aid 770 535 715 573 403 Humanitarian assistance 2,998 3,465 3,444 3,151 3,627
Emergency Response 2,754 3,227 3,175 2,883 3,321 Reconstruction Relief 100 101 141 91 84
Disaster Prevention 144 137 128 177 222 Refugees in Donor Countries 158 191 145 158 154
Others 1,086 1,700 1,796 1,129 1,081 Grand Total 15,627 16,678 17,019 16,681 16,845
Source: DAC Creditor Reporting System

15 ©OECD 2015
Table A.6. Share of total ODA and bilateral ODA through CSOs by main sector, 2009-2013, constant prices
Source: DAC Creditor Reporting System
Table A.7. ODA gross disbursements for DAC members, USD million, 2009-2013, constant prices
All DAC members 2009 2010 2011
2012 2013
Total bilateral ODA
113,404
119,845
123,845
119,641
127,660
Total ODA 151,962
159,486
163,622
158,709
169,250
Source: DAC Creditor Reporting System
2009 2010 2011 2012 2013 Bilateral
% Total
ODA % Bilateral
% Total
ODA % Bilateral
% Total
ODA % Bilateral
% Total
ODA % Bilateral
% Total
ODA % Social infrastructure
and services 7.7 5.7 7.3 5.5 7.2 5.4 8.2 6.1 7.5 5.7 Economic
infrastructure and services 0.6 0.4 0.5 0.4 0.4 0.3 0.4 0.3 0.4 0.3
Production 0.9 0.6 0.9 0.7 0.9 0.7 0.9 0.7 0.8 0.6 General Environment
Protection 0.3 0.2 0.3 0.2 0.3 0.2 0.3 0.2 0.3 0.2
Food Aid 0.7 0.5 0.4 0.3 0.6 0.4 0.5 0.4 0.3 0.2 Humanitarian
assistance 2.6 1.3 2.9 1.3 2.8 1.2 2.6 1.3 2.8 1.2 Refugees in Donor
Countries 0.1 0.1 0.2 0.1 0.1 0.1 0.1 0.1 0.1 0.1
Other 1.0 0.7 1.4 1.1 1.5 1.1 0.9 0.7 0.8 0.6

©OECD 2015 16
References
OECD (2011), How DAC members work with civil society organisation: An overview, 2011, OECD, Paris. Download at: http://www.oecd.org/dac/howdacmembersworkwithcivilsocietyorganisationsanoverview2011.htm
OECD (2012), Partnering with Civil Society; 12 Lessons from DAC Peer Reviews, OECD, Paris. Download at: http://www.oecd.org/dac/peer-reviews/partneringwithcivilsociety.htm
Development Initiatives (2015), Investments to End Poverty, Development Initiatives Ltd, Bristol. Download at: http://devinit.org/wp-content/uploads/2015/09/Investments-to-End-Poverty-Report-2015_online.pdf


![CSOs Engagement for Aid Effectiveness - Don K Marut - INFID [Compatibility Mode]](https://img.pdfslide.us/doc/110x75/54e9df034a7959e7158b49c0/csos-engagement-for-aid-effectiveness-don-k-marut-infid-compatibility-mode.jpg)