Embed Size (px)
Citation preview
number 5 | december 2016
brooke shearer series
aid effectiveness in fragile states How bad is it and how can it improve?
Laurence chandy, brina seideL, and christine Zhang
brooke shearer seriesthis series is dedicated to the memory of brooke shearer
(1950-2009), a loyal friend of the brookings institution
and a respected journalist, government official and
non-governmental leader. this series focuses on global
poverty and development issues related to brooke
shearer’s work, including women’s empowerment,
reconstruction in afghanistan, hiV/aids education
and health in developing countries. global economy
and development at brookings is honored to carry this
working paper series in her name.
Laurence Chandy is a fellow in the global economy and development program at the brookings
institution.
Brina Seidel is a research assistant in the global economy and development program at the
brookings institution.
Christine Zhang is a former research analyst in the global economy and development program at
the brookings institution. she is currently a 2016 knight-mozilla open news Fellow based at the Los
Angeles Times data desk.
Acknowledgements: the authors are grateful to Julie biau and natasha Ledlie for leading earlier, exploratory research on this topic, and to John mcarthur and homi kharas for comments on an earlier draft.
Author’s Note: The Brookings Institution is a nonprofit organization devoted to independent re-search and policy solutions. its mission is to conduct high-quality, independent research and, based on that research, to provide innovative, practical recommendations for policymakers and the public. the conclusions and recommendations of any brookings publication are solely those of its author(s), and do not reflect the views of the Institution, its management, or its other scholars.
brookings gratefully acknowledges the program support provided by the australian department of Foreign affairs and trade, the bill & melinda gates Foundation, the government of denmark, and the William and Flora hewlett Foundation.
brookings recognizes that the value it provides is in its absolute commitment to quality, independence, and impact. Activities supported by its donors reflect this commitment.

CoNteNtS
abstract . . . . . . . . . . . . . . . . . . . . . . . . . . . . . . . . . . . . . . . . . . . . . . . . . . . . . . . . . . . . . . . . . . . . . . . . . . . . . . . . . . 1
i. introduction . . . . . . . . . . . . . . . . . . . . . . . . . . . . . . . . . . . . . . . . . . . . . . . . . . . . . . . . . . . . . . . . . . . . . . . . . . . . 2
ii. two challenges. . . . . . . . . . . . . . . . . . . . . . . . . . . . . . . . . . . . . . . . . . . . . . . . . . . . . . . . . . . . . . . . . . . . . . . . . . 4
iii. our approach . . . . . . . . . . . . . . . . . . . . . . . . . . . . . . . . . . . . . . . . . . . . . . . . . . . . . . . . . . . . . . . . . . . . . . . . . . 5
iV. comparing the quality of aid practices in fragile and stable states . . . . . . . . . . . . . . . . . . . . . . . . . . . . . 11
V. Testing fragility classifications . . . . . . . . . . . . . . . . . . . . . . . . . . . . . . . . . . . . . . . . . . . . . . . . . . . . . . . . . . . . 14
Vi. comparing the quality of aid practices across donors . . . . . . . . . . . . . . . . . . . . . . . . . . . . . . . . . . . . . . . 17
Vii. Policy implications . . . . . . . . . . . . . . . . . . . . . . . . . . . . . . . . . . . . . . . . . . . . . . . . . . . . . . . . . . . . . . . . . . . . 21
appendix a: description of indicators, data coverage, and summary statistics . . . . . . . . . . . . . . . . . . . . . 22
Appendix B: Regression using World Bank fragility classification . . . . . . . . . . . . . . . . . . . . . . . . . . . . . . . . 29
appendix c: regressions testing for changing effect of fragility over time . . . . . . . . . . . . . . . . . . . . . . . . .30
appendix d: regression testing role of aid allocations to sectors in explaining aid practices . . . . . . . . . 32
Appendix E: Regression using OECD DAC fragility classification . . . . . . . . . . . . . . . . . . . . . . . . . . . . . . . . 33
appendix F: individual donor scores, in fragile and stable settings . . . . . . . . . . . . . . . . . . . . . . . . . . . . . . . 34
appendix g: bilateral and multilateral donor scores across all indicators . . . . . . . . . . . . . . . . . . . . . . . . . 39
references . . . . . . . . . . . . . . . . . . . . . . . . . . . . . . . . . . . . . . . . . . . . . . . . . . . . . . . . . . . . . . . . . . . . . . . . . . . . . . .40
LiSt of tABLeS ANd figureS
Table 1: World Bank and OECD fragility classifications . . . . . . . . . . . . . . . . . . . . . . . . . . . . . . . . . . . . . . . . . . 8
Table 2: Comparing aid practices in fragile and stable states using World Bank fragility classification . 12
Table 3: Comparing aid practices in fragile and stable states using OECD DAC fragility classification . 14
Table 4: Average Fragile States Index scores by fragility classification . . . . . . . . . . . . . . . . . . . . . . . . . . . . 16
table 5: standardized donor scores for overall effectiveness . . . . . . . . . . . . . . . . . . . . . . . . . . . . . . . . . . . . 18
Figure 1: relative rankings of donor performance in fragile and stable states . . . . . . . . . . . . . . . . . . . . . .20
Aid effectiveness in frAgile stAtes:How bAd is it And How cAn it improve?
brooke sHeArer series
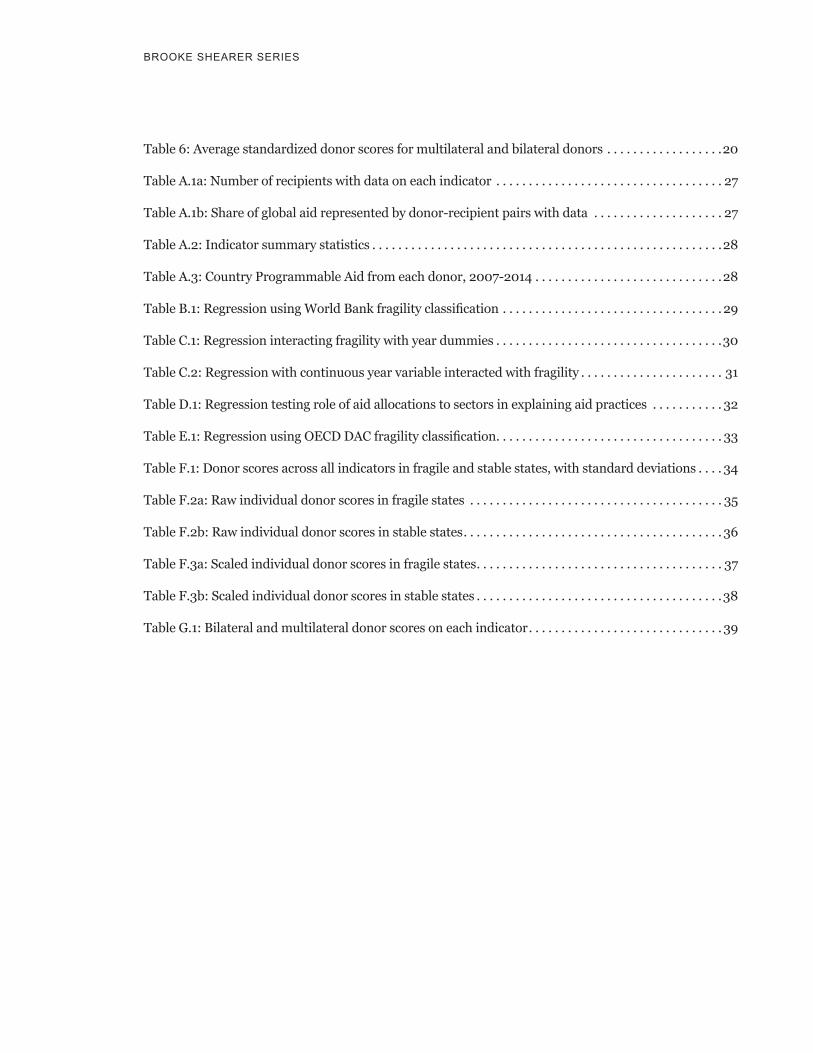
table 6: average standardized donor scores for multilateral and bilateral donors . . . . . . . . . . . . . . . . . .20
table a.1a: number of recipients with data on each indicator . . . . . . . . . . . . . . . . . . . . . . . . . . . . . . . . . . . 27
table a.1b: share of global aid represented by donor-recipient pairs with data . . . . . . . . . . . . . . . . . . . . 27
table a.2: indicator summary statistics . . . . . . . . . . . . . . . . . . . . . . . . . . . . . . . . . . . . . . . . . . . . . . . . . . . . . .28
table a.3: country Programmable aid from each donor, 2007-2014 . . . . . . . . . . . . . . . . . . . . . . . . . . . . .28
Table B.1: Regression using World Bank fragility classification . . . . . . . . . . . . . . . . . . . . . . . . . . . . . . . . . . 29
table c.1: regression interacting fragility with year dummies . . . . . . . . . . . . . . . . . . . . . . . . . . . . . . . . . . .30
table c.2: regression with continuous year variable interacted with fragility . . . . . . . . . . . . . . . . . . . . . . 31
table d.1: regression testing role of aid allocations to sectors in explaining aid practices . . . . . . . . . . . 32
Table E.1: Regression using OECD DAC fragility classification . . . . . . . . . . . . . . . . . . . . . . . . . . . . . . . . . . . 33
table F.1: donor scores across all indicators in fragile and stable states, with standard deviations . . . . 34
table F.2a: raw individual donor scores in fragile states . . . . . . . . . . . . . . . . . . . . . . . . . . . . . . . . . . . . . . . 35
table F.2b: raw individual donor scores in stable states . . . . . . . . . . . . . . . . . . . . . . . . . . . . . . . . . . . . . . . . 36
table F.3a: scaled individual donor scores in fragile states . . . . . . . . . . . . . . . . . . . . . . . . . . . . . . . . . . . . . . 37
table F.3b: scaled individual donor scores in stable states . . . . . . . . . . . . . . . . . . . . . . . . . . . . . . . . . . . . . .38
table g.1: bilateral and multilateral donor scores on each indicator . . . . . . . . . . . . . . . . . . . . . . . . . . . . . . 39

aid effectiveness in fragile statesHow bad is it and how can it improve?
Laurence chandy, brina seideL, and christine Zhang
ABStrACt
Fragile states around the world are at risk of being left behind, making them a high priority for increased foreign
assistance. but is the donor community capable of delivering that aid effectively? to explore this question, we
develop a set of aid effectiveness indicators that are relevant to aid-giving in fragile states and that allow a fair
comparison of aid practices in fragile and stable countries. We then make that comparison using different defi-
nitions of fragility. Under certain definitions, we show that aid practices in fragile states are inferior to those in
stable countries. We then turn the spotlight onto individual donors, revealing substantial variety in their perfor-
mance in fragile settings. The patterns we find among donors point to workable, though difficult, ways to raise
the standard for aid in the countries that need effective aid the most. chief among these is a call for the worst
performing bilateral donors to withdraw themselves from fragile states and support a larger role for multilateral
agencies in their place.
Aid effectiveness in frAgile stAtes:How bAd is it And How cAn it improve? 1
2 brooke sHeArer series
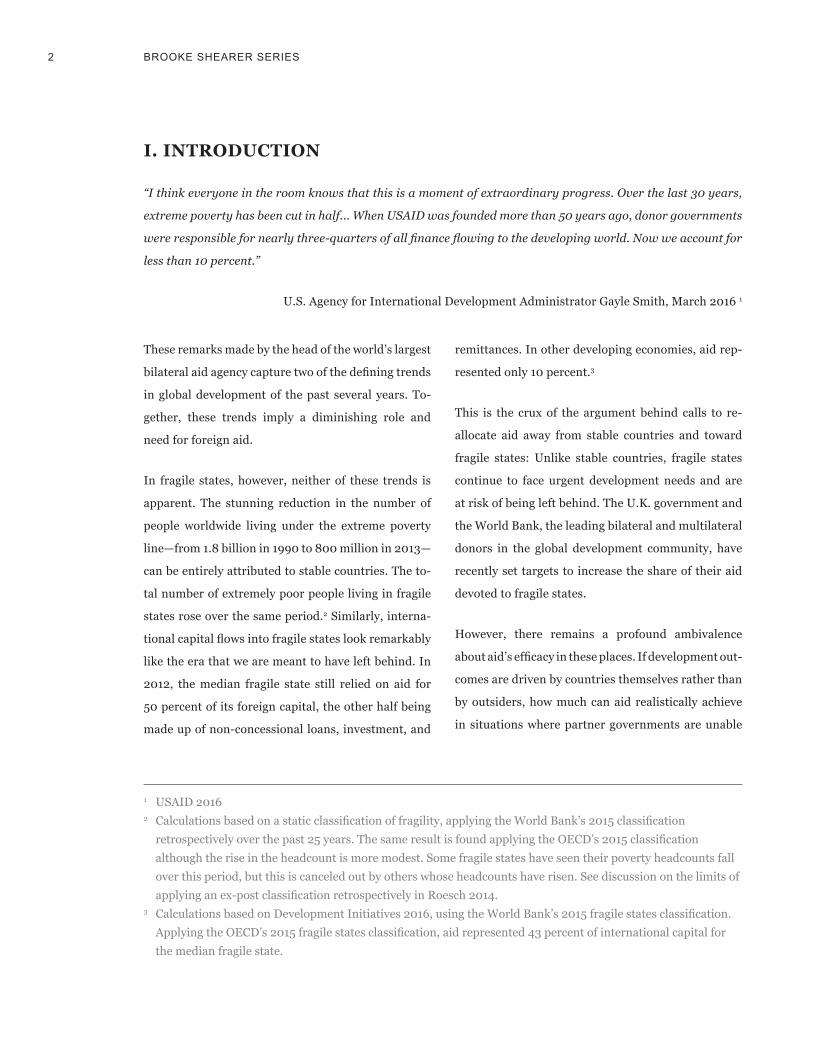
these remarks made by the head of the world’s largest
bilateral aid agency capture two of the defining trends
in global development of the past several years. to-
gether, these trends imply a diminishing role and
need for foreign aid.
in fragile states, however, neither of these trends is
apparent. the stunning reduction in the number of
people worldwide living under the extreme poverty
line—from 1.8 billion in 1990 to 800 million in 2013—
can be entirely attributed to stable countries. the to-
tal number of extremely poor people living in fragile
states rose over the same period.2 similarly, interna-
tional capital flows into fragile states look remarkably
like the era that we are meant to have left behind. in
2012, the median fragile state still relied on aid for
50 percent of its foreign capital, the other half being
made up of non-concessional loans, investment, and
remittances. in other developing economies, aid rep-
resented only 10 percent.3
this is the crux of the argument behind calls to re-
allocate aid away from stable countries and toward
fragile states: unlike stable countries, fragile states
continue to face urgent development needs and are
at risk of being left behind. the u.k. government and
the World bank, the leading bilateral and multilateral
donors in the global development community, have
recently set targets to increase the share of their aid
devoted to fragile states.
however, there remains a profound ambivalence
about aid’s efficacy in these places. If development out-
comes are driven by countries themselves rather than
by outsiders, how much can aid realistically achieve
in situations where partner governments are unable
1 usaid 20162 Calculations based on a static classification of fragility, applying the World Bank’s 2015 classification
retrospectively over the past 25 years. The same result is found applying the OECD’s 2015 classification although the rise in the headcount is more modest. some fragile states have seen their poverty headcounts fall over this period, but this is canceled out by others whose headcounts have risen. see discussion on the limits of applying an ex-post classification retrospectively in roesch 2014.
3 calculations based on development initiatives 2016, using the World Bank’s 2015 fragile states classification. Applying the OECD’s 2015 fragile states classification, aid represented 43 percent of international capital for the median fragile state.
i. iNtroduCtioN
“I think everyone in the room knows that this is a moment of extraordinary progress. Over the last 30 years,
extreme poverty has been cut in half... When USAID was founded more than 50 years ago, donor governments
were responsible for nearly three-quarters of all finance flowing to the developing world. Now we account for
less than 10 percent.”
u.s. agency for international development administrator gayle smith, march 2016 1
Aid effectiveness in frAgile stAtes:How bAd is it And How cAn it improve? 3
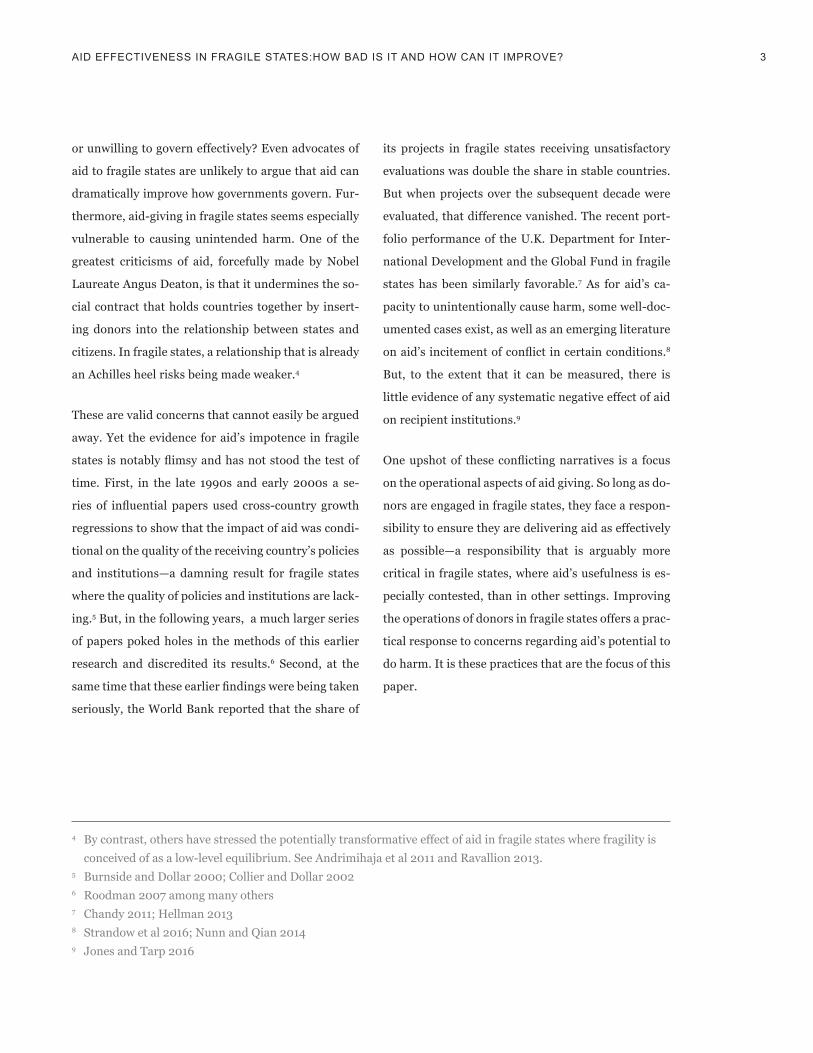
or unwilling to govern effectively? even advocates of
aid to fragile states are unlikely to argue that aid can
dramatically improve how governments govern. Fur-
thermore, aid-giving in fragile states seems especially
vulnerable to causing unintended harm. one of the
greatest criticisms of aid, forcefully made by nobel
Laureate angus deaton, is that it undermines the so-
cial contract that holds countries together by insert-
ing donors into the relationship between states and
citizens. in fragile states, a relationship that is already
an achilles heel risks being made weaker.4
these are valid concerns that cannot easily be argued
away. yet the evidence for aid’s impotence in fragile
states is notably flimsy and has not stood the test of
time. First, in the late 1990s and early 2000s a se-
ries of influential papers used cross-country growth
regressions to show that the impact of aid was condi-
tional on the quality of the receiving country’s policies
and institutions—a damning result for fragile states
where the quality of policies and institutions are lack-
ing.5 but, in the following years, a much larger series
of papers poked holes in the methods of this earlier
research and discredited its results.6 second, at the
same time that these earlier findings were being taken
seriously, the World bank reported that the share of
its projects in fragile states receiving unsatisfactory
evaluations was double the share in stable countries.
but when projects over the subsequent decade were
evaluated, that difference vanished. the recent port-
folio performance of the u.k. department for inter-
national development and the global Fund in fragile
states has been similarly favorable.7 as for aid’s ca-
pacity to unintentionally cause harm, some well-doc-
umented cases exist, as well as an emerging literature
on aid’s incitement of conflict in certain conditions.8
but, to the extent that it can be measured, there is
little evidence of any systematic negative effect of aid
on recipient institutions.9
One upshot of these conflicting narratives is a focus
on the operational aspects of aid giving. so long as do-
nors are engaged in fragile states, they face a respon-
sibility to ensure they are delivering aid as effectively
as possible—a responsibility that is arguably more
critical in fragile states, where aid’s usefulness is es-
pecially contested, than in other settings. improving
the operations of donors in fragile states offers a prac-
tical response to concerns regarding aid’s potential to
do harm. it is these practices that are the focus of this
paper.
4 by contrast, others have stressed the potentially transformative effect of aid in fragile states where fragility is conceived of as a low-level equilibrium. see andrimihaja et al 2011 and ravallion 2013.
5 burnside and dollar 2000; collier and dollar 20026 roodman 2007 among many others7 chandy 2011; hellman 20138 strandow et al 2016; nunn and Qian 20149 Jones and tarp 2016
4 brooke sHeArer series
iii. two ChALLeNgeS
there is a large literature devoted to assessing aid
operations and their adherence to principles of good
practice. many papers were published in the years im-
mediately following the 2005 high Level Forum on
aid effectiveness in Paris.10 this event marked a high
point for consensus on the definition of good practice
and the urgency of reform, and motivated new cross-
country surveys of aid practices, enabling detailed
industry-wide analysis for the first time.
this literature has tended to focus on the differences
between donors while treating recipients as homo-
geneous. by contrast, a small number of papers have
looked at how aid practices differ between fragile and
stable countries.11 They unanimously find that aid
practices tend to be poorer in fragile states.
Interesting though these findings are, they suffer from
two limitations.
Measuring good aid practice: First, earlier stud-
ies have borrowed measures of aid practice from the
broader aid effectiveness literature that inherently
discriminate against fragile states. some measures
penalize aid giving to fragile states by rewarding aid
that goes to well-governed countries, or those whose
governments display high quality management of
public finance and procurement. Others penalize aid
practices that are not appropriate in fragile states by
rewarding the use of direct budgetary support and
low overheads.12 Using these measures, the finding
that aid practices tend to be poorer in fragile states
than stable countries is spurious.
Measuring fragility: second, each earlier study em-
ploys a single classification of fragile states. This ig-
nores the variety of different classifications of fragile
states that abound and the conflicting definitions of
fragility that underpin them.13 it is reasonable to ex-
pect that different kinds of fragility and the degree of
fragility might affect aid practices in different ways.
Thus it is unclear whether the findings from earlier
studies can be generalized across fragile environ-
ments.
10 easterly and Pfutze, 2008; birdsall and kharas 2010; actionaid 2011; knack et al. 201111 oecd 2010; chandy and Linn 2011; ishihara 2012; oecd 2012a; oecd 2012b12 in a study of World bank portfolio performance in fragile states, ralston 2014 finds that high overheads are
correlated with more satisfactory outcomes. 13 see discussions in acLed 2014 and Putzil and di John 2012. it is notable that both the u.k. government and
the World Bank are in the process of establishing new fragile state classifications.

iV. our ApproACh
in this paper we offer a fresh attempt to assess aid
practices in fragile states that adopts a more careful
approach to the measurement of aid practices and
fragility.
Measuring good aid practice
We began by looking for a clear articulation of what
constitutes effective aid delivery in fragile conditions.
Two sources were especially relevant. The first was the
now-retired organization for economic cooperation
and development’s (oecd) Principles for good in-
ternational engagement in Fragile states. these were
originally drafted in 2005 and intended as a comple-
ment to the Paris declaration to adapt its principles
to fragile settings. the second was the g7+ new deal
on Fragile states, which offers a more up-to-date and
country-led articulation of aid effectiveness principles
as they apply in fragile environments.14
these sources are products of the traditional aid ef-
fectiveness agenda and focus on policies and practices
set primarily at the aid agency level. in recent years
a new literature has emerged advocating for adap-
tive, problem-driven approaches to aid practices that
is targeted more at program staff.15 While this can
be interpreted as a rival to the traditional aid effec-
tiveness agenda, we instead consider the two to be
complementary and reflective of the same underlying
principles.16
We derived three essential themes of good donor
stewardship from these sources: 1) showing respect
for countries’ programming, systems, and staff; 2)
working in cooperation with other donors; and 3) be-
ing a source of stability to recipient countries. these
themes are all practical applications of the hippocrat-
ic principle of “do no harm.” they are also norms that
remain relevant in stable countries, so that a compari-
son of practices in fragile and stable countries is still
valid.
our next step was to identify measures of aid practice
that evince the three themes as faithfully as possible.
For this we conducted a review of all known aid data-
sets and donor surveys with extensive international
coverage, as well as previous analyses of good aid
practice.
this resulted in a list of 10 indicators after singling
out those for which donors can reasonably be held ac-
countable for performance, irrespective of the perfor-
Aid effectiveness in frAgile stAtes:How bAd is it And How cAn it improve? 5
14 the implementation of both the oecd’s Principles for good international engagement in Fragile states and the g7+ new deal on Fragile states have been subject to evaluations. however, these have been qualitative in nature and lack rigor. moreover, by treating aid effectiveness in fragile states as sui generis, they resist efforts to compare donor practices in stable and fragile countries.
15 see for instance andrews and Pritchett 2013 and Wild et al. 2015. 16 honig 2016 interprets adaptive, problem-driven approaches in terms of traditional aid effectiveness indicators
taken from the Paris declaration monitoring surveys and thus shows how the two agendas are complementary. see later discussion under Vii. Policy implications.
6 brooke sHeArer series
mance of the recipient country. the indicators capture
aid practices that we judge as being equally feasible in
fragile and stable countries.17
the 10 indicators are as follows:
Respect for countries’ programming, sys-
tems, and staff
1. Reported on budget. recipient governments’
ability to optimize their own spending decisions de-
pends on being fully informed of donor spending
plans. this requires no more than a commitment to
basic communication and courtesy by donors.
2. Use of public financial management systems,
controlling for system quality. donors are encour-
aged to channel their aid through recipient govern-
ments’ public financial management systems in
order to strengthen the systems themselves and to
raise accountability for their performance. yet in
many countries, especially in fragile states, these
systems are poor quality and vulnerable to corrup-
tion as reported by independent assessments. We
provide an objective measure of donors’ use of sys-
tems by controlling for these assessment scores.
3. Use of project implementation units. Pius are
freestanding, parallel structures outside of govern-
ment that replicate public systems. they are typi-
cally operated by personnel poached from govern-
ment with knowledge of how those systems work.
Pius represent one of the most pernicious forms of
aid giving, especially in settings where government
capacity is already weak.
4. Use of programmatic aid, excluding budget sup-
port. Programmatic aid describes activities that are
determined by recipient governments or nongov-
ernmental organizations, combine donor and re-
cipient resources in a single budget framework, and
make some attempt to use recipient systems. direct
budget support is the purest form of programmat-
ic aid but is considered unfeasible in most fragile
states, whereas other forms of programmatic aid
remain viable.
Cooperation with other donors
5. Joint activities. country missions (i.e., visits by
experts or dignitaries) and analytical work are two
areas where donors can cooperate to reduce the
burden on recipients and create shared knowledge.
this approach is feasible everywhere.
6. Aid through others. silent partnerships and del-
egated cooperation arrangements offer bilateral
donors a way to support development in situations
where they may lack relevant expertise, seek to
reinforce successful engagements by others, and/
or minimize the burden on recipients. these ap-
proaches are well-suited for providing aid in diffi-
cult environments.
17 one way to understand our choice of indicators is to relate them to the determinants of aid effectiveness. aid effectiveness is described by howes 2011 as a function of donor characteristics, recipient characteristics and the interaction of the two. our interest here is to focus on donor characteristics, and the interaction component as it relates to fragile states. our approach bears some similarity to knack et al. 2011, which is unique among the studies of aid agency practices in attempting to control for factors that are outside of agencies’ control.
Aid effectiveness in frAgile stAtes:How bAd is it And How cAn it improve? 7
7. Multilateral aid. multilateral aid offers the pur-
est form of cooperation by bilateral donors. to the
extent that it substitutes for bilateral aid, it reduces
the burden on recipients. While the overall scale
of multilateral aid depends on allocation decisions
by donor countries, its use in fragile versus stable
countries depends on the allocation choices of mul-
tilateral agencies themselves.
8. Multi-bi aid. so-called “multi-bi” aid, or non-
core multilateral aid, offers a form of cooperation
between donors in which individual donors retain
some control. aid is pooled in a trust fund and
administered by a multilateral agency separately
from its core funding. the trust fund is devoted to a
specific purpose determined by the sponsoring do-
nors—typically funding collective action problems
that might otherwise be underfunded. this makes
them well-suited for use in fragile states.
Stability to recipient countries
9. Predictable funding. recipient governments are
better able to optimize their own multi-year invest-
ment plans when they can reliably anticipate donor
spending. Previous studies of aid predictability have
often focused on donors’ provision of expenditure
forecasts while overlooking their accuracy. this in-
dicator assesses the accuracy of donors’ spending
forecasts on a one-year time horizon.
10. Volatility. aid volatility has been found to
negatively affect recipients’ economic growth and
to reduce levels of domestic investment. in fragile
states, volatile aid risks amplifying countries’ in-
ternal instability. Previous studies of aid volatility
have typically focused on the volatility of aggregate
aid flows into a country. This overlooks the problem
of volatile flows from individual donors, which pos-
es a particular challenge in fragile states where aid
is highly projectized and so less easily reallocated
to plug shortfalls from other donors. here we as-
sess the volatility of flows at the level of individual
donor-recipient pairs.
of the 10 indicators, four are borrowed wholesale
from those used elsewhere in the aid effectiveness lit-
erature (indicators 1, 3, 5, and 7). the remainder are
tailored to the study of fragile states in one of three
ways: by reworking existing indicators from the lit-
erature to capture the most salient aspects for fragile
states (indicators 9 and 10); by reworking existing in-
dicators from the literature in a way that controls for
the country environment (indicators 2 and 4); or by
monitoring the use of aid delivery modalities that are
well-suited for fragile states (indicators 6 and 8).
the 10 indicators have some weaknesses and cer-
tainly do not capture all relevant aspects of good aid
practice. (see appendix a for a thorough account of
each indicator’s construction, coverage, and weak-
ness). However, we consider them a significant im-
provement on those indicators used in prior analyses
comparing donor performance in fragile and stable
countries.
two additional points should be stressed.
First, the indicators, and the sources from which they
are derived, assume an approach to aid giving in which
donors place their engagement with the state at the
center. Working with the state poses intrinsic chal-
lenges in fragile states but is largely unavoidable so
long as donors view state-building and a strengthen-

8 brooke sHeArer series
ing of the relationship between citizens and the state
as the ultimate route by which countries can escape
fragility. our assessment of aid practices is of less rel-
evance to donors who opt to work on issues that do
not concern the state, and for analyzing humanitarian
assistance.
second, while our choice of indicators represents a
faithful interpretation of the literature on good aid
practices in fragile states, the evidence linking good
practice with development outcomes remains limit-
ed.18 that makes recent research linking aid effective-
ness indicators in fragile states with aid performance
as measured by project evaluations especially impor-
tant, and gives greater credence to the approach ad-
opted by this paper.19
Measuring fragility
a solution to the measurement of fragility is more
straightforward.
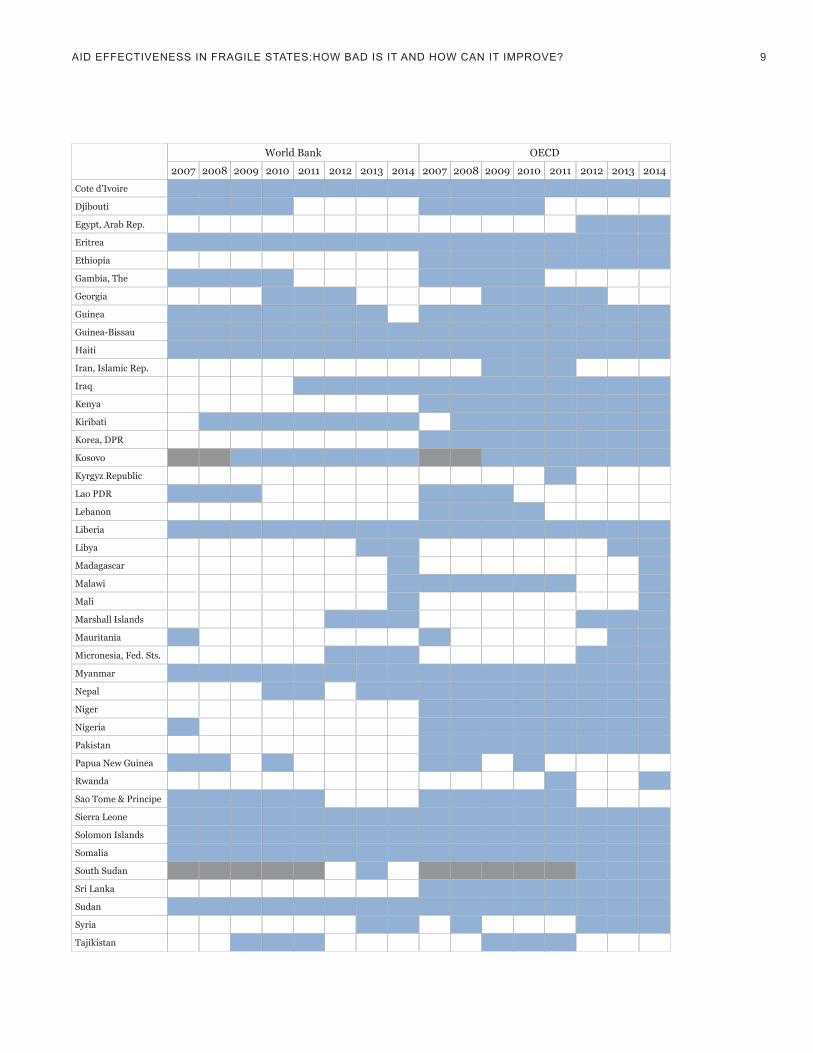
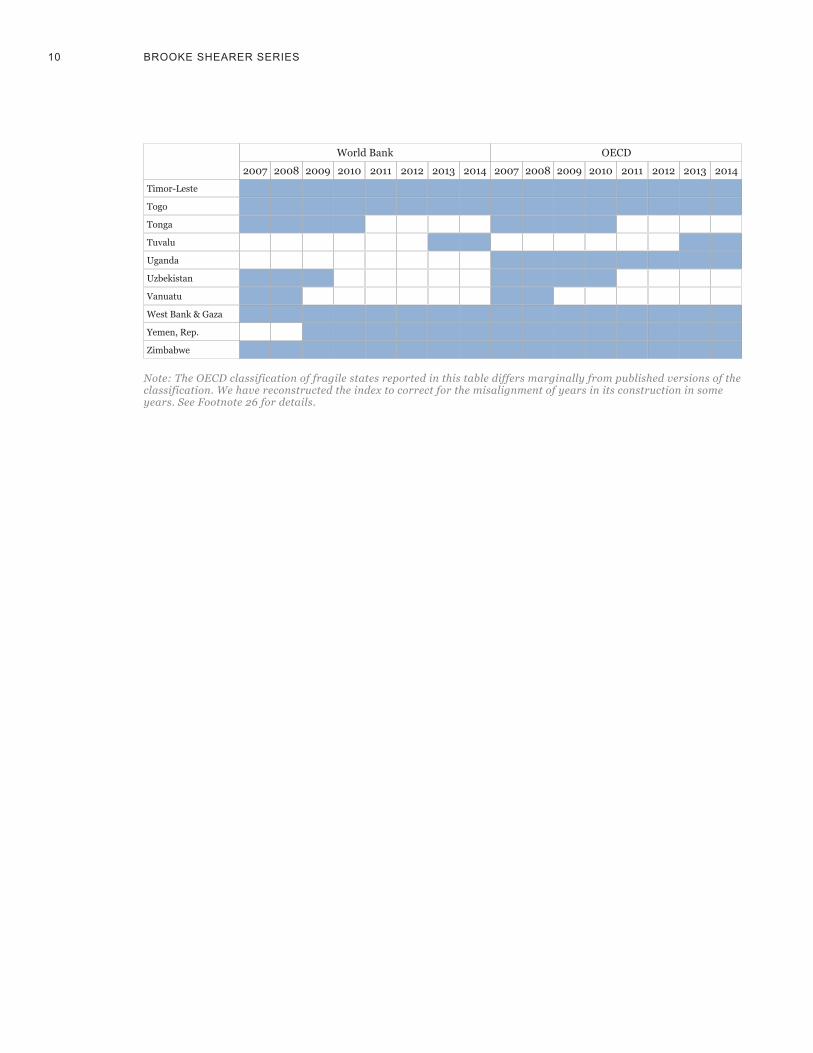
We use both the World Bank and OECD classifica-
tions of fragility when assessing aid practices. these
two classifications are widely used, well-established,
and annually updated. Using both classifications al-
lows us to assess the generalizability of our findings
across different kinds of fragile environments. in ad-
dition, we examine the design of the two fragility clas-
sifications to assess how different kinds of fragility,
and the degree of each country’s fragility, may affect
aid practices. table 1 provides a list of the countries
contained in each of the two fragility classifications.
18 klein and harford 2005; easterly 2007. one area where there is more evidence is aid volatility, which has been linked with lower investment, exports, and gdP in the recipient country. see hudson and mosley 2008; arellano et al. 2005; celasun and Walliser 2005.
19 honig 2016 provides a complementary argument that the aid effectiveness agenda is of particular importance in fragile states, to the extent that it promotes greater agency autonomy and decentralization. the inherent unpredictability of fragile environments implies less of a role for routinized solutions and more adaptive, problem-driven approaches in their place.
afghanistan
angola
bangladesh
bosnia & herzegovina
burkina Faso
burundi
cambodia
cameroon
car
chad
comoros
congo, dem. rep.
congo, rep.
2007
World bank
2008 2009 2010 2011 2012 2013 2014 2007
oecd
2008 2009 2010 2011 2012 2013 2014
table 1: world Bank and oeCd fragility classifications
Aid effectiveness in frAgile stAtes:How bAd is it And How cAn it improve? 9
cote d’ivoire
djibouti
egypt, arab rep.
eritrea
ethiopia
gambia, the
georgia
guinea
guinea-bissau
haiti
iran, islamic rep.
iraq
kenya
kiribati
korea, dPr
kosovo
kyrgyz republic
Lao Pdr
Lebanon
Liberia
Libya
madagascar
malawi
mali
marshall islands
mauritania
micronesia, Fed. sts.
myanmar
nepal
niger
nigeria
Pakistan
Papua new guinea
rwanda
sao tome & Principe
sierra Leone
solomon islands
somalia
south sudan
sri Lanka
sudan
syria
tajikistan
2007
World bank
2008 2009 2010 2011 2012 2013 2014 2007
oecd
2008 2009 2010 2011 2012 2013 2014
10 brooke sHeArer series
2007
World bank
2008 2009 2010 2011 2012 2013 2014 2007
oecd
2008 2009 2010 2011 2012 2013 2014
tonga
tuvalu
uganda
uzbekistan
Vanuatu
West bank & gaza
yemen, rep.
Zimbabwe
Note: The OECD classification of fragile states reported in this table differs marginally from published versions of the classification. We have reconstructed the index to correct for the misalignment of years in its construction in some years. See Footnote 26 for details.
timor-Leste
togo

Aid effectiveness in frAgile stAtes:How bAd is it And How cAn it improve? 11
V. CompAriNg the quALity of Aid prACtiCeS iN frAgiLe ANd StABLe StAteS
our starting point is an assessment of how aid prac-
tices differ in fragile and stable countries across our
10 indicators.
however, it is impossible to make such an assessment
without first determining which states are fragile. We
begin by using the World Bank’s classification, argu-
ably the best-known and most commonly used fragil-
ity classification in the development community. This
classification is made up of two overlapping groups of
countries: low-income economies with meager state
capabilities as reflected in low Country Policy and
Institutional Assessment (CPIA) scores, and conflict
hotspots where peacekeeping missions are active.20
Persistently low cPia scores capture a direct com-
ponent of fragility in terms of the functioning of the
state but also provide a remarkably strong predictor
of civil war.21
our analysis is based on a series of regressions in
which each of our 10 indicators is separately regressed
on a fragile classification dummy variable and a group
of relevant controls.22 each observation represents the
aid received by a given country in a given year from
the donor community. this means there are multiple
observations from the same country in a single regres-
sion, each reflecting aid from a different year.23 the
regressions are weighted using the value of aid repre-
sented by each observation so that the results capture
20 The inclusion of conflict hotspots and the threshold for CPIA scores have not been consistently applied over the history of the World Bank classification. For details see World bank 2016. nevertheless, we employ the World Bank’s classifications as published, given the difficulty of reconstructing the classification retroactively.
21 World bank 201122 the controls include per capita income, population, year dummies, and the share of aid received from each of
the world’s 27 largest donors. donor variables are excluded from the regression for multilateral aid to avoid over-specification.
23 our use of multiple observations from the same country, but from different years, is potentially problematic. If the observations are duplicative they will artificially drive up the significance of our results. Because many countries are persistently fragile or stable, there is not enough within-country variation in the fragility dummy to permit the use of country fixed effects. For those states that are not persistently fragile or stable, our approach allows us to analyze the relationship between aid practices and fragility as their status changes over time. Our confidence in this approach is strengthened by the fact that our results were unaffected when we tried running our analysis using regional dummy variables as a crude substitute for fixed effects. Our use of multiple observations from each country is further justified by the fact that each country’s values on each indicator vary significantly across years.

12 brooke sHeArer series
the effect of fragility on a typical dollar of aid.24 our
analysis uses all available data for each indicator from
the year 2007, when the World bank fragility classi-
fication was sufficiently well-established, to 2014,
which is the last year for which detailed estimates of
aid flows are available. The number of years for which
there are observations and the degree of country cov-
erage vary significantly across our 10 indicators. (See
appendix a for details). this poses an important,
though unavoidable, limitation on the robustness of
our findings.
table 2 summarizes the key results. (Full regression
results are provided in appendix b.) Fragility is a sig-
nificant correlate of worse aid practices for six of the
10 effectiveness indicators, and a significant correlate
of better practices for two indicators.25 the inferior
performance of donors in fragile states relative to
stable countries is especially apparent on indicators
concerned with donor respect for countries’ program-
ming, systems, and staff. on the positive side, there is
evidence that donors are employing cooperative ar-
rangements in fragile states that are especially suited
to these environments—namely, multi-bi aid and de-
livering aid through others. For several indicators,
fragility does not just account for a significant differ-
ence in aid practices but the differences are large in
absolute terms.
On balance, these results reinforce the findings of ear-
lier studies that donor practices in fragile states are
inferior to those in stable countries, at least on the
basis of the World Bank’s fragility classification. This
judgment can now be made with greater certainty
24 the value of aid is measured in gross country programmable aid. this is a narrow measure of aid limited to flows available for development projects and programs, which is therefore free of the volatility associated with debt relief and humanitarian assistance.
25 Significance here and throughout the paper refers to the 10 percent significance level. Of the eight indicators where fragility is a significant determinant of aid practices, seven are also significant at the 5 percent level. See appendix b for details.
Respect
Cooperation
Stability
► aid is reported on budget 12 percentage points less in fragile states.► Donors use recipient public financial management systems 8 percentage points less in fragile states.► There is no significant difference between donors’ use of PIUs in fragile and stable states. ► Programmatic aid is 10 percentage points lower in fragile states.
► donors perform 10 percentage points fewer of their activities jointly with other donors in fragile states.
► donors provide 6 more percentage points of aid through other donors in fragile states. ► Fragile states receive 9 fewer percentage points of their aid from multilateral donors.► Fragile states receive 7 more percentage points of their aid in multi-bi aid.
► There is no significant difference in the accuracy of donors’ aid projections in fragile and stable states. ► aid volatility is 7 percentage points higher in fragile states.
table 2: Comparing aid practices in fragile and stable states using world Bank fragility classification
Note: Higher scores indicate better performance on all indicators other than use of PIUs, predictable funding, and volatility.

Aid effectiveness in frAgile stAtes:How bAd is it And How cAn it improve? 13
given our choice of effectiveness measures that do not
penalize against fragile states but rather capture prac-
tices that are equally feasible in both environments.
however, there are at least two alternative explana-
tions for these results that deserve a hearing.
First, it is possible that the results are driven by old
inferior donor practices employed in the earlier years
of the period under analysis. since that time, it may be
argued, donors have become more aware of the risks
of doing harm in fragile environments, and adapted
their practices accordingly.
to test for this, we tried interacting our fragility
dummy with the year dummies to specifically cap-
ture changes in donor performance in fragile states.
We also ran the same regressions using a continuous
year variable in place of the year dummies in case this
might better capture trends over time. We found no
evidence of improved donor behavior in either model.
this should come as no great surprise given the very
modest progress reported against targets in the moni-
toring frameworks of the Paris declaration and the
global Partnership for effective development coop-
eration. (Full regression results are provided in ap-
pendix c.)
a second explanation is that the relationship we ob-
serve between donor performance on effectiveness
measures and the country setting reflects the different
content of aid projects and programs in fragile and
stable environments. in other words, the patterns in
aid allocations and modalities should not be inter-
preted as autonomous donor choices in response to
the country environment, but rather they are a func-
tion of the sectors and activities that are prioritized in
each setting.
to test whether this interpretation is valid, we re-ran
our regressions with a series of sector share dum-
mies using oecd development assistance commit-
tee (dac) sector headings, and interacted these with
our fragility dummy. We find scant evidence of a rela-
tionship between our aid effectiveness measures and
either the sectors in which aid is employed in gener-
al, or the sectors in which aid is employed in fragile
states alone. (Full regression results are provided in
appendix d.)

14 brooke sHeArer series
Vi. teStiNg frAgiLity CLASSifiCAtioNS
our initial regression results indicate that donors
discriminate against fragile states as classified by the
World Bank. In other words, the World Bank’s defini-
tion of fragility is capturing some important recipient
characteristics that affect donor behavior. however,
what is true for the World Bank classification may not
hold for other classifications that capture other types
of fragility.
We therefore test again for differences in aid prac-
tices between fragile and stable states, substituting
the OECD DAC’s classification for the World Bank’s
classification. The OECD DAC’s list of fragile states is
broader, combining all countries on the World bank
list with additional countries facing a range of risks
reflected in an elevated score on the Fund for Peace’s
Fragile states index.26
table 3 summarizes the key results. Fragility is a sig-
nificant correlate of worse aid practices for only two of
the 10 effectiveness indicators and a significant cor-
relate of better practices for two indicators. the four
significant results are consistent with those found
under the World Bank fragility classification. How-
ever, for the remaining six indicators, no significant
relationship is found. (Full regression results are pro-
vided in appendix e.)
the relationship between aid practices and fragility
is thus considerably less apparent under the oecd
DAC fragility definition. This is true both in terms of
the smaller number of indicators for which fragility ac-
counts for a significant difference in aid practices and
the scale of these differences in absolute terms. criti-
cally, our earlier finding using the World Bank’s clas-
sification that donor practices in fragile states are, on
average, inferior to those in stable countries, does not
carry across to the OECD DAC’s broader classification.
26 We reconstruct the OECD classification ourselves to correct for the misalignment of years in the incorporation of the World bank and Fund for Peace categories in published versions of the oecd fragile states list. this is necessary to allow a fair comparison of donor practices across the OECD and World Bank classifications.
Respect
Cooperation
Stability
► aid is reported on budget 8 percentage points less in fragile states.► There is no significant difference in donors’ use of recipient public financial management systems in
fragile and stable states. ► There is no significant difference between donors’ use of PIUs in fragile and stable states. ► There is no significant difference between the use of programmatic aid in fragile and stable states.
► There is no significant difference in donors’ use of joint activities in fragile and stable states.► donors provide 6 more percentage points of aid through other donors in fragile states. ► Fragile states receive 3 fewer percentage points of their aid from multilateral donors.► Fragile states receive 6 more percentage points of their aid in multi-bi aid.
► There is no significant difference in the accuracy of donors’ aid projections in fragile and stable states. ► There is no significant difference in aid volatility between fragile and stable states.
table 3: Comparing aid practices in fragile and stable states using oeCd dAC fragility classification
Note: Higher scores indicate better performance on all indicators other than use of PIUs, predictable funding, and volatility.

Aid effectiveness in frAgile stAtes:How bAd is it And How cAn it improve? 15
this serves as an important reminder that fragility is
a broad term whose definition is contested. What is
true for one set of fragile states cannot be casually ap-
plied to all others. Competing fragile state classifica-
tions should not be viewed as imperfect proxies of the
same underlying characteristics; they are more likely
measures of different characteristics entirely.
our next step was to try to understand what explains
the divergence between our results from the two fra-
gility classifications. We did this by comparing the
composition of the two country groups to see if we
can identify differences in their underlying character-
istics. our approach was to compare countries in the
World Bank classification with those uniquely in the
OECD DAC classification since it is the addition of the
latter countries that drives the differences between
our two sets of results.
We began by calculating the average scores of the two
country groups on the Fragile states index. We did
this for each of the years 2007 to 2014, using the same
aid weights employed in our regressions.27 the average
score for the countries in the World Bank classifica-
tion is higher, on average, than for countries uniquely
in the OECD DAC classification, where higher scores
indicate greater levels of fragility. this difference is
statistically significant, yet still relatively small.28 this
suggests that it could be the degree of fragility that
accounts for the differences in our results, with fragil-
ity leading, on average, to inferior aid practices only
where fragility is greatest. yet, when we test this hy-
pothesis by regressing our aid effectiveness indicators
on the Fragile states index scores using only observa-
tions from countries on the oecd dac fragile states
list, we fail to establish such a relationship.
to dig a little deeper, we look at the average scores
of the two country groups on the 12 components of
the Fragile states index, again using the same aid
weights—see table 4. the countries in the World
Bank classification are found to be significantly more
fragile than those uniquely in the OECD DAC classifi-
cation on six of the components, and significantly less
fragile on one component.
these components point to different roots and mani-
festations of fragility that might feasibly influence aid
practices differently and therefore account for our
divergent regression results. yet in the absence of a
clear theory of how these components relate to each
other, this surely risks over-interpreting the differ-
ences between the components of the Fragile states
index. this view is reinforced by the inherent con-
testability of the Fragile states index as a measure of
fragility, and the imperfections in the data used in its
construction, both of which have been widely docu-
mented.29
27 the country groups therefore contain multiple entries of the same country when that country features repeatedly in a classification over several years. These entries will each have a unique Fragile States Index score and aid weight corresponding to a given year.
28 We obtain a similar result when we replace the Fragile states index scores with those from the international country risk guide (icrg)’s Political risk index. this is based on a smaller sample of countries given the smaller country coverage of the icrg data.
29 acLed 2014

security apparatus 8.73 8.34 0.38**
16 brooke sHeArer series
table 4: Average fragile States index scores by fragility classification
Fsi component
demographic Pressures 8.67 8.49 0.18
group grievance 8.49 8.79 -0.30**
uneven development 8.24 8.25 -0.00
Legitimacy of the state 8.91 8.45 0.46***
human rights 8.32 8.29 0.03
Factionalized elites 8.84 8.98 -0.14
total 101.27 97.84 3.43***
refugees and idPs 8.33 7.81 0.52***
human Flight 7.33 7.34 -0.02
Poverty and economic decline 7.97 7.41 0.56***
Public services 8.53 7.85 0.68***
external intervention 8.90 7.82 1.08***
World bank Fragile states
oecd only Fragile states difference
if our interest is in raising aid effectiveness in frag-
ile states, it makes sense to define fragility in terms
of recipient characteristics that actually affect donor
behavior. For this reason, in our remaining analysis
we focus only on the World Bank’s fragility classifi-
cation in an attempt to understand this relationship
more clearly.
*** p<0.01, ** p<0.05, * p<0.1

Aid effectiveness in frAgile stAtes:How bAd is it And How cAn it improve? 17
Vii. CompAriNg the quALity of Aid prACtiCeS ACroSS doNorS
the preceding analysis showed that fragility, as de-
fined by the World Bank, explains only a portion of
aid practices, and our use of donor control variables
pointed to differences between donors. in this section,
we turn the spotlight on to these differences. this can
help to identify which donors are responsible for bad
practice in fragile states and most vulnerable to ac-
cusations of doing harm. The identification of better
and worse performing donors in fragile states might
reasonably help to raise aid industry performance by
prompting donors to either improve their practices
or reallocate their aid in ways that improve the divi-
sion of labor among donors. to reiterate, we rely ex-
clusively on the World Bank classification of fragile
states in this part of our analysis given its success in
capturing recipient characteristics that cause donors
to perform differently.
to give our analysis a sharper focus, we narrow our
attention on 22 donors that each account for at least
1 percent of global aid to fragile states in any year be-
tween 2007 and 2014.30 For each of our aid effective-
ness indicators, we examine the performance of these
donors in both stable and fragile countries by accumu-
lating unique scores for each donor-recipient pair in
each year.31 these scores are then standardized so that
the aid-weighted mean is equal to zero. the standard-
ized scores are then aggregated up across recipients to
generate a separate donor score in fragile and stable
countries for each indicator, using weights based on
the value of aid each observation represents.32 Finally,
we combine each donor’s scores across the indicators
with a simple average to generate a separate score for
its overall effectiveness in fragile and stable countries
that can be compared with the other 21 donors.33
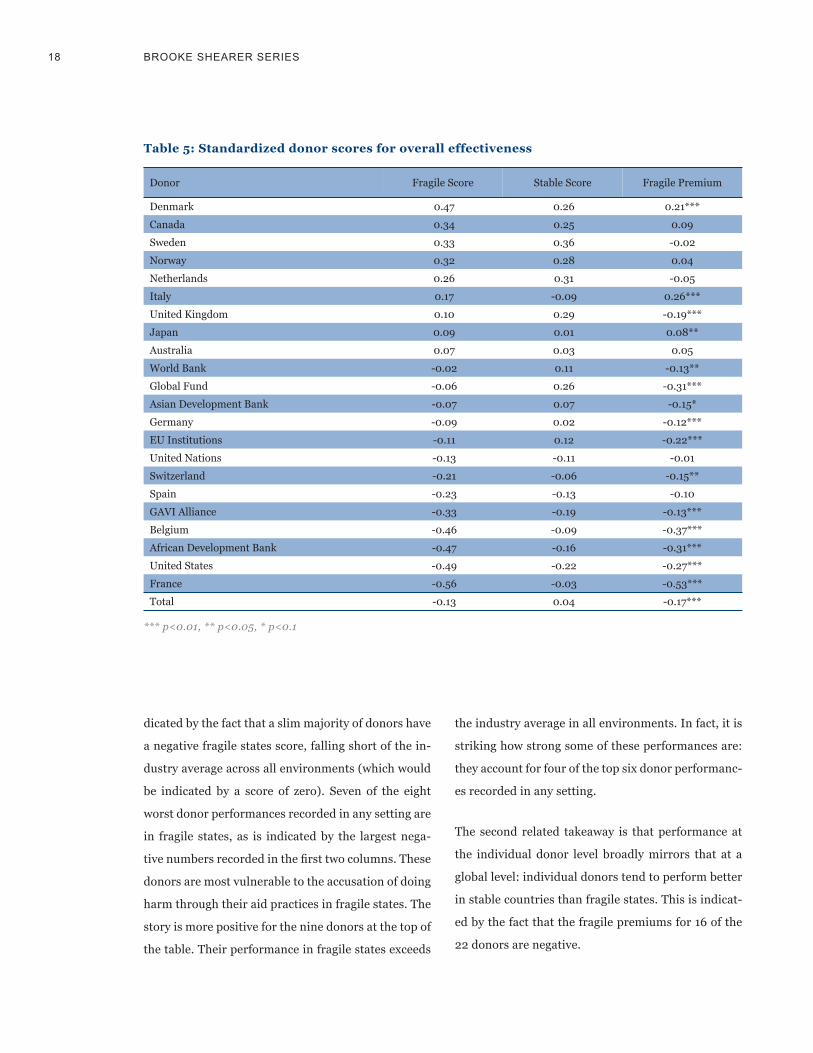
table 5 contains the headline results. (scores for in-
dividual indicators both in standardized and absolute
terms are provided in Appendix F.) The first column
provides donor scores in fragile states, the second col-
umn provides donor scores in stable countries, and
the third column provides the difference between do-
nor scores in the two environments, which we call the
“fragile premium.”
The first takeaway, which is consistent with our ear-
lier analysis, is that donor performance is typically,
though not always, subpar in fragile states. this is in-
30 We also exclude those donors for whom we have insufficient data to track performance on at least four of our effectiveness indicators—namely, the arab Fund, the international monetary Fund, turkey, and united arab emirates.
31 We drop the multilateral aid indicator as this cannot be measured at the level of individual donor-recipient pairs. When, for any given indicator, we have insufficient data to account for at least 20 percent of a donor’s gross country programmable aid in either stable or fragile settings, we exclude that donor’s pair-level data from our analysis of that indicator.
32 the value of aid is again measured in gross country programmable aid.33 this approach, which is borrowed from other papers in the aid effectiveness literature—see for instance
birdsall and kharas 2010—has the virtue of allowing us to include donors that do not record scores in every one of the nine indicators.
18 brooke sHeArer series
World bank -0.02 0.11 -0.13**
table 5: Standardized donor scores for overall effectiveness
donor
denmark 0.47 0.26 0.21***
sweden 0.33 0.36 -0.02
netherlands 0.26 0.31 -0.05
united kingdom 0.10 0.29 -0.19***
australia 0.07 0.03 0.05
global Fund -0.06 0.26 -0.31***
germany -0.09 0.02 -0.12***
united nations -0.13 -0.11 -0.01
spain -0.23 -0.13 -0.10
belgium -0.46 -0.09 -0.37***
united states -0.49 -0.22 -0.27***
total -0.13 0.04 -0.17***
canada 0.34 0.25 0.09
norway 0.32 0.28 0.04
italy 0.17 -0.09 0.26***
Japan 0.09 0.01 0.08**
asian development bank -0.07 0.07 -0.15*
eu institutions -0.11 0.12 -0.22***
switzerland -0.21 -0.06 -0.15**
gaVi alliance -0.33 -0.19 -0.13***
african development bank -0.47 -0.16 -0.31***
France -0.56 -0.03 -0.53***
Fragile score stable score Fragile Premium
*** p<0.01, ** p<0.05, * p<0.1
dicated by the fact that a slim majority of donors have
a negative fragile states score, falling short of the in-
dustry average across all environments (which would
be indicated by a score of zero). seven of the eight
worst donor performances recorded in any setting are
in fragile states, as is indicated by the largest nega-
tive numbers recorded in the first two columns. These
donors are most vulnerable to the accusation of doing
harm through their aid practices in fragile states. the
story is more positive for the nine donors at the top of
the table. their performance in fragile states exceeds
the industry average in all environments. in fact, it is
striking how strong some of these performances are:
they account for four of the top six donor performanc-
es recorded in any setting.
the second related takeaway is that performance at
the individual donor level broadly mirrors that at a
global level: individual donors tend to perform better
in stable countries than fragile states. this is indicat-
ed by the fact that the fragile premiums for 16 of the
22 donors are negative.
Aid effectiveness in frAgile stAtes:How bAd is it And How cAn it improve? 19
While donor practices are on average less effective
in fragile states than in stable environments, perfor-
mance in fragile states still varies significantly be-
tween donors. that variance might be explained by
one or both of two factors: differences between donor
performance in general that are independent of the
environment, or differences between donors in how
they differentiate between stable and fragile condi-
tions. in other words, a bad (or good) donor in fragile
states may be one who is bad (or good) everywhere,
reflected in a high correlation in the scores across the
first two columns, or one who discriminates negative-
ly (or positively) toward fragile states, reflected in a
high correlation in the scores between the first and
third column.
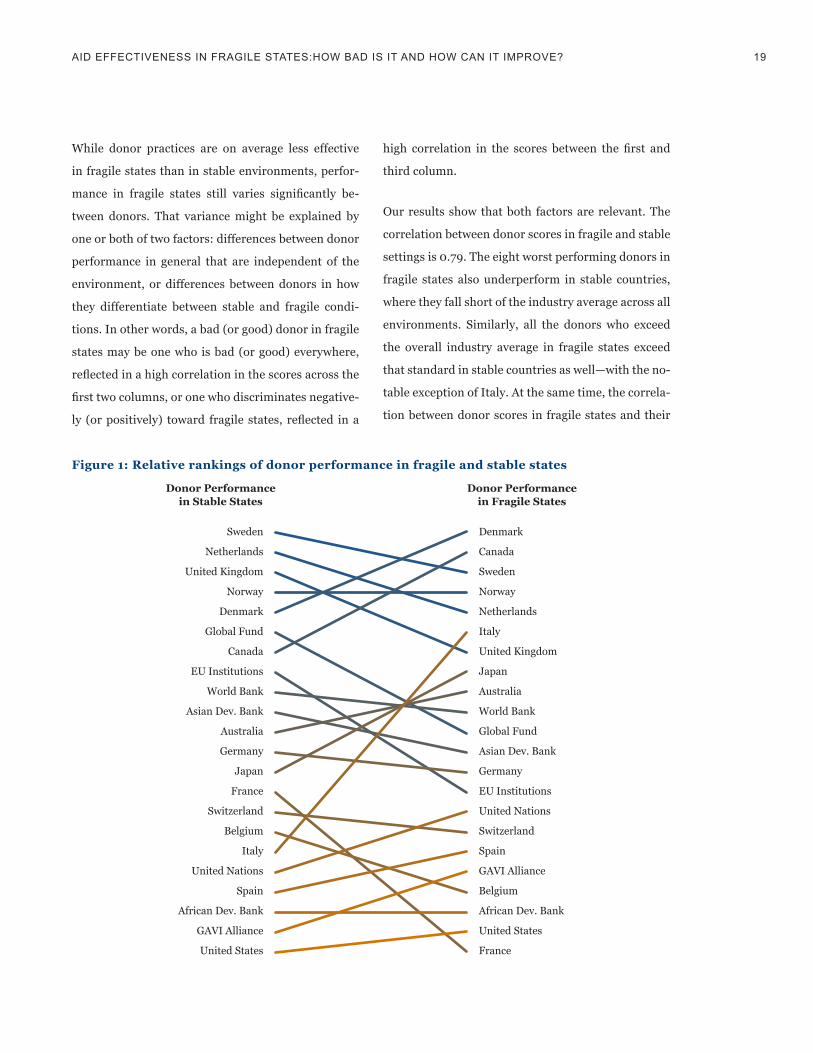
our results show that both factors are relevant. the
correlation between donor scores in fragile and stable
settings is 0.79. the eight worst performing donors in
fragile states also underperform in stable countries,
where they fall short of the industry average across all
environments. similarly, all the donors who exceed
the overall industry average in fragile states exceed
that standard in stable countries as well—with the no-
table exception of italy. at the same time, the correla-
tion between donor scores in fragile states and their
figure 1: relative rankings of donor performance in fragile and stable states
donor performance in Stable States
donor performance in fragile States
sweden
netherlands
united kingdom
norway
denmark
global Fund
canada
eu institutions
World bank
asian dev. bank
australia
germany
Japan
France
switzerland
belgium
italy
united nations
spain
african dev. bank
gaVi alliance
united states
denmark
canada
sweden
norway
netherlands
italy
united kingdom
Japan
australia
World bank
global Fund
asian dev. bank
germany
eu institutions
united nations
switzerland
spain
gaVi alliance
belgium
african dev. bank
united states
France
20 brooke sHeArer series
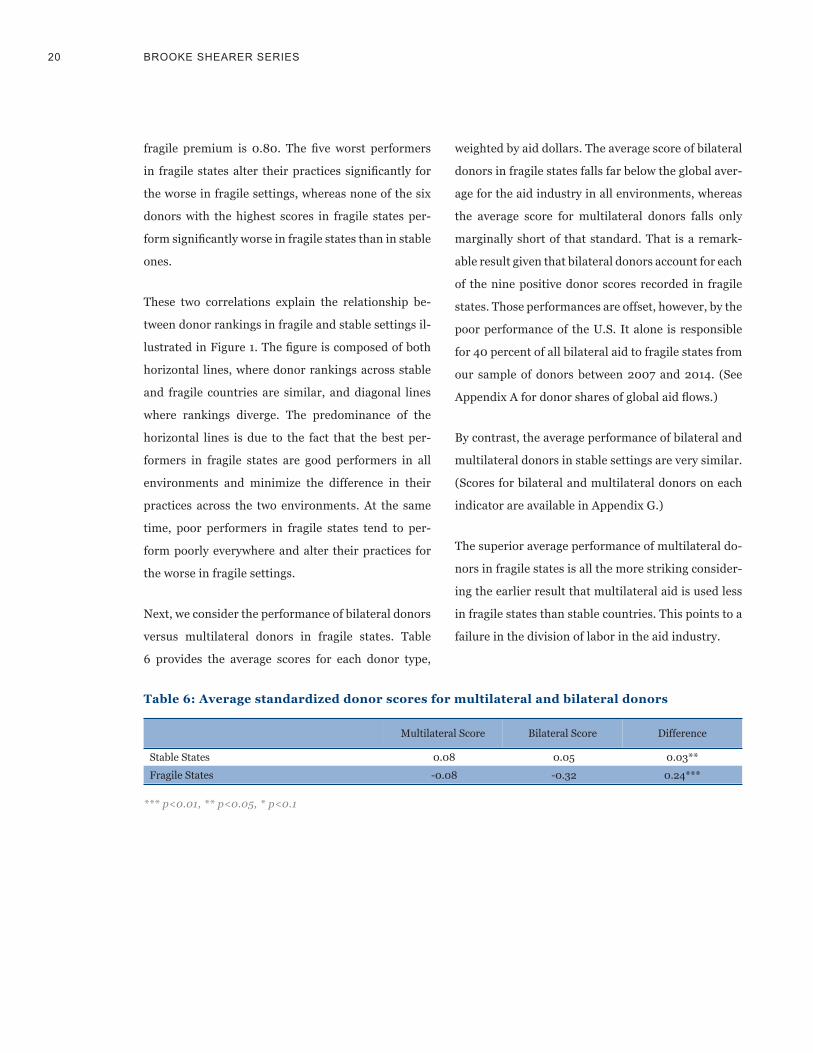
table 6: Average standardized donor scores for multilateral and bilateral donors
stable states 0.08 0.05 0.03**
Fragile states -0.08 -0.32 0.24***
multilateral score bilateral score difference
fragile premium is 0.80. The five worst performers
in fragile states alter their practices significantly for
the worse in fragile settings, whereas none of the six
donors with the highest scores in fragile states per-
form significantly worse in fragile states than in stable
ones.
these two correlations explain the relationship be-
tween donor rankings in fragile and stable settings il-
lustrated in Figure 1. The figure is composed of both
horizontal lines, where donor rankings across stable
and fragile countries are similar, and diagonal lines
where rankings diverge. the predominance of the
horizontal lines is due to the fact that the best per-
formers in fragile states are good performers in all
environments and minimize the difference in their
practices across the two environments. at the same
time, poor performers in fragile states tend to per-
form poorly everywhere and alter their practices for
the worse in fragile settings.
next, we consider the performance of bilateral donors
versus multilateral donors in fragile states. table
6 provides the average scores for each donor type,
weighted by aid dollars. the average score of bilateral
donors in fragile states falls far below the global aver-
age for the aid industry in all environments, whereas
the average score for multilateral donors falls only
marginally short of that standard. that is a remark-
able result given that bilateral donors account for each
of the nine positive donor scores recorded in fragile
states. those performances are offset, however, by the
poor performance of the u.s. it alone is responsible
for 40 percent of all bilateral aid to fragile states from
our sample of donors between 2007 and 2014. (see
Appendix A for donor shares of global aid flows.)
by contrast, the average performance of bilateral and
multilateral donors in stable settings are very similar.
(scores for bilateral and multilateral donors on each
indicator are available in appendix g.)
the superior average performance of multilateral do-
nors in fragile states is all the more striking consider-
ing the earlier result that multilateral aid is used less
in fragile states than stable countries. this points to a
failure in the division of labor in the aid industry.
*** p<0.01, ** p<0.05, * p<0.1
Aid effectiveness in frAgile stAtes:How bAd is it And How cAn it improve? 21
Viii. poLiCy impLiCAtioNS
the aid industry’s approach to fragile states has un-
dergone significant change since the start of the cen-
tury. Whereas 15 years ago donor policy toward frag-
ile states could be characterized as mildly allergic,
recent years have seen earnest attempts to deepen
support and find more effective ways of working in
these countries, motivated by some combination of
evidence, theology, and politics.
three aspects of this change are noteworthy. First, do-
nors have come to see fragile states as a shared respon-
sibility of the global community—a global public bad
that will be insufficiently resourced unless all donors
bear part of the burden. second, donors have sought
to structure their engagement with fragile states in
terms of a mutually accountable relationship, where-
by both donor and recipient jointly commit to actions
that can improve development outcomes. this recog-
nizes that donor action alone is insufficient to deliver
countries from fragility but hinges on actions taken
by countries themselves. third, program staff have
been encouraged to adopt a more adaptive, problem-
driven approach to project design and implementa-
tion, which forces attention on understanding how
progress can be supported in a given context.
the analysis in this paper suggests that these well-
intentioned policies may have had unintended conse-
quences. conceiving of fragile states as a shared bur-
den encourages donors to give aid to countries where
they may have little or no expertise, which increases
the likelihood of doing harm. conditioning changes in
donor practice on recipient country reforms is a recipe
for inaction in fragile states, where fragility extends
to the ability of government to fulfill their commit-
ments.34 Finally, a focus on adaptive, problem-driven
approaches has been interpreted as an alternative to
the traditional aid effectiveness agenda and shifted
attention away from agency-level reforms, providing
cover for those efforts to stall.
the latest set of proposals for advancing aid effective-
ness in fragile states seems to double down on these
ideas.35 We propose two alternative policies that can
serve as a course correction.
The first is to define some minimum standards for do-
nor practices in fragile states. this would serve as a
practical manifestation of a hippocratic oath for do-
nors. to be credible, these standards would have to
be observable and verifiable. The set of 10 indicators
used in this paper provide a possible starting point for
thinking about how such standards could be defined.
the truth is that upholding such standards is going
to be a challenge. attempts to improve donor perfor-
mance through the agreement of goals and the moni-
toring of indicators have a woefully poor track record.
34 this may help to explain the disappointing track record in the implementation of the new deal on Fragile States—specifically its failure to deliver meaningful reform in donor practices.
35 For instance, greenhill 2016 explicitly pits adaptive problem-driven approaches as an alternative to the traditional aid effectiveness agenda and argues that the former is more appropriate in fragile states. meanwhile, norris 2016 proposes a new modality for u.s. engagement in borderline fragile states built explicitly around a mutual accountability framework, which, rather than buttressing countries against their internal instability, could easily reinforce these effects.
22 brooke sHeArer series
earlier this month, the global Partnership on effec-
tive development cooperation met in nairobi to de-
clare that none of the industry goals set five years ago
in busan have been met. the busan meeting, it should
be recalled, was the culmination of the previous at-
tempt to raise effectiveness among donors, which
proved a similar flop. The only difference in Nairobi,
compared to busan, was the absence of any sense of
outrage. expectations had been calibrated. a new ef-
fort to raise donor performance specifically in fragile
states will have to think of ways to avoid this fate.
the second policy, which could form part of the mini-
mum standards, is to encourage a stronger division of
labor among donors in fragile states. We specifically
would encourage greater reliance on the better per-
forming multilateral agencies by the worst perform-
ing bilateral donors. this too is not a straightforward
ask—especially in the u.s. since its poor performance
looms over the other donors given its outsized share
of global aid to fragile states. nevertheless, this may
prove to be the simplest way to lift aid industry per-
formance in these settings. the World bank’s upcom-
ing international development association replenish-
ment, which promises to deliver a significant scaling
up of resources and intent in fragile states, provides a
promising opportunity to jumpstart this change.

Aid effectiveness in frAgile stAtes:How bAd is it And How cAn it improve? 23
AppeNdix A: deSCriptioN of iNdiCAtorS, dAtA CoVerAge, ANd SummAry StAtiStiCS
Definitions of Indicators
Reported on budget
our measure of the extent to which aid is reported
on recipients’ budgets compares two values from the
Paris and global Partnership surveys: the amount of
oda disbursed to the government sector as reported
by donors, and the same amount as recorded on re-
cipients’ budget sheets. We divided aid recorded by
aid disbursed and calculated the absolute deviation
from 1 for each donor-recipient pair in each year.
our use of the absolute deviation captures both un-
der- and over-reporting because both forms of mis-
communication between donors and recipients lead
to less effective aid.
however, it should be noted that the extent to which
aid appears on recipient budgets may be determined
in part by the recipient as well as by the donor. if re-
cipients do not have the will or the capacity to record
and publish accurate accounts of aid received, there
may be discrepancies between aid recorded and aid
disbursed through no fault of the donor. in this re-
spect, the indicator fails to fully control for recipient
country characteristics.
Use of public financial management (PFM) systems
the Paris and global Partnership surveys asked do-
nors to report what percent of their oda to the gov-
ernment sector uses 1) national budget execution pro-
cedures, 2) national financial reporting procedures,
and 3) national auditing procedures. We averaged
these three percentages to measure the share of aid
that goes through public financial management sys-
tems.
The use of public financial management systems is
clearly less feasible in countries where systems are of
poor quality, and our indicator takes this into account.
the Paris and global Partnership surveys used sub-
component 13 of the World bank’s country Policy and
institutional assessment (cPia) scores to measure
the quality of recipient systems. to measure donor
use of PFm systems conditioned on system quality,
we first regressed our measure of system quality on
the share of aid channeled through PFm systems for
each donor-recipient pair in each year. We then calcu-
lated the residuals from this regression. this captures
the extent of donor use of PFm systems that is unex-
plained by system quality.
Use of project implementation units (PIUs)
the Paris surveys asked donors how many parallel
Pius were used in delivering aid to the government
sector. Because the question specifically asked about
parallel Pius, our indicator avoids punishing donors
for creating project implementation units in places
where no comparable government system exists. in
order to control for aid volume, our indicator mea-
sures the number of PIUs per $100 million of official
development assistance (oda) to the government
sector for each donor-recipient pair in each year.
Use of programmatic aid, excluding budget support
the Paris surveys asked donors for the amount of
oda that was provided in support of initiatives
adopting program-based approaches. donors report
24 brooke sHeArer series
two sub-components of that amount: direct budget
support and other programmatic aid. We measured
only other programmatic aid to avoid discriminating
against fragile states, where direct budget support is
in most cases considered unfeasible. We calculated
this volume as a share of total oda for each donor-
recipient pair. Following Paris indicator 9, we divided
by total oda instead of oda to the government sector
because programmatic approaches are possible when
working with the nongovernment sector.36
in stable countries, it is possible that donors use di-
rect budget support as a substitute for other forms
of programmatic aid. if this is the case, our indicator
would be biased toward finding greater amounts of
programmatic aid in fragile situations.
Joint activities
donors reported on two types of joint activities in
the Paris surveys: joint missions and joint analytical
work. We calculated joint missions as a share of total
missions and joint analytical work as a share of total
analytical work, and took the simple average of these
two percentages for each donor-recipient pair.
Aid through others
the Paris and global Partnership surveys ask donors
to report the value of any oda to the government sec-
tor that they disburse through other donors. aid given
through other donors can include delegated coopera-
tion arrangements, “silent” partnerships, or contribu-
tions channeled through multilateral donors at the
country level. We calculated the ratio of this value to
all oda to the government sector provided directly
by each donor, to reflect a donor’s reliance on this aid
modality relative to the size of its direct efforts for
each donor-recipient pair.
Multilateral aid
We calculated the share of each recipient’s country
programmable aid (cPa) in each year that comes
from multilateral donors.
this indicator cannot be measured at the donor-
recipient level—the share of multilateral aid from a
multilateral donor is always 100 percent and the share
of multilateral aid from a bilateral donor is always 0
percent. the indicator is therefore excluded from our
analysis of individual donors’ effectiveness.
Multi-bi aid
our measure of multi-bi aid, also known as non-core
multilateral aid, is drawn from the oecd dac’s re-
cords of cPa channeled through multi-donor trust
funds. We calculated multi-bi cPa as a share of total
cPa for each donor-recipient pair in each year, ex-
cluding all regional funds.
multi-bi aid has been rightly criticized for its distor-
tionary effect on multilateral agencies.37 however, it
represents an unambiguous improvement over bilat-
eral aid from the perspective of recipients by enabling
donors to cooperate and harmonize efforts.
36 oecd 201037 oecd 2011
Aid effectiveness in frAgile stAtes:How bAd is it And How cAn it improve? 25
the multi-bi aid modality is employed only by bilater-
al donors. We therefore excluded this indicator from
our measurement of donor performance for multilat-
eral donors.
Predictable funding
We assessed the accuracy of donors’ spending predic-
tions by comparing predicted and actual oda to the
government sector as reported in the Paris and global
Partnership surveys. donors reported their predicted
and actual spending for the same year, allowing us to
measure predictability on a one-year time horizon.
to determine this measure, we calculated the absolute
difference between actual oda and predicted oda
and divide this by predicted oda to obtain a devia-
tion ratio—strictly speaking, a measure of unpredict-
ability. We used absolute deviations to capture the
fact that both under- and over-delivering on promised
aid undermine recipient governments’ ability to op-
timize their own budget allocations. We also capped
the ratio at 100 percent to ensure symmetry between
under- and over-delivering; while donors cannot pro-
vide fewer than zero dollars, there is no upper limit on
how much they can provide. over-delivering by 400
percent is not four times worse than under-delivering
by 100 percent and failing to give any aid at all. the
cap ensures that we avoided misinterpreting such
situations.
unlike many measures of predictability, our indicator
is calculated at the donor-recipient pair level. this is
predicated on the fact that aid from different donors
is not perfectly fungible. this is especially the case in
fragile states where aid is highly projectized, so aid
from one donor cannot necessarily be used to fill in
the gaps left by another. using a measure of the pre-
dictability of each recipient’s aggregate aid receipts,
aid would be considered highly predictable in a coun-
try where all donors’ forecast expenditure collectively
add up to $1 billion and $1 billion is provided, even
though individual donors provide drastically more or
less than they promise.
it is possible that the amount of aid delivered could
fall short of the predicted amount due to the limita-
tions of the recipient government’s implementation
capacity. Predictability is largely but not entirely a
function of donor practices, and this should be kept
in mind when interpreting donor performance on this
indicator.
Volatility
our indicator measures volatility in cPa which, un-
like oda, excludes sectors such as debt relief and hu-
manitarian aid where volatility is expected and often
welcome. to measure volatility, we regressed cPa for
each donor-recipient pair on time using four years’
worth of data—for example, 2010 volatility scores are
based on data going back to 2007—and calculated the
residuals. these residuals represent the de-trended
flows of CPA, or the difference between actual CPA
and the amount of cPa we would have expected based
on trends over time.
We then calculated the coefficient of variation—the
standard deviation as a share of the mean—of the
residuals within that four-year period to obtain a
volatility score. Finally, we adjusted the coefficient of
variation to account for the importance of aid in the
recipient country. Volatility matters most where aid
is large relative to the share of the recipient economy;
26 brooke sHeArer series
for instance, highly volatile aid could destabilize ma-
lawi but will barely register in brazil. We therefore
took the value of cPa for each donor-recipient pair,
divided by the recipient’s share of gdP, and took the
square root to moderate the impact of extreme values.
We then multiplied each volatility score by this value
divided by the aid-weighted mean of all such values.
this serves to increase the volatility score for coun-
tries in which aid is a greater-than-average share of
gdP, and vice versa.
the oecd dac’s cPa data is less complete prior
to 2007 and we would run the risk of interpreting
gaps in reporting as evidence of volatile aid flows if
we were to calculate volatility scores using data from
earlier years. because our scores for each year rely on
data from the three preceding years as well, we can
only calculate volatility scores for 2010 through 2013.
Donor-recipient pairs with CPA flows in fewer than
three of the four years are also excluded.
it should be noted that, in rare cases, aid volatility
may be a sign that donors are being appropriately re-
sponsive to changing situations in recipient countries.
For example, a large unexpected increase in aid would
be justified if donors chose to show strong support
for a new government that takes on positive reforms.
For further discussion of aid volatility as a response
to changing circumstances in recipient countries, see
desai and kharas (2010).
as with predictability, it is important to measure vol-
atility at the donor-recipient pair level instead of at
the aggregate level because aid is highly projectized
in fragile states.
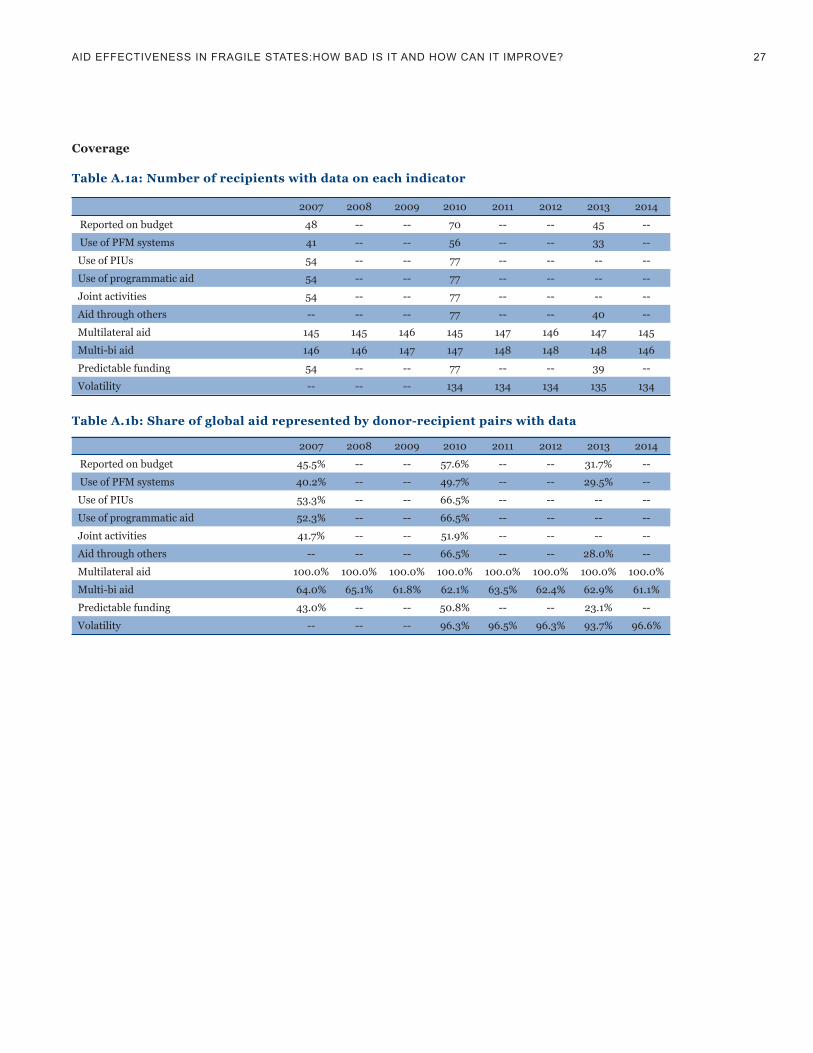
table A.1a: Number of recipients with data on each indicator
2007 2008 2009 2010 2011 2012 2013 2014
reported on budget 48 -- -- 70 -- -- 45 --
use of Pius 54 -- -- 77 -- -- -- --
Joint activities 54 -- -- 77 -- -- -- --
multilateral aid 145 145 146 145 147 146 147 145
Predictable funding 54 -- -- 77 -- -- 39 --
use of PFm systems 41 -- -- 56 -- -- 33 --
use of programmatic aid 54 -- -- 77 -- -- -- --
aid through others -- -- -- 77 -- -- 40 --
multi-bi aid 146 146 147 147 148 148 148 146
Volatility -- -- -- 134 134 134 135 134
table A.1b: Share of global aid represented by donor-recipient pairs with data
2007 2008 2009 2010 2011 2012 2013 2014
reported on budget 45.5% -- -- 57.6% -- -- 31.7% --
use of Pius 53.3% -- -- 66.5% -- -- -- --
Joint activities 41.7% -- -- 51.9% -- -- -- --
multilateral aid 100.0% 100.0% 100.0% 100.0% 100.0% 100.0% 100.0% 100.0%
Predictable funding 43.0% -- -- 50.8% -- -- 23.1% --
use of PFm systems 40.2% -- -- 49.7% -- -- 29.5% --
use of programmatic aid 52.3% -- -- 66.5% -- -- -- --
aid through others -- -- -- 66.5% -- -- 28.0% --
multi-bi aid 64.0% 65.1% 61.8% 62.1% 63.5% 62.4% 62.9% 61.1%
Volatility -- -- -- 96.3% 96.5% 96.3% 93.7% 96.6%
Coverage
Aid effectiveness in frAgile stAtes:How bAd is it And How cAn it improve? 27
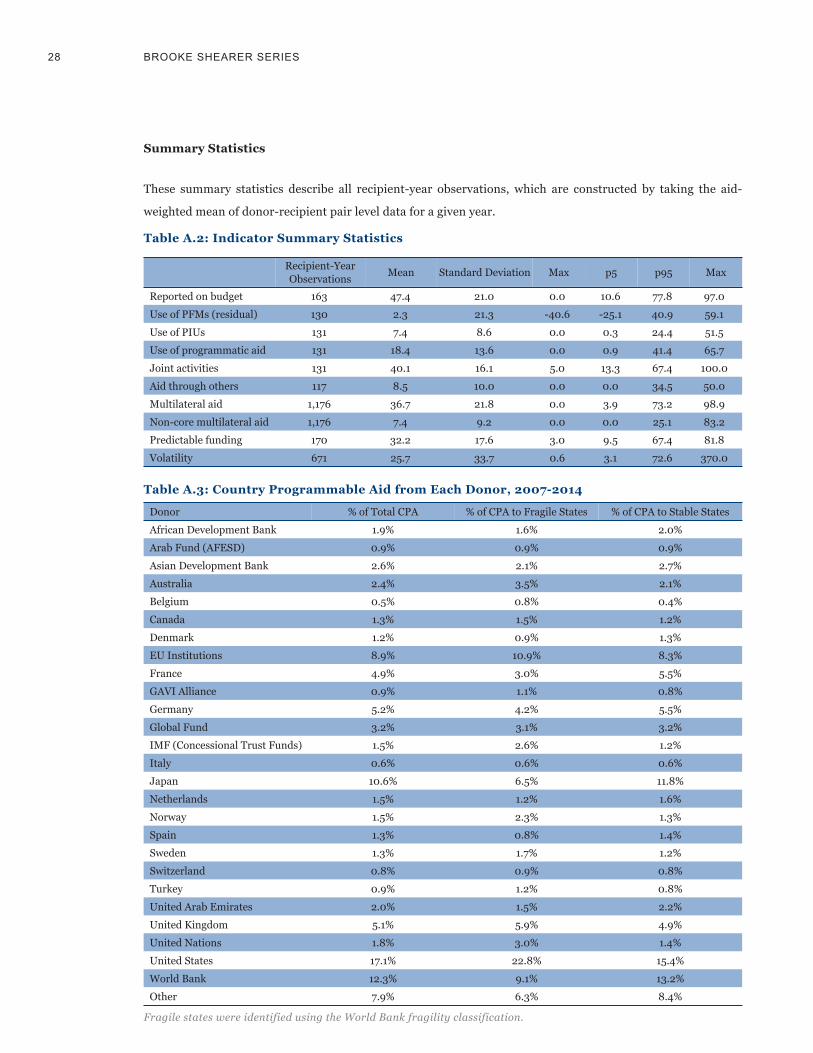
table A.2: indicator Summary Statistics
reported on budget 163 47.4 21.0 0.0 10.6 77.8 97.0
use of Pius 131 7.4 8.6 0.0 0.3 24.4 51.5
Joint activities 131 40.1 16.1 5.0 13.3 67.4 100.0
multilateral aid 1,176 36.7 21.8 0.0 3.9 73.2 98.9
Predictable funding 170 32.2 17.6 3.0 9.5 67.4 81.8
use of PFms (residual) 130 2.3 21.3 -40.6 -25.1 40.9 59.1
use of programmatic aid 131 18.4 13.6 0.0 0.9 41.4 65.7
aid through others 117 8.5 10.0 0.0 0.0 34.5 50.0
non-core multilateral aid 1,176 7.4 9.2 0.0 0.0 25.1 83.2
Volatility 671 25.7 33.7 0.6 3.1 72.6 370.0
Summary Statistics
these summary statistics describe all recipient-year observations, which are constructed by taking the aid-
weighted mean of donor-recipient pair level data for a given year.
meanrecipient-year observations standard deviation maxp95p5max
table A.3: Country programmable Aid from each donor, 2007-2014
african development bank 1.9% 1.6% 2.0%
asian development bank 2.6% 2.1% 2.7%
belgium 0.5% 0.8% 0.4%
denmark 1.2% 0.9% 1.3%
France 4.9% 3.0% 5.5%
germany 5.2% 4.2% 5.5%
imF (concessional trust Funds) 1.5% 2.6% 1.2%
Japan 10.6% 6.5% 11.8%
norway 1.5% 2.3% 1.3%
sweden 1.3% 1.7% 1.2%
turkey 0.9% 1.2% 0.8%
united kingdom 5.1% 5.9% 4.9%
united states 17.1% 22.8% 15.4%
other 7.9% 6.3% 8.4%
arab Fund (aFesd) 0.9% 0.9% 0.9%
australia 2.4% 3.5% 2.1%
canada 1.3% 1.5% 1.2%
eu institutions 8.9% 10.9% 8.3%
gaVi alliance 0.9% 1.1% 0.8%
global Fund 3.2% 3.1% 3.2%
italy 0.6% 0.6% 0.6%
netherlands 1.5% 1.2% 1.6%
spain 1.3% 0.8% 1.4%
switzerland 0.8% 0.9% 0.8%
united arab emirates 2.0% 1.5% 2.2%
united nations 1.8% 3.0% 1.4%
World bank 12.3% 9.1% 13.2%
donor % of cPa to Fragile states% of total cPa % of cPa to stable states
28 brooke sHeArer series
Fragile states were identified using the World Bank fragility classification.

AppeNdix B: regreSSioN uSiNg worLd BANk frAgiLity CLASSifiCAtioN
Fragile dummy -12.0*** -7.7* 2.1 -10.1** -10.0** 6.2** -9.3*** 7.3*** 1.7 6.8*** (4.4) (4.5) (1.7) (4.2) (4.1) (2.9) (1.2) (0.6) (4.6) (1.7)
Population (millions) -0.0 0.1 -0.0 0.0 -0.0 0.0* -0.0*** -0.0*** 0.0 -0.0 (0.0) (0.1) (0.0) (0.0) (0.0) (0.0) (0.0) (0.0) (0.0) (0.0)
year = 2009 3.8* 2.1*** (2.0) (0.8)
year = 2011 1.3 2.0** 1.3 (2.0) (0.8) (1.7)
year = 2013 -5.2 -3.8 0.6 2.4 1.9** 4.2 2.9 (5.1) (6.2) (2.1) (1.9) (0.8) (5.3) (1.7)
constant 105.8*** -23.3 2.0 64.2** 36.1 10.7 103.2*** 22.2*** 14.8 106.1*** (32.1) (36.2) (12.7) (31.9) (31.4) (18.1) (4.3) (4.4) (33.6) (12.0)
log(gdP Per capita) -0.6 -0.1 1.8* -2.1 2.7 -1.5 -9.2*** -3.3*** 1.7 -6.8*** (2.9) (3.1) (1.0) (2.5) (2.5) (1.6) (0.5) (0.4) (2.9) (1.0)
year = 2008 0.6 0.7 (2.0) (0.8)
year = 2010 -1.8 -5.2 -5.0*** -3.6 -4.3 2.2 1.9** 6.9* (3.8) (4.8) (1.5) (3.8) (3.8) (2.0) (0.8) (4.1)
year = 2012 2.2 2.3*** -0.2 (2.0) (0.8) (1.7)
year = 2014 4.1** 1.9** 2.2 (2.0) (0.8) (1.8)
observations 161 130 131 131 131 115 1,068 1,068 170 661r-squared 0.6 0.7 0.5 0.4 0.5 0.5 0.2 0.6 0.4 0.5# of recipients 81 61 80 80 80 83 135 135 81 134
reported on budget
use of PFm
systems
use of Pius
use of program-matic aid
Joint activities
aid through others
multi- lateral
aid
multi-bi aid
Predict-able
fundingVolatility
table B.1: regression using world Bank fragility classification
Standard errors in parentheses. Donor control variables excluded from table. Higher scores indicate better performance on all indicators other than use of PIUs, predictable funding, and volatility.*** p<0.01, ** p<0.05, * p<0.1
Aid effectiveness in frAgile stAtes:How bAd is it And How cAn it improve? 29

AppeNdix C: regreSSioNS teStiNg for ChANgiNg effeCt of frAgiLity oVer time
Fragile dummy -17.2** -11.6 1.5 -8.8* -12.9** 1.6 -5.4* 7.7*** 9.5 10.7*** (7.1) (7.4) (2.0) (5.0) (4.9) (4.2) (3.3) (1.3) (7.9) (3.1)
Population (millions) -0.0 0.1 -0.0 0.0 -0.0 0.0* -0.0*** -0.0*** 0.0 -0.0 (0.0) (0.1) (0.0) (0.0) (0.0) (0.0) (0.0) (0.0) (0.0) (0.0)
year = 2009 4.2* 1.4 (2.2) (0.9)
year = 2011 1.7 1.8* 0.9 (2.3) (0.9) (1.9)
year = 2013 -1.2 -0.8 2.3 2.3 1.2 -2.9 2.6 (6.0) (6.9) (2.4) (2.2) (0.9) (6.4) (2.0)
year 2007 x Fragile 11.5 11.0 1.5 -2.9 6.8 -3.7 -2.5 -17.8* (9.4) (11.0) (2.6) (6.6) (6.4) (4.9) (1.9) (9.9)
year 2009 x Fragile -5.6 0.9 (4.6) (1.7)
year 2011 x Fragile -5.5 -1.3 -2.3 (4.5) (1.7) (4.0)
year 2013 x Fragile -3.4 0.2 -2.4 (4.5) (1.7) (4.0)
log(gdP Per capita) 0.2 -0.2 1.8* -2.1 2.7 -1.1 -9.2*** -3.3*** 1.0 -6.8*** (3.0) (3.1) (1.0) (2.6) (2.5) (1.6) (0.5) (0.4) (2.9) (1.0)
year = 2008 0.8 0.4 (2.3) (0.9)
year = 2010 1.0 -2.8 -4.5** -4.7 -1.8 2.0 1.6* 1.5 (4.6) (5.5) (1.8) (4.5) (4.4) (2.3) (0.9) (5.0)
year = 2012 2.6 1.5 1.6 (2.3) (1.0) (2.0)
year = 2014 3.3 1.3 1.5 (2.2) (0.9) (2.0)
year 2008 x Fragile -4.7 -0.9 (4.8) (1.9)
year 2010 x Fragile 4.3 3.4 6.5 -2.7 -1.2 -4.1 -3.8 (8.3) (8.4) (4.4) (4.5) (1.7) (8.6) (4.0)
year 2012 x Fragile -5.3 0.7 -11.2*** (4.6) (1.8) (4.1)
constant 95.7*** -26.7 1.1 65.9** 32.3 7.0 103.1*** 22.7*** 27.8 106.3*** (33.1) (36.5) (12.8) (32.3) (31.5) (18.2) (4.4) (4.4) (34.0) (12.0)observations 161 130 131 131 131 115 1,068 1,068 170 661r-squared 0.6 0.7 0.6 0.4 0.5 0.5 0.2 0.6 0.4 0.6# of recipients 81 61 80 80 80 83 135 135 81 134
reported on budget
use of PFm
systems
use of Pius
use of program-matic aid
Joint activities
aid through others
multi- lateral
aid
multi-bi aid
Predict-able
fundingVolatility
table C.1: regression interacting fragility with year dummies
Standard errors in parentheses. Donor control variables excluded from table. Higher scores indicate better performance on all indicators other than use of PIUs, predictable funding, and volatility.*** p<0.01, ** p<0.05, * p<0.1
30 brooke sHeArer series

Fragile dummy -6.2 -1.8 3.0 -11.7** -6.2 14.5** -10.6*** 6.5*** -6.4 3.3 (6.3) (7.5) (2.2) (5.6) (5.5) (6.3) (2.3) (1.0) (6.4) (4.7)
Population (millions) -0.0 0.0 -0.0 0.0 -0.0 0.0* -0.0*** -0.0*** 0.1 -0.0 (0.0) (0.1) (0.0) (0.0) (0.0) (0.0) (0.0) (0.0) (0.0) (0.0)
years since 2007 -1.9 -2.0 -0.5 1.0 -2.3 -2.2 0.4 0.3 3.3** 0.7 (1.5) (1.8) (0.9) (2.2) (2.1) (1.5) (0.5) (0.2) (1.6) (0.9)
log(gdP Per capita) 0.0 0.0 1.8* -2.1 2.7 -1.1 -9.2*** -3.3*** 0.6 -6.8*** (2.9) (3.1) (1.0) (2.6) (2.5) (1.6) (0.5) (0.4) (2.9) (1.0)
years since 2007 -0.3 0.1 -1.5** -1.6 -0.6 0.8 0.3 0.1 -0.6 0.4 (1.0) (1.1) (0.6) (1.5) (1.5) (0.8) (0.2) (0.1) (1.1) (0.5)
constant 98.8*** -32.9 1.1 65.9** 32.3 4.7 104.4*** 23.7*** 33.1 104.6*** (32.3) (35.7) (12.8) (32.3) (31.5) (18.5) (4.2) (4.4) (33.7) (12.1)observations 161 130 131 131 131 115 1,068 1,068 170 661r-squared 0.6 0.7 0.6 0.4 0.5 0.5 0.2 0.6 0.4 0.5# of recipients 81 61 80 80 80 83 135 135 81 134
reported on budget
use of PFm
systems
use of Pius
use of program-matic aid
Joint activities
aid through others
multi- lateral
aid
multi-bi aid
Predict-able
fundingVolatility
table C.2: regression with continuous year variable interacted with fragility
Standard errors in parentheses. Donor control variables excluded from table. Higher scores indicate better performance on all indicators other than use of PIUs, predictable funding, and volatility.*** p<0.01, ** p<0.05, * p<0.1
Aid effectiveness in frAgile stAtes:How bAd is it And How cAn it improve? 31

AppeNdix d: regreSSioN teStiNg roLe of Aid ALLoCAtioNS to SeCtorS iN expLAiNiNg Aid prACtiCeS
Fragile dummy 77.9 5.4 -1.4 38.2 -63.1 -39.7 13.6 -7.5 19.1 -46.6** (56.9) (69.9) (19.6) (43.2) (46.1) (30.3) (12.0) (5.0) (50.0) (20.7)
Population (millions) -0.0 -0.1 -0.0 0.0 -0.0 0.0 -0.0*** -0.0*** 0.0 -0.0 (0.0) (0.1) (0.0) (0.0) (0.0) (0.0) (0.0) (0.0) (0.0) (0.0)
health sector -0.6* -0.0 -0.0 -0.0 0.2 -0.6*** 0.1* -0.3*** 1.3*** -0.6*** (0.4) (0.6) (0.1) (0.3) (0.3) (0.2) (0.1) (0.0) (0.3) (0.1)
gov’t and civil society 0.1 -0.5 0.1 -0.7** -0.5* -0.7*** -0.1 -0.1** 0.6* -0.6***sector (0.4) (0.7) (0.1) (0.3) (0.3) (0.2) (0.1) (0.0) (0.4) (0.1)
Financial infrastructure -0.5 -0.7 -0.1 -0.0 -0.2 -0.2 0.5*** -0.1*** 1.0** -0.6***sector (0.5) (0.8) (0.2) (0.4) (0.4) (0.2) (0.1) (0.0) (0.4) (0.2)
other economic 0.2 -0.9 0.1 -0.5 -0.8* 0.0 -0.0 -0.0 0.4 -0.2Production sector (0.4) (0.8) (0.2) (0.4) (0.4) (0.2) (0.1) (0.0) (0.4) (0.2)
health sector x Fragile -0.4 0.3 0.3 -0.6 0.0 0.0 0.2 0.2*** -0.2 0.6** (0.7) (0.9) (0.2) (0.5) (0.5) (0.3) (0.2) (0.1) (0.6) (0.3)
gov’t and civil society -1.5** 0.3 -0.1 -0.1 1.1* 1.1*** -0.4*** 0.3*** -0.6 0.4sector x Fragile (0.7) (0.9) (0.2) (0.5) (0.6) (0.4) (0.2) (0.1) (0.6) (0.3)
Financial infrastructure -0.7 2.8* 0.1 -1.7* 2.3** 0.8 -0.6* 0.1 -2.0* 0.8sector x Fragile (1.2) (1.6) (0.4) (1.0) (1.0) (0.9) (0.3) (0.1) (1.1) (0.6)
other economic -1.6* -0.3 0.2 -0.3 1.3 -0.0 -0.0 -0.4*** -1.1 0.9**Production (0.9) (1.5) (0.6) (1.3) (1.3) (0.5) (0.3) (0.1) (1.5) (0.4)sector x Fragile
log(gdP Per capita) -1.3 1.7 2.2* -5.2* 2.4 1.0 -8.0*** -2.7*** -0.6 -7.4*** (3.4) (3.6) (1.2) (2.7) (2.9) (1.7) (0.7) (0.4) (3.0) (1.3)
education sector 0.0 1.0 0.3 -0.0 -0.2 -0.8** 0.2* -0.1 0.3 -0.6*** (0.5) (0.9) (0.2) (0.5) (0.5) (0.3) (0.1) (0.1) (0.5) (0.2)
Water and sanitation 0.7 0.1 -0.3 0.2 0.8 -0.0 -0.0 -0.2*** 0.4 -0.2sector (0.5) (0.7) (0.3) (0.6) (0.6) (0.3) (0.1) (0.1) (0.5) (0.2)
Physical infrastructure -0.0 0.6 -0.1 0.3 0.2 -0.6*** 0.1 -0.2*** -0.0 -0.5***sector (0.3) (0.5) (0.1) (0.3) (0.3) (0.2) (0.1) (0.0) (0.3) (0.1)
agriculture sector 0.8 0.1 0.1 -0.7 -0.8* -0.4 0.6*** -0.3*** 0.3 -0.5** (0.5) (0.7) (0.2) (0.4) (0.5) (0.3) (0.2) (0.1) (0.5) (0.2)
education sector x -0.1 -0.3 -0.3 -0.6 1.5 -0.1 -0.7** 0.1 0.8 2.2***Fragile (1.3) (1.6) (0.5) (1.2) (1.3) (0.8) (0.3) (0.1) (1.4) (0.4)
Water and sanitation -1.8 -0.0 0.0 0.7 -0.3 1.2 2.0*** -0.1 0.7 -1.0sector x Fragile (1.7) (1.8) (0.7) (1.5) (1.6) (1.0) (0.5) (0.2) (1.7) (0.7)
Physical infrastructure -1.9*** -1.8* 0.1 -1.2** -0.1 0.5 -0.0 0.1 0.5 0.6**sector x Fragile (0.7) (0.9) (0.2) (0.5) (0.5) (0.4) (0.2) (0.1) (0.6) (0.3)
agriculture sector x -0.2 0.4 -0.1 -0.0 0.8 0.8 -1.5*** 0.2 -0.3 0.7Fragile (1.1) (1.4) (0.5) (1.0) (1.1) (0.7) (0.3) (0.1) (1.1) (0.5)
constant 110.0*** -87.5* -2.3 60.3* 29.8 39.8* 82.8*** 34.8*** 5.4 154.7*** (40.5) (51.5) (15.9) (35.0) (37.4) (20.5) (8.6) (5.0) (37.8) (16.8)observations 161 130 131 131 131 115 937 937 170 531r-squared 0.7 0.8 0.6 0.6 0.6 0.7 0.4 0.7 0.6 0.6# of recipients 81 61 80 80 80 83 135 135 81 134
reported on budget
use of PFm
systems
use of Pius
use of program-matic aid
Joint activities
aid through others
multi- lateral
aid
multi-bi aid
Predict-able
fundingVolatility
table d.1: regression testing role of aid allocations to sectors in explaining aid practices
Standard errors in parentheses. Donor control variables and year dummies excluded from table. All sector variables measure the percent of total ODA delivered in each sector to each recipient in each year, based on CRS codes. Higher scores indicate better performance on all indicators other than use of PIUs, predictable funding, and volatility. *** p<0.01, ** p<0.05, * p<0.1
32 brooke sHeArer series
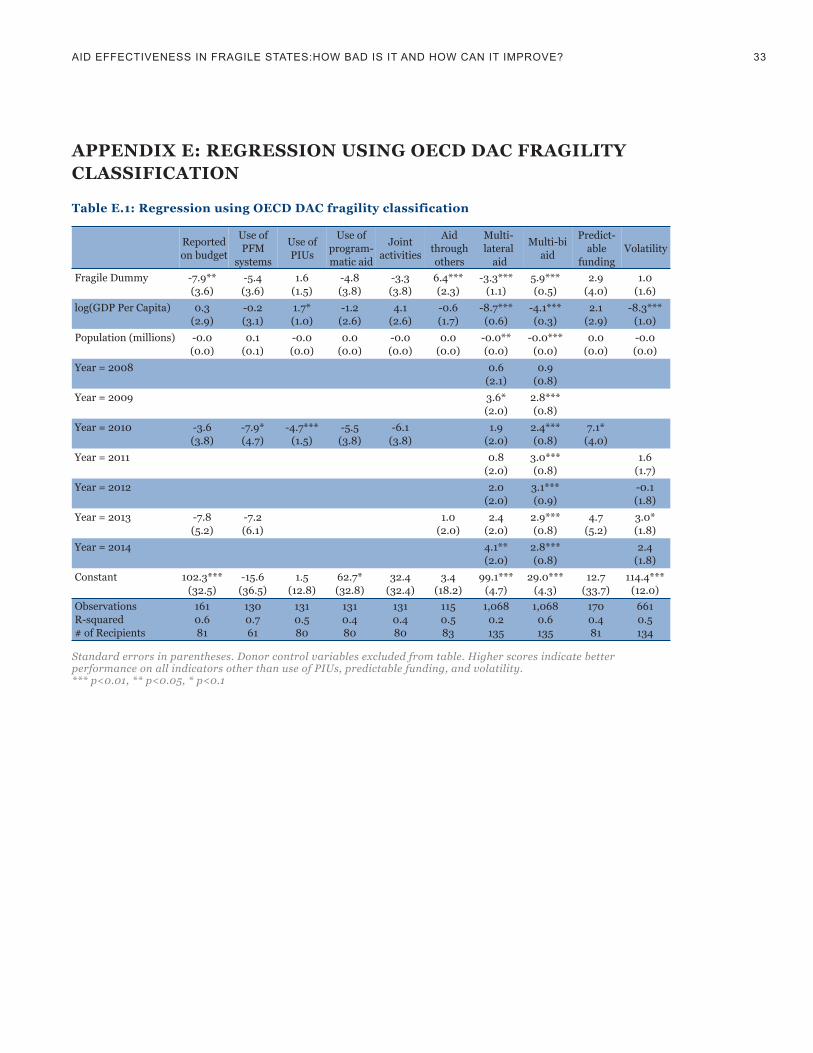
AppeNdix e: regreSSioN uSiNg oeCd dAC frAgiLity CLASSifiCAtioN
Fragile dummy -7.9** -5.4 1.6 -4.8 -3.3 6.4*** -3.3*** 5.9*** 2.9 1.0 (3.6) (3.6) (1.5) (3.8) (3.8) (2.3) (1.1) (0.5) (4.0) (1.6)
Population (millions) -0.0 0.1 -0.0 0.0 -0.0 0.0 -0.0** -0.0*** 0.0 -0.0 (0.0) (0.1) (0.0) (0.0) (0.0) (0.0) (0.0) (0.0) (0.0) (0.0)
year = 2009 3.6* 2.8*** (2.0) (0.8)
year = 2011 0.8 3.0*** 1.6 (2.0) (0.8) (1.7)
year = 2013 -7.8 -7.2 1.0 2.4 2.9*** 4.7 3.0* (5.2) (6.1) (2.0) (2.0) (0.8) (5.2) (1.8)
log(gdP Per capita) 0.3 -0.2 1.7* -1.2 4.1 -0.6 -8.7*** -4.1*** 2.1 -8.3*** (2.9) (3.1) (1.0) (2.6) (2.6) (1.7) (0.6) (0.3) (2.9) (1.0)
year = 2008 0.6 0.9 (2.1) (0.8)
year = 2010 -3.6 -7.9* -4.7*** -5.5 -6.1 1.9 2.4*** 7.1* (3.8) (4.7) (1.5) (3.8) (3.8) (2.0) (0.8) (4.0)
year = 2012 2.0 3.1*** -0.1 (2.0) (0.9) (1.8)
year = 2014 4.1** 2.8*** 2.4 (2.0) (0.8) (1.8)constant 102.3*** -15.6 1.5 62.7* 32.4 3.4 99.1*** 29.0*** 12.7 114.4*** (32.5) (36.5) (12.8) (32.8) (32.4) (18.2) (4.7) (4.3) (33.7) (12.0)observations 161 130 131 131 131 115 1,068 1,068 170 661r-squared 0.6 0.7 0.5 0.4 0.4 0.5 0.2 0.6 0.4 0.5# of recipients 81 61 80 80 80 83 135 135 81 134
reported on budget
use of PFm
systems
use of Pius
use of program-matic aid
Joint activities
aid through others
multi- lateral
aid
multi-bi aid
Predict-able
fundingVolatility
table e.1: regression using oeCd dAC fragility classification
Standard errors in parentheses. Donor control variables excluded from table. Higher scores indicate better performance on all indicators other than use of PIUs, predictable funding, and volatility.*** p<0.01, ** p<0.05, * p<0.1
Aid effectiveness in frAgile stAtes:How bAd is it And How cAn it improve? 33
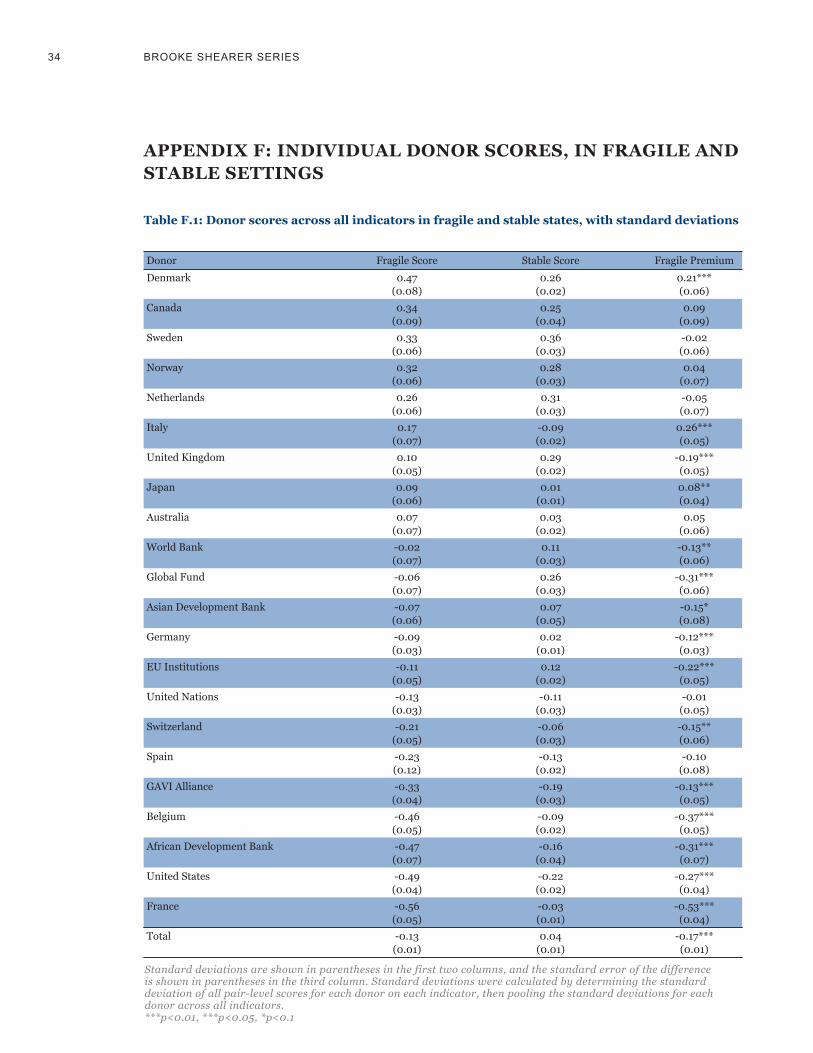
AppeNdix f: iNdiViduAL doNor SCoreS, iN frAgiLe ANd StABLe SettiNgS
denmark 0.47 0.26 0.21*** (0.08) (0.02) (0.06)
sweden 0.33 0.36 -0.02 (0.06) (0.03) (0.06)
netherlands 0.26 0.31 -0.05 (0.06) (0.03) (0.07)
united kingdom 0.10 0.29 -0.19*** (0.05) (0.02) (0.05)
australia 0.07 0.03 0.05 (0.07) (0.02) (0.06)
global Fund -0.06 0.26 -0.31*** (0.07) (0.03) (0.06)
germany -0.09 0.02 -0.12*** (0.03) (0.01) (0.03)
united nations -0.13 -0.11 -0.01 (0.03) (0.03) (0.05)
spain -0.23 -0.13 -0.10 (0.12) (0.02) (0.08)
belgium -0.46 -0.09 -0.37*** (0.05) (0.02) (0.05)
united states -0.49 -0.22 -0.27*** (0.04) (0.02) (0.04)
total -0.13 0.04 -0.17*** (0.01) (0.01) (0.01)
canada 0.34 0.25 0.09 (0.09) (0.04) (0.09)
norway 0.32 0.28 0.04 (0.06) (0.03) (0.07)
italy 0.17 -0.09 0.26*** (0.07) (0.02) (0.05)
Japan 0.09 0.01 0.08** (0.06) (0.01) (0.04)
World bank -0.02 0.11 -0.13** (0.07) (0.03) (0.06)
asian development bank -0.07 0.07 -0.15* (0.06) (0.05) (0.08)
eu institutions -0.11 0.12 -0.22*** (0.05) (0.02) (0.05)
switzerland -0.21 -0.06 -0.15** (0.05) (0.03) (0.06)
gaVi alliance -0.33 -0.19 -0.13*** (0.04) (0.03) (0.05)
african development bank -0.47 -0.16 -0.31*** (0.07) (0.04) (0.07)
France -0.56 -0.03 -0.53*** (0.05) (0.01) (0.04)
donor Fragile score stable score Fragile Premium
table f.1: donor scores across all indicators in fragile and stable states, with standard deviations
Standard deviations are shown in parentheses in the first two columns, and the standard error of the difference is shown in parentheses in the third column. Standard deviations were calculated by determining the standard deviation of all pair-level scores for each donor on each indicator, then pooling the standard deviations for each donor across all indicators. ***p<0.01, ***p<0.05, *p<0.1
34 brooke sHeArer series
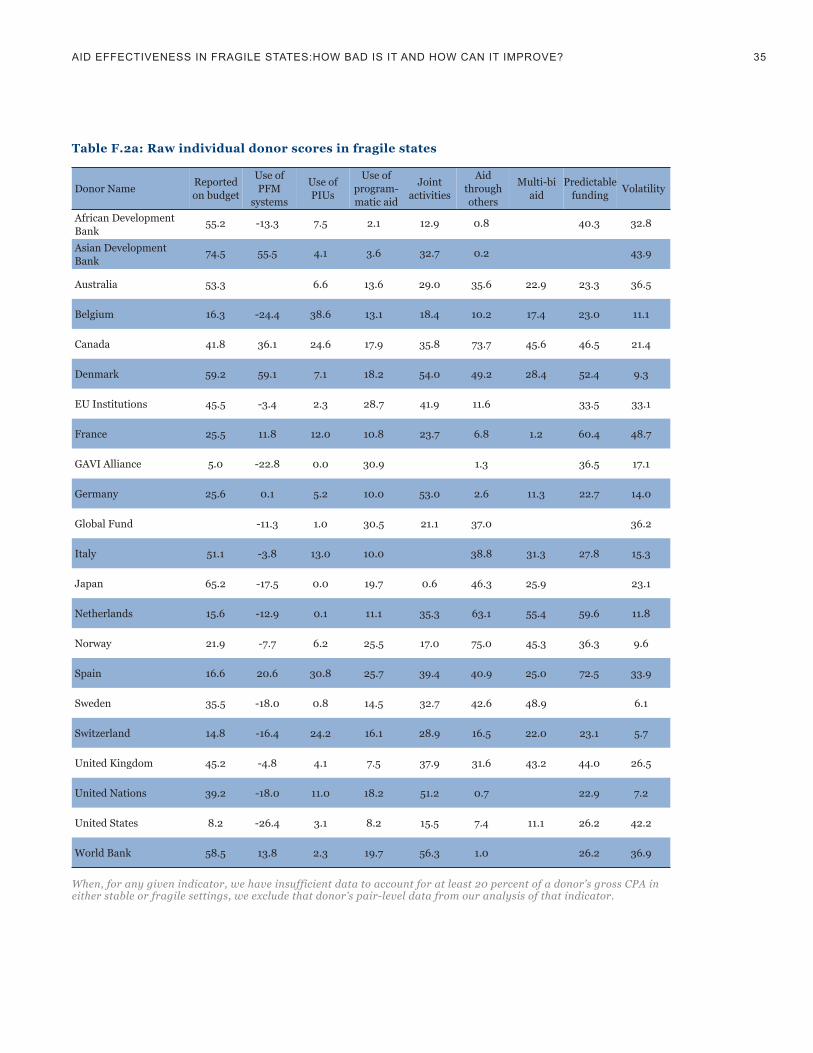
african development 55.2 -13.3 7.5 2.1 12.9 0.8 40.3 32.8bank
australia 53.3 6.6 13.6 29.0 35.6 22.9 23.3 36.5
canada 41.8 36.1 24.6 17.9 35.8 73.7 45.6 46.5 21.4
eu institutions 45.5 -3.4 2.3 28.7 41.9 11.6 33.5 33.1
gaVi alliance 5.0 -22.8 0.0 30.9 1.3 36.5 17.1
global Fund -11.3 1.0 30.5 21.1 37.0 36.2
Japan 65.2 -17.5 0.0 19.7 0.6 46.3 25.9 23.1
norway 21.9 -7.7 6.2 25.5 17.0 75.0 45.3 36.3 9.6
sweden 35.5 -18.0 0.8 14.5 32.7 42.6 48.9 6.1
united kingdom 45.2 -4.8 4.1 7.5 37.9 31.6 43.2 44.0 26.5
asian development 74.5 55.5 4.1 3.6 32.7 0.2 43.9bank
belgium 16.3 -24.4 38.6 13.1 18.4 10.2 17.4 23.0 11.1
denmark 59.2 59.1 7.1 18.2 54.0 49.2 28.4 52.4 9.3
France 25.5 11.8 12.0 10.8 23.7 6.8 1.2 60.4 48.7
germany 25.6 0.1 5.2 10.0 53.0 2.6 11.3 22.7 14.0
italy 51.1 -3.8 13.0 10.0 38.8 31.3 27.8 15.3
netherlands 15.6 -12.9 0.1 11.1 35.3 63.1 55.4 59.6 11.8
spain 16.6 20.6 30.8 25.7 39.4 40.9 25.0 72.5 33.9
switzerland 14.8 -16.4 24.2 16.1 28.9 16.5 22.0 23.1 5.7
united nations 39.2 -18.0 11.0 18.2 51.2 0.7 22.9 7.2
World bank 58.5 13.8 2.3 19.7 56.3 1.0 26.2 36.9
united states 8.2 -26.4 3.1 8.2 15.5 7.4 11.1 26.2 42.2
donor name reported on budget
use of PFm
systems
use of Pius
use of program-matic aid
Joint activities
aid through others
multi-bi aid
Predictable funding Volatility
table f.2a: raw individual donor scores in fragile states
When, for any given indicator, we have insufficient data to account for at least 20 percent of a donor’s gross CPA in either stable or fragile settings, we exclude that donor’s pair-level data from our analysis of that indicator.
Aid effectiveness in frAgile stAtes:How bAd is it And How cAn it improve? 35
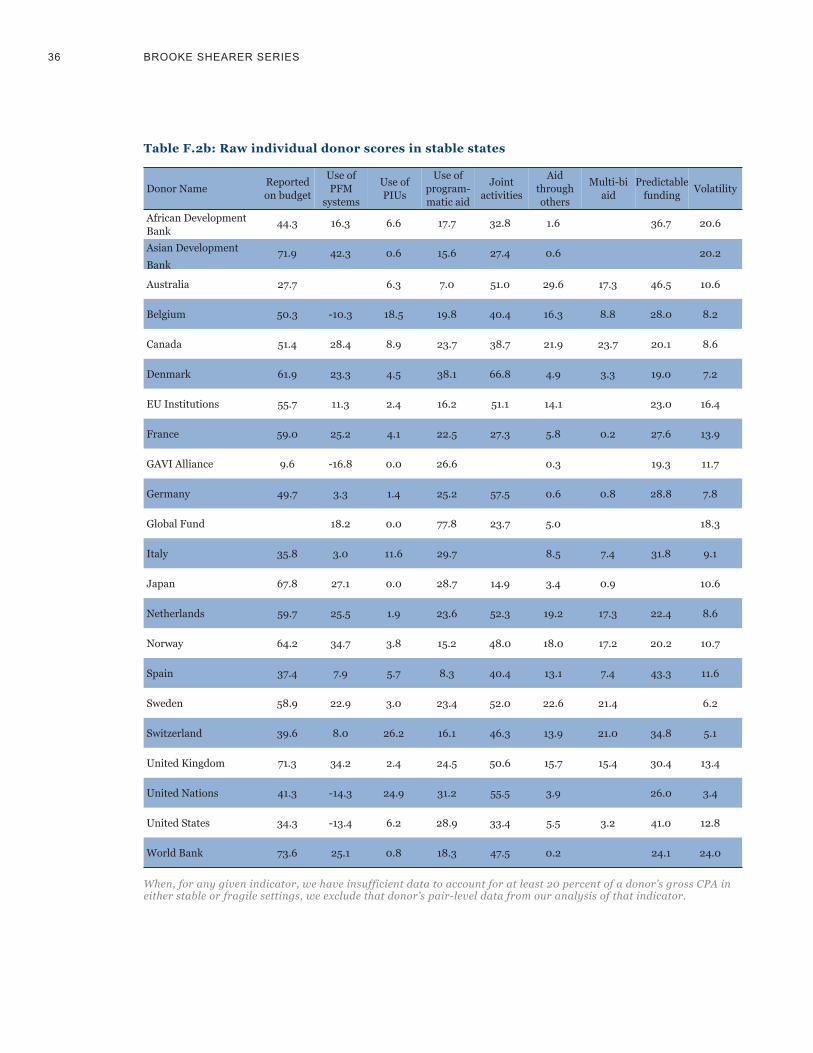
african development 44.3 16.3 6.6 17.7 32.8 1.6 36.7 20.6bank
australia 27.7 6.3 7.0 51.0 29.6 17.3 46.5 10.6
canada 51.4 28.4 8.9 23.7 38.7 21.9 23.7 20.1 8.6
eu institutions 55.7 11.3 2.4 16.2 51.1 14.1 23.0 16.4
gaVi alliance 9.6 -16.8 0.0 26.6 0.3 19.3 11.7
global Fund 18.2 0.0 77.8 23.7 5.0 18.3
Japan 67.8 27.1 0.0 28.7 14.9 3.4 0.9 10.6
norway 64.2 34.7 3.8 15.2 48.0 18.0 17.2 20.2 10.7
sweden 58.9 22.9 3.0 23.4 52.0 22.6 21.4 6.2
united kingdom 71.3 34.2 2.4 24.5 50.6 15.7 15.4 30.4 13.4
asian development 71.9 42.3 0.6 15.6 27.4 0.6 20.2bank
belgium 50.3 -10.3 18.5 19.8 40.4 16.3 8.8 28.0 8.2
denmark 61.9 23.3 4.5 38.1 66.8 4.9 3.3 19.0 7.2
France 59.0 25.2 4.1 22.5 27.3 5.8 0.2 27.6 13.9
germany 49.7 3.3 1.4 25.2 57.5 0.6 0.8 28.8 7.8
italy 35.8 3.0 11.6 29.7 8.5 7.4 31.8 9.1
netherlands 59.7 25.5 1.9 23.6 52.3 19.2 17.3 22.4 8.6
spain 37.4 7.9 5.7 8.3 40.4 13.1 7.4 43.3 11.6
switzerland 39.6 8.0 26.2 16.1 46.3 13.9 21.0 34.8 5.1
united nations 41.3 -14.3 24.9 31.2 55.5 3.9 26.0 3.4
World bank 73.6 25.1 0.8 18.3 47.5 0.2 24.1 24.0
united states 34.3 -13.4 6.2 28.9 33.4 5.5 3.2 41.0 12.8
donor name reported on budget
use of PFm
systems
use of Pius
use of program-matic aid
Joint activities
aid through others
multi-bi aid
Predictable funding Volatility
table f.2b: raw individual donor scores in stable states
When, for any given indicator, we have insufficient data to account for at least 20 percent of a donor’s gross CPA in either stable or fragile settings, we exclude that donor’s pair-level data from our analysis of that indicator.
36 brooke sHeArer series

african development 0.07 -0.69 -0.21 -0.67 -0.93 -0.37 -0.35 -0.63bank
australia 0.02 -0.16 -0.29 -0.36 1.19 0.76 0.21 -0.79
canada -0.30 0.69 -1.27 -0.15 -0.12 2.90 2.04 -0.56 -0.14
eu institutions -0.20 -0.42 0.12 0.21 0.10 0.11 -0.12 -0.64
gaVi alliance -1.33 -0.96 0.26 0.29 -0.35 -0.22 0.05
global Fund -0.64 0.19 0.27 -0.64 1.25 -0.78
Japan 0.35 -0.81 0.26 -0.09 -1.37 1.67 0.92 -0.21
norway -0.86 -0.54 -0.13 0.11 -0.79 2.96 2.02 -0.22 0.37
sweden -0.48 -0.83 0.21 -0.26 -0.23 1.50 2.23 0.52
united kingdom -0.21 -0.46 0.00 -0.49 -0.04 1.01 1.90 -0.47 -0.36
asian development 0.62 1.23 0.00 -0.62 -0.23 -0.40 -1.11bank
belgium -1.02 -1.00 -2.14 -0.30 -0.74 0.05 0.44 0.23 0.31
denmark 0.19 1.33 -0.19 -0.13 0.53 1.80 1.07 -0.75 0.38
France -0.76 0.01 -0.49 -0.38 -0.55 -0.10 -0.47 -1.02 -1.32
germany -0.76 -0.32 -0.07 -0.41 0.49 -0.29 0.10 0.24 0.18
italy -0.04 -0.43 -0.55 -0.41 1.33 1.23 0.07 0.13
netherlands -1.04 -0.68 0.25 -0.37 -0.13 2.42 2.59 -0.99 0.28
spain -1.01 0.25 -1.65 0.11 0.01 1.43 0.87 -1.42 -0.68
switzerland -1.06 -0.78 -1.25 -0.20 -0.36 0.33 0.71 0.22 0.54
united nations -0.38 -0.82 -0.43 -0.13 0.43 -0.38 0.23 0.47
World bank 0.16 0.06 0.11 -0.09 0.61 -0.36 0.12 -0.81
united states -1.24 -1.06 0.06 -0.46 -0.84 -0.08 0.09 0.12 -1.04
donor name reported on budget
use of PFm
systems
use of Pius
use of program-matic aid
Joint activities
aid through others
multi-bi aid
Predictable funding Volatility
table f.3a: Scaled individual donor scores in fragile states
When, for any given indicator, we have insufficient data to account for at least 20 percent of a donor’s gross CPA in either stable or fragile settings, we exclude that donor’s pair-level data from our analysis of that indicator. Normalized scores on three indicators (Use of PIUs, Predictability, and Volatility) were multiplied by -1 so that higher scores indicate better performance on all indicators.
Aid effectiveness in frAgile stAtes:How bAd is it And How cAn it improve? 37

african development -0.23 0.13 -0.15 -0.15 -0.22 -0.34 -0.23 -0.10bank
australia -0.70 -0.13 -0.50 0.42 0.92 0.44 -0.56 0.33
canada -0.03 0.47 -0.29 0.05 -0.01 0.57 0.80 0.32 0.42
eu institutions 0.09 -0.01 0.11 -0.20 0.43 0.23 0.23 0.08
gaVi alliance -1.21 -0.79 0.26 0.14 -0.39 0.35 0.28
global Fund 0.19 0.25 1.84 -0.55 -0.19 0.00
Japan 0.43 0.43 0.25 0.21 -0.86 -0.25 -0.49 0.33
norway 0.33 0.65 0.02 -0.24 0.32 0.40 0.44 0.32 0.32
sweden 0.18 0.32 0.07 0.04 0.46 0.61 0.67 0.52
united kingdom 0.53 0.63 0.11 0.07 0.41 0.30 0.33 -0.02 0.21
asian development 0.54 0.86 0.22 -0.22 -0.42 -0.38 -0.09bank
belgium -0.06 -0.61 -0.89 -0.08 0.05 0.32 -0.04 0.06 0.43
denmark 0.26 0.33 -0.02 0.52 0.99 -0.19 -0.35 0.36 0.48
France 0.18 0.38 0.00 0.01 -0.42 -0.15 -0.53 0.07 0.19
germany -0.08 -0.23 0.17 0.10 0.66 -0.38 -0.50 0.03 0.45
italy -0.47 -0.24 -0.46 0.25 -0.03 -0.12 -0.07 0.39
netherlands 0.20 0.39 0.14 0.04 0.47 0.45 0.44 0.25 0.41
spain -0.43 -0.10 -0.10 -0.46 0.05 0.18 -0.12 -0.45 0.29
switzerland -0.36 -0.10 -1.37 -0.20 0.26 0.22 0.64 -0.17 0.57
united nations -0.32 -0.72 -1.29 0.29 0.59 -0.23 0.12 0.64
World bank 0.59 0.38 0.20 -0.13 0.30 -0.40 0.19 -0.25
united states -0.51 -0.70 -0.13 0.22 -0.20 -0.16 -0.36 -0.37 0.24
donor name reported on budget
use of PFm
systems
use of Pius
use of program-matic aid
Joint activities
aid through others
multi-bi aid
Predictable funding Volatility
table f.3b: Scaled individual donor scores in stable states
When, for any given indicator, we have insufficient data to account for at least 20 percent of a donor’s gross CPA in either stable or fragile settings, we exclude that donor’s pair-level data from our analysis of that indicator. Normalized scores on three indicators (Use of PIUs, Predictability, and Volatility) were multiplied by -1 so that higher scores indicate better performance on all indicators.
38 brooke sHeArer series

AppeNdix g: BiLAterAL ANd muLtiLAterAL doNor SCoreS ACroSS ALL iNdiCAtorS
indicator differencebilateral score
multilateral scoredifferencebilateral
scoremultilateral score
use of PFm systems 0.23 0.08 0.15** -0.19 -0.69 0.50*** (0.04) (0.04) (0.06) (0.07) (0.06) (0.09)
use of programmatic aid 0.05 0.10 -0.05 -0.02 -0.36 0.34*** (0.05) (0.04) (0.07) (0.07) (0.05) (0.08)
aid through others -0.24 -0.01 -0.23*** -0.09 0.61 -0.69*** (0.03) (0.04) (0.06) (0.07) (0.12) (0.14)
Volatility -0.05 0.30 -0.36*** -0.56 -0.57 0.01 (0.02) (0.01) (0.02) (0.05) (0.04) (0.06)
reported on budget 0.30 0.01 0.28*** -0.03 -0.73 0.71*** (0.05) (0.03) (0.06) (0.07) (0.06) (0.10)
use of Pius 0.06 -0.00 0.06 0.03 -0.13 0.15 (0.04) (0.03) (0.05) (0.04) (0.11) (0.13)
Joint activities 0.19 0.02 0.16** 0.21 -0.56 0.76*** (0.05) (0.05) (0.07) (0.09) (0.09) (0.13)
Predictable funding 0.15 -0.10 0.26*** 0.01 -0.11 0.12 (0.05) (0.05) (0.07) (0.07) (0.08) (0.11)
all indicators 0.08 0.05 0.03** -0.08 -0.32 0.24*** (0.01) (0.01) (0.01) (0.02) (0.03) (0.04)
Stable States fragile States
table g.1: Bilateral and multilateral donor scores on each indicator
Aid effectiveness in frAgile stAtes:How bAd is it And How cAn it improve? 39
Standard deviations are shown in parentheses beneath the multilateral scores and bilateral scores, and the standard error of the difference is shown in parentheses beneath the difference values. Standard deviations on each indicator were calculated by determining the standard deviation of all pair-level scores for all bilateral or multilateral donors, and these standard deviations were pooled to calculate the standard deviation across all indicators.***p<0.01, ***p<0.05, *p<0.1
refereNCeS
actionaid (2011). “real aid: ending aid dependen-
cy.” https://www.actionaid.org.uk/sites/default/
files/doc_lib/real_aid_3.pdf
andrews, m. and L. Pritchett (2013). “escaping ca-
pability traps through Problem driven iterative
adaptation (Pdia).” World Development 51: 11.
andrimihaja, n. a., et al. (2011). “avoiding the Fragil-
ity trap in africa.” World Bank Working Paper
5884.
arellano, c., et al. (2005). “the dynamic implications
of Foreign aid and its Variability” IMF Working
Paper 05/119, international monetary Fund.
Armed Conflict Location & Event Data (ACLED) Proj-
ect (2014). “real-time analysis of african Politi-
cal Violence.” Conflict Trends 28.
Birdsall, N. and H. Kharas (2010). “Quality of Official
development assistance assessment.” brookings
institution and center for global development.
burnside, c. and d. dollar (2000). “aid, Policies, and
growth.” The American Economic Review 90(4):
847-868.
celasun, o. and J. Walliser (2005). “Predictability of
budget aid: experiences in eight african coun-
tries.” World bank Practicioner’s Forum on bud-
get support.
chandy, L. (2011). “ten years of Fragile states: What
have We Learned?” Brookings Institution Global
Views Policy Paper, the brookings institution.
chandy, L. and J. F. Linn (2011). “taking develop-
ment activities to scale in Fragile and Low ca-
pacity environments.” Global Economy and
Development Working Paper No. 45, the brook-
ings institution.
collier, P. and d. dollar (2002). “aid allocation and
Poverty reduction.” European Economic Review
46(8): 1475–1500.
desai, r. m. and h. kharas (2012). “the determi-
nants of aid Volatility.” Global Economy and
Development Working Paper No. 42, the brook-
ings institution.
development initiatives (2016). “unbundling other
Official Flows.” http://devinit.org/#!/post/
unbundling-other-official-flows
easterly, W. (2007). “are aid agencies improving?”,
centre for economic Policy research.
easterly, W. and t. Pfutze (2008). “Where does the
money go? best and Worst Practices in Foreign
aid.” Journal of Economic Perspectives 22(2):
29-57.
greenhill, r. (2016). “development effectiveness
for the sdg era: Five reasons Why We need a
new agenda.” overseas development institute.
h t t p s : / / w w w . o d i . o r g / c o m m e n t / 1 0 4 5 1 -
development-effectiveness-sdg-era-new-agenda-
aid
hellman, J. (2013). “surprising results from Fragile
states.” World Bank Future Development Blog.
http://blogs.worldbank.org/futuredevelopment/
surprising-results-fragile-states
40 brooke sHeArer series

honig, d. (2016). “Penny Wise, Point-Foolish: the
costs of Politically constrained organizational
autonomy in Foreign aid implementation.”
howes, s. (2011). “an overview of aid effectiveness,
determinants and strategies.” Development Pol-
icy Centre Discussion Paper No. 1, development
Policy centre.
hudson, J. and P. mosley (2008). “the macroeco-
nomic impact of aid Volatility.” Economic Let-
ters 99(3): 486–489.
ishihara, y. (2012). “identifying aid effectiveness
Challenges in Fragile and Conflict-Affected
states.” Policy Research Working Paper No.
6037, the World bank.
Jones, s. and F. tarp (2016). “does foreign aid harm
political institutions?” Journal of Development
Economics 118: 266-281.
klein, m. and t. harford (2005). The Market for Aid,
international Finance corporation.
knack, s., et al. (2011). “aid Quality and donor rank-
ings.” World Development 39(11): 1907-1917.
norris, J. (2016). “a better approach to Fragile states:
the Long View.” center for american Progress.
nunn, n. and n. Qian (2014). “us Food aid and civil
Conflict.” American Economic Review 104(6):
1630-1666.
organization for economic cooperation and develop-
ment (oecd) (2010). Resource Flows to Fragile
and Conflict-Affected States, oecd Publishing.
organization for economic cooperation and develop-
ment (oecd) (2012a). “aid effectiveness 2011:
Progress in implementing the Paris declara-
tion.”
organization for economic cooperation and devel-
opment (oecd) (2012b). “ensuring Fragile state
are not Left behind: 2011 report on Financial
resource Flows.”
Putzel, J. and J. di John (2012). “meeting the chal-
lenges of crisis states.” Crisis States Research
Centre Report, crisis states research centre at
the London school of economics.
Ralston, L. (2014). “Success in Difficult Environ-
ments: a Portfolio analysis of Fragile and con-
flict-affected States.” Policy Research Working
Paper No. 7098, the World bank.
ravallion, m. (2013). “cutting development assis-
tance after a coup may be bad response.” Cen-
ter for Global Development. http://www.cgdev.
org/blog/cutting-development-assistance-after-
coup-may-be-bad-response
roesch, a. (2014). “understanding Poverty and Fragil-
ity: moving from rhetoric to analysis,” usaid.
roodman, d. (2007). “the anarchy of numbers: aid,
development, and cross-country empirics.”
World Bank Economic Review 21(2): 255-277.
strandow, d., et al. (2016). “Foreign aid and the
Intensity of Violent Armed Conflict.” AidData
Working Paper.
Aid effectiveness in frAgile stAtes:How bAd is it And How cAn it improve? 41
united states agency for international development
(2016). “remarks by administrator gayle smith:
u.s. Leadership in international development.”
https://www.usaid.gov/news-information/
speeches/mar-9-2016-administrator-gayle-
smith-us-leadership-international-development
Wild, L. et. al (2015). “adapting development: im-
proving services to the Poor.” overseas develop-
ment institute.
World Bank (2011). “Conflict, Security, and Develop-
ment.” World Development Report.
World bank (2016). “information note: the World
bank group’s harmonized List of Fragile
si tuat ions.” http://pubdocs.worldbank.
o r g / en/586581437416356109/Fcs-List-Fy16-
information-note.pdf
42 brooke sHeArer series
the views expressed in this working paper do not nec-
essarily reflect the official position of Brookings, its
board or the advisory council members.
Cover photos courtesy of the world Bank
(in order, top to bottom)
curt carnemark
Jamie martin
kubat sydykov
igor castro da silva braga
Jamie martin
John isaac
kubat sydykov
tran thi hoa
Aid effectiveness in frAgile stAtes:How bAd is it And How cAn it improve? 43

1775 massachusetts ave., nWWashington, d.c. 20036202.797.6000www.brookings.edu/global