Embed Size (px)
Citation preview
Aid and the control of Tuberculosis in PNG:
Is Australia's assistance good policy?
Hoa Thi Minh Nguyen and Tom Kompas Australian Centre for Biosecurity and
Environmental Economics Crawford School of Public Policy, Australian National University

2
Acknowledgements
• This policy paper was developed using the economic model in Nguyen, Hickson, Kompas, Mercer and Lokuge, 2014 (“Strengthening tuberculosis control overseas: Who benefits?”) and epidemiological model in Hickson, Mercer and Lokuge, 2012 (“A metapopulation model of tuberculosis transmission with a case study from high to low burden areas”) .
• Special thanks to Lokuge, Hickson and Mercer for their collaboration.

3
Why Tuberculosis (TB)? Ø In existence for at least 17,000 years Ø In the 19th and early 20th centuries: caused nearly 25% of all
deaths in Europe
Ø By 1950s: mortality due to TB fell by nearly 90% thanks to (1) improvement in public health; (2) arrival of antibiotics
Ø Still a major health threat, became a global public health emergency in 1993 for: Ø Second leading cause of death from an infectious disease after HIV Ø The rise of MDR TB and XDR TB in 1980s
Ø The overlap of TB and HIV (co-infection)
Ø Every year: 9 millions new TB cases, 1.5 million die from TB (WHO, 2012)

A t l a n t i cO c e a n
I n d i a nO c e a n
Estimated TBIncidence Rate (per 100,000 Population)
100-299
50-99
25-49
1-240 or No Estimate
!300
i cO c e a n
P a c i f
Prevalence of TB is skewed towards poor countries Global funding gap:1.6 bill USD per year for implementing existing TB interventions
Source: WHO, 2012
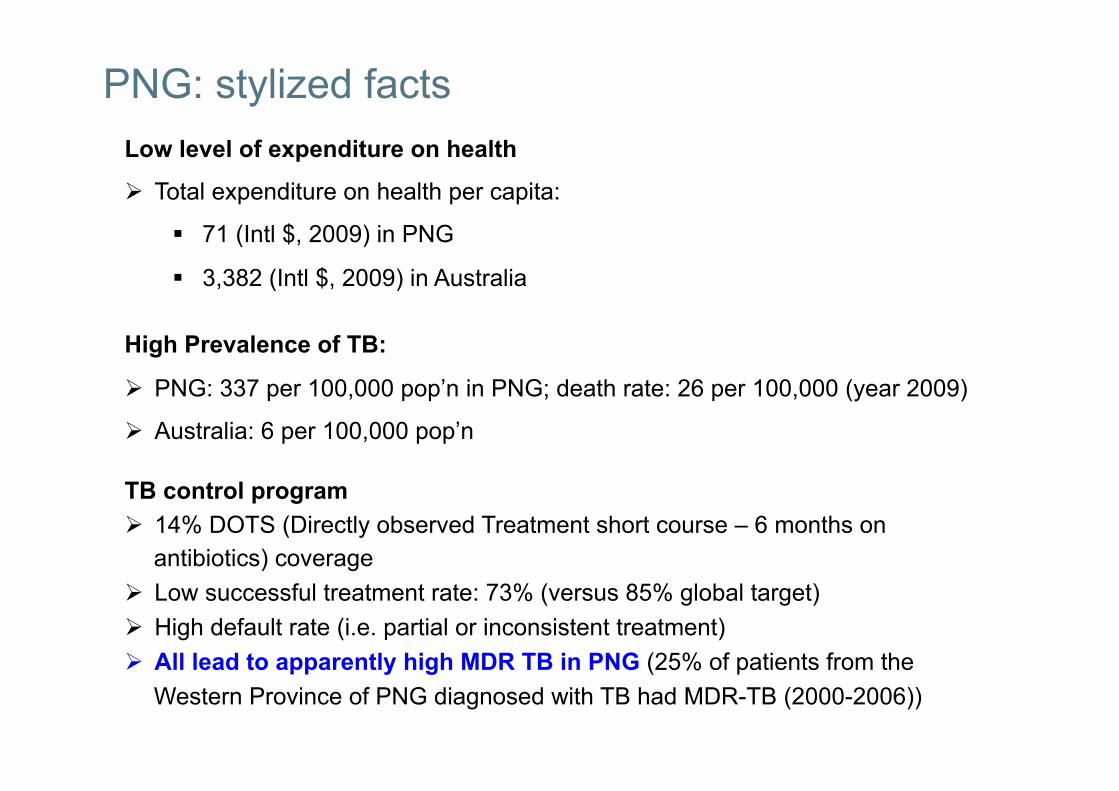
PNG: stylized facts Low level of expenditure on health
Ø Total expenditure on health per capita:
§ 71 (Intl $, 2009) in PNG
§ 3,382 (Intl $, 2009) in Australia
High Prevalence of TB:
Ø PNG: 337 per 100,000 pop’n in PNG; death rate: 26 per 100,000 (year 2009)
Ø Australia: 6 per 100,000 pop’n
TB control program Ø 14% DOTS (Directly observed Treatment short course – 6 months on
antibiotics) coverage Ø Low successful treatment rate: 73% (versus 85% global target) Ø High default rate (i.e. partial or inconsistent treatment) Ø All lead to apparently high MDR TB in PNG (25% of patients from the
Western Province of PNG diagnosed with TB had MDR-TB (2000-2006))

South Fly, Western Province
We focus only on South Fly District and Torres Strait Islands (TSI) in this paper: Ø Pop’n size: about 50,000 people (about 7 mill people in PNG; 9,000 people in TSI) Ø <5km to TS islands Ø Free movement allowed for “traditional activities” Ø There were 59,003 movements in 2008-09 (about 162/day)
§ 98% of movements are by PNG citizens, possibly due to the “health gradient”
Less than 100 cases per 100,000 per year 100-199 cases per 100,000 per year 200-299 cases per 100,000 per year More than 300 cases per 100,000 per year

7
Australia’s safeguard measures
Ø Some TB clinics but closed in early 2010s
Ø A 10+ year strategy: an initial $11 million over 4 years
starting from 2012
Ø Australia has been contributing about three quarters to the
total ODA that PNG receives every year– one fifth of that is
used in health sector

8
Research questions:
1. What would be the returns for Australia in investing in TB
control in PNG?
2. How long and how extensive a TB program should be in
order to be the most cost effective for Australia?
3. What is missing and would need to be done in the future
within and beyond our analytical framework to inform
policy?

9
Framework for economic evaluation in health sector 1. Cost Benefit Analysis (CBA):
Ø NPV (Net Present Values) = Benefit ($) – Cost ($) (all $ discounted) Ø Select projects w/ positive NPV or NPV ranks high Ø Ethical issues in quantifying human health and life in $
2. Cost Utility Analysis (CUA): a. Cost: in $ (as in CBA) b. Benefit: 2 main metrics
Ø Quality-adjusted life years (QALY) for one year = 1 * Weight (=0 if death; =1 if full health)
Ø Disability-adjusted life years (DALY) ) for one year = 1 * Weight (=0 full health;=1 death)
Ø Key difference: Ø QALY Weight from preferences (of patients or general public). Ø DALY Weight based on person trade-off scores from a panel of health care
workers who met in Geneva in 1995
3. Still need benefit in $ for CBA for cross-sector comparison: Ø Willingness-to-pay to convert QALY (not DALY) into $: Australian WTP
per QALY is 43,000 USD (‘05 price)

Pop(1,1)
Pop(1,2)
Region 1
Border
Pop(2,1)
Pop(2,2)
Region 2
!21r12!12 r21
Epidemiological Model: Not taking into account HIV co-infection and MDR
S
L
N I
T1
T2
!
(1! ")
#"
$(1! $)
%&
'(1! c1)
(
)
* ' " c1
* ' " c2
bµN
µN
µT
µT
µT
µT
S: Susceptible L: Latently Infected N: Non-infectious I: Infectious T1: Treated the first time T2: Re-treated Region 1: South Fly Region 2: TSI
11
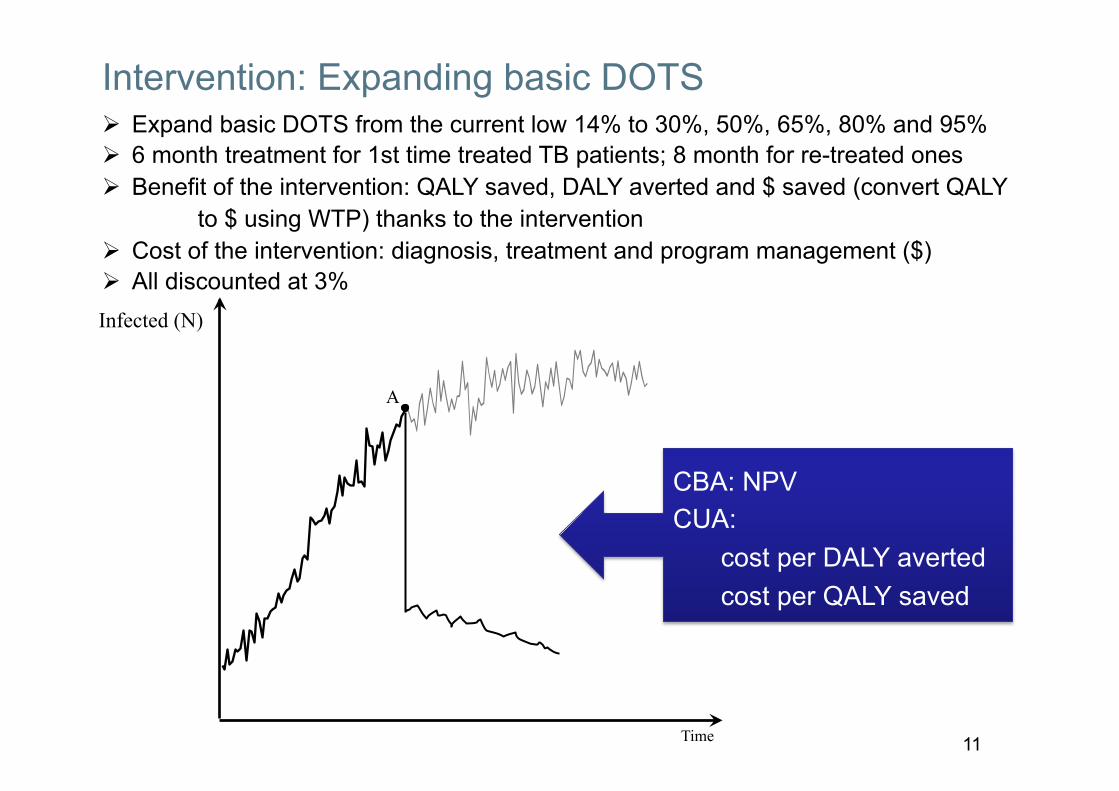
Intervention: Expanding basic DOTS
Time
Infected (N)
A
Ø Expand basic DOTS from the current low 14% to 30%, 50%, 65%, 80% and 95% Ø 6 month treatment for 1st time treated TB patients; 8 month for re-treated ones Ø Benefit of the intervention: QALY saved, DALY averted and $ saved (convert QALY
to $ using WTP) thanks to the intervention Ø Cost of the intervention: diagnosis, treatment and program management ($) Ø All discounted at 3%
CBA: NPV CUA:
cost per DALY averted cost per QALY saved

12
NPVs (USD 2005)
0 5 10 15 20 25 30 35 40 45 50−50
0
50
100
150
200
250
300
350
400
450
Length of TB control program (years)
Net P
rese
nt V
alue,
Milli
on $
I 200
5
0 1 2 3 4 5 6 7 8 9 10−5
0
5
10
15
20
Length of TB control program (years)
30% 50% 65% 80% 95%
Ø NPV = Benefit to TSI - Cost in both TSI & South Fly ($ discounted) Ø The longer and the more extensive the basic DOTS program to control TB, the
higher the returns that are generated for Australia
13
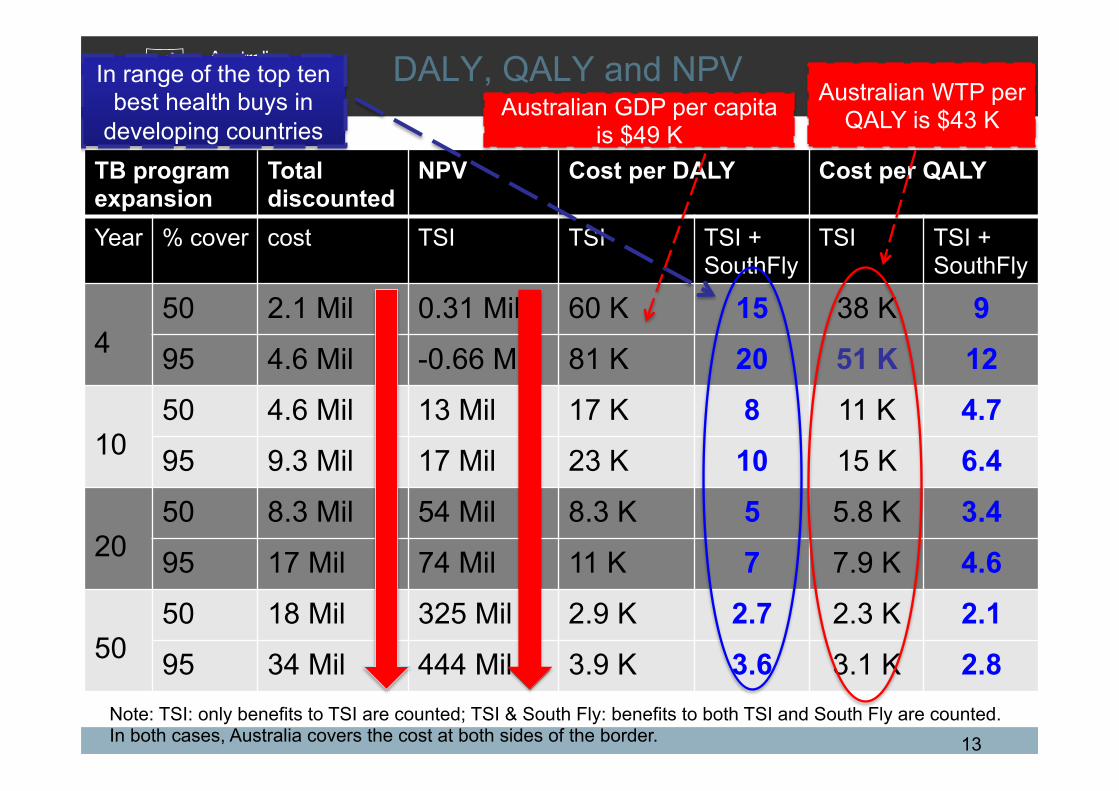
DALY, QALY and NPV
TB program expansion
Total discounted
NPV Cost per DALY Cost per QALY
Year % cover cost TSI TSI TSI + SouthFly
TSI TSI + SouthFly
4
50 2.1 Mil 0.31 Mil 60 K 15 38 K 9 95 4.6 Mil -0.66 Mil 81 K 20 51 K 12
10
50 4.6 Mil 13 Mil 17 K 8 11 K 4.7 95 9.3 Mil 17 Mil 23 K 10 15 K 6.4
20
50 8.3 Mil 54 Mil 8.3 K 5 5.8 K 3.4 95 17 Mil 74 Mil 11 K 7 7.9 K 4.6
50
50 18 Mil 325 Mil 2.9 K 2.7 2.3 K 2.1 95 34 Mil 444 Mil 3.9 K 3.6 3.1 K 2.8
In range of the top ten best health buys in
developing countries Australian WTP per
QALY is $43 K
Note: TSI: only benefits to TSI are counted; TSI & South Fly: benefits to both TSI and South Fly are counted. In both cases, Australia covers the cost at both sides of the border.
Australian GDP per capita is $49 K

14
Conclusion: 1. TB control in PNG: a high return investment for Australia
Ø $17 mill over 20 years ($0.8 mil / year) earns a NPV of $74 mill ($3.7 mil / year) Ø The longer and the more extensive the basic DOTS program to control TB, the higher
the returns that are generated for Australia
2. Good investment in terms of ODA: Ø a DOTS expansion in PNG generates a combined benefit for both countries that
compares well in the established range of the ‘ten best health buys’ in developing countries
Ø Our models are of relevance to other regions where such disparities and connections exits and can be utilised in building the case for appropriate funding at global level
3. Initial funding $11 Mil ($9.3 mil in ‘05 price) is not enough for this intervention for 4 years in Western Province: Need $5.4Mil x 3 = $12Mil
4. Further investigation is needed to inform policy in the future: Ø Local estimates for parameters
Ø Collaboration opportunities in controlling other chronic diseases such as HIV & malaria to enhance allocative efficiency
Ø Patients’ attitude, culture and local practices

Thanks for listening! Please contact me for the papers if you are interested
Hoa Nguyen [email protected]
https://crawford.anu.edu.au/people/academic/hoa-nguyen
www.acbee.anu.edu.au