Embed Size (px)
Citation preview
Alternate Technology for Sour Water Stripping
CHE 482-004
Jonathan Sherwin
Ross Starks
John Haywood
4/23/15
We pledge that we have neither given nor received aid on this work, except for questions
answered by the instructor.
____________________________________________________________________________
____________________________________________________________________________
____________________________________________________________________________
Alternate Technology for Sour Water Stripping
Jonathan Sherwin
Ross Starks
John Haywood
Department of Chemical and Biological Engineering
The University of Alabama
Box 870203
Tuscaloosa, AL 35487-0203
Abstract
Sour water must be treated in order to lower the ammonia content so that it may be
released into the environment or used as a utility. The sour water to be treated comes in at a
flow rate of 20-50 GPM and contains 300-3000 ppm NH3, 5 ppm H2S, and trace amounts of
propane. There are two methods available to treat the sour water, natural gas stripping and air
stripping. The Estimated Annual Operating Cost (EAOC) for air stripping is $1,199,876.69 and
the EAOC for natural gas stripping is $1,130,010.41. Therefore the optimum method is natural
gas stripping by the simulations and estimations of this project.
Keywords: Sour water, stripping, natural gas, air stripping, stripping column
Introduction
Sour water is a wastewater product containing ammonia and hydrogen sulfide and is a
common byproduct from refineries. Sour water must be stripped of its ammonia and H2S
concentration before it can be sent to a wastewater treatment facility. From this facility the water
will be either released to the environment or used in other processes as a utility feed. The aim of
this study is to simulate sour water stripping via air and natural gas and to determine estimated
costs and efficiencies of both.
The clean water produced will be sent to a wastewater treatment facility where it can be
either released back into the environment or treated to be used as boiler feed water. In order to
be released back into the environment the clean water must be released at less than 104°F. If
the water will be used for boiler feed it must be treated via aeration, filtration, or chlorination in
order to remove the hydrogen sulfide. The water will then be sent to a holding area to be used
for boiler feed. It was assumed that the water treatment cost of both was assumed to be equal
as the actual costs are beyond the scope of this project. Using the cleaned water as boiler feed
will negate some utility costs, therefore this option will be pursued.
Since the column in either scenario must be able to handle the maximum scenario for
sour water of 50 gpm and 3000 ppm ammonia, it was designed to meet this specification. The
sour water feed conditions for natural gas stripping are shown in Table 1 and sour water feed
conditions for air stripping are shown in Table 3.
The optimum method will result in the lowest Equivalent Annual Operating Cost (EAOC)
and will be determined. The EAOC for this project, assuming a ten year life and an interest rate
of 10 %, is found using the following equation:
𝐸𝐴𝑂𝐶 =. .34(𝐹𝐶𝐼) + 1.23𝐶𝑈𝑇 + 𝐶𝑅𝑀 (1)
Where FCI is:
𝐹𝐶𝐼 = (𝐶equipment) (2)
A detailed equipment list can be seen in Appendix A.
In the above equation for EAOC, FCI is the fixed capital investment, CUT is the cost of
utilities per years, and CRM is the cost of raw materials. The FCI of both scenarios included the
cost of the tower, heat exchangers, pumps, and a buffer tank. However, the FCI of the air
stripping method included a compressor since the air feed was pressurized. The total utilities
cost for both stripping processes include the duties for the heat exchangers, pumps, and
reboilers. The total yearly utilities for the air stripping also included the power usage for the
compressor.
The EAOC for natural gas stripping also includes the total yearly cost for natural gas
consumption. The yearly raw material cost, CRM, for natural gas stripping was found at the
market price of 0.00267 $/ft3 [2]. FCI and yearly utilities are found by utilizing CAPCOST.
Procedure
Using process simulation software, a trayed SCDS column was simulated with sour
water entering at the top and air or natural gas entering at the bottom. An equipment summary
for the column for natural gas stripping can be seen in Table 2 and for air stripping in Table 4 in
Appendix A. Pumps were required at the inlet for sour water as well as at the outlets. The sour
water was preheated in a heat exchanger using the outlet water as a heat source.
For air stripping, it was assumed that the air was drawn from the natural environment at
75 °F and 0 psig. A compressor was used to compress the air to 5 psig and 133 °F.
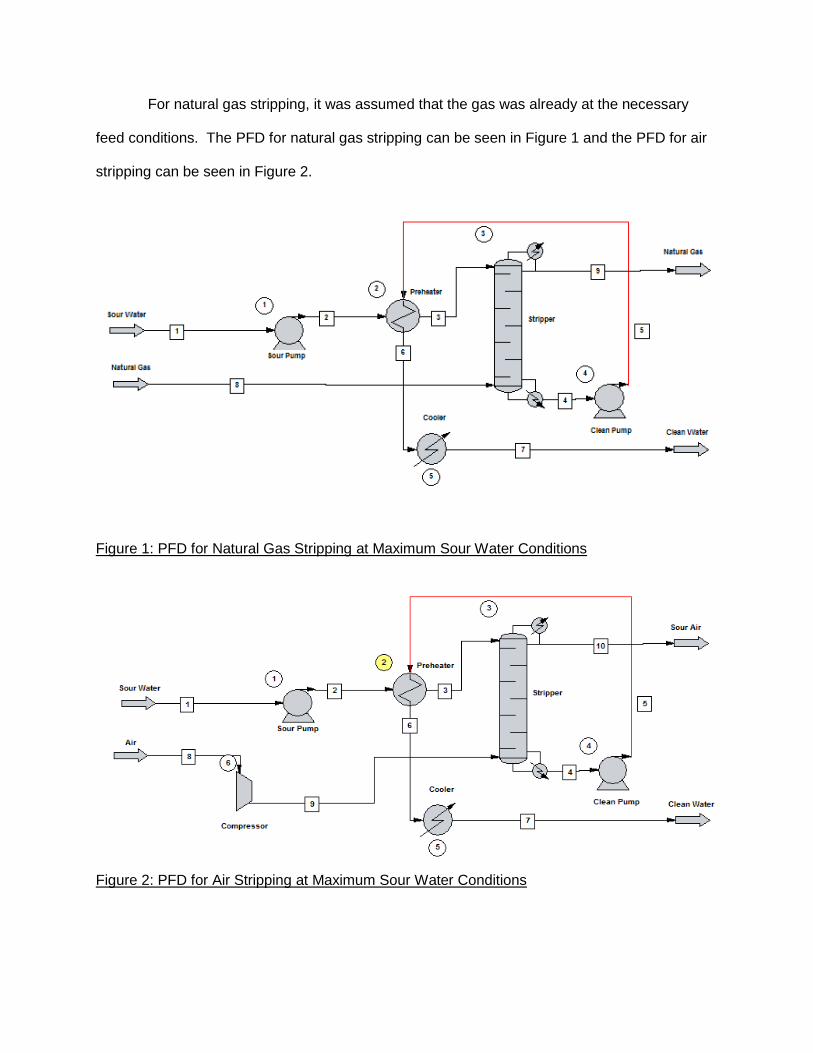
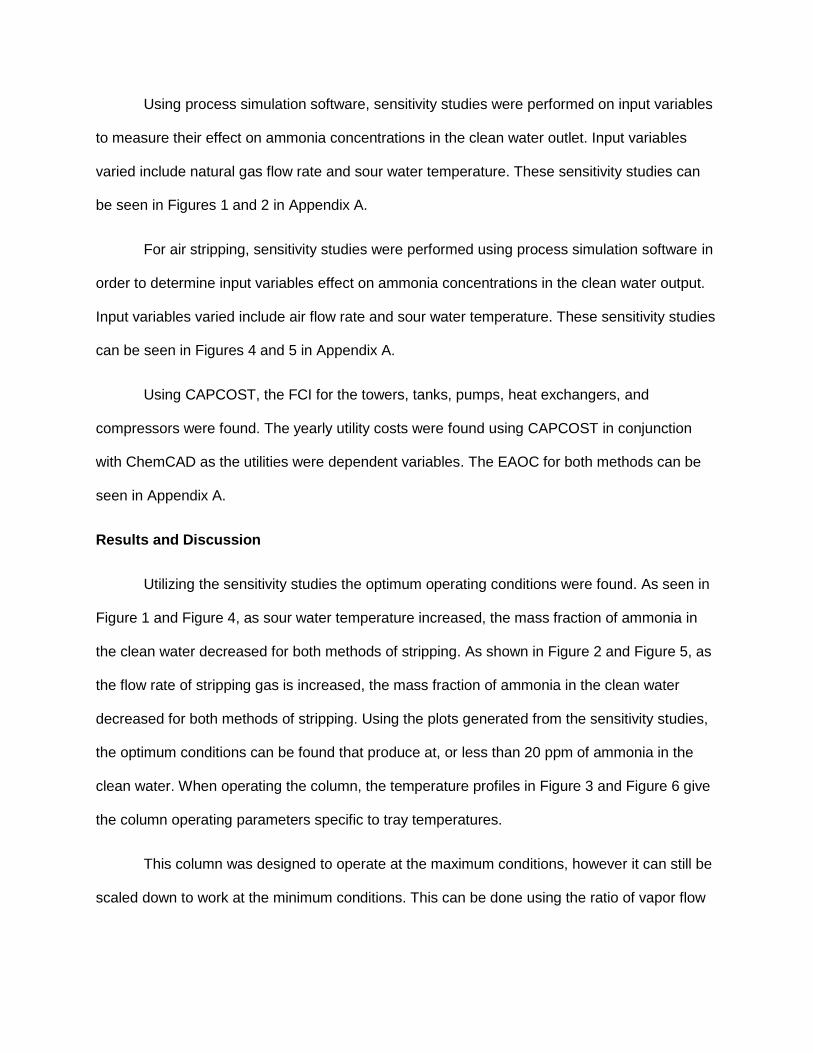
For natural gas stripping, it was assumed that the gas was already at the necessary
feed conditions. The PFD for natural gas stripping can be seen in Figure 1 and the PFD for air
stripping can be seen in Figure 2.
Figure 1: PFD for Natural Gas Stripping at Maximum Sour Water Conditions
Figure 2: PFD for Air Stripping at Maximum Sour Water Conditions
Using process simulation software, sensitivity studies were performed on input variables
to measure their effect on ammonia concentrations in the clean water outlet. Input variables
varied include natural gas flow rate and sour water temperature. These sensitivity studies can
be seen in Figures 1 and 2 in Appendix A.
For air stripping, sensitivity studies were performed using process simulation software in
order to determine input variables effect on ammonia concentrations in the clean water output.
Input variables varied include air flow rate and sour water temperature. These sensitivity studies
can be seen in Figures 4 and 5 in Appendix A.
Using CAPCOST, the FCI for the towers, tanks, pumps, heat exchangers, and
compressors were found. The yearly utility costs were found using CAPCOST in conjunction
with ChemCAD as the utilities were dependent variables. The EAOC for both methods can be
seen in Appendix A.
Results and Discussion
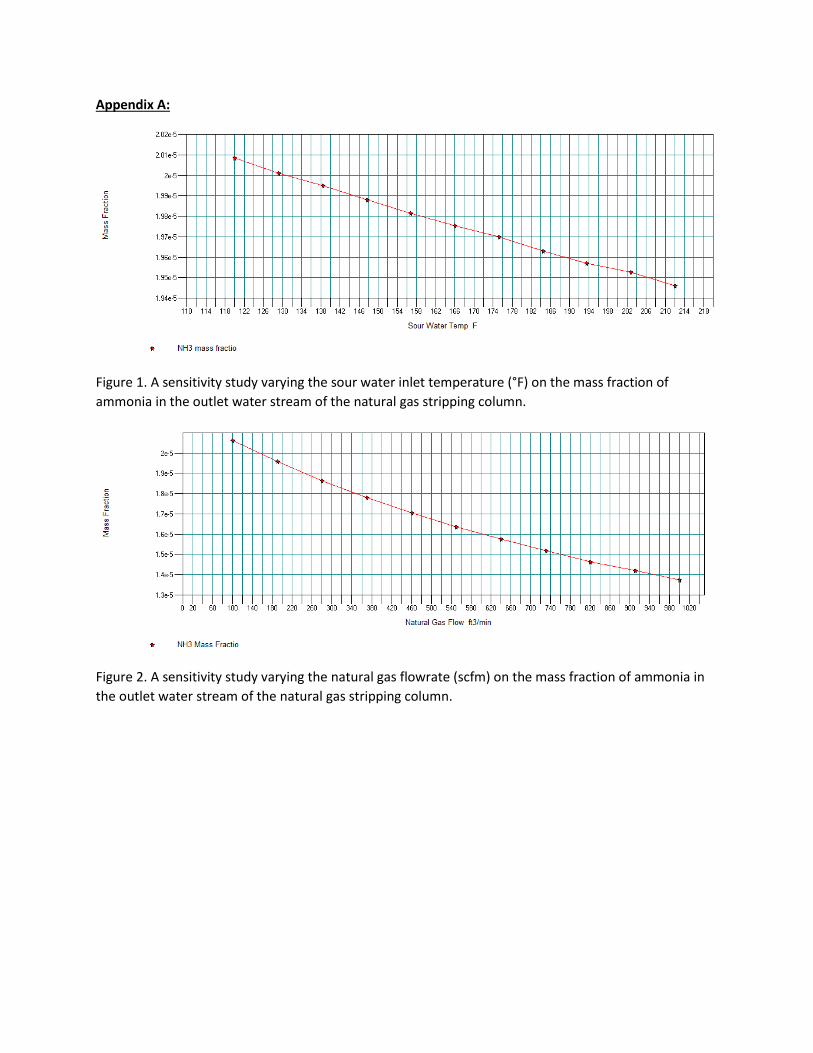
Utilizing the sensitivity studies the optimum operating conditions were found. As seen in
Figure 1 and Figure 4, as sour water temperature increased, the mass fraction of ammonia in
the clean water decreased for both methods of stripping. As shown in Figure 2 and Figure 5, as
the flow rate of stripping gas is increased, the mass fraction of ammonia in the clean water
decreased for both methods of stripping. Using the plots generated from the sensitivity studies,
the optimum conditions can be found that produce at, or less than 20 ppm of ammonia in the
clean water. When operating the column, the temperature profiles in Figure 3 and Figure 6 give
the column operating parameters specific to tray temperatures.
This column was designed to operate at the maximum conditions, however it can still be
scaled down to work at the minimum conditions. This can be done using the ratio of vapor flow
rate (SCFM) to liquid flow rate (GPM). For both air and natural gas stripping this ratio is 4.0
SCF/gal.
The optimum method can be seen by comparing the EAOC for each method. The EAOC
for air stripping also factors in the annual cost of fines that will be leveled by the EPA for going
over the allowable amount of ammonia in the released air. As shown in Table 5 and Table 6, the
EAOC for air stripping is $1,199,876.69 and the EAOC for natural gas stripping is
$1,130,010.41.
Conclusions
As shown in Tables 5 and 6, the optimum method for sour water stripping was
determined to be with natural gas. As shown in Table 7 the best overall method is to use natural
gas stripping while using the clean water for boiler feed in order to save on utility costs. This
conclusion that natural gas stripping is the optimum method based on current market price for
natural gas. As the market price can fluctuate, the EAOC for natural gas stripping can fluctuate
as well.
Acknowledgements
We would like to thank the University of Alabama Department of Biological and Chemical
Engineering for providing the facilities in which this work was done. We also like to thank Dr.
Sadeddin Kherfan for providing supervisory assistance.
Appendix A:
Figure 1. A sensitivity study varying the sour water inlet temperature (°F) on the mass fraction of
ammonia in the outlet water stream of the natural gas stripping column.
Figure 2. A sensitivity study varying the natural gas flowrate (scfm) on the mass fraction of ammonia in
the outlet water stream of the natural gas stripping column.
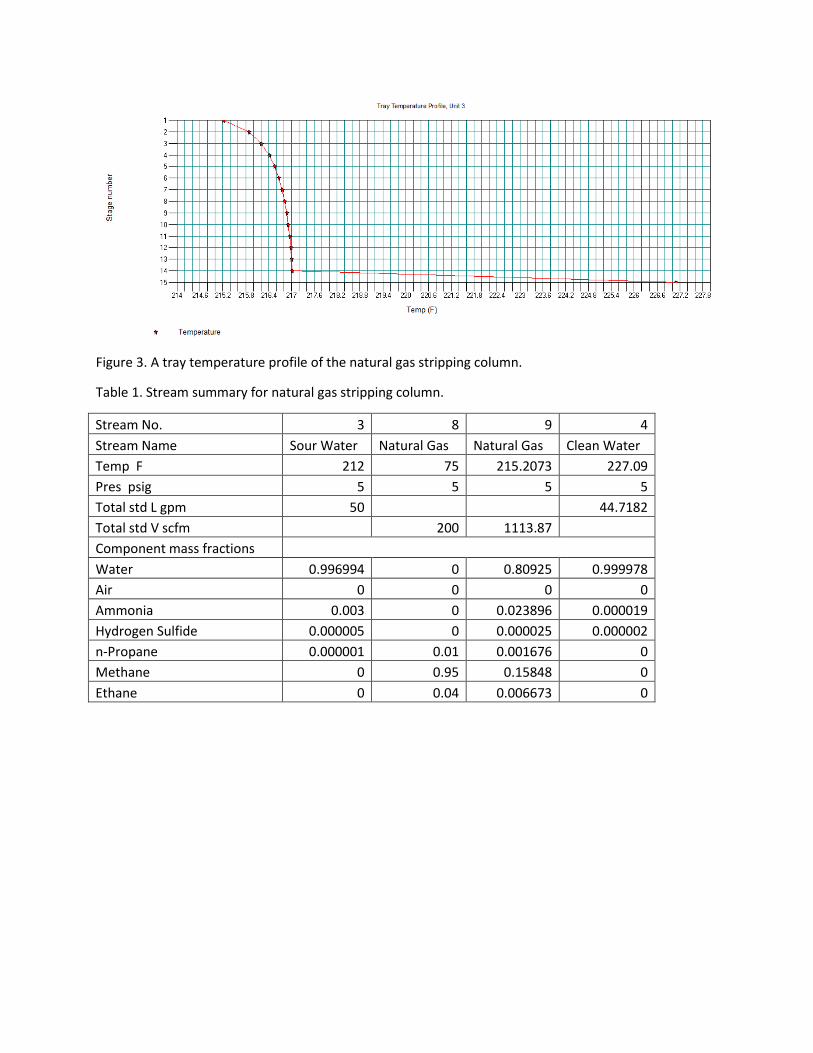
Figure 3. A tray temperature profile of the natural gas stripping column.
Table 1. Stream summary for natural gas stripping column.
Stream No. 3 8 9 4
Stream Name Sour Water Natural Gas Natural Gas Clean Water
Temp F 212 75 215.2073 227.09
Pres psig 5 5 5 5
Total std L gpm 50 44.7182
Total std V scfm 200 1113.87
Component mass fractions
Water 0.996994 0 0.80925 0.999978
Air 0 0 0 0
Ammonia 0.003 0 0.023896 0.000019
Hydrogen Sulfide 0.000005 0 0.000025 0.000002
n-Propane 0.000001 0.01 0.001676 0
Methane 0 0.95 0.15848 0
Ethane 0 0.04 0.006673 0
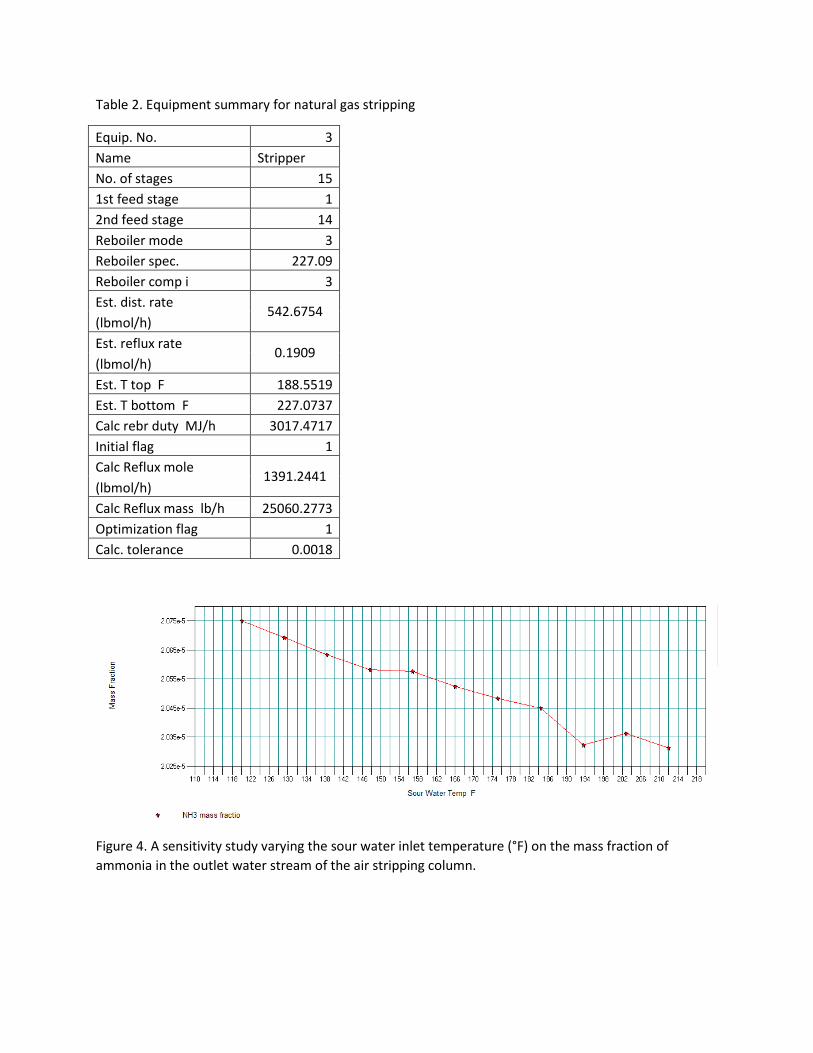
Table 2. Equipment summary for natural gas stripping
Equip. No. 3
Name Stripper
No. of stages 15
1st feed stage 1
2nd feed stage 14
Reboiler mode 3
Reboiler spec. 227.09
Reboiler comp i 3
Est. dist. rate 542.6754
(lbmol/h)
Est. reflux rate 0.1909
(lbmol/h)
Est. T top F 188.5519
Est. T bottom F 227.0737
Calc rebr duty MJ/h 3017.4717
Initial flag 1
Calc Reflux mole 1391.2441
(lbmol/h)
Calc Reflux mass lb/h 25060.2773
Optimization flag 1
Calc. tolerance 0.0018
Figure 4. A sensitivity study varying the sour water inlet temperature (°F) on the mass fraction of
ammonia in the outlet water stream of the air stripping column.
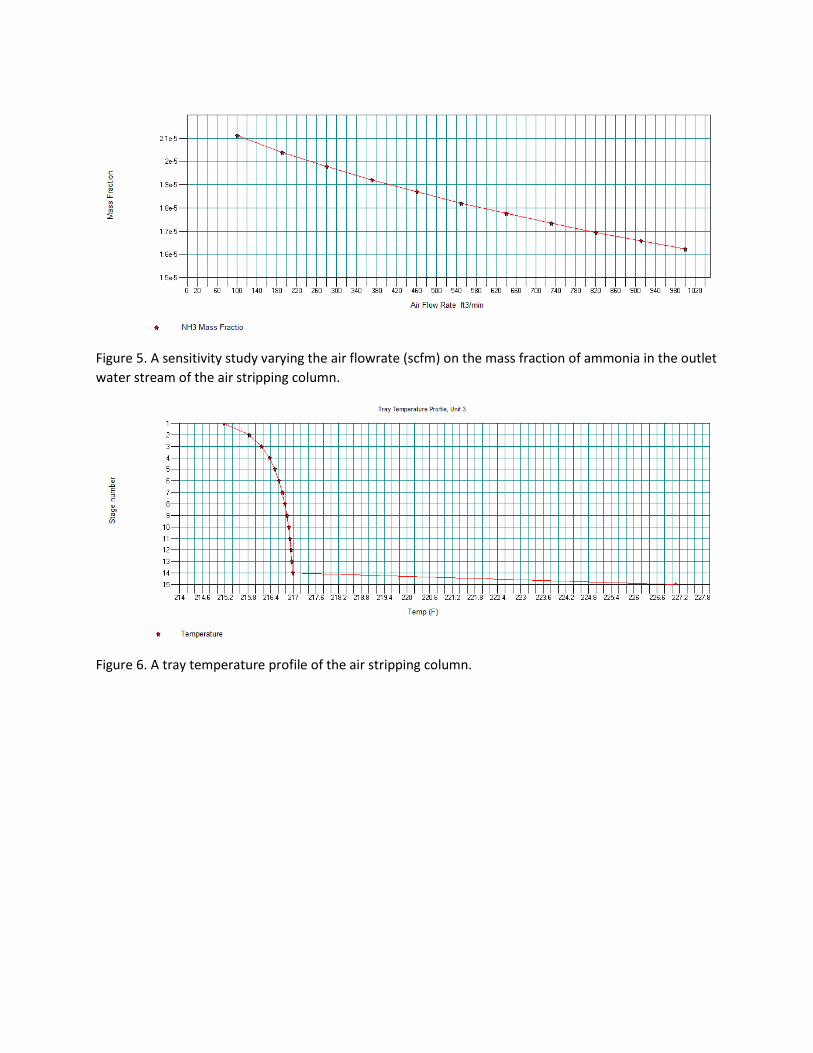
Figure 5. A sensitivity study varying the air flowrate (scfm) on the mass fraction of ammonia in the outlet
water stream of the air stripping column.
Figure 6. A tray temperature profile of the air stripping column.
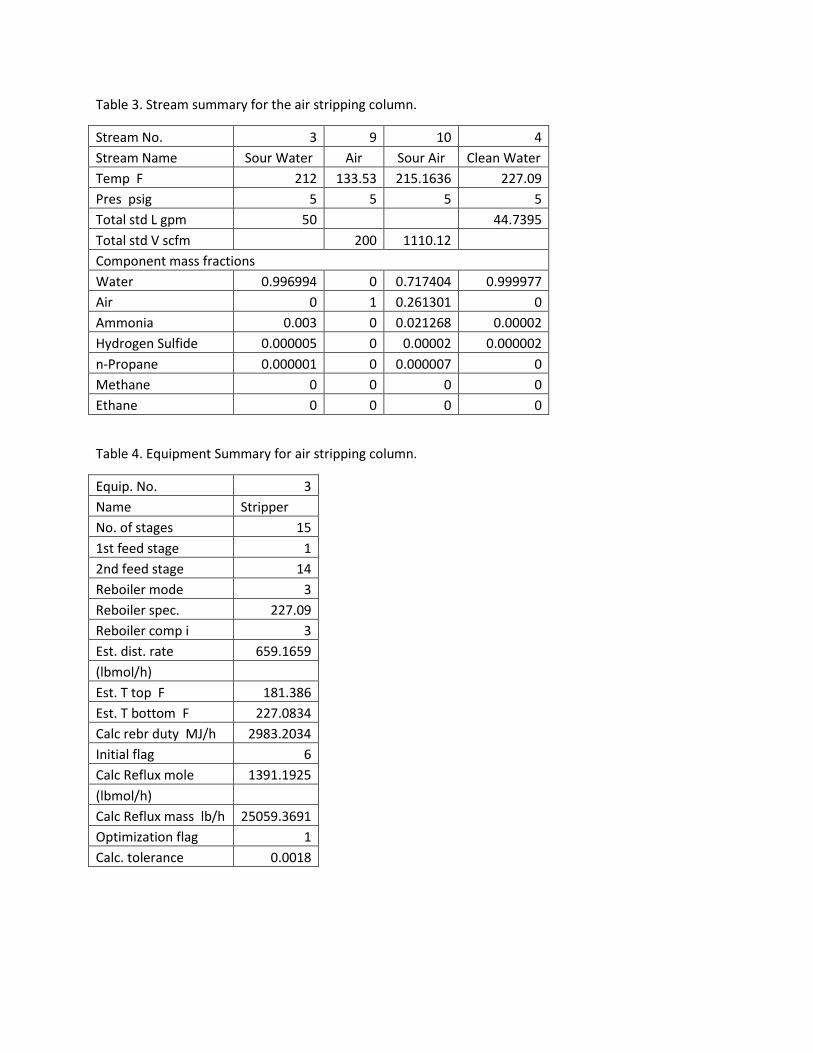
Table 3. Stream summary for the air stripping column.
Stream No. 3 9 10 4
Stream Name Sour Water Air Sour Air Clean Water
Temp F 212 133.53 215.1636 227.09
Pres psig 5 5 5 5
Total std L gpm 50 44.7395
Total std V scfm 200 1110.12
Component mass fractions
Water 0.996994 0 0.717404 0.999977
Air 0 1 0.261301 0
Ammonia 0.003 0 0.021268 0.00002
Hydrogen Sulfide 0.000005 0 0.00002 0.000002
n-Propane 0.000001 0 0.000007 0
Methane 0 0 0 0
Ethane 0 0 0 0
Table 4. Equipment Summary for air stripping column.
Equip. No. 3
Name Stripper
No. of stages 15
1st feed stage 1
2nd feed stage 14
Reboiler mode 3
Reboiler spec. 227.09
Reboiler comp i 3
Est. dist. rate 659.1659
(lbmol/h)
Est. T top F 181.386
Est. T bottom F 227.0834
Calc rebr duty MJ/h 2983.2034
Initial flag 6
Calc Reflux mole 1391.1925
(lbmol/h)
Calc Reflux mass lb/h 25059.3691
Optimization flag 1
Calc. tolerance 0.0018
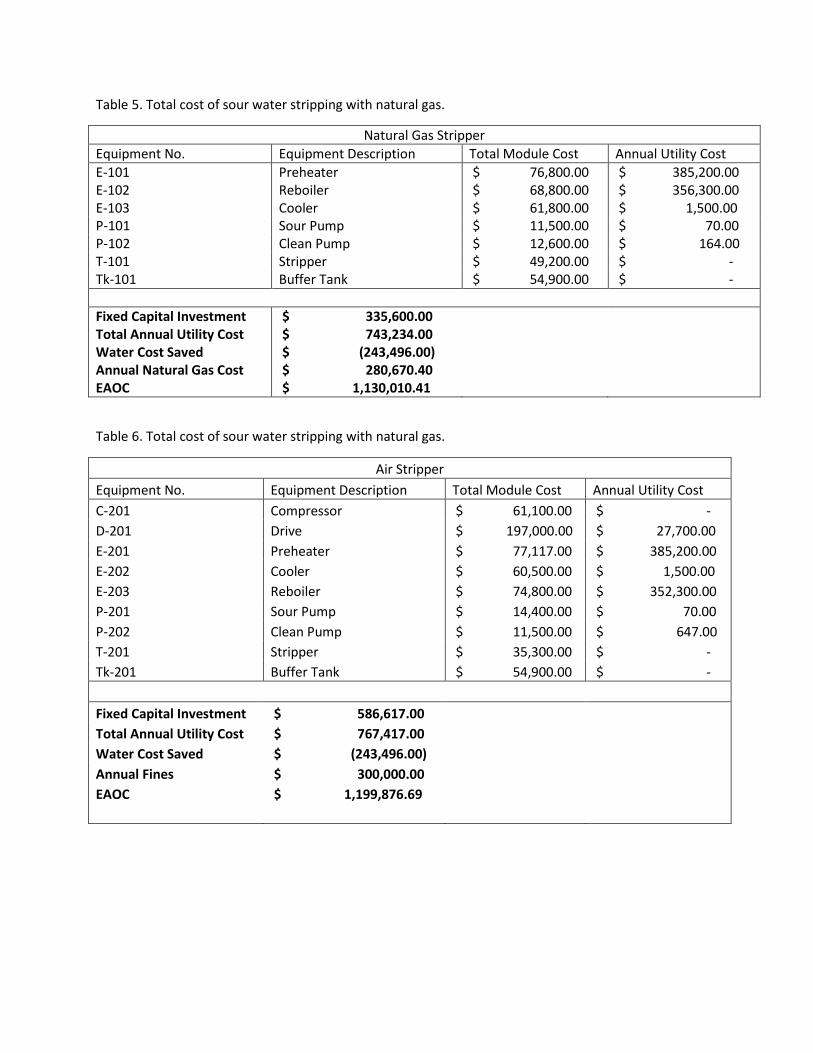
Table 5. Total cost of sour water stripping with natural gas.
Natural Gas Stripper
Equipment No. Equipment Description Total Module Cost Annual Utility Cost
E-101 Preheater $ 76,800.00 $ 385,200.00 E-102 Reboiler $ 68,800.00 $ 356,300.00 E-103 Cooler $ 61,800.00 $ 1,500.00 P-101 Sour Pump $ 11,500.00 $ 70.00 P-102 Clean Pump $ 12,600.00 $ 164.00 T-101 Stripper $ 49,200.00 $ - Tk-101 Buffer Tank $ 54,900.00 $ -
Fixed Capital Investment $ 335,600.00 Total Annual Utility Cost $ 743,234.00
Water Cost Saved $ (243,496.00)
Annual Natural Gas Cost $ 280,670.40
EAOC $ 1,130,010.41
Table 6. Total cost of sour water stripping with natural gas.
Air Stripper
Equipment No. Equipment Description Total Module Cost Annual Utility Cost
C-201 Compressor $ 61,100.00 $ -
D-201 Drive $ 197,000.00 $ 27,700.00
E-201 Preheater $ 77,117.00 $ 385,200.00
E-202 Cooler $ 60,500.00 $ 1,500.00
E-203 Reboiler $ 74,800.00 $ 352,300.00
P-201 Sour Pump $ 14,400.00 $ 70.00
P-202 Clean Pump $ 11,500.00 $ 647.00
T-201 Stripper $ 35,300.00 $ -
Tk-201 Buffer Tank $ 54,900.00 $ -
Fixed Capital Investment $ 586,617.00
Total Annual Utility Cost $ 767,417.00
Water Cost Saved $ (243,496.00)
Annual Fines $ 300,000.00
EAOC $ 1,199,876.69
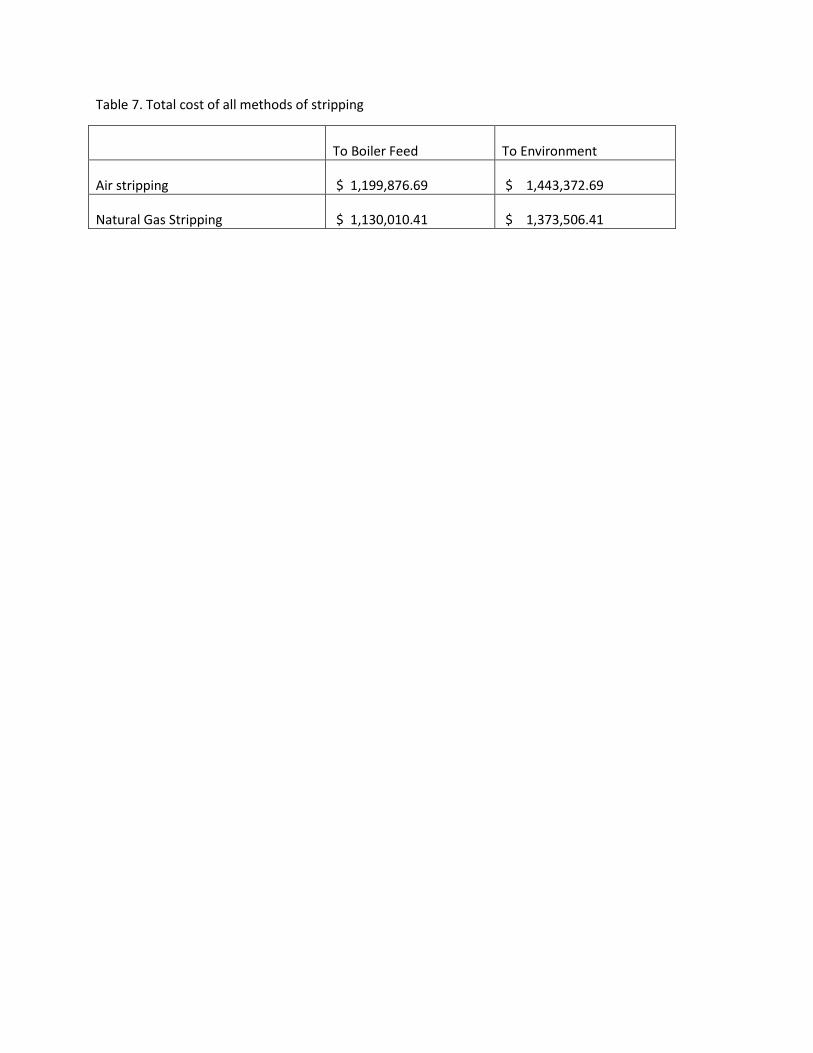
Table 7. Total cost of all methods of stripping
To Boiler Feed To Environment
Air stripping $ 1,199,876.69 $ 1,443,372.69
Natural Gas Stripping $ 1,130,010.41 $ 1,373,506.41
References
[1] Turton, Richard, Richard C. Bailie, Wallace B. Whiting, Joseph A. Shaeiwitz, and Debangsu
Bhattacharyya. Analysis, Synthesis, and Design of Chemical Processes. 4th ed. Upper Saddle
River, NJ: Prentice Hall, 2012. Print.
[2] "Commodities: Latest Natural Gas Price & Chart." NASDAQ.com. Barchart.com, Inc. Web. 1
Apr. 2015. <http://www.nasdaq.com/markets/natural-gas.aspx>.
[3] "Liquid Water Properties at Different Pressures." Liquid Water Properties at Different
Pressures. Engineering Tool Box. Web. 14 Apr. 2015.
<http://www.engineeringtoolbox.com/water-properties-d_1258.html>.
[4] "Gases - Specific Heats and Individual Gas Constants." Gases - Specific Heats and
Individual Gas Constants. Engineering Tool Box. Web. 14 Apr. 2015.
<http://www.engineeringtoolbox.com/specific-heat-capacity-gases-d_159.html>.
[5] "Overall Heat Transfer Coefficients for Some Common Fluids and Heat Exchanger
Surfaces."Overall Heat Transfer Coefficients for Some Common Fluids and Heat Exchanger
Surfaces. Engineering Tool Box. Web. 14 Apr. 2015.
<http://www.engineeringtoolbox.com/overall-heat-transfer-coefficients-d_284.html>.