Embed Size (px)
Citation preview

AIAN Economic Data from the U.S. Census Bureau
Naomi Blackman
Section Chief, Business Owners Branch
Economy-Wide Statistics Division
U.S. Census Bureau
July 24, 2017

Agenda
Survey of Business Owners
Annual Survey of Entrepreneurs
2
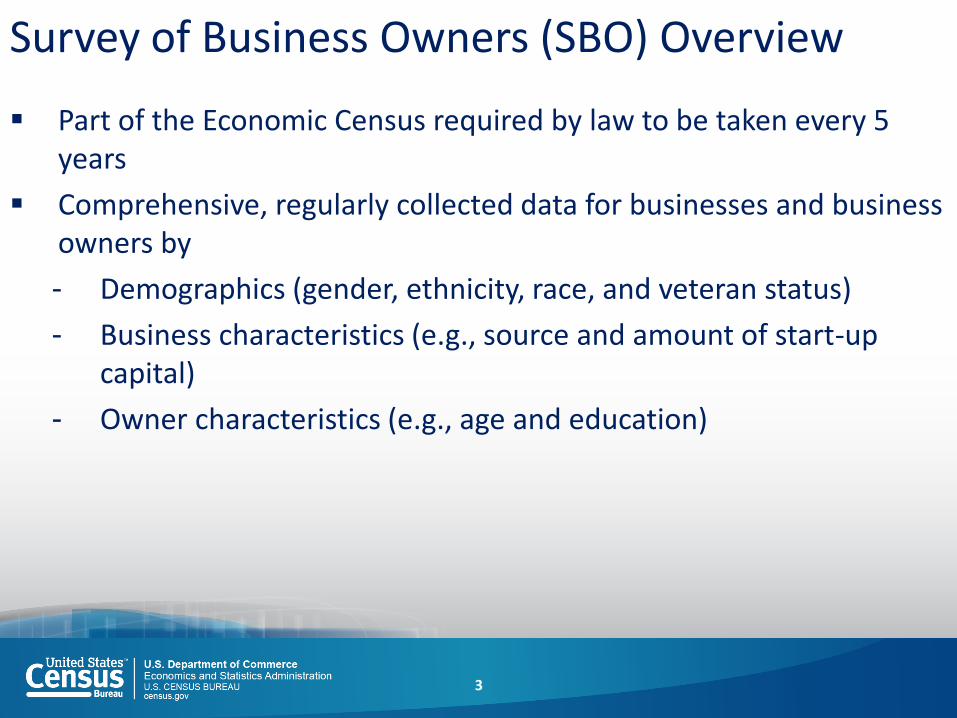
Survey of Business Owners (SBO) Overview
Part of the Economic Census required by law to be taken every 5 years
Comprehensive, regularly collected data for businesses and business owners by
- Demographics (gender, ethnicity, race, and veteran status)
- Business characteristics (e.g., source and amount of start-up capital)
- Owner characteristics (e.g., age and education)
3

SBO Overview (con’t)
Conducted on a company or firm basis
Includes all nonfarm businesses filing IRS applicable tax forms
Both employer and non-employer businesses
Covers 20 NAICS sectors with some exclusions
Select data items from IRS tax forms, economic census reports, and responses to the survey
4

SBO Sample
2012 SBO sampled approximately 1.75M employer and nonemployer businesses
Letters were mailed to a random sample of businesses selected from a list of all firms operating during 2012 with receipts of $1,000 or more
5

SBO’s History of AIAN Statistics
Established in 1969 by the same Executive Order that created the Dept. of Commerce’s Minority Business Development Agency (MBDA)
First conducted in its current form in 2002, featuring:
First-ever, detailed characteristics of businesses owned by persons of American Indian and Alaska Native (AIAN) descent
Excludes businesses that are tribally owned or owned by Alaska Native Regional or Village Corporations and their subsidiaries.
6

What is AIAN Business Ownership? AIAN defined as “A person having origins in any of the original
peoples of North and South America (including Central America), and who maintains tribal affiliation or community attachment.”
Respondent instructed to “Enter name of (the owner’s) enrolled or principal tribe” if the AIAN response checkbox is selected.
“American Indian- and Alaska Native-Owned” is defined as any firm with AIAN owners holding a 51% or larger stake in the business during the survey year.
Tribally-owned businesses are out-of-scope for the Survey of Business Owners program.
7

SBO Data Products
Company Summary Number of firms, receipts, payroll, and employment by gender,
ethnicity, race, and veteran status US, State + DC, MSA, County, Place 2- through 6-digit NAICS Sector Receipts size and employment size Number of NAICS Sectors & Number of States
SBO Characteristics of Businesses (CB) Number of firms, receipts, payroll, and employment by gender,
ethnicity, race, and veteran status for US, Sector, and Table Specific Characteristic
SBO Characteristics of Business Owners (CBO) Number of owners, receipts, payroll, and employment by gender,
ethnicity, race, and veteran status for US, Sector, and Table Specific Characteristic
8

Accessing Data - SBO
Visit: www.census.gov/programs-surveys/sbo.html
Click on ‘Data’ then ‘Tables’
Select the data set you’re interested in (Company Summary, Characteristics of Businesses or Characteristics of Business Owners)
Also- via American Fact Finder (AFF) here: https://factfinder.census.gov/faces/nav/jsf/pages/index.xhtml
9

Accessing Data – SBO (con’t)
10

SBO – 2012 Data
American Indian and Alaska Native-owned
272,919 firms
$38.8B in Receipts/Sales
90.4% nonemployers
Less than 1% of all U.S. firms
11
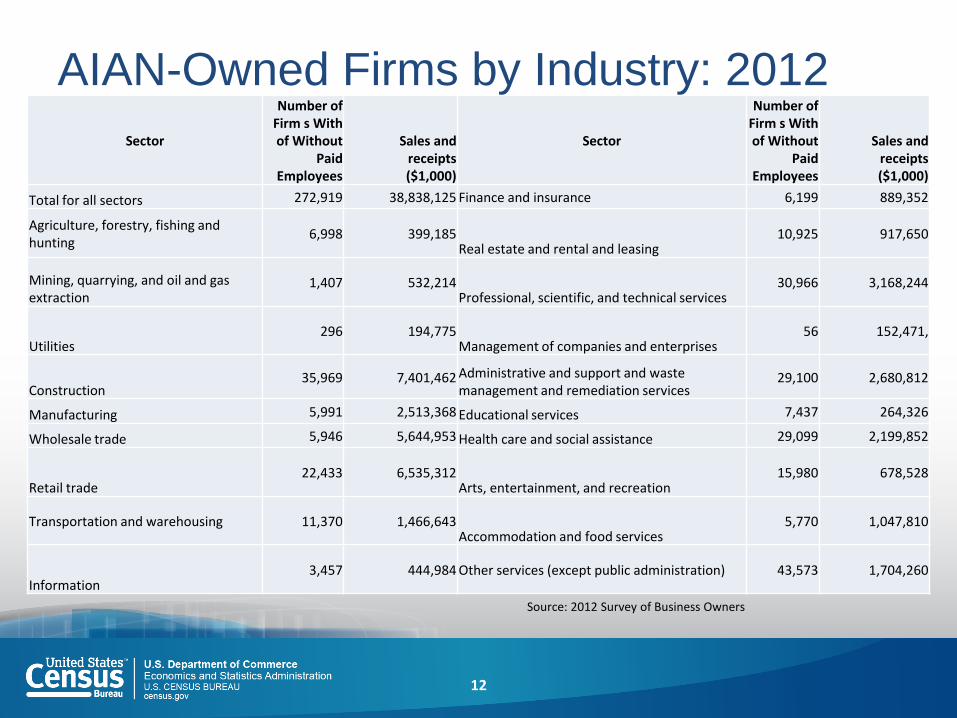
AIAN-Owned Firms by Industry: 2012
Sector
Number of Firm s With of Without
Paid Employees
Sales andreceipts($1,000)
Sector
Number of Firm s With of Without
Paid Employees
Sales andreceipts($1,000)
Total for all sectors 272,919 38,838,125 Finance and insurance 6,199 889,352
Agriculture, forestry, fishing and hunting
6,998 399,185Real estate and rental and leasing
10,925 917,650
Mining, quarrying, and oil and gas extraction
1,407 532,214Professional, scientific, and technical services
30,966 3,168,244
Utilities296 194,775
Management of companies and enterprises56 152,471,
Construction35,969 7,401,462 Administrative and support and waste
management and remediation services29,100 2,680,812
Manufacturing 5,991 2,513,368 Educational services 7,437 264,326
Wholesale trade 5,946 5,644,953 Health care and social assistance 29,099 2,199,852
Retail trade22,433 6,535,312
Arts, entertainment, and recreation15,980 678,528
Transportation and warehousing 11,370 1,466,643Accommodation and food services
5,770 1,047,810
Information3,457 444,984 Other services (except public administration) 43,573 1,704,260
12
Source: 2012 Survey of Business Owners

Number of American Indian- and
Alaska Native-Owned Firms for
Selected States: 2012
Geographic AreaPopulation
estimate (number)
AIAN-owned firms
(number)All firms
(number)Percentage of all
firms, 2012
United States 313,914,040 272,919 27,626,360 1.0
Alaska 731,449 7,489 68,032 11.0
California 38,041,430 41,254 3,548,449 1.2
New Mexico 2,085,538 8,738 151,363 5.8
New York 19,570,261 13,243 2,008,988 0.7
Oklahoma 3,814,820 27,450 327,229 8.4
Texas26,059,203 22,192 2,356,748 0.9
13
Source: 2012 Survey of Business Owners

14
Distribution of Firms by
Receipts Size of Firm: 2012
Receipts size
% of AIAN-
owned firms
% of all
U.S. firms
Less than $50,000 81 67
$50,000 to $99,999 7 9
$100,000 to $249,999 6 10
$250,000 to $499,999 3 5
$500,000 to $999,999 2 4
$1,000,000 or more 2 5
Note: Detail may not add to total because of rounding.
Source: 2012 Survey of Business Owners
15
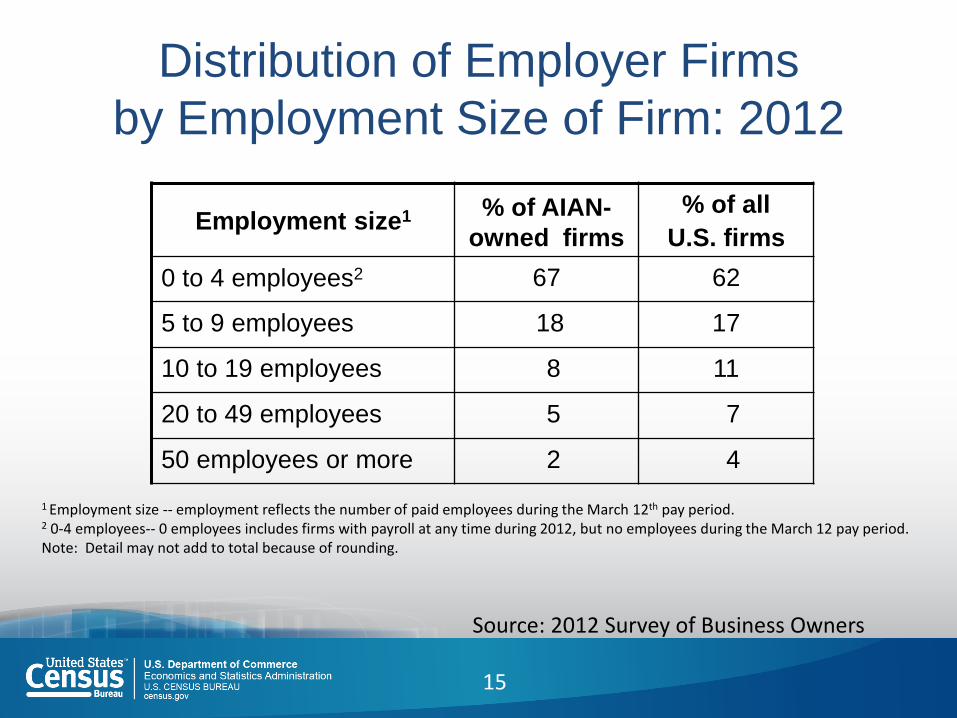
Distribution of Employer Firms
by Employment Size of Firm: 2012
Employment size1 % of AIAN-
owned firms
% of all
U.S. firms
0 to 4 employees2 67 62
5 to 9 employees 18 17
10 to 19 employees 8 11
20 to 49 employees 5 7
50 employees or more 2 4
1 Employment size -- employment reflects the number of paid employees during the March 12th pay period.2 0-4 employees-- 0 employees includes firms with payroll at any time during 2012, but no employees during the March 12 pay period. Note: Detail may not add to total because of rounding.
Source: 2012 Survey of Business Owners
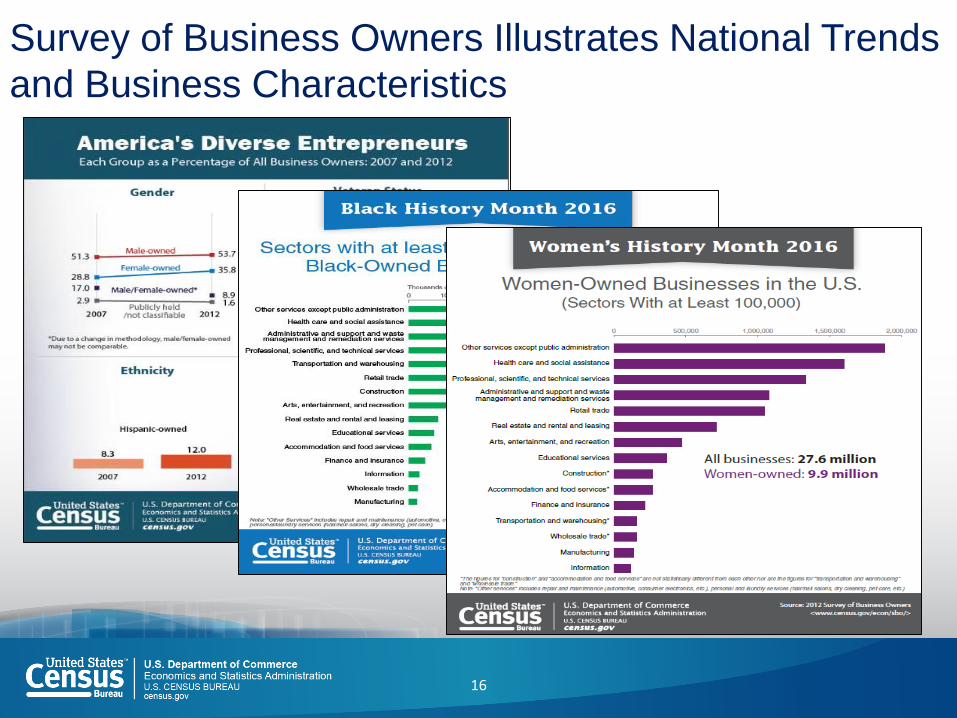
Survey of Business Owners Illustrates National Trends
and Business Characteristics
16

www.census.gov/programs-surveys/sbo.html
17
Annual Survey of Entrepreneurs (ASE) Overview
New mandatory survey that supplements the 5-year Survey of Business Owners
Joint effort between the Ewing Marion Kauffman Foundation (Kauffman), the Minority Business Development Agency (MBDA) and the U.S. Census Bureau for reference years 2014, 2015, and 2016
Collects business and owner characteristics annually
Introduces a new module each survey year to measure relevant business components
Produces annual estimates on firms, receipts, payroll, and employment by gender, ethnicity, race, and veteran status
18

ASE Sample
Samples approximately 290,000 employer businesses
Stratified by metropolitan statistical area (msa), frame, and age of business
Uses administrative data to estimate probability firm is minority- or women-owned
19

ASE Data Collection and Coverage
Includes all nonfarm businesses filing IRS employer tax forms.
Firms with paid employees in operation anytime during the survey year.
Conducted on a company or firm basis.
Samples close to 290K employer businesses
Data compiled by combining data collected in the ASE with data collected on the main Economic Census and administrative records.
20

Business ownership is defined as having 51 percent or more of the stock or equity in the business.
Business ownership is categorized by gender, ethnicity, race, veteran status, and publicly held and other firms not classifiable by gender, ethnicity, race, and veteran status.
Provides data on number of firms with paid employees; sales, receipts, or value of shipments; number of paid employees; and annual payroll by employment and receipts size of firm
21
ASE Data Collection and Coverage cont’d

NEW! ASE Collects Data on Years Firm in
Business
Variables include:
Firms with less than 2 years in business
Firms with 2 to 3 years in business
Firms with 4 to 5 years in business
Firms with 6 to 10 years in business
Firms with 11 to 15 years in business
Firms with 16 or more years in business
22

SBO versus ASE
23
Item SBO ASE
Frequency Every 5 years Annual
Length of time firm in
business?
No Yes
Topical modules? No Yes
Level of Geography U.S., state, county, metro
area, place
U.S., state, 50 most
populous MSAs
Industry detail 6 digit NAICS 2 digit NAICS
Includes nonemployers? Yes No
Number of businesses in
sample
1.75 million 290,000 employers
Includes detailed Asian,
NHOPI, and Hispanic
subgroups?
Yes No

ASE Data Products
24
Company Summary Number of firms, receipts, payroll, and employment by gender,
ethnicity, race, and veteran status US, State + DC, MSA, County, Place 2- through 6-digit NAICS Sector Receipts size and employment size Number of NAICS Sectors & Number of States
SBO Characteristics of Businesses (CB) Number of firms, receipts, payroll, and employment by gender,
ethnicity, race, and veteran status for US, Sector, and Table Specific Characteristic
SBO Characteristics of Business Owners (CBO) Number of owners, receipts, payroll, and employment by gender,
ethnicity, race, and veteran status for US, Sector, and Table Specific Characteristic
Years in Business

Accessing Data - ASE Visit:
www.census.gov/programs-surveys/ase.html
Click on ‘Data’ then ‘Tables’
- Also: https://factfinder.census.gov/faces/nav/jsf/pages/searchresults.xhtml?refresh=t
25

Statistics for U.S. Employer Firms by Years in Business: 2015
26
Source: 2015 Annual Survey of Entrepreneurs SE1500CSA02
Geographic area name
Meaning of 2012 NAICS code
Meaning of Gender code
Meaning of Ethnicity code
Meaning of Race code
Meaning of Veteran code
Meaning of Years in business code Year
Number of firms with paid employees
Sales, receipts, or value of shipments of firms with paid employees ($1,000)
Number of paid employees for pay period including March 12
Annual payroll ($1,000)
United States
Total for all sectors All firms All firms
American Indian and Alaska Native All firms All firms 2015 27,585 $32,896,389 201,923 $7,249,609
United States
Total for all sectors All firms All firms
American Indian and Alaska Native All firms
Firms with less than 2 years in business 2015 3,270 $2,068,930 14,197 $418,031
United States
Total for all sectors All firms All firms
American Indian and Alaska Native All firms
Firms with 2 to 3 years in business 2015 4,253 $2,595,659 20,852 $669,104
United States
Total for all sectors All firms All firms
American Indian and Alaska Native All firms
Firms with 4 to 5 years in business 2015 2,807 $2,314,181 15,881 $491,046
United States
Total for all sectors All firms All firms
American Indian and Alaska Native All firms
Firms with 6 to 10 years in business 2015 6,105 $5,385,454 37,784 $1,394,782
United States
Total for all sectors All firms All firms
American Indian and Alaska Native All firms
Firms with 11 to 15 years in business 2015 3,845 $4,330,024 28,727 $1,036,282
United States
Total for all sectors All firms All firms
American Indian and Alaska Native All firms
Firms with 16 or more years in business 2015 7,304 $16,202,141 84,483 $3,240,364

Statistics for U.S. Employer Firms by Sector: 2015
27
Meaning of Race code
Meaning of 2012 NAICS code
Number of firms with paid employees
Sales, receipts, or value of shipments of firms with paid employees ($1,000)
Meaning of Race code
Meaning of 2012 NAICS code
Number of firms with paid employees
Sales, receipts, or value of shipments of firms with paid employees ($1,000)
American Indian and Alaska Native Total for all sectors 27,585 $32,896,389
American Indian and Alaska Native
Finance and insurance(652) 1,449 T
American Indian and Alaska Native
Agriculture, forestry, fishing and hunting(650) 196 R
American Indian and Alaska Native
Real estate and rental and leasing 736 S
American Indian and Alaska Native
Mining, quarrying, and oil and gas extraction 209 S
American Indian and Alaska Native
Professional, scientific, and technical services 4,358 U
American Indian and Alaska Native Utilities 21 S
American Indian and Alaska Native
Management of companies and enterprises 75 S
American Indian and Alaska Native Construction 5,780 W
American Indian and Alaska Native
Administrative and support and waste management and remediation services 2,348 U
American Indian and Alaska Native Manufacturing 1,119 U
American Indian and Alaska Native Educational services 185 R
American Indian and Alaska Native Wholesale trade 695 S
American Indian and Alaska Native
Health care and social assistance 2,567 U
American Indian and Alaska Native Retail trade 2,702 U
American Indian and Alaska Native
Arts, entertainment, and recreation 332 S
American Indian and Alaska Native
Transportation and warehousing(651) 1,158 U
American Indian and Alaska Native
Accommodation and food services 1,381 U
American Indian and Alaska Native Information 264 R
American Indian and Alaska Native
Other services (except public administration)(653) 1,892 T
Source: 2015 Annual Survey of Entrepreneurs SE1500CSA02

Statistics for Arizona Employer Firms by Years in Business: 2015
Geographic area name Meaning of Race code
Meaning of Veteran code
Meaning of Years in business code Year
Number of firms with paid employees
Sales, receipts, or value of shipments of firms with paid employees ($1,000)
Number of paid employees for pay period including March 12
Annual payroll ($1,000)
ArizonaAmerican Indian and Alaska Native All firms All firms 2015 758 T 4,300 $132,987
ArizonaAmerican Indian and Alaska Native All firms
Firms with less than 2 years in business 2015 77 S e S
ArizonaAmerican Indian and Alaska Native All firms
Firms with 2 to 3 years in business 2015 52 S e S
ArizonaAmerican Indian and Alaska Native All firms
Firms with 4 to 5 years in business 2015 180 S f S
ArizonaAmerican Indian and Alaska Native All firms
Firms with 6 to 10 years in business 2015 90 M 411 $16,619
ArizonaAmerican Indian and Alaska Native All firms
Firms with 11 to 15 years in business 2015 220 S g S
ArizonaAmerican Indian and Alaska Native All firms
Firms with 16 or more years in business 2015 139 S g S
28
Source: 2015 Annual Survey of Entrepreneurs SE1500CSA02

ASE/SBO Data Dissemination
Census Bureau Application Programming Interface (API)
American FactFinder (AFF) release
Press Release
Data Visualizations
Tweets, Facebook Posts, Blogs
29

Uses of Data Government program officials, industry organization leaders, economic and social analysts,
and business entrepreneurs routinely use the SBO statistics. Examples of data use include those by: The Small Business Administration (SBA) and the Minority Business Development
Agency (MBDA) to assess business assistance needs and allocate available program resources.
Local government commissions on small and disadvantaged businesses to establish and evaluate contract procurement practices.
Federal, state, and local government agencies as a framework for planning, directing, and assessing programs that promote the activities of disadvantaged groups.
A national women-owned business trade association to assess women-owned businesses by industry and area and to educate other industry associations, corporations, and government entities.
Consultants and researchers to analyze long-term economic and demographic shifts and differences in ownership and performance among geographic areas.
Individual business owners to analyze their operations in comparison to similar firms, compute their market share, and assess their growth and future prospects.
30