Embed Size (px)
Citation preview

NASA-TH-111267
AIAA 95-3610
Optimal Technology InvestmentStrategies for aReusable Launch VehicleA. A. MooreR. D. BraunR. W. Powell
NASA Langley Research CenterHampton, Virginia
AIAA 1995 Space Programs andTechnologies Conference
September 26-28, 1995/Huntsville, AL
For permission to copy or republish, contact the American Institue of Aeronautics and Astronautics
370 L'[-nfant Promenade, S.W., Washington, D.C. 20024
https://ntrs.nasa.gov/search.jsp?R=19960014828 2018-05-18T21:10:54+00:00Z

OPTIMAL TECHNOLOGY INVESTMENT STRATEGIES
FOR A REUSABLE LAUNCH VEHICLE
A. A. Moore*
R. D. Braun**
R. W. Powell**
NASA Langley Research Center
Hampton, Virginia
Abstract
Within the present budgetary environment, developing
the technology that leads to an operationally efficient space
transportation system with the required performance is a chal-
lenge. The present research focuses on a methodology to
determine high payoff technology investment strategies.
Research has been conducted at Langley Research Center in
which design codes for the conceptual analysis of space trans-
portation systems have been integrated in a multidisciplinary
design optimization approach. The current study integrates
trajectory, propulsion, weights and sizing and cost disciplines
where the effect of technology maturation on development
cost of a single stage to orbit reusable launch vehicle is ex-
amined. Results show that the technology investment prior
to full-scale development has a significant economic payoff.
The design optimization process is used to determine strate-
gic allocations of limited technology funding to maximize
the economic payoff.
Nomenclature
ATP
ATS
CER
CONSIZ
DC
ECD
ISS
MDO
NASA
OMS
POST
RCS
Authority to Proceed
Access to Space
Cost Estimating Relationship
Configuration Sizing Program
Development CostElectrical Conversion and Distribution
International Space Station
Multidisciplinary Design Optimization
National Aeronautics and Space Administration
Orbital Maneuvering System
Program to Optimize Simulated Trajectories
Reaction Control System
*Aerospace Technologist, Space Systems and ConceptsDivision, Member AIAA.
**Aerospace Engineer, Space Systems and Concepts
Division, Member AIAA.
Copyright © 1995 American Institute of Aeronautics and Astronautics,Inc. No copyright is asserted in the United States underTitle 17, U.S.Code. The U.S. Government has a royalty-free license to exercise allrights under the copyright c laimed herein for Governmental purposes.All other rights are reserved by the copyright owner.
RLV
SSTO
TC
TPS
TRL
Reusable Launch Vehicle
Single Stage To Orbit
Technology Cost
Thermal Protection System
Technology Readiness Level
Introduction
For several years, NASA has been studying Earth-to-
Orbit transportation options with the goal of reducing the
cost of access to space. 1-4 The Access to Space Study 5 con-
cluded that a fully reusable system utilizing "leapfrog" tech-
nology was the optimal method to achieve the goals of low
cost and increased safety and reliability. It was also concluded
the most desirable path toward the development of an ad-
vanced technology fully reusable rocket vehicle was a fo-
cused technology maturation program where the enabling and
enhancing technologies are developed and demonstrated prior
to beginning a full-scale development program. This direc-
tion is currently being taken under the X-33 Cooperative
Agreements between NASA and industry. Critical to the suc-
cess of this program is a clear understanding of the relation-
ship between technology, design and cost.
The synthesis of a launch vehicle concept is a
multidisciplinary process involving geometry, aerodynam-
ics, propulsion, structures, materials, subsystems, weights and
sizing, heating, performance, operations, cost, etc. In order
to make informed technology decisions early in the design
process, a streamlined capability for rapid analysis of candi-
date concepts is needed. Research has been conducted at
NASA Langley Research Center in which design codes tor
the conceptual analysis of space transportation systems have
been integrated and a muitidisciplinary optimization (MDO)
approach has been applied. 6'7 The MDO framework has been
applied to reusable launch vehicle concepts to examine a
variety of conceptual and configuration trade analyses. More
recently, the impact of including cost equations into this con-
ceptual design process has been explored. 8'9 The present re-

searchusestheMDOframeworkto quantifytheeffectoftechnologymaturationondevelopmentcosts.
Reusable Launch Vehicle Technologies
In accordance with national space transportation policy,
a Reusable Launch Vehicle (RLV) program has been initi-
ated with the goal of dramatically reducing the cost of access
to space. The technology maturation process leading to the
eventual development of an SSTO design with sufficient ro-
bustness for operational efficiency is an essential component
of this program. A five-year technology program that allows
the vehicle technologies to be matured prior to initiation of
full-scale development is presently underway.
The RLV technology program is based on the technol-
ogy plan set forth in the Access to Space Study. 10 Under this
study, a technology assessment was performed by technol-
ogy working groups with expertise in the various disciplin-
ary areas. To cover a broad spectrum of options, technolo-
gies for three classes of reusable vehicle concepts were as-
sessed: an all rocket SSTO; an airbreathing/rocket SSTO;
and an airbreathing/rocket two-stage to orbit (TSTO). 1 ! The
detailed assessment includes the current readiness status, a
list of technology tasks, level of technical risk, level of pro-
gram criticality, priority, and estimates of cost and schedule
for each candidate technology. The NASA Technology Readi-
ness Level (TRL) scale (Figure 1) was used as the measure
of technology maturity. Funding requirements are based on
the estimated cost required to advance the technologies from
their current assessed levels to NASA TRL 6 within five
years. This assessment was used as a reference in the present
investigation.
Basic Technology
____R_e__a_re_h_....
Research to Prove
Feasibility
Technology
___Develop_m_e_r____,
Technology
Demonstration
System/Subsystem
___v_el_o____e___
System Test,Launch and
Operations
--Level 1
Level 2
--Level 3
Level 4
-Level S
Level 6
B
Level 7
"-Level 8
Level 9
Basic principles observed and reported
Technology concept and/or application formulated
Analytical and experimental critical function and/o
characteristic proof-of-concept
Component and/or breadboard validation in
laboratory environment
Component and/or breadboard validation in
relevant environment
System/subsystem model or prototypedemonstration in a relevant environment
(ground of space)
System prototype demonstration in a space
environment
Actual system completed and "flight qualilied"
through test and demonstration (ground or space)
Actual system "flight proven" through successful
mission operations
Figure 1. NASA technology readiness levels.
Problem Definition
The degree of success of the technology program will
have a strong effect on the cost of the program to follow.
The effect of technology maturation at the initiation of ve-
hicle development can be shown to have a significant effect
on the development cost and schedule. Using the PRICE-H 12
cost model, three funding profiles were generated for a ref-
erence RLV concept reflecting differences in development
programs (Figure 2). PRICE-H is a multivariate model that
utilizes engineering and design variables to generate inte-
grated cost and schedule predictions. To generate the data
shown in Figure 2, the maturity level of technologies was
varied, holding all other design and programmatic variables
constant. The total development cost in fixed year dollars for
each program is the area under each curve. In program A,
technologies are matured to TRL 6 prior to start of develop-
ment. Program B starts the development program at current
TRL levels, without the benefit of a technology maturation
program, resulting in a significant increase in cost and sched-
ule. Program C starts development at current TRL levels,
but tries to achieve an accelerated schedule equal to the du-
ration predicted under Program A. All technologies are ma-
tured, but at different rates and on different schedules.
Relativecost
0
,/'C "'_. A. Development starts with
/ \, technologies matured to TRL 6/ \ B. Development starts at current
"\ technology levels (no technology
'\ investment)
\ C. Current technology levels withaccelerated schedule
.// \-,,
I I I I _,. I i % I
2 4 6 8 10 12 14
Schedule duration, years
Figure 2. Impact of technology maturation.
The above analysis demonstrates the dynamic relation-
ship between technology, cost and schedule. Next, the trade
between the dollars spent on the technology program, termed
technology investment, and the resultant decrease in program
cost and schedule is examined.
The performance and operability requirements of a next
generation space transportation system require advancements
in multiple technologies areas regardless of the concept even-
tually selected. Several core technologies were identified as

essentialforthedevelopmentofanyofthethreeoptionsstud-iedundertheATSstudy:reusablecryogenictanks,low-main-tenanceTPS,autonomousflightcontrol,operationsenhance-menttechnologies,vehiclehealthmanagement,andlight-weightstructures.Inaddition,enablingtechnologiesuniquetoeachclassof vehicleconceptwereidentified,i.e.,mainpropulsion.10Thecostofmaturingtheindividualtechnolo-giesvaries,asdoesthedevelopmentcostofthevehiclesub-systemsinwhichthetechnologyisutilized.Eachtechnol-ogyhasadifferentdegreeofpayofftothevehicleintermsofdevelopmentcost,schedule,andperlormance.
Theproblemaddressedhereistoquantifythepotentialpayoffstothevehicleintermsoftotaldevelopmentcostbasedonthetradebetweenthetimingoftechnologydevelopmentin theindividualtechnologiesandtheresultantimpactoncontributingsubsystemdevelopmentcosts.Oncequantified,high-payofftechnologyinvestmentstrategiescanbedeter-mined.A multidisciplinarydesignoptimizationapproachisusedforthisdetermination.
MultidisciplinaryDesign Optimization
Over the last several years, a multidisciplinary design
framework has been developed at Langley Research Center
for the analyses of vehicle systems. Numerous optimization
approaches and disciplinary combinations have been applied
to a variety of launch and reentry problems. 6'7 Improvements
have been achieved using the MDO approach over other
methods which required the generation of many more design
points in order to analyze the various design options and sen-
sitivities. Recently, cost algorithms have been integrated into
this framework. 8"9
The design of a representative SSTO RLV with a se-
lected set of technologies is used in the present study. TheRLV is adual- fueled rocket sized to deliver and return a 25,000-
lb. payload to the International Space Station (ISS). The launch
is assumed to originate at the Eastern Test Range at the Kennedy
Space Center and the ISS is assumed to be in a 220-n. mi.
circular orbit with a 51.6 degree inclination. The design of the
vehicle incorporates several of the technologies assessed in
the Access to Space study. Technologies include composite
primary and secondary structures, advanced carbon-carbonhot structures, aluminum lithium reusable tanks, advanced
thermal protection system, tripropellant advanced main pro-
pulsion, integrated RCS/OMS auxiliary propulsion, high-
density fuel cells, electromechanical actuation, vehicle health
monitoring and management, and autonomous flight controls.
This vehicle is more completely described in Stanley, et al. 13
I System Optimizer I
Allocate lechn01ogy investment |
tO minimize DC I
IDecoupling I
of the I
design I
space II
Total cost =
"_ TC+DC
Figure 3. Multidisciplinary design optimization
framework..
A design framework linking performance, weights and
sizing, propulsion, and cost disciplines was used. (Figure 3).
An existing vehicle geometry, structural concept and aero-
dynamic database were used to complete the analyses but
were not directly integrated into the MDO framework.
Vehicle performance was determined by numerically in-
tegrating the three degree-of-freedom equations of motion
with the use of the Program to Optimize Simulated Trajecto-
ries (POST). 14 POST is used to calculate the in-flight and
terminal constraints and to compute the vehicle mass ratio
and required propellant fractions, which are required inputs
for the weights and sizing analysis. Inflight constraints in-
clude a normal force limit and 3-g acceleration limit. Propul-
sion system parametrics supplied by Pratt & Whitney, based
on modification of a proposed Russian RD-701 dual-fuel en-
gine, were used for this analysis. The engine is fitted with a
dual position nozzle which has an extension limit such that a
maximum 2:1 increase in exit area results. The dry weight of
the vehicle is determined using the Configuration Sizing pro-
gram (CONSIZ). CONSIZ requires weight estimating rela-
tionships specific to a vehicle composition and technology
set, along with other inputs such as geometry, propellant den-
sities, and mission information, and iteratively calculates
weight and size breakdowns based on the mass ratio sup-
plied by POST.
Two sets of cost estimating relationships {CERs) were
developed for this analysis and integrated with the above de-
sign codes. The first is a set of technology cost relationships
that calculate the amount of dollar investment incurred as
the technology progresses from its initial TRL to higher TRLs.
There are nine equations, one for each technology area cor-
responding to vehicle subsystems: avionics, composite struc-
tures,electromechanicalactuation,electricalconversionanddistribution(ECD),auxiliarypropulsion(OMS/RCS),primepowersource,mainpropulsion,aluminumlithiumpropel-lanttanksandthermalprotectionsystem(TPS).Thecostofeachtechnologyissummedtodeterminethetotaltechnol-ogycost(TC).A linearrelationshipwasassumedforeachequation.ThesetechnologycostrelationshipsarebasedontheestimatesdocumentedintheATSstudy.10
A secondsetofcostrelationshipswasneedtocompletetheanalysis.Asetofvehicle-specificnonlinearCERsconsis-tentwiththeweightbreakdownstructure(WBS)usedinCONSIZwasderivedparametricallytopredictdevelopmentcostasafunctionofweight,subsystemcomplexity,andtech-nologyreadinesslevel.CERsforsubsystemsnotutilizinganadvancedtechnology,suchaslandinggear,wereincludedtoobtainatotalvehiclecost.Developmentcost(DC)isdefinedinthisanalysistobethecostofdesigninganddevelopingthevehiclehardwareunderafull-scaledevelopmentprogram.Thisdefinitionofdevelopmentcostincludesthecostelementsdirectlyrelatedtothedesignandtechnologyvariablescon-tainedinthisstudy.Costelementssuchasprogrammanage-ment,fees,reserves,softwareandotherprogrammaticcostsarenotincludedin thedesignloop.Forthepurposeofthisanalysis,theseothercostelementsareconsideredindependentof thedesigntradesoverwhichtheoptimizationoccurs.
Thefourdisciplineswereintegratedsequentiallyandcompatibilityconstraintswereusedto ensureconsistencyacrossthedisciplinarymodels.Theefficiencyandconver-gencepropertiesof thisapproachhavebeendemonstratedonasimilarproblem.6OptimizationwasperformedusingNPSOL,asequentialquadraticprogrammingalgorithmde-velopedatStanfordUniversity.15
Theproblemisformulatedasfollows:selectthetech-nologyreadinesslevels,vehicleandtrajectorydesignvari-ablesto minimizedevelopmentcostsuchthatthevehiclereachesitsorbitaldestinationsubjecttoavarietyof flightmechanicsandvehiclesystemconstraintswhileremainingwithinthetechnologycostlimit.
Withinthedesignspacedescribedabove,amajortradebeingperformedisontheallocationof afixedamountoftechnologyinvestmentdollarsamongtheninetechnologyareas.Theoptimizationprocessseekstoallocatethefixedfundinglevelin thetechnologycostequationssothattech-nologiesaresufficientlyadvancedpriortoauthoritytopro-ceed(ATP)tominimizedevelopmentcost.Thetimepro-gressionofmaturingthetechnologiesisaltered,butalltech-
nologiesultimatelyadvancetoa maturedstate.Thetech-nologiesnotadvancedatanacceleratedpaceduringthetech-nologyprogramareassumedtohavesufficienttimetoma-tureduringthedevelopmentphase.
Proposedtechnologyadvancementsnotdirectlyrelatedtospecificvehiclesubsystems,suchasaerosciencesandop-erations,areassumedindependentofdevelopmentcostandthereforenotincludedin thisanalysis.It isassumedad-vancementoftheseenablingtechnologieswouldproceedin-dependentlytomeetlifecycleobjectives.Therefore,resultsshownin thispaperdonotrepresentafull focusedtechnol-ogyprogram.
Results
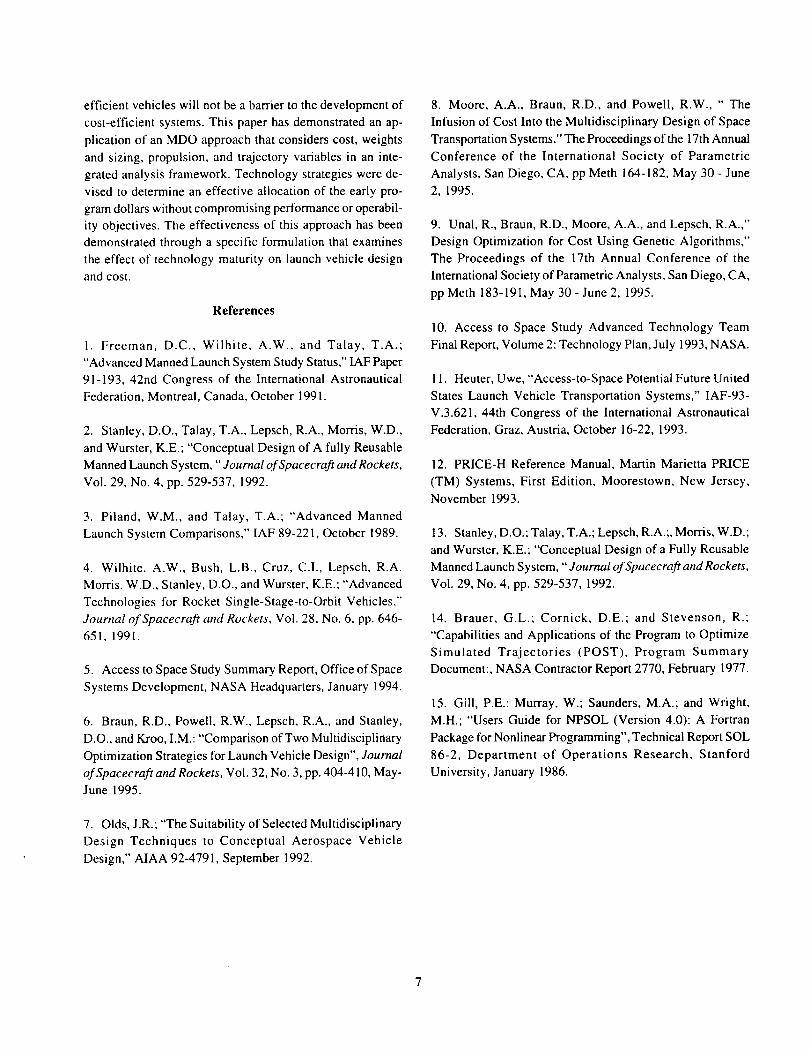
For comparison purposes, a scenario in which no tech-
nology maturity occurs prior to the authority to proceed (ATP)
to full-scale development was considered (Figure 4). In this
case, vehicle development proceeds at current TRLs for all
subsystems technologies. Since the technologies are insuffi-
ciently advanced at the start of development, maturation oc-
curs under the development program. Development costs are
at their maximum level but no technology costs are incurred.
The sum of the technology cost and development cost is de-
noted total relative cost and is used as the baseline for com-
parison (100%).
Next, the program outlined under the Access to Space
study, where all vehicle technologies are brought to TRL 6
prior to ATP is considered. This requires an up-front alloca-
tion of technology investment funding. The technology in-
vestment allocation and TRLs at ATP are shown in Figure 5.
40
35
30
Percent 25of 20
technologycost 15
10
5
0
Technology Investment Strategy
9 TRL at ATP
876
5432
10
Figure 4. No technology investment.

40 Technology Investment Strategy
30
Percent 25
of 20technology
cost 15010
_ TRL st ATP,,inu///inna0 _
e,,_,'_oo_,* . e,o.
Figure 5. ATS technology plan. All technologies matured
to TRL 6 prior to start of developmenr
The technology investment strategy is defined as the per-
centage of technology investment funds allocated to specific
subsystem technologies. The TRLs at ATP are the antici-
pated technology readiness level reached by each technol-
ogy prior to start of development based on the technology
funding allocated. The ATS technology investment strategy
results in a relative total cost of 57% of the baseline, a sig-
nificant payoff.
Bringing all technologies to a TRL 6 prior to ATP was a
groundrule of the ATS study. While desirable from a tech-
nological perspective, it is not clear that this represents an
optimum strategy based on cost. The next case considers
modifying this program constraint to observe whether fur-
ther cost improvement can be achieved. The MDO frame-
work described above was used to optimize the ATS tech-
nology funding level. This strategy is termed the optimized
ATS case and results in a total relative cost of 47% of the
baseline (Figure 6). This represents an 18% improvement
over constraining the TRLs to 6.
Two additional scenarios were examined. First, an arbi-
trary 100 million dollars was added to the technology invest-
ment funding (Figure 7). This resulted in a relative total cost
44% of the baseline, representing a 6% improvement over
the optimized Access to Space and a 23% improvement over
the groundruled ATS. These improvements include the extra
100 M added to the program.
Secondly, the technology investment was reduced by the
same amount (100M) as shown in Figure 8. In this case, a
Percento(
technologycost
4O
35
30
Technology Investment Strategy
Figure 7. Increased technology program (+ lOOM).
40 Technology Investment Strategy 40 Technology Investment Strategy
n
nPercent 25 Percent 25 I- m
of 20technology tee
cost 15 I
0 0
TRL at ATP
9
8765 _4
32I0
_,_,o,'.,,,,e._,o_._,,,_ ._ _,,o"̂ _,_',_,o_',0,_
o.,_'"0_' eoo.
TRL at ATP
Figure 6. Optimized technology program. Figure 8. Decreased technology program (-lOOM).

total relative cost of 52% over the baseline was realized. This
reduction in funding causes a cost increase of 11% over the
optimized Access to Space. However, the total cost is still
less than the case where all TRLs are brought to TRL 6 prior
to ATP (9%) even though the technology investment is re-
duced. This implies that an improvement over the groundrule
can be realized even with less up-front investment if the tech-
nology maturation strategy is optimized.
The optimization process takes into account the com-
bined effect of the investment cost of each technology matu-
ration, the relative cost contribution of the subsystem to the
total vehicle development, and the development cost sensi-
tivity to the TRL at ATP. For example, Figure 5 shows that
main propulsion is the most expensive technology to ma-
ture, taking 25% of the investment funding to advance three
levels (from TRL 3 to TRL 6). However, the main propul-
sion system is highly sensitive to changes in TRL and ac-
counts for 28% of the vehicle dry weight and 27% of the
development cost when development starts with all technolo-
gies at TRL 6. Therefore, a high investment level is main-
tained in the optimized cases, ranging from 22-28%, in order
to minimize the effects of insufficiently maturing the tech-
nology. In contrast, avionics accounts for approximately 1%
of the vehicle dry weight and 4% of the development cost at
TRL 6. The payoff in terms of the total system is less dra-
matic for a relatively high investment cost.
In addition to main propulsion, technologies are ad-
vanced beyond TRL 6 in composite structures, TPS, prime
power, ECD and RCS/OMS propulsion. There is a high pay-
off for composite structures and TPS because these two sys-
tems account for a large proportion of the vehicle costs. TPS
is an especially high-leverage area because it is relatively
No Tech. ATS Optimized Tech. Inv. Tech. Inv.Investment ATS Increase Decrease
(+lOOM) {-lOOM)
Figure 9. Relative cost summary.
inexpensive to mature. Prime power, ECD and RCS/OMS
are not high-cost contributors, but advance beyond TRL 6
because the investment cost is low compared to the relative
pay-back in terms of vehicle cost.
While some investment is made in the aluminum lithium
cryogenic tanks to advance the technology beyond the cur-
rent TRL 3, it only reaches TRL 4-5 before ATP. This result
is based on the development cost impact and does not reflect
the risk associated with reusable cryogenic tanks, an impor-tant consideration.
A summary comparison of the relative total costs of the
five strategies considered in this study is shown in Figure 9.
Limitations of the Methodology
The direct insertion of cost algorithms into the "inner
loop" of design allows for the consideration of cost in the
earliest stages of concept development where there is the most
opportunity for payoff. Efforts to expand the MDO capabil-
ity are in progress. Improved codes are needed to more real-
istically model the interactions between the design param-
eters and cost, including schedule prediction and risk assess-
ment. The present study does not capture the risk associated
with technology advancement and the resultant impact on
the vehicle design (i.e., weights, etc.), performance and cost.
Other improvements, such as life cycle cost considerations,
should be considered.
Conclusions
Based on the above analysis, it is clear that conducting
a technology maturation program prior to full-scale devel-
opment has a significant payoff. The magnitude of the pay-
off varies depending on the level of funding available for
technology investment and the strategy used to allocate the
funding to the various technology areas. With this analysis
capability, flexibility can be exerted to accommodate bud-
get or program changes without compromising system per-
formance. The analysis could be greatly enhanced by an in-
crease in the modeling capability to include risk and sched-
ule considerations.
Summary
Cost is going to have to be a design consideration for
future transportation systems. If cost can be considered dur-
ing concept development, and even earlier in technology de-
velopment, then the technologies to produce operationally-
efficientvehicleswillnotbeabarriertothedevelopmentofcost-efficientsystems.Thispaperhasdemonstratedanap-plicationof anMDOapproachthatconsiderscost,weightsandsizing,propulsion,andtrajectoryvariablesinaninte-gratedanalysisframework.Technologystrategieswerede-visedtodetermineaneffectiveallocationof theearlypro-gramdollarswithoutcompromisingpertbrmanceoroperabil-ity objectives.Theeffectivenessof thisapproachhasbeendemonstratedthroughaspecificformulationthatexaminestheeffectof technologymaturityonlaunchvehicledesignandcost.
References
1. Freeman, D.C., Wilhite, A.W., and Talay, T.A.;
"Advanced Manned Launch System Study Status," IAF Paper
91-193, 42nd Congress of the International Astronautical
Federation, Montreal, Canada, October 1991.
2. Stanley, D.O., Talay, T.A., Lepsch, R.A., Morris, W.D.,
and Wurster, K.E.; "Conceptual Design of A fully Reusable
Manned Launch System, "Journal of Spacecraft and Rockets,
Vol. 29, No. 4, pp. 529-537, 1992.
3. Piland, W.M., and Talay, T.A.; "Advanced Manned
Launch System Comparisons," IAF 89-221, October 1989.
4. Wilhite. A.W., Bush, L.B., Cruz, C.I., Lepsch, R.A.
Morris. W.D., Stanley, D.O., and Wurster, K.E.; "Advanced
Technologies for Rocket Single-Stage-to-Orbit Vehicles,"
Journal of Spacecraft and Rockets, Vol. 28, No. 6, pp. 646-
651, 1991.
5. Access to Space Study Summary Report, Office of Space
Systems Development, NASA Headquarters, January 1994.
6. Braun, R.D., Powell, R.W., Lepsch, R.A., and Stanley,
D.O., and Kroo, I.M.: "Comparison of Two Multidisciplinary
Optimization Strategies for Launch Vehicle Design", Journal
of Spacecraft and Rockets, Vol. 32, No. 3, pp. 404-410, May-June 1995.
7. Olds, J.R.; "The Suitability of Selected Multidisciplinary
Design Techniques to Conceptual Aerospace Vehicle
Design," AIAA 92-4791, September 1992.
8. Moore, A.A., Braun, R.D., and Powell, R.W., " The
Infusion of Cost Into the Multidisciplinary Design of Space
Transportation Systems," The Proceedings of the 17th Annual
Conference of the International Society of Parametric
Analysts, San Diego, CA, pp Meth 164-182, May 30 - June
2, 1995.
9. Unal, R., Braun, R.D., Moore, A.A., and Lepsch, R.A.,"
Design Optimization for Cost Using Genetic Algorithms,"
The Proceedings of the 17th Annual Conference of the
International Society of Parametric Analysts, San Diego, CA,
pp Meth 183-191, May 30 - June 2, 1995.
10. Access to Space Study Advanced Technology Team
Final Report, Volume 2: Technology Plan, July 1993, NASA.
11. Heuter, Uwe, "Access-to-Space Potential Future United
States Launch Vehicle Transportation Systems," IAF-93-
V.3.621, 44th Congress of the International Astronautical
Federation, Graz, Austria, October 16-22, 1993.
12. PRICE-H Reference Manual, Martin Marietta PRICE
(TM) Systems, First Edition, Moorestown, New Jersey,November 1993.
13. Stanley, D.O.; Talay, T.A.; Lepsch, R.A.;, Morris, W.D.;
and Wurster, K.E.; "Conceptual Design of a Fully Reusable
Manned Launch System, "Journal of Spacecraft and Rockets,
Vol. 29, No. 4, pp. 529-537, 1992.
14. Brauer, G.L.; Cornick, D.E.; and Stevenson, R.;
"Capabilities and Applications of the Program to Optimize
Simulated Trajectories (POST), Program Summary
Document:, NASA Contractor Report 2770, February 1977.
15. Gill, P.E.; Murray, W.; Saunders, M.A.; and Wright,
M.H.; "Users Guide for NPSOL (Version 4.0): A Fortran
Package for Nonlinear Programming", Technical Report SOL
86-2, Department of Operations Research, Stanford
University, January 1986.