Embed Size (px)
Citation preview
8/3/2019 AIAA 95-0797 Effect of Correlated Precision Errors on the Uncertainty of a Subsonic Venturi Calibration
http://slidepdf.com/reader/full/aiaa-95-0797-effect-of-correlated-precision-errors-on-the-uncertainty-of-a 1/12
-/" J:L~l - !L'l:::P~ - ;t-(a,~'-r
- .D ~ t.IVt.-- - r6>
~ I
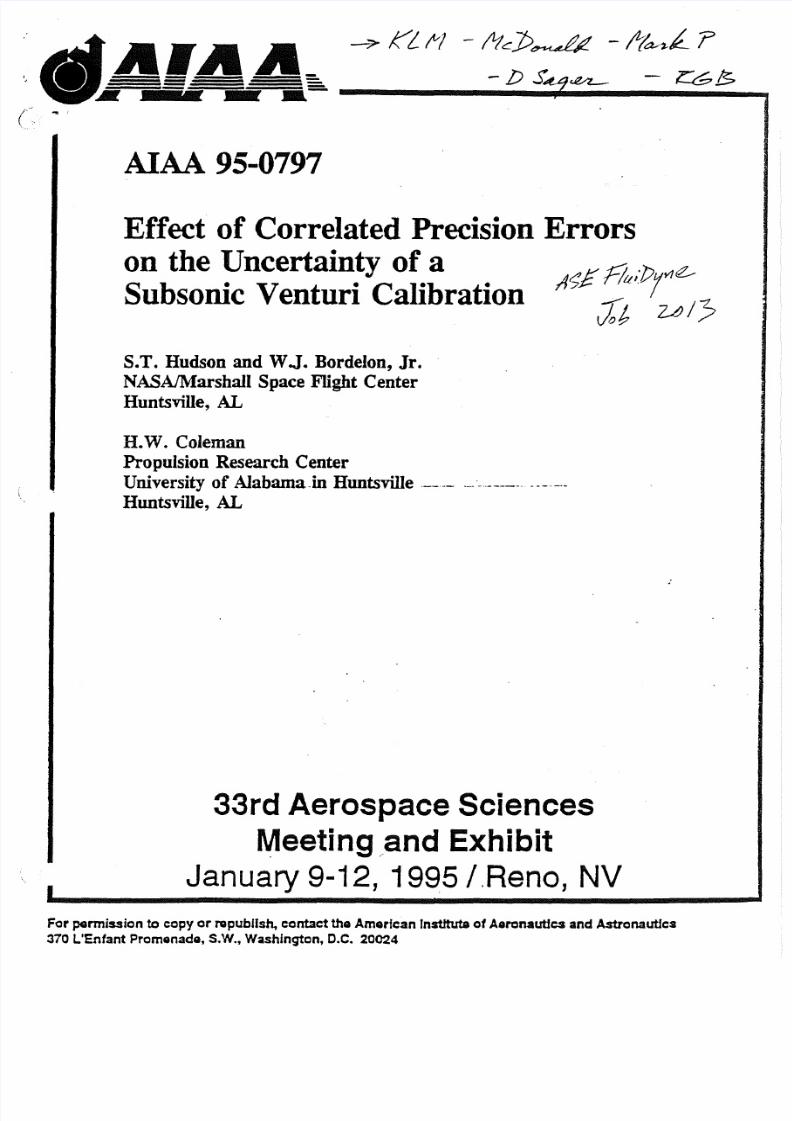
AIAA 95-0797
Effect of Correlated Precision Errorson the Uncertainty of aSubsonic Venturi Calibration
A;E R I L I : P t Y ! e , _
: £ t ~/?
S.T. Hudson and WJ.Bordelon, Jr.
NASAJMarshaII Space Flight CenterHuntsville, AL
H.W. ColemanPropulsion Research CenterUniversity of Alabama.in Huntsville .---- ---.-.--------.-._Huntsville, AL
33rd Aerospace Sciences
~eeting .andExhibit
January 9-12,1995 I.Reno, NV
For permission to copy or republish, contact the American Instftuts 01Aeronautics and Astronautics
310 L'Entant Promenade, S.W., Washington, D.C. 20024
8/3/2019 AIAA 95-0797 Effect of Correlated Precision Errors on the Uncertainty of a Subsonic Venturi Calibration
http://slidepdf.com/reader/full/aiaa-95-0797-effect-of-correlated-precision-errors-on-the-uncertainty-of-a 2/12
EFFECT OF CORRELATED PRECISION ERRORS ON THE
UNCERTAINTY OF A SUBSONIC VL"ITURI CALIBRATION
S.T. Hudson- and W.J. Bordelon. Jr."
NASA lM a rs ha ll S pac e Flight Center
Structures and Dynamics LabHuntsville. AL 35812
H.W. Coleman*
Propulsion Research Center
Mechanical and Aerospace Engineering Department
University of Alabama inHuntsville
Hun~lle. AL 35899
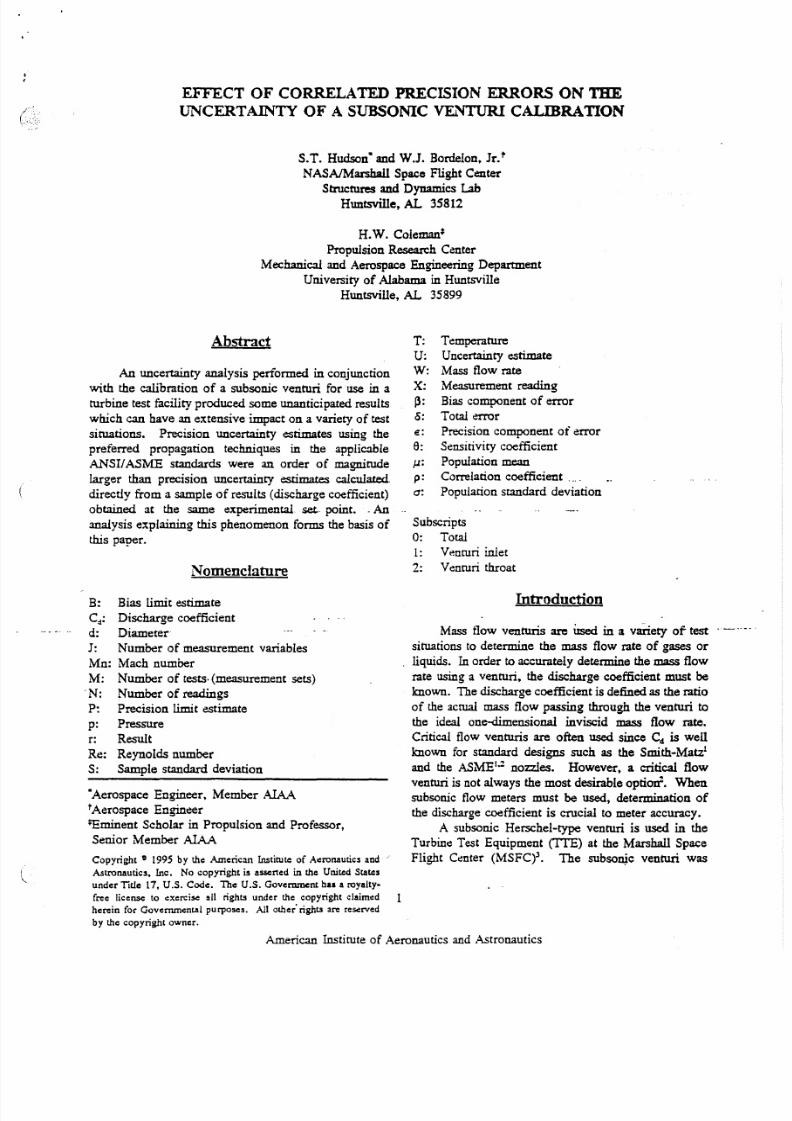
Abstract
An uncertainty analysis performed in conjunctionwith the calibration of a subsonic venturi for us e in a
turbine test facility produced some unanticipated results
which can have an extensive impact on a variety of test
siruations. Precision uncertainty estimates using the
preferred propagation techniques in the applicable
ANSI! ASME standards were an order of magnitude
larger than precision uncertainty estimates calculated
directly from a sample of results (discharge coefficient)
obtained at the same experimental set point. -An
analysis explaining this phenomenon forms the basis of
this paper.
Nomenclature
B: Bias limit estimate
C~: Discharge coefficient
d: Diameter
J: Number of measurement variables
Mn: Mach number
M: Number of tests- (measurement sets)
'N: Number of readings
P: Precision limit estimate
p: Pressure
r: Result
Re: Reynolds numberS: Sample standard deviation
"Aerospace Engineer, Member AIAA
tAerospace Engineer
*Eminent Scholar in Propulsion and Professor,
Senior Member AIAA
Copyright \I 1995 by th" American Institute of Aeronautics and /
Astronautics. Inc. No copyright is asserted in the United Sta~s
under Title 17, U.S. Code. The U.S. Government haa a royalty-
free license to exercise all rights under the copyright claimed 1herein for Governmental purposes. All other' rights are reserved
by the copyright owner.
T: Temperature
U: Uncertainty estimate
W: Mass flow rate
X: Measurement reading
~: Bias component of error
5: Total error
E: Precision component of error
6: Sensitivity coefficient
u: Population mean
p: Correlation coefficient __,
a: Population standard deviation
Subscripts
0: Total
1: Venturi inlet
2: Venturi throat
Introduction
Mass flow venturis are U s e d in a variety of test
situations to determine the mass flow rate of gases or
liquids. Inorder to accurately determine the mass flow
rate using a venturi. the discharge coefficient must be
known. The discharge coefficient is defined as the ratio
of the actual mass flow passing through the venturi to
the ideal one-dimensional inviscid mass flow rate.
Critical flow venturis are often used since Cli is well
known for standard designs such as the Smith-Matz'and the ASMEI.z nozzles. However, a critical flow
venturi is not always the most desirable optimr. When
subsonic flow meters must be used, determination of
the discharge coefficient is crucial to meter accuracy.
A subsonic Herschel-type venturi is used in the
Turbine Test Equipment (TIE) at the Marshall Space
Flight Center (MSFC)3. The subsonic venturi was
American Institute of Aeronautics and Astronautics
8/3/2019 AIAA 95-0797 Effect of Correlated Precision Errors on the Uncertainty of a Subsonic Venturi Calibration
http://slidepdf.com/reader/full/aiaa-95-0797-effect-of-correlated-precision-errors-on-the-uncertainty-of-a 3/12
chosen over a critical flow venturi to minimize flow matrix. ASE estimated a bias error and a precision
noise. The TIE is used to test liquid rocket engine error for each measurement at each test point. These
turbines in air at scaled conditions. A technology estimates were then propagated through the data
demonstrator gas generator oxidizer turbine is currently reduction equation for Cd to estimate an uncertainty in
being tested in the TIE·. The test data from this the discharge coefficient. Based on these estimates. it
technology turbine is to be used for code validation as a pp ea re d th at the calibration goal of ±0.15 % could be
well as performance evaluation; therefore, absolute achieved at Mach numbers of 0.5 and 0.7 with very
accuracy is very important. The mass flow rate careful calibration. However, the low Mach number
measurement is used to calculate the turbine efficiency (0.2) points seemed to be a problem. Large precision
and to calculate the turbine flow parameter. The goal errors were predicted at these points due to the low
of the technology turbine testing is to determine these pressure differential between the venturi inlet and throat dtwo performance parameters within ± 1s. This means at these conditions. ·Based.:O~·:past .. : ~ ~ _ p e ; t ~ · ·~ _ ~ : ' ; a ~ ;that an accuracy of ±O.S % is needed for the mass flow ~,~~W~':.~#'l~~._~!elt~~L,t1:t,~i::~~.s.,~~lli~ ..
measurement. The accuracy of the mass flow -precision With their test system. thiiii*:f:lat
measurement in the TIE depends on the accuracy of .- - was decided to proceed with the"catibfa,tio to
the venturi inlet pressure, throat pressure, and inlet determine the precision limit in the discharge coefficient
temperature measured during the test; the venturi inlet directly from the test data. Precision limits determined
and throat diameter measured during inspection; and the from the test data would then be combined with the bias
venturi discharge coefficient determined during estimates to determine an overall uncertainty for each
calibration. In order to meet the ±0.5% goal for the test point. These uncertainties would be compared withTIE mass flow measurement, the discharge coefficient the pretest predictions and calibration requirement.
from calibration needs to be determined within When the test data was obtained, two methods of
approximately ::0.15 %. estimating the precision limits in the calibration data
The TIE venturi had been calibrated, but the were used: (1) calculating the standard deviations for
more strict requirements for the technology turbine the pressure and temperature measurements and
testing prompted a review of the original calibration. propagating these through the data reduction equation
This review revealed several concerns. First, the while assuming uncorrelated precision errors; (2)
technology turbine would be operating outside of the calculating the standard deviations directly from
calibration range for the majority of the test matrix. multiple Cd results. The actual test data was used in -
Also, the uncertainty of the standard nozzle used to both cases so that a direct comparison could be made.
determine the calibration mass flow rate was ±O.S %. Method 2 gave precision limits that were an order of
This uncertainty value for the standard mass flow rate magnitude less than those predicted by method 1. The
must be combined with the uncertainty of the venturi calibration approach, calibration results, and an
measurements (inlet pressure and diameter, throat uncertainty analysis explaining the differences between
pressure and diameter, and inlet temperature) to obtain the two methods of determining the precision limits will
the uncertainty of the discharge coefficient for each be presented in this paper.
calibration test point. A curve-fit of test data must then
be used to apply the calibration; therefore, the
uncertainty of the curve-fit must be considered' to
determine the overall uncertainty in Cd' Obviously, this
discharge coefficient uncertainty would have been
greater than the required ±0.15%.
Based on the above findings, it was decided that a
new calibration of the TIE venturi was needed. The
question was whether or not the venturi could becalibrated to the required ±0.15%. A nine point test
matrix consisting of three venturi throat Mach numbers
(0.2, 0.5, and 0.7) and three venturi throat Reynolds
numbers (1, 3, and 6 million) was decided upon.
FluiDyne Aerotest Groupof Aero Systems Engineering"~\,
. (ASE). Inc.,was asked to·evatuate'the-uncertam~'m~C"":.• • ~ ''' ':''''~ __ • . •• • t-: ", •.;;.~." .. . ty - d··
_;,hat'they:ci>uld'obtaiIi 'in"'illI~ir t e s t -facility for this test~'.-.- - .. :..:--
Calibration Approach
The venturi calibration runs were conducted in a ir
in the Channel .1 .test facility at Aero Systems
Engineering' (ASE) Medicine Lake Aerodynamic
Laboratory. The calibration test runs were conducted
between January 21 and February 1, 1994. This
section describes the experimental setup, m easurem ents, ..and test procedure as well as details of the test venturi
itself. For more information, refer to the ASE
calibration report'.
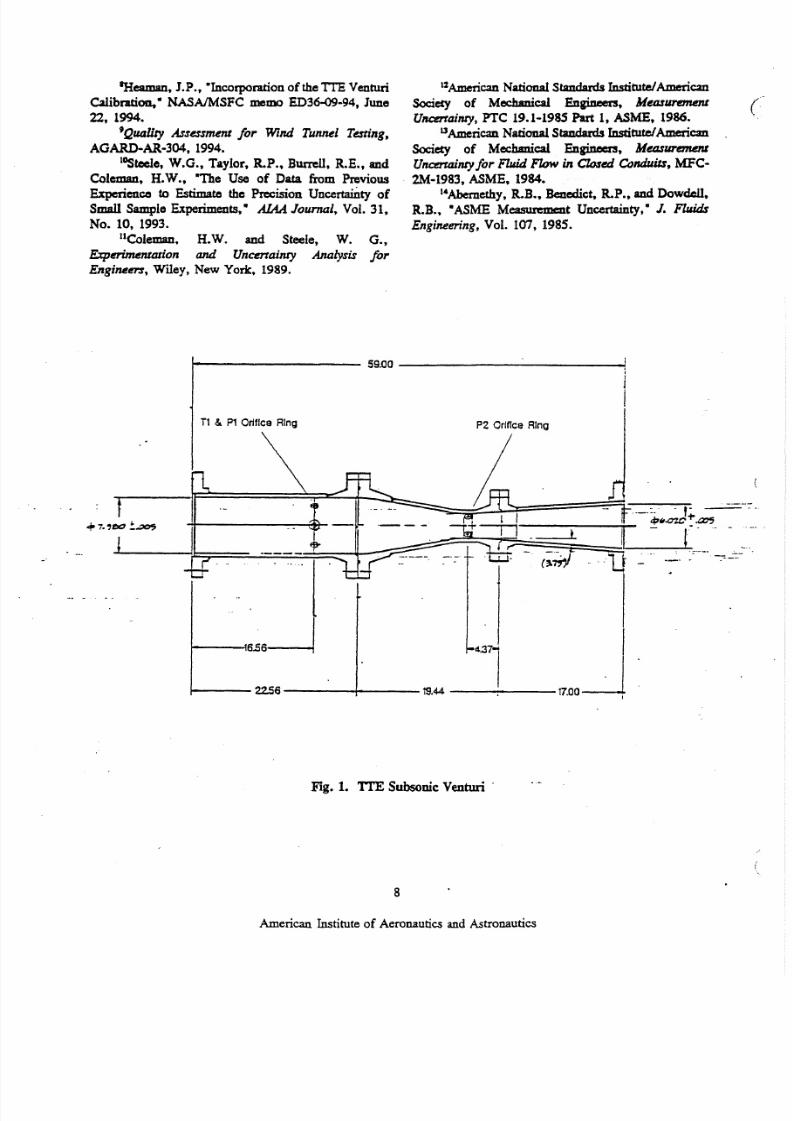
The venturi (Fig. 1) used in the MSFC TIE is a
Herschel type venturi as defined by Bean", The
nominal inlet diameter is 7.980 inches, and the nominal
2
American Institute of Aeronautics and Astronautics
8/3/2019 AIAA 95-0797 Effect of Correlated Precision Errors on the Uncertainty of a Subsonic Venturi Calibration
http://slidepdf.com/reader/full/aiaa-95-0797-effect-of-correlated-precision-errors-on-the-uncertainty-of-a 4/12
throat diameter is 3.396 inches. This venturi was sized
to operate at subsonic conditions to minimize flownoise
or pressure fluctuations caused by a normal shock. The
venturi is made of stainless steel and contains two
instrumentation planes. as shown in Fig. 1. The
venturi inlet plane contains two gas temperature probes
and four static pressure taps. The venturi throat
contains four static pressure measurements. The overall
length of the venturi is S9 inches.
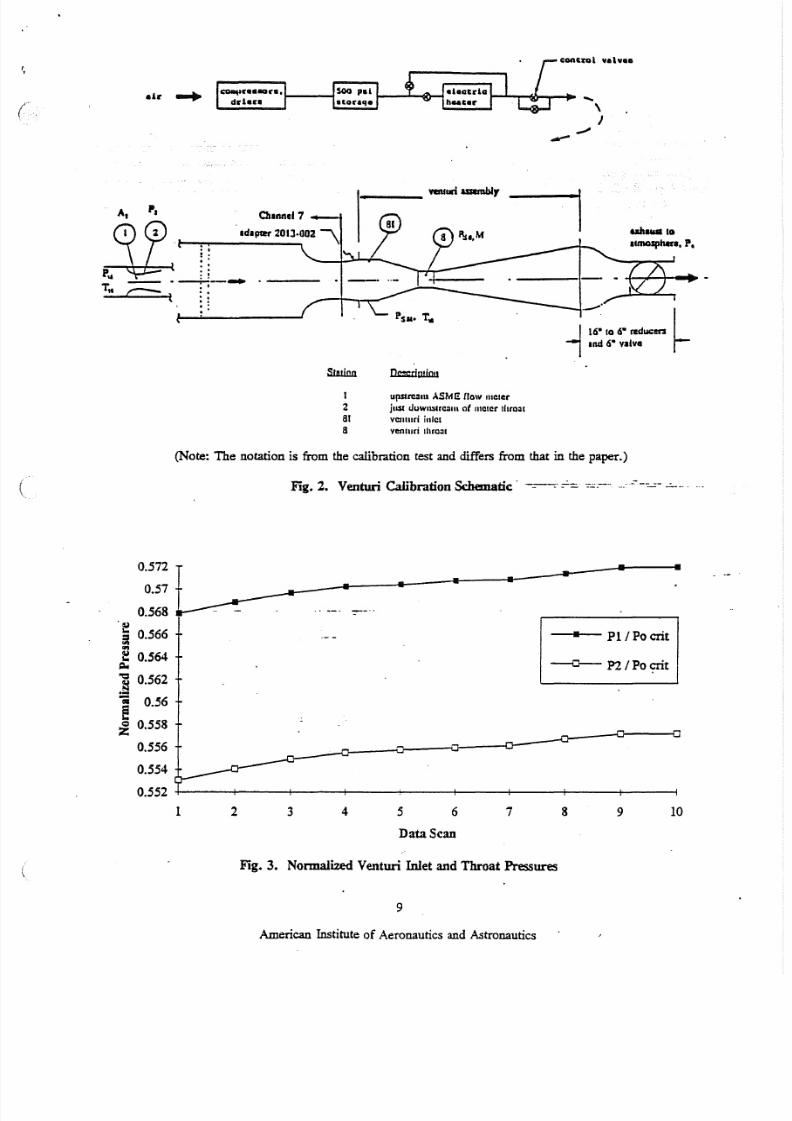
The facility used for the venturi calibration was
Channel 7 at ASE modified as shown in Fig. 2. The
facility consisted of a SOOpsi air storage source, heater,
inlet control valve, ASME metering nozzle, settling
chamber, test venturi, and back pressure control valve.
The air supply, heater, control valve, metering nozzle,
and settling chamber were part of the existing facility
setup. An adapter was fabricated to attach the venturi
to the settling chamber discharge. Downstream of the
venturi a 16 inch t06 inch reducer was made fromstandard pipe reducers to install the 6 inch back
pressure control valve. The flow was exhausted to
atmospheric conditions downstream of the back pressure
control valve. Two ASME long radius metering
nozzles were used as the calibration standards to cover
the range of calibration conditions. The ASME nozzle
nominal throat diameters were 1.47 inches and 1.7S
inches. Both nozzles were operated at choked
conditions for all test runs.
Pressure and gas temperature measurements were
recorded for both the metering nozzle (calibration
standard) and test venturi. The inlet total pressure, twoinlet gas temperatures, and a static pressure just
downstream of the throat were measured on the
metering nozzle. Measurements taken on the test
venturi included four inlet static pressures, four throat
static pressures, and two inlet. gas temperatures.
Atmospheric pressure was also measured for each run.
The pressure measurements were made with a PI'eSSUI'e
Systems Inc. (PSI) pressure scanning system. The
metering nozzle gas temperatures were measured with
shielded type J thermocouples, and the venturi gas
temperatures were measured with type K
thermocouples. The voltage outputs from the
thermocouples were measured using an electronicdigital data acquisition system.
The venturi was calibrated over the range of throat
Mach numbers and throat Reynolds numbers by setting
the metering nozzle upstream pressure (mass flow for
choke condition) with the upstream control valve and
the test venturi back pressure with the back pressure
control valve. With the metering nozzle choked. the
test mass flow and venturi Reynolds number were fixed
for a constant metering nozzle inlet total pressure and
temperature. The venturi back pressure was then
adjusted to set the venturi Mach number. All test runs
were conducted with the air at room temperature. Once
the test conditions were established, the pressure and
temperature measurements were scanned ten times with
about six seconds between each scan.
Calibration Results
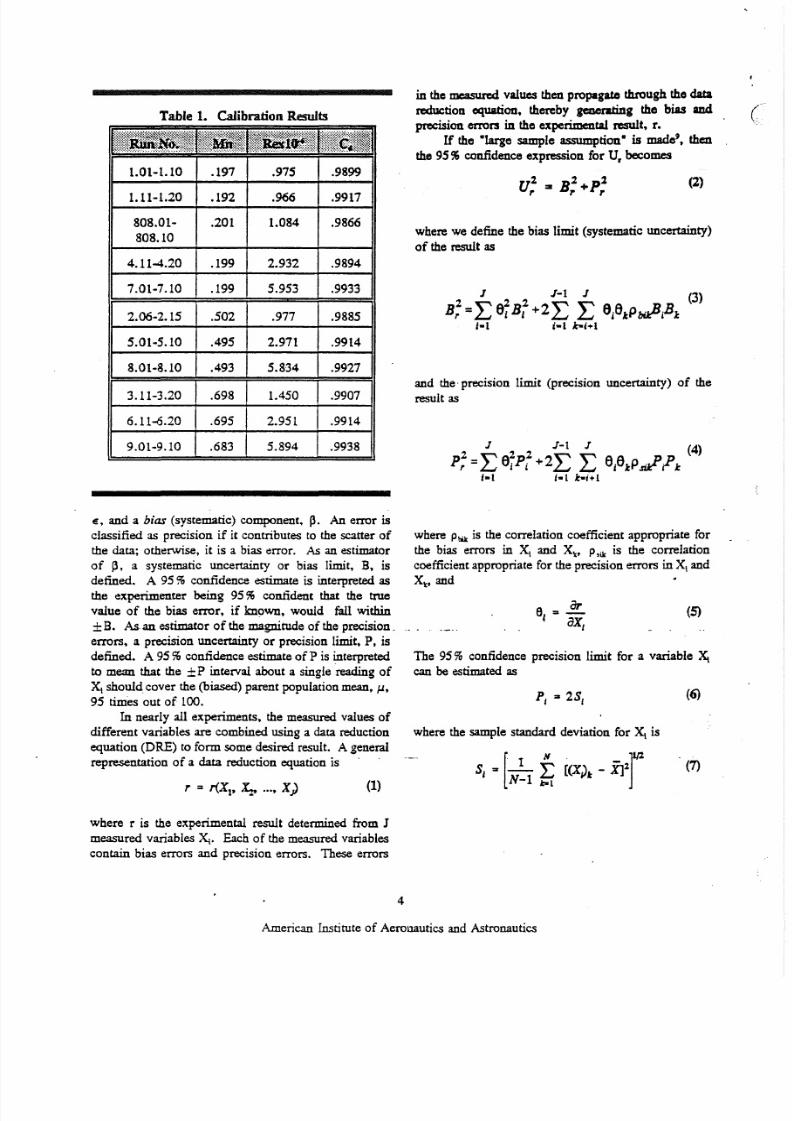
The venturi was calibrated over a nine point test
matrix. The nominal throat Mach numbers for this
matrix were 0.2. 0.5, and 0.7. The nominal throat
Reynolds numbers for this matrix were 1, 3, and 6
million. Ten data scans were taken at each set point.
The venturi pressures and temperatures were recorded
and used to calculate Mn, Re, and Cd for each scan.
The equations for these calculations are closed form and
are given in Appendix A6..7. The ten scans were then
averaged to obtain mean values of Mn, Re, and Cd '
Three runs were made (10 scans each. except run 808
which had 9 scans) for the 'worst case" data point
(Mn=0.2, Re= lxl()6). This was the point where the
uncertainty was expected to be the highest. These
repeat runs were made to provide more data for
understanding the precision behavior associated with
this point. The average values of Mn, Re, and Cd for
each run are given in Table 1. A curve fit was then
applied to this data and interpolation is used to apply
the calibration data in the TIEs. (Note: At Mn=0.7,
Rehad to be increased to 1. 5 million to achieve the testpoint.)
Uncertainty Analysis Overview
The word accuracy is generally used to indicate
the relative closeness of agreement between an
experimentally-determined value of a quantity and its .
true value. Error (0) is the difference between the
experimentally-determined value and the truth. thus as
error decreases accuracy is said to increase. Only in
rare instances is the true value of a quantity known.
Thus. one is forced to estimate error, and that estimateis called an uncertainty, U. Uncertainty estimates are
made at some confidence level. A 9S % confidence
estimate, for example. means that the true value of the
quantity is expected to be within the ±U interval aboutthe experimentally-determined value 95 times out of
100.
Total error. 5, can be considered to be composed
of two components: a precision (random) component,
American Institute of Aeronautics and Astronautics
3
8/3/2019 AIAA 95-0797 Effect of Correlated Precision Errors on the Uncertainty of a Subsonic Venturi Calibration
http://slidepdf.com/reader/full/aiaa-95-0797-effect-of-correlated-precision-errors-on-the-uncertainty-of-a 5/12
Table 1. Calibration Results
1.01-1.10 .197 .975 .9899
1.11-1.20 .192 .966 .9917
808.01- .201 1.084 .9866
808.10
4.11-4.20 .199 2.932 .9894
7.01-7.10 .199 5.953 .9933
2.06-2.15 .502 .977 .9885
5.01-5.10 .495 2.971 .9914
8.01-8.10 .493 5.834 .9927
3.11-3.20 .698 1.450 .9907
6.11~.20 .695 2.951 .9914
9.01-9.10 .683 5.894 .9938
e, and a bias (systematic) component, ~. An error is
classified as precision if it contributes to the scatter of
the data; otherwise, it is a bias error. As an estimator
of ~, a systematic uncertainty or bias limit, B, isdefined. A 95 % confidence estimate is interpreted as
the experimenter being 95% confident that the true
value of the bias error, if known. would fall within
±B. As-an estimator of the magnitude of the precision.
errors. a precision uncertainty or precision limit, P, is
defined. A 95% confidence estimate of P is interpreted
to mean that the ±P interval about a single reading of
X, should cover the (biased) parent population mean. /J.
95 times out of 100.
In nearly all experiments. the measured values of
different variables are combined using a data reduction
equation (DRE) to form some desired result. A general
representation of a data reduction equation is .
r = r( X 1• X z . . . . . X)
where r is the experimental result determined from J
measured variables X i. Each of the measured variables
contain bias errors and precision errors. These errors
( 1 )
in the measured values then propagate through tho data
reduction equation. thereby generating the bias and
p re ci si on e rr or s in the expe rimen ta l r es ult , r.
If the -large sample assumption-is made', then
th e 9S % confidence expression for U, becomes
( 2 )
where we define the bias limit (systematic uncertainty)
of the result as
and the precision limit (precision uncertainty) of the
result as
where P b i k is the correlation coefficient appropriate for
the bias errors in X i and X l<' P ,ik is the correlation
coefficient appropriate for the precision errors in XI andXtt and
(5)
The 95% confidence precision limit for a variable ~
can be estimated as
(6)
where the sample standard deviation for X i is
s , = [ _ 1 _ f [(XJt - i ] l ] l I lN-l tel
(7)
American Institute of Aeronautics and Astronautics
4
8/3/2019 AIAA 95-0797 Effect of Correlated Precision Errors on the Uncertainty of a Subsonic Venturi Calibration
http://slidepdf.com/reader/full/aiaa-95-0797-effect-of-correlated-precision-errors-on-the-uncertainty-of-a 6/12
and the mean value for XI is defined as
( 8 )
Single Test=Single Readings
The precision limits defined in Eq. (6) and used in
Eq. (4) are applicable to a single test with single
readings-that is, at a given test condition, the result is
determined once using Eq. (1). and the ~'s are
considered single measurements. This is the situation
often encountered in large scale engineering tests in
which measurements of the variables are made at a
given set point over a period that is small compared to
the periods of the factors causing variability in the
experiment. A proper precision limit (one indicative of
the dispersion of the variable over several cycles of the
factors causing its variation) cannot be calculated from
readings taken over such a small time interval. For
such data, the measurement(s) of a variable X ; should
be considered a single reading-whether the value of X ,
is the average of 10, l()l or 1()6 readings taken during
the short measurement time. In such a test, the value
for the precision limit to be associated with a single
reading would have to be based on previous information
about that measurement obtained over the appropriate
time inrerval'". If previous readings of a variable over
an appropriate interval are not available, then the
experimenter must estimate a value for Pi using the best
information available at that time9•1l
•
Multiple Tests=Single Readings
.If a test is performed so that M multiple sets of
measurements (XI' X::, ... , Xl)\: at the same test
condition are obtained. then M results can be
determined using Eq. (1), and the best estimate of the
result r would be r where
1 Mr= '"'r
M f : r .I :
( 9 )
If the M (M;::10) sets of measurements were obtained
over an appropriate time period, the precision limit that
should be associated with this averaged result would be
2S,P; =-r I M
(10)
and for a single result would be
(11)
where S, is the standard deviation of the sample of M
results
[
1M ] 1 1 2S, '" -- L (ric - ri-
M-I t o o L
(U)
Single Test-Averaged Readings
Some previous approacheslZ.IJ.14 considered the
general case to be that in which the best estimate of the
result is determined using averages of the XI so that
- - -r = r(X1• x . . : • . . . • X 1)
(13)
and specified that (for large samples) the precision
limits be taken as P/(N)'t: in Eq. (4) (with the
correlation terms neglected). The (P,.J'iPJ terms in
Eq. (4) take into account the possibility of precision
errors in different variables being correlated, and these
terms have traditionally been neglected. However.
precision errors in different variables caused by the
same uncontrolled factor(s) are certainly possible. as
shown in this paper. In such cases, one would need to
a c q u i r e sufficient data to allow a valid· statistical _. -
estimate of the correlation coefficients to be made in
Eq. (4). Note, however. that the approach using Eqs,
(10) through (12) implicitly includes the correlated erroreffect-a substantial advantage over the approach of Eq.
(13) .
Uncertainty Analvsis Results
The uncertainty analysis presented here focuses
only on precision uncertainties. Two methods were
used to evaluate the precision limit associated with the
experimental result. Cd' First. the precision limit of the
result was calculated by propagating the precision of the
averaged measured variables through the data reduction
equation as discussed in the paragraph above whileneglecting correlated precision errors (method 1).
Equations (4)-(8) and Eq. (13) were used for this
approach. Second. the precision limit of the result was
calculated directly from the sample standard deviation
of Cd for each test point (method 2). Equations (9)-
(12) and Eq. (1) were used for this approach. These
two methods will be discussed, and the results will be
American Institute of Aeronautics and Astronautics
5
8/3/2019 AIAA 95-0797 Effect of Correlated Precision Errors on the Uncertainty of a Subsonic Venturi Calibration
http://slidepdf.com/reader/full/aiaa-95-0797-effect-of-correlated-precision-errors-on-the-uncertainty-of-a 7/12
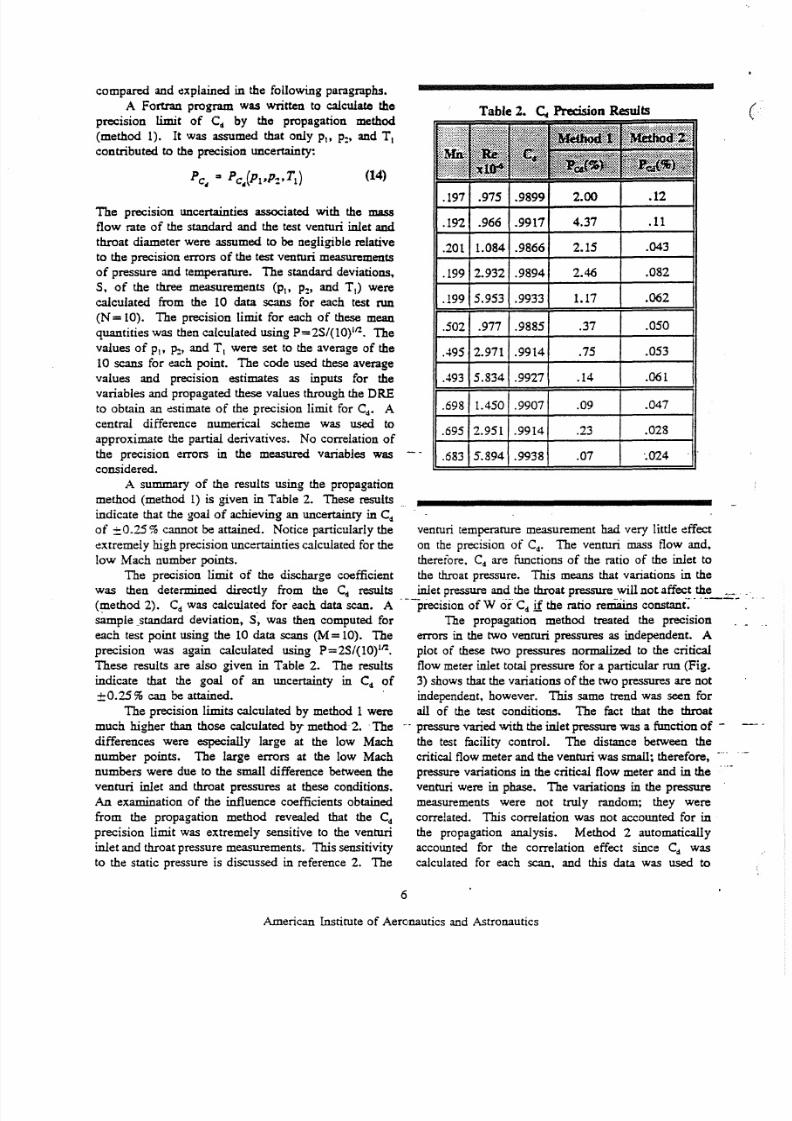
compared and explained in the following paragraphs.
A Fortran program was written to calculate the
precision limit of Crt by the propagation method
(method 1). It was assumed that only PI' P:. and T,contributed to the precision uncertainty;
(14)
Table 2. c . . Precision Results
.197 .975 .9899 2.00 .12
.192 .966 .9917 4.37 . 1 1
.201 1.084 .9866 2.15 .043
.199 2.932 .9894 2.46 .082
.199 5.953 .9933 1.17 .062
.502 .977 .9885 .37 .050
.495 2.971 .9914 .75 .053
.493 5.834 .9927 .14 .061
.698 1.450 .9907 . 0 9 .047
The precision uncertainties associated with the mass
flow rate of the standard and the test venturi inlet and
throat diameter were assumed to be negligible relative
to the precision errors of the test venturi measurements
of pressure and temperature. The standard deviations,
S, of the three measurements (PI' P:. and T,) were
calculated from the 10 data scans for each test run
(N =10). The precision limit for each of these mean
quantities was then calculated using P=2S/(10)112. The
values of PI' p:. and T Iwere set to the average of the
10 scans for each point. The code used these average
values and precision estimates as inputs for thevariables and propagated these values through the ORE
to obtain an estimate of the precision limit for Crt. A
central difference numerical scheme was used to
approximate the partial derivatives. No correlation of
the precision errors in the measured variables was
considered.
A summary of the results using the propagation
method (method 1) is given in Table 2. These results
indicate that the goal of achieving an uncertainty in Crt
of =0.25 % cannot be attained. Notice particularly the venturi temperature measurement had very little effect
extremely high precision uncertainties calculated for the on the precision of Crt. The venturi mass flow and,
low Mach number points. therefore. C, are functions of the ratio of the inlet to
The precision limit of the discharge coefficient the throat pressure. This means that variations in the
was then determined directly from the Crt results inlet pressure and the throat pressure will not affect the __
(method 2). Cd was calculated for each data scan. A '-'precision ofW o r ' Cd if the ratio remains constant:' ,----
sample _standard deviation. S. was then computed for The propagation method treated the precision
each test point using the 10 data scans (M= 10). The errors in the two venturi pressures as independent. A
precision was again calculated using P=2S/(10)112. plot of these two pressures normalized to the critical
These results are also given in Table 2. The results flow meter inlet total pressure for a particular run (Fig.
indicate that the goal of an uncertainty in Cd of 3) shows that the variations of the two pressures are not
±0.25 % can be attained. independent, however. This same trend was seen for
The precision limits calculated by method 1 were all of the test conditions. The fact that the throat
much higher than those calculated by method 2. The "pressure varied with the inlet pressure was a function of -
differences were especially large at the low Mach the test facility control. The distance between the
number points. The large errors at the low Mach critical flow meter and the venturi was small; therefore. _..numbers were due to the small difference between the pressure variations in the critical flow meter and in the
venturi inlet and throat pressures at these conditions. venturi were in phase. The variations in the pressure
An examination of the influence coefficients obtained measurements were not truly random; they were
from the propagation method revealed that the Cd correlated. This correlation was not accounted for in
precision limit was extremely sensitive to the venturi the propagation analysis. Method 2 automatically
inlet and throat pressure measurements. This sensitivity accounted for the correlation effect since Cd was
to the static pressure is discussed in reference 2. The calculated for each scan. and this data was used to
.695 2.951 .9914 .23 .028
.07 '.024683 5.894 .9938
American Institute of Aeronautics and Astronautics
6
8/3/2019 AIAA 95-0797 Effect of Correlated Precision Errors on the Uncertainty of a Subsonic Venturi Calibration
http://slidepdf.com/reader/full/aiaa-95-0797-effect-of-correlated-precision-errors-on-the-uncertainty-of-a 8/12
ISmith, R.E. and Matz, R.J.,·" A Theoretical
Method of Determining Discharge Coefficients for
Yenruris Operating at Critical Flow Conditions."
Transactions of the ASME, Journal of Basic
Engineering. December 1962.
uti, D.J.. "Theory and Experiments on
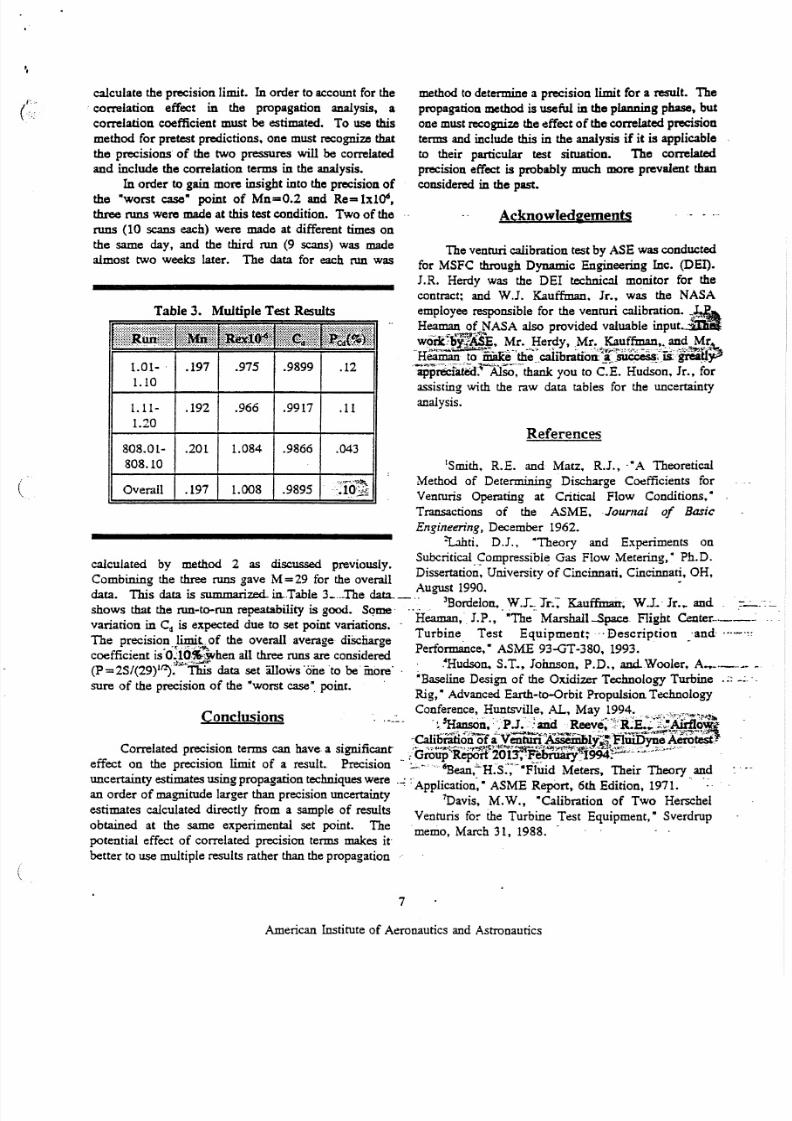
cal Ited b thod 2 eli ussed . us! Subcritical Compressible Gas Flow Metering." Ph.D.
cu a y me uu as sc previa y. D' . . _U' . . f C" . C" . OHC bini th three M 29 for th rail issertanon, ruversity o mcmnan, incmnan, ,am uung e runs gave = 10r e ove 1990 •
data. This data is summarized. . in.Table 3_ ...The d ata . - '~U~Bt rdelc Ji - . J d
sh that th t ....."'....bility i ood Soon, W.J'~. r., Kauffman~ W.L· r...anows e r un - o -r un rer--u IS g • orne' .' • .. ... . C . ted d t t . t .. . Heaman, J.P., The Marshall-Space Flight Center-.---
vananon m :I IS expec ue 0 se pom vananons.. . . .
Th.. limit f th rail di 1.;,-- Turbine Test Equipment;·· Description 'and .... _
e preclslo~.v~ .."",o e ave average lscwuge . o r . -
ffici t iO:lOtllt.·ruh al l three id red Performance, ASME 93-GT-380. 1993.coe cien IS ; j . ; z . A ! . \ . : ' ' ' en runs are COnSl e •(P=2S/(29)11l). This data set allows 'one 'to be more' ;, . ~udson,. S.T~, Johnso~: P.D., aad.Wooler, ~--.- ..
f th. . f th • ". Baseline Design of the OXIdizer Technology Turbine .:: _
sure 0 e precrsion a e worst case . point. Ri • d ed Earth 0-0 bi P ulsi T hn 1g, A vanc -t r It rop Ion ec oogy
C I' .. Conference, Huntsville. AL. May 1994 , · . '_" r· ' .one USIOns . .---_ '. 5TT --.:.: 'P J .. ' a n d ' ' . . . R ,'." 'r i ' :E . · ~ : .~ .' . : " ': ' ~ " .• ~
• _nanson. '. •• -: . eeve •. , '.A .."::·~·~.uo'1!!i
. . .. -Calilirationof'Veiituir~fDbl~;"F1~~~Correlated preciston terms can have a slgruficant_'o " '_'sR~ .·,."._,;1~10T:r.r~e.e; 'f f i~~ ';"; :"_~; ':"·-··-- . .U th .. limi f 1 n-._" -' roup "}I"H . • fiiV ......... J .. •
errect on e precision t 0 a resu t, .t:l.....ision :':'.-'.6n '~H's'·'''··F-I-w··dM te Thei Th rv an d. . . . hni .oean, .., e rs, err eo. Juncertainty es~tes using propagatxon. ~ ques ~ere ..; :Application~ • ASME Report, 6th Edition, 1971. . ':.
an order of magnitude larger than precision uncertamty 'D . M W "Calib t' f T H h I.. aVIS, . ., ....... ra Ion 0 wo ersc eesnmates calculated directly from a sample of results Y ruri C o th' T bi T t E' t "S d, .. en ns 10r e ur me es quipmen , ver rupobtained at the same experimental set point. The . M h 31 1988 .
ia l fti fled . . mak memo, arc , .poteau e ect 0 corre at precision terms es it'
better to use multiple results rather than the propagation
calculate the precision limit. In order to account for the
correlation effect in the propagation analysis, a
correlation coefficient must be estimated. To us e this
method for pretest predictions. one must recognize that
the precisions of the two pressures will be correlated
and include the correlation terms in the analysis.
In order to gain more insight into the precision ofthe "worst case" point of Mn==O.2 and Re== lxl04,
three runs were made at this test condition. Two of the
runs (10 scan s e ach ) were made at different times on
the same day, and the third ru n (9 scans) was made
almost two weeks later. The data for each run was
Table 3. Multiple Test Results
1.01- . .197 .975 .9899 .12
1.10
1.11- .192 .966 .9917 . 1 1
1.20
808.0l- .20l 1.084 .9866 . 0 4 3
808.10
·:ro~.008 .9895verall .197
method to determine a precision limit for a result. The
p ro pa ga tio n m eth od is u se fu l in th e p lan nin g p ha se. but
one must recognize the effect of the correlated precision
terms and include this in the analysis if it is applicable
to their particular test situation. The correlated
precision effect is probably much more prevalent than
considered in the past.
Aeknowled&ements
The venturi calibration test by ASE was conducted
for MSFC through Dynamic Engineering Inc. (DE!).
J.R. Herdy was the DEI technical monitor for the
contract; and W.l. Kauffman. Jr •• was the NASA
employee responsible for the venturi calibration. ~~
Heaman of NASA also provided valuable input...:miJ, ~- , ~J .- ~~~~
-~~~~~~'~}~:Ji~~~~t~,·r=~~"'f:-.",~,,-~",,;;-. ~" - " . - - _ - . " • ~ - .. - ~ •
appreciated: Also, thank you to C.E. Hudson. Jr., forassisting with the raw data tables for the uncertainty
analysis .
References
American Institute of Aeronautics and Astronautics
7
8/3/2019 AIAA 95-0797 Effect of Correlated Precision Errors on the Uncertainty of a Subsonic Venturi Calibration
http://slidepdf.com/reader/full/aiaa-95-0797-effect-of-correlated-precision-errors-on-the-uncertainty-of-a 9/12
'Heaman, ].P., "lncorporation of the TIE Venturi
CalibratiOD,· NASAlMSFC memo ED36-09-94, June
22, 1994.
9Q ua llty A ssessm ent for Wind T un ne l T es tin g,
AGARD-AR-304, 1994.
u'Steele, W.G., Taylor, R.P., Burrell, R.E., and
Coleman, H.W., "The Use of Data from Previous
Experienco to Estimate the Precision Uncertainty of
Small Sample E xp erim en ts, - A L 4 A Journal, Vol. 31,
No. 10, 1993.IlColeman, H.W. and Steele, W. G.,
ExperimDua tion and Uncerta in ty Ana lysis for
Engineers , Wiley, New York, 1989.
IlAmerican Natioual Standards Institute! American
Society of Mechanical Engineers. Me4furement
Uncmainty , PrC 19.1-1985 Par t I, ASME, 1986.
1 3American Natioual Standards Institute! American
Society of Mechanical Engineers, Me4furement
Unc er ta in ty fo r FUd d Flow in Closttd Conduits, MFC-
2M-1983, ASME, 1984.
14Abernethy, R.B., Benedict, R.P., and Dowdell,
R.B. , ·ASME Measurement Uncertainty: J. Fluids
Engineering. Vol. 107, 1985.
~ - - - - - - - - - - - - - - - - - - - - - - - - - - - - - - - - - -9 D O - - - - - - - - - - - - - - - - - - - - - - - - - - - - - - - - - - - - ~
T1 a . P1 On tlc e RIng
t
1----------- 22.56 -------t-----
-" -r _--_ _ _ _ _ - - ; ; . _ " _ - * " . . : n o - : .a:"7
I I 1
FIg. 1. TIE SubsonicVenturi "
8
American Institute of Aeronautics and Astronautics
8/3/2019 AIAA 95-0797 Effect of Correlated Precision Errors on the Uncertainty of a Subsonic Venturi Calibration
http://slidepdf.com/reader/full/aiaa-95-0797-effect-of-correlated-precision-errors-on-the-uncertainty-of-a 10/12
C:Oftt~l vAlv ••
-\J
Chlnnel7 _
Idlpa!t 2013.002 '\ uJwua 10
1
2
81
8
Upstro:1II1 ASMI! flow IIIcter
jlw dUwll~trCllIll of m ot cr I hro ~1
v Cl ll ur i i nl ct
v en tu ri I hr o~ 1
(Note: The notation is from the calibration test and differs from tha t in the paper.)
Fig.2. Venturi Calibration Schematic -_- .. = = - = 7:':.-- -:...:"_-:_:_..:......
0. .572
0.57
0.. 568
ei 0.. 566O PI
e 0 • .564~
- = 0 • .562. §!. .56
~ 0.. 558
0 . .5 .56
0• .5 .54
0.552 +----+-----+-----+----+----t---+---+---+----i
--a- P2 f Po crit
• PI fP o crit
1 2 3 4 5 6 7 8 9 10
D ata S can
Fig. 3. Normalized Venturi Inlet and Throat Pressures
9
American Institute of Aeronautics and Astronautics
8/3/2019 AIAA 95-0797 Effect of Correlated Precision Errors on the Uncertainty of a Subsonic Venturi Calibration
http://slidepdf.com/reader/full/aiaa-95-0797-effect-of-correlated-precision-errors-on-the-uncertainty-of-a 11/12
Appendix A
,
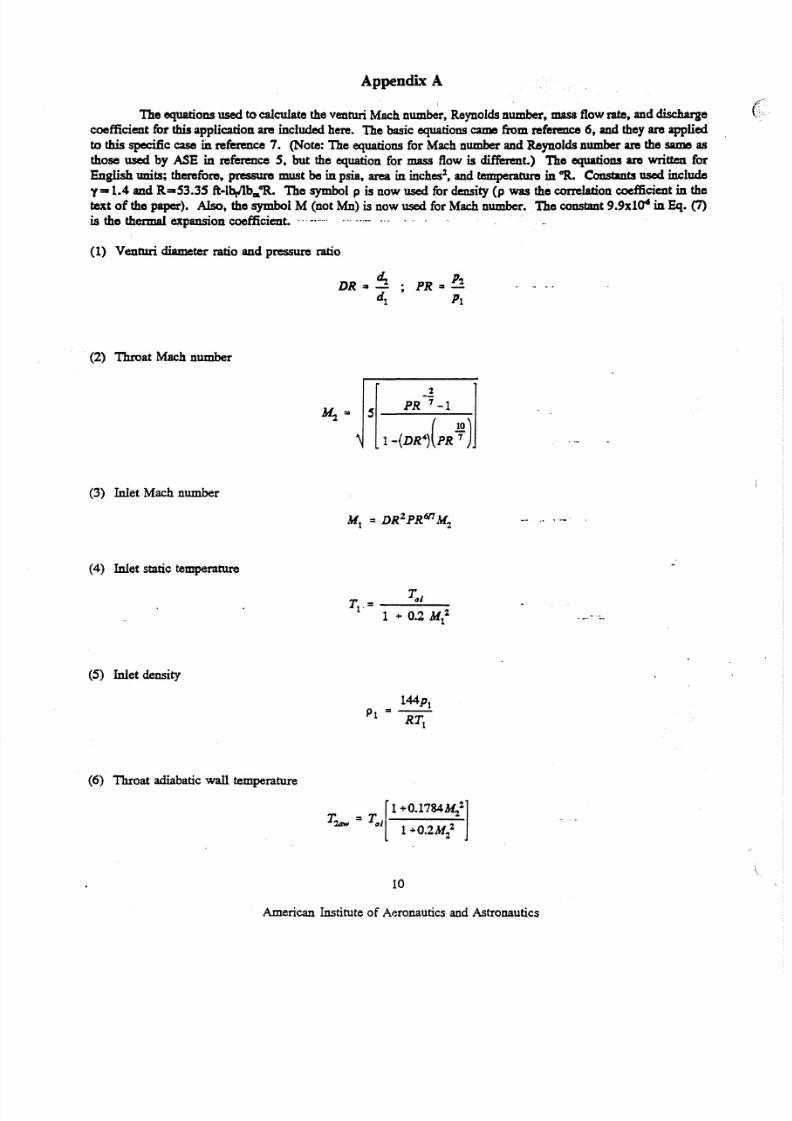
The equat io ns used to calculate the venturi M ach num ber, R eynolds num ber, m ass flow rate, and di.scharge
coefficient for this application are included here. The basic equations cam e from ref'ere:ace 6 , and th ey a re a pp lie d
to this s pe cif ic c as e in reference 7. (Note: The equations for M ach num ber and Reynolds number are the same as
those used by ASE in reference 5 . but the equation for mass flow is different.) The equations are written for
English units; therefore. pressure m ust be in psia, area in i nc he s:, a nd t emper atu re in o a . Coasants used include
y-1. 4 and R"" ,5 3 .3 5 f t- lb r1 lb . .o a . T he sym bol p is now used for density (p was th e cor re la tio n coe ff ic ie nt in th etext o f th e p ap er). Also, the symbol M (not Mn) is now used for M ach num ber. The constant 9.9xl04 in Eq. (7)
is the thermal expansion coefficient. .. -- ... .. - .. . -.- .. . . . .
(1) Venturi diameter ratio and pressure ratio
PR '" P1.
Pl
(2) Throat Mac h n um be r
(3) Inlet Mach number
(4) Inlet static temperature
(5) Inlet density
(6) Throat adiabatic wall temperature
[
1 +O.1784MijT .. =T
: . n o . II I 1+ O . 2 M 1 .2
10
American Institute of Aeronautics and Astronautics
8/3/2019 AIAA 95-0797 Effect of Correlated Precision Errors on the Uncertainty of a Subsonic Venturi Calibration
http://slidepdf.com/reader/full/aiaa-95-0797-effect-of-correlated-precision-errors-on-the-uncertainty-of-a 12/12
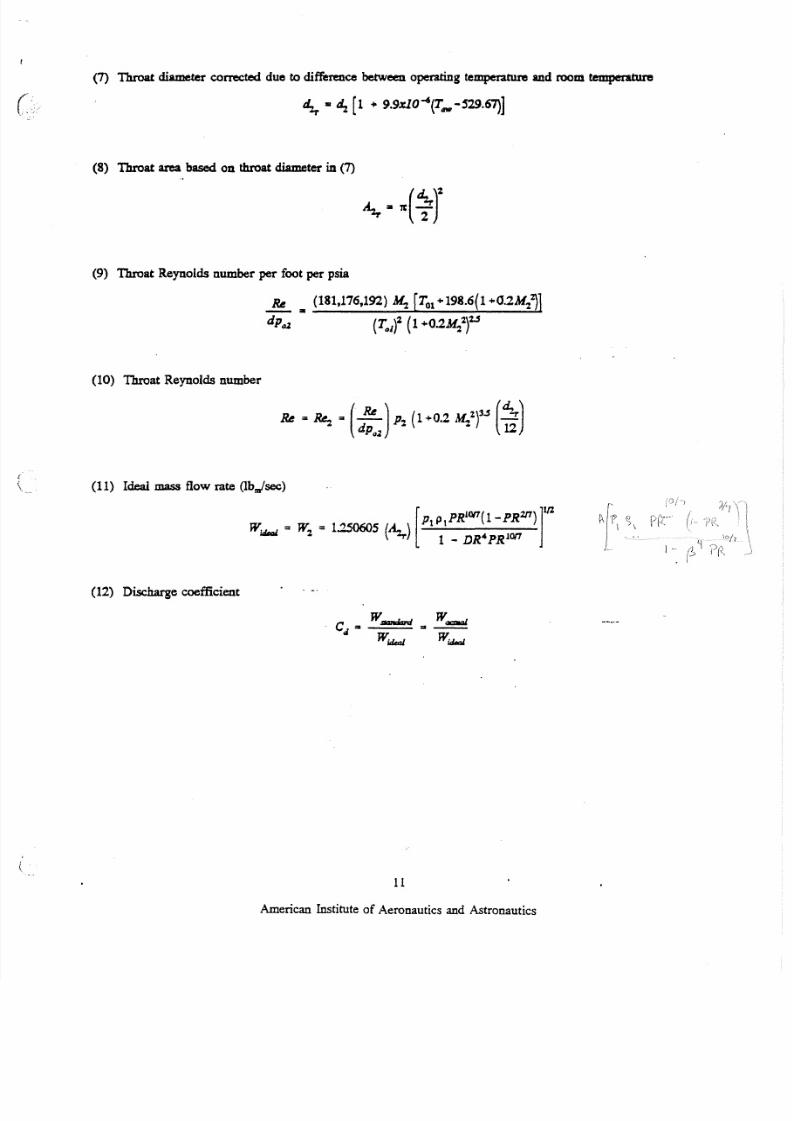
(7) Throat diameter corrected due to difference between operating temperature and room temperature
4,•~ [ 1 + 9.9xlO~{T_ -S29.67)]
(8) Throat area based on throat diameter in (7)
(9) Throat Reynolds number per foot per psia
94 '" (181.176.192) M: [ T O l +198.6(1 +O.2M%~l
dpDJ (Tal' (1 +O.2M:~%.j
(10) Throat Reynolds number
(11) Ideal mass flow rate (lb,jsec)
[ p P R I 0 1 7 ( I _ P R 2 I 7 ) ] l f lW. = w : = 1.250605 ( A _ ) . . ; _ t : . . ; _ P . . : , . . l _ _ , ; .
i t iM K 1 - - z r 1 _ D R 4 P R 1 0 1 7P l M . -.I?L \ \
(12) Discharge coefficient
11
American Institute of Aeronautics and Astronautics
)-