Embed Size (px)
Citation preview

AIAA-2017-3399
1 © Analytical Mechanics Associates, Inc., published by American Institute of Aeronautics and Astronautics with permission.
Prediction of Sparrow Missile Aerodynamic Characteristics with a Non-Linear Engineering-Level Missile Prediction Method
Daniel J. Lesieutre*
Analytical Mechanics Associates, Inc. Nielsen Engineering and Research Division
Santa Clara, CA 95050 USA An engineering-level aerodynamic prediction code was applied to the analysis of the Sparrow wing- and tail-control missile configurations. The equivalent angle of attack methodology employed by the MISL3 prediction method is reviewed, and nonlinear effects of Mach number, high angles of attack, coupled fin deflections, and body-shed and fin vorticity are accounted for in the analysis and investigated. The method is used to generate an aerodynamic database over the flight Mach number range of 0.8 to 4.6, angles of attack from 0° to 48°, and fin deflection angles from -20° to +20°. These results are compared to the published database. The prediction method is compared to experimental data for several interesting nonlinear cases. The loss of roll control authority with combined pitch and roll deflections is investigated for the wing-control Sparrow at transonic speeds.
Nomenclature A maximum body crossectional area a body radius AR fin aspect ratio, two fins joined at root CA axial force/q∞SREF CBM fin bending moment CHM fin hinge moment Cl rolling moment/q∞SREFLREF Cm pitching moment/q∞SREFLREF CN normal force/q∞SREF CNF fin normal force CNW wing-alone normal force cR fin root chord cmac mean aerodynamic chord D body diameter, maximum L body length LREF reference length M∞ Mach number q∞ dynamic pressure sm fin semispan from body centerline SREF reference area SW area of two wing panels
xCP center of pressure xMC moment center α angle of attack, deg αc included angle of attack, deg αeq equivalent angle of attack β sideslip angle, deg δ fin deflection angle, deg δP pitch fin deflection angle, deg δa roll deflection angle, deg λ fin taper ratio λADJ, λOPP M∞ dependent fin-on-fin interference parameters φ roll angle, deg Subscripts: T tail fin W wing fin 0 corresponds to database geometry, a/sm = ½ 1 corresponds to configuration a/sm, δ = 0° 2 corresponds to configuration a/sm, δ ≠ 0° Superscripts: ^ indicates ‘vortex free’ αeq
I. Introduction his paper discusses the methodology and capabilities of the MISL3 engineering-level aerodynamics prediction method to predict highly nonlinear problems encountered in missile flight. Specifically, this paper investigates the aerodynamic
characteristics of wing- and tail-control Sparrow missiles having a mid-body cruciform wing section and a cruciform tail section. The MISL3 code is an engineering-level code based on extensive fin-on-body data, the equivalent angle-of-attack methodology, and includes extensive vortex modeling. MISL3 can be used to model conventional circular cross section missiles with up to three fin sets. The equivalent angle of attack, αeq, method is presented through the specific application to the Sparrow configuration to illustrate the richness of the methodology’s ability to provide insights into nonlinear missile aerodynamics. The ability of the method to efficiently and accurately generate aerodynamic databases for flight simulations is demonstrated. Comparisons to experimental wind tunnel data for both wing-control and tail-control versions of the Sparrow are included.
* Senior Research Engineer, 900 Lafayette Street, Suite 600, Santa Clara, CA 95050, Senior Member.
T

AIAA-2017-3399
2 © Analytical Mechanics Associates, Inc., published by American Institute of Aeronautics and Astronautics with permission.
II. Technical Description
A. Overview of MISL3 Methodology The engineering-level missile aerodynamic prediction
code MISL3 (Refs 1-7) has been developed for aerodynamic performance prediction and for preliminary design of conventional missiles. The method uses the Triservice systematic fin-on-body force and moment data base (Refs 8 and 9). The prediction methodology employed covers a Mach number range from 0.5 to 5.0, fin aspect ratios from 0.25 to 10.0, angles of attack to ±90°, arbitrary roll angles, and deflection angles from -40° to 40°. The method uses the equivalent angle of attack concept which includes the effects of vorticity and geometric scaling. The MISL3 program has been developed by extending the methodology to model conical changes in body diameter (flares, boattails) and to allow arbitrary interdigitation angles between fin sets. In combination with the roll rate capability of the code, the performance of configurations with rolling fin sets can be estimated. References 1, 5, and 7 provide more details regarding the methodology employed by MISL3 and present comparisons to experimental data for a wide variety of configurations. Fig. 1 depicts the fin and body vortex modeling for a canard-tail configuration.
B. MISL3 Equivalent Angle of Attack Methodology The equivalent angle of attack methodology (Refs 7, 10-12) used in MISL3 for the prediction of fin loads for geometries and vortex flow fields different from those of the underlying Triservice fin-on-body database is reviewed because of nonlinear effects of scaling for larger fin span to body radius ratios. In addition, fin-on-fin interference factors for fin deflection effects are reviewed because of their importance for the large wings on the Sparrow. These factors are important to the prediction of rolling moments which are the sum of moments generated on each fin of the configuration; eight fins for the Sparrow missile. The αeq methodology relating the fin-on-body fin normal force to the wing-alone normal force is depicted in Figure 2. Steps in this calculation procedure are discussed through an investigation of the Sparrow tail fin loads.
(1) Determine database value corresponding to a/sm = ½
(2) Subtract database vorticity (wind tunnel)
(3) Scale to correct a/sm
(4) Add effects of nonuniform flow field
(5) Add effects of rotational rates
(6) Add actual vorticity
(7) Add effects of fin deflections
To illustrate the αeq methodology, the specific fins of the Sparrow are used. The Sparrow missile is depicted in Figure 3, and Refs. 13 and 14 describe Sparrow wind tunnel data used in this paper. Additional Sparrow wind tunnel data are described in Refs. 15 and 16.
Figure 2. Sketch of equivalent angle of attack methodology.
Figure 1. MISL3 vortex modeling.

AIAA-2017-3399
3 © Analytical Mechanics Associates, Inc., published by American Institute of Aeronautics and Astronautics with permission.
Figure 3. Sparrow missile geometry
The first step in the αeq procedure is to determine the fin load for fin planform geometry of the wind tunnel conditions of the Triservice tests. The Triservice fins are shown in Figure 4; all fins have a body-to-fin semispan ratio a/sm, = ½ (Refs. 8,9).
Figure 4. Triservice fin data base.
The Sparrow tail fin is used in this example to compare to experimental fin load data from Ref. 14. The fin aspect ratio, AR, is 2.58, and the taper ratio, λ, is 0. Fin data are published for M∞ = 1.60 and 2.20. Fig. 5 depicts the interpolated fin-on-body CNF for the tail fin planform (AR, λ) for the Triservice conditions: a/sm = ½ and axial fin position corresponding to tunnel configuration. In this example, only the CNF curve for the horizontal fin position is shown; there are corresponding curves for each fin that depends on its circumferential location relative to the leeward meridian. The interpolated wing-alone CNW curves for the planform geometry of the tail fin (AR, λ) are shown in Fig. 6. Note that the wing-alone configuration corresponds to an a/sm = 0 (no body). Nonlinear angle of attack and Mach number effects are present in these figures.
Figure 5. Sparrow tail fin CNF for a/sm = ½. Figure 6. Sparrow tail fin wing-alone CNW.

AIAA-2017-3399
4 © Analytical Mechanics Associates, Inc., published by American Institute of Aeronautics and Astronautics with permission.
For the flight angle of attack, αc, CNF0(a/sm = ½) is determined from the CNF curve and used to enter the wing-alone curve to obtain αeq0. This is depicted in Figs. 5 and 6. From the αeq0 point, theoretical increments to αeq are computed to 1) subtract vortex effects present in the wind tunnel configuration, 2) to scale body upwash effects for fins with a/sm,≠ ½, 3) to add in vorticity present for the actual configuration including upstream body- and fin-shed vorticity, and 4) to add deflection effects including fin-fin interference. The a/sm = ½ geometry with the forebody vortex model of Ref. 17 is shown in Fig. 7. The symbols representing the vortices are scaled by vortex strength. The model is used to determine the strength and location at the fin leading edge. The reverse flow theory of Ref. 12 is used estimate the Δαeq due to the vorticity. This increment, which could be positive or negative, is subtracted from αeq0 resulting in 𝛼𝛼�𝑒𝑒𝑒𝑒0 where the ^ indicates the absence of vortex effects.
Figure 7. Forebody vortex model used to compute Δαeq: model of conditions in the Triservice wind tunnel tests.
The next step is to scale αeq to the a/sm of the actual configuration. This step accounts for the body upwash field effect on the fin. Crossflow potential theory for a doublet predicts the upwash to be 2sinαc at the root of the horizontal fin, and this decays with the inverse of the distance squared. A smaller span fin is immersed in a stronger velocity field. Fig. 8 depicts the upwash field with the Triservice a/sm = ½ fin and for the Sparrow tail fin, a/sm = ¼ shown for comparison.
Figure 8. Upwash flowfield imposed on database a/sm = ½ fin and Sparrow a/sm = ¼ tail fin.
If it is assumed that Kw, the Beskin upwash factor, is given by 𝐾𝐾𝑊𝑊 = 𝑡𝑡𝑡𝑡𝑡𝑡𝛼𝛼�𝑒𝑒𝑒𝑒0
𝑡𝑡𝑡𝑡𝑡𝑡𝛼𝛼𝑐𝑐𝑐𝑐𝑐𝑐𝑐𝑐𝑐𝑐 (1)
and that Kw is linear with respect to a/sm as predicted by slender body theory, then the scaling with a/sm is given by 𝑡𝑡𝑡𝑡𝑡𝑡𝛼𝛼�𝑒𝑒𝑒𝑒1 = 2 𝑡𝑡
𝑐𝑐𝑚𝑚𝑡𝑡𝑡𝑡𝑡𝑡𝛼𝛼�𝑒𝑒𝑒𝑒0 − �2 𝑡𝑡
𝑐𝑐𝑚𝑚− 1� 𝑡𝑡𝑡𝑡𝑡𝑡𝛼𝛼𝑐𝑐𝑐𝑐𝑐𝑐𝑐𝑐𝑐𝑐 (2)
AIAA-2017-3399
5 © Analytical Mechanics Associates, Inc., published by American Institute of Aeronautics and Astronautics with permission.
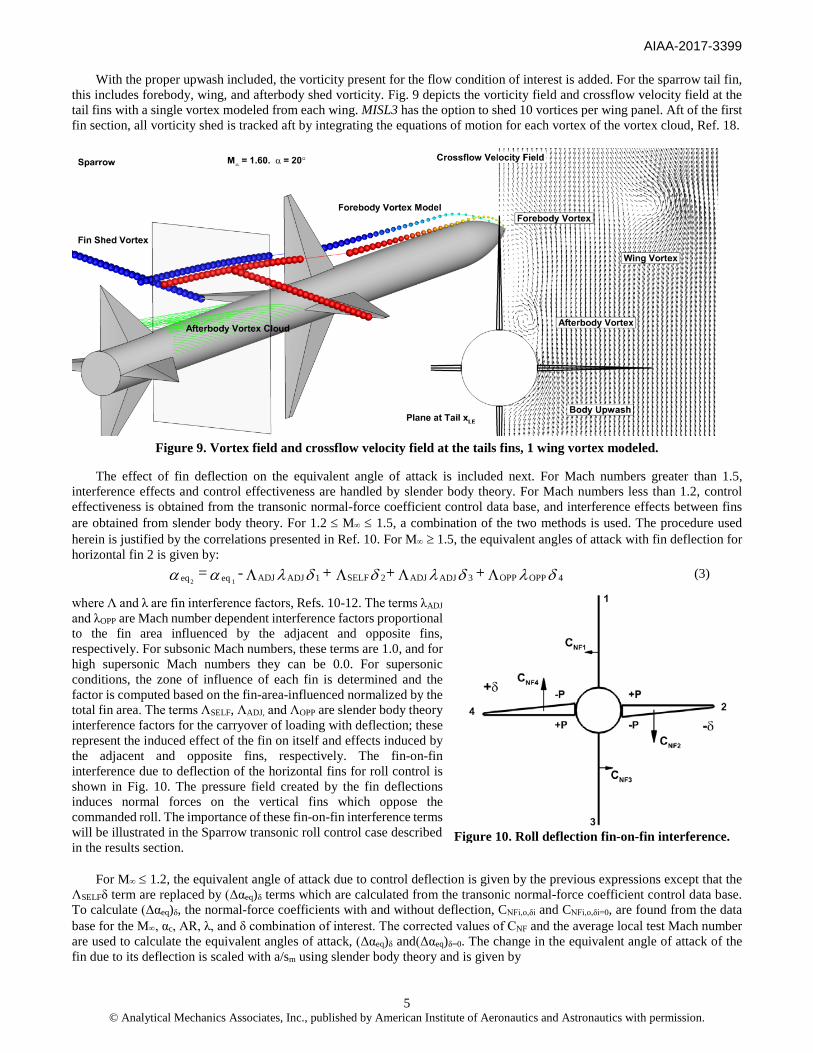
With the proper upwash included, the vorticity present for the flow condition of interest is added. For the sparrow tail fin, this includes forebody, wing, and afterbody shed vorticity. Fig. 9 depicts the vorticity field and crossflow velocity field at the tail fins with a single vortex modeled from each wing. MISL3 has the option to shed 10 vortices per wing panel. Aft of the first fin section, all vorticity shed is tracked aft by integrating the equations of motion for each vortex of the vortex cloud, Ref. 18.
Figure 9. Vortex field and crossflow velocity field at the tails fins, 1 wing vortex modeled.
The effect of fin deflection on the equivalent angle of attack is included next. For Mach numbers greater than 1.5, interference effects and control effectiveness are handled by slender body theory. For Mach numbers less than 1.2, control effectiveness is obtained from the transonic normal-force coefficient control data base, and interference effects between fins are obtained from slender body theory. For 1.2 ≤ M∞ ≤ 1.5, a combination of the two methods is used. The procedure used herein is justified by the correlations presented in Ref. 10. For M∞ ≥ 1.5, the equivalent angles of attack with fin deflection for horizontal fin 2 is given by: δλδλδδλαα 4OPPOPP3ADJADJ2SELF1ADJADJeqeq + + + - =
1 2 ΛΛΛΛ (3)
where Λ and λ are fin interference factors, Refs. 10-12. The terms λADJ and λOPP are Mach number dependent interference factors proportional to the fin area influenced by the adjacent and opposite fins, respectively. For subsonic Mach numbers, these terms are 1.0, and for high supersonic Mach numbers they can be 0.0. For supersonic conditions, the zone of influence of each fin is determined and the factor is computed based on the fin-area-influenced normalized by the total fin area. The terms ΛSELF, ΛADJ, and ΛOPP are slender body theory interference factors for the carryover of loading with deflection; these represent the induced effect of the fin on itself and effects induced by the adjacent and opposite fins, respectively. The fin-on-fin interference due to deflection of the horizontal fins for roll control is shown in Fig. 10. The pressure field created by the fin deflections induces normal forces on the vertical fins which oppose the commanded roll. The importance of these fin-on-fin interference terms will be illustrated in the Sparrow transonic roll control case described in the results section. For M∞ ≤ 1.2, the equivalent angle of attack due to control deflection is given by the previous expressions except that the ΛSELFδ term are replaced by (Δαeq)δ terms which are calculated from the transonic normal-force coefficient control data base. To calculate (Δαeq)δ, the normal-force coefficients with and without deflection, CNFi,o,δi and CNFi,o,δi=0, are found from the data base for the M∞, αc, AR, λ, and δ combination of interest. The corrected values of CNF and the average local test Mach number are used to calculate the equivalent angles of attack, (Δαeq)δ and(Δαeq)δ=0. The change in the equivalent angle of attack of the fin due to its deflection is scaled with a/sm using slender body theory and is given by
Figure 10. Roll deflection fin-on-fin interference.

AIAA-2017-3399
6 © Analytical Mechanics Associates, Inc., published by American Institute of Aeronautics and Astronautics with permission.
) = s(a/
)s(a/ ) - ( = 2
1mSELF
mSELFeqeqeq 0= Λ
Λ∆ ααα δδδ (4)
Fig. 11 depicts the αeq calculation procedure as a function of αc for the Sparrow tail fin. This figure illustrates the relative magnitudes of these terms within the αeq calculation over the whole angle of attack range. The arrows in the graphs indicate the direction of the change for this example. These are steps (2), (3), (6), and (7) shown in Fig. 2. Note that the subscripted “H” in the αeq variables in the graph represents the overstuck ^ symbol used paper text. These terms correspond to ‘vortex-free’ values. The left graph contains the a/sm = ½ geometry of the Triservice database and shows the effect of removing the forebody vorticity (see Fig. 7). This effect can be more dramatic for non-zero roll angle cases where the fin is immersed in the forebody vortex. The center-left graph shows the effect of scaling αeq to account for the upwash effect between the database a/sm = ½ and the Sparrow tail value of a/sm = ¼ (see Fig. 8, Eqn. 2). The larger span fin sees a reduction in the upwash effect on αeq. The right-center graph shows the effect of including the forebody, wing, and afterbody vortex field effects on the tails (see Fig. 9). This is a strong vortex field and creates a significant downwash at the fin. Finally, the right graph depicts the deflection effect for δ = ± 20° which includes fin-on-fin interference effects due to the deflection of fins (Eqn. 3).
Figure 11. αeq calculation procedure as a function of αc for the Sparrow tail fin.
The fin normal force coefficients, CNF, corresponding to the αeq terms described in Fig. 11 are shown in Fig. 12 along with experimental values from Ref. 14. The black, red, and orange curves are the final predictions for 0°, +20°, and -20° deflection, respectively. The intermediate steps (green, blue, and purple) are necessary to get the correct fin load. The ability of the methodology to predict the fin load is evident.
Figure 12. Predicted Sparrow tail fin loads.

AIAA-2017-3399
7 © Analytical Mechanics Associates, Inc., published by American Institute of Aeronautics and Astronautics with permission.
III. Results The following results compare MISL3 predicted aerodynamic characteristics with data published in the literature. Ref. 14 includes results for the tail-control Sparrow including fin forces and moments, and Ref. 13 contains a complete pitch plane aerodynamic database for the wing-control Sparrow covering the Mach number range from 0.8 to 4.60 for ϕ = 0° and ϕ = -45° roll orientations. In addition, Ref. 13 includes transonic data that indicate a loss of roll control with combined pitch and roll deflections.
A. Supersonic Tail-Control Configuration with Tail Fin Loads Figs. 13 and 14 show comparisons between measured, Ref. 14, and predicted aerodynamic characteristics of the tail-control Sparrow missile for Mach numbers of 1.6 and 2.2, respectively. The pitch plane orientation is ϕ = 0°. Each figure compares: configuration normal and pitching moment, and fin normal force and fin hinge and bending moments. Results are shown for tail deflection angles of +20°, 0°, and -20°. The overall and fin aerodynamic characteristics are predicted well by MISL3.
Figure 13. Measured and predicted aerodynamic characteristics of the tail control Sparrow for M∞ = 1.6, ϕ = 0°, and δP = +20, 0, and -20°.

AIAA-2017-3399
8 © Analytical Mechanics Associates, Inc., published by American Institute of Aeronautics and Astronautics with permission.
Figure 14. Measured and predicted aerodynamic characteristics of the tail control Sparrow for M∞ = 2.2, ϕ = 0°, and δP = +20, 0, and -20°.
B. Wing-Control Configuration This section demonstrates the use of MISL3 to generate an aerodynamic database over the complete Mach number, angle of attack and fin deflection space of the wing-control Sparrow. Ref. 13 describes the Sparrow database. It includes ten Mach numbers: 0.8, 1.0, 1.3, 1.6, 2.0, 2.3, 2.6, 3.0, 4.0 and 4.6, angles of attack up to 48° every 4°, and nine wing pitch plane deflections settings: 20, 16, 12, 8, 0, -8, -12, -16, and -20°. For ϕ = 0° the two horizontal wings are deflected for pitch control, and for ϕ = -45° all four wings are deflected for pitch control. For brevity, this paper only presents the ϕ = 0° pitch plane database. A case of particular interest for the wing-control sparrow is roll control effectiveness at transonic speeds. For conditions with combined pitch and roll deflections, a loss of roll control is seen in the data and has been experienced in flight tests of similar configurations.
B.1 ϕ = 0° Pitch Plane Characteristics for M∞ = 0.8 to 4.6 Figs. 15 and 16 show the overall normal force, pitching moment and center of pressure for the configuration at M∞ = 1.0 with wing pitch deflections of 12, 0, and -12°. Excellent agreement between measured and predicted results are obtained for angles of attack less than 25°; the normal force is underpredicted for angles above 25°. The pitching moment is predicted well, and the predicted center of pressure is within a body radius (0.3*LREF) of the experimental values.

AIAA-2017-3399
9 © Analytical Mechanics Associates, Inc., published by American Institute of Aeronautics and Astronautics with permission.
Figure 15. Wing-control Sparrow overall normal force and pitching moment coefficients for M∞ = 1.0.
Figure 16. Wing-control Sparrow center of pressure location for M∞ = 1.0.
Fig. 17 depicts results for M∞ = 2.0. Excellent agreement between measured and predicted results are seen for angles of attack less than 25°; the normal force is overpredicted above 25° which results in larger negative pitching moments.
Figure 17. Wing-control Sparrow overall normal force and pitching moment coefficients for M∞ = 2.0.

AIAA-2017-3399
10 © Analytical Mechanics Associates, Inc., published by American Institute of Aeronautics and Astronautics with permission.
To assess the overall database space, contour plots are used for visualization. For M∞ = 1.0, the normal force is shown in Fig. 18 for angles of attack up to 48° and deflections from +20° to -20°. The grid in the contour plot indicates the databases points. The left graph shows the experimental data from Ref. 13, the center graph shows MISL3 results, and the right graph is the difference divided by the experimental values. In the difference graph contour levels between ±10% of zero are filled in as “white.” The difference has been conditioned to account for data points where the value of CN(Exp.) is near zero. The difference between the experimental and MISL3 predicted database is less than 10% over most of the {αc, δP}space.
Figure 18. Normal force {αc, δP} database space, M∞ = 1.0.
Fig. 19 shows the contour plots of the pitching moment corresponding to the Fig. 18 normal force. The difference contours shown for the pitching moment, right graph, are not normalized by the experimental values. There is very good agreement between the measured and predicted characteristics. The predicted center of pressure is within a body radius over most of the {αc, δP} space.
Figure 19. Pitching moment {αc, δP} database space, M∞ = 1.0.
The ϕ = 0° pitch plane normal force data base is depicted in the Figs. 20 – 22. Fig. 20 plots the database from Ref. 13, Fig. 21 shows the MISL3 predicted data base, and Fig. 22 depicts the normalized difference. The MISL3 predictions capture the aerodynamic characteristics. The difference is generally less than 10% for angles of attack less than 25°. The largest differences are at the highest Mach numbers, the largest angles of attack, and the largest positive deflection angles.

AIAA-2017-3399
11 © Analytical Mechanics Associates, Inc., published by American Institute of Aeronautics and Astronautics with permission.
Figure 20. Ref. 13, ϕ = 0° normal force data base. Figure 21. MISL3, ϕ = 0° normal force data base.
Figure 22. ΔCN/CNExp., (MISL3 – Exp.), ϕ = 0°.
The ϕ = 0° pitching moment data base is shown in the Figs. 23 – 25. Fig. 23 plots the database from Ref. 13, Fig. 24 shows the MISL3 predicted data base, and Fig. 25 shows the difference between the Ref. 13 and MISL3 computed center of pressure, (xCP-xMC)/LREF = -Cm/CN. The predicted center of pressure is typically within one body radius of the experimental values as indicated by the blanked area in the contours. The largest differences indicated in Fig. 25 are numerical artifacts which occur when computing (xCP-xMC)/LREF for near zero normal force. This behavior is seen in Fig. 16.
Figure 23. Ref. 13, ϕ = 0° pitching moment data base. Figure 24. MISL3, ϕ = 0° pitching moment data base.
AIAA-2017-3399
12 © Analytical Mechanics Associates, Inc., published by American Institute of Aeronautics and Astronautics with permission.
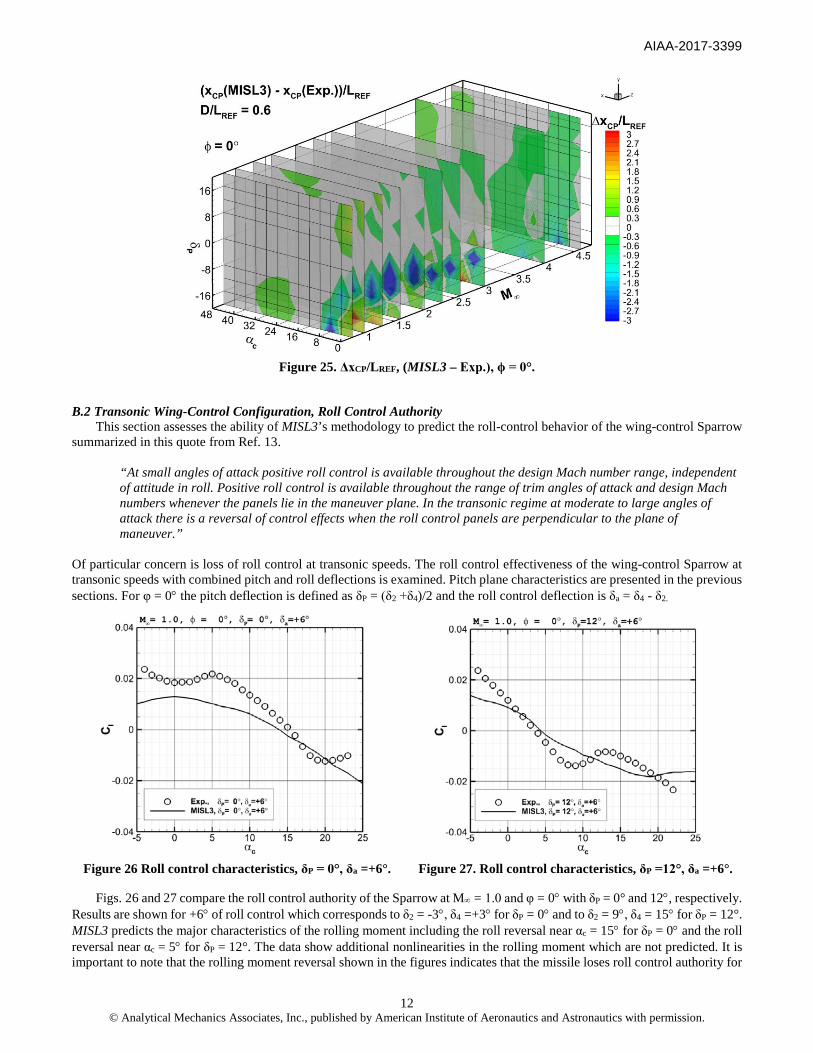
Figure 25. ΔxCP/LREF, (MISL3 – Exp.), ϕ = 0°.
B.2 Transonic Wing-Control Configuration, Roll Control Authority This section assesses the ability of MISL3’s methodology to predict the roll-control behavior of the wing-control Sparrow summarized in this quote from Ref. 13.
“At small angles of attack positive roll control is available throughout the design Mach number range, independent of attitude in roll. Positive roll control is available throughout the range of trim angles of attack and design Mach numbers whenever the panels lie in the maneuver plane. In the transonic regime at moderate to large angles of attack there is a reversal of control effects when the roll control panels are perpendicular to the plane of maneuver.”
Of particular concern is loss of roll control at transonic speeds. The roll control effectiveness of the wing-control Sparrow at transonic speeds with combined pitch and roll deflections is examined. Pitch plane characteristics are presented in the previous sections. For φ = 0° the pitch deflection is defined as δP = (δ2 +δ4)/2 and the roll control deflection is δa = δ4 - δ2.
Figure 26 Roll control characteristics, δP = 0°, δa =+6°. Figure 27. Roll control characteristics, δP =12°, δa =+6°.
Figs. 26 and 27 compare the roll control authority of the Sparrow at M∞ = 1.0 and φ = 0° with δP = 0° and 12°, respectively. Results are shown for +6° of roll control which corresponds to δ2 = -3°, δ4 =+3° for δP = 0° and to δ2 = 9°, δ4 = 15° for δP = 12°. MISL3 predicts the major characteristics of the rolling moment including the roll reversal near αc = 15° for δP = 0° and the roll reversal near αc = 5° for δP = 12°. The data show additional nonlinearities in the rolling moment which are not predicted. It is important to note that the rolling moment reversal shown in the figures indicates that the missile loses roll control authority for

AIAA-2017-3399
13 © Analytical Mechanics Associates, Inc., published by American Institute of Aeronautics and Astronautics with permission.
some transonic conditions. This is investigated further with MISL3 below after a detailed analysis of the predicted rolling moment behavior in Fig. 26.
Figure 28. Wing roll control, individual fin αeq. Figure 29. Wing roll control, individual fin Cl.
Rolling moment predictions are sensitive and often difficult to predict because they are the sum of the contributions of the eight fins of the complete configuration, and the individual fin contributions themselves include fin-on-fin induced effects and vortex induced effects as described above in the αeq methodology. To illustrate this sensitivity, Fig. 28 plots the MISL3 computed αeq for each fin, and its corresponding contribution to the rolling moment is shown in Fig 29. The thick black line in Fig. 29 is the sum of the eight fin curves; this is the overall Cl plotted in Fig. 26. The scale of Fig. 29 is expanded from that of Fig. 26 to accommodate the large wing contributions. The net rolling moment is the difference of two large numbers, the deflected horizontal wings, with interference effects on other wing fins and tail section being significant too. This is explored next. Fig. 30 plots the wing fin contributions to the rolling moment. In this figure, the contributions from deflected Wings 2 and 4 are summed and shown as the thinner red line. This line represents the direct roll control contribution from the deflected horizontal fins. The fin-on-fin interference induced rolling moment is shown as the thin blue line which is the sum of the rolling moment contributions from the two vertical wing fins. This induced rolling moment on the vertical fins opposes the direct horizontal fin rolling moment and is approximately half the magnitude (see Fig. 10); this interference effect is large. The thick red line is the total wing section rolling moment. The difference between the overall Cl (thick black line) and the sum of all wing fins (thick red line) is the induced rolling moments from the tail fins which are depicted in Fig. 31. The tails fins are immersed in an asymmetric vortex flowfield which results from the asymmetric wing deflections. The thin blue and green lines represent the contributions from the horizontal and vertical tail fins, respectively. The total tail section rolling moment is the thick blue line which, when added to the wing section rolling moment, produces the overall Cl. The subtleties and sensitivities inherent in the prediction of rolling moments is evident in this analysis.
Figure 30. Wing roll control, wing section Cl. Figure 31. Wing roll control, tail section Cl.
To better understand when roll control effectiveness is lost at transonic speeds, the rolling moment is computed over the combined pitch and roll deflection space. For the φ = 0° pitch plane orientation, Fig. 32 shows contour plots of the {δP, δa}

AIAA-2017-3399
14 © Analytical Mechanics Associates, Inc., published by American Institute of Aeronautics and Astronautics with permission.
space; individual contour plots are shown for angles of attack from 0° to 20° every 5°. At αc = 5°, roll control authority is lost for δP > 10°, and at αc = 10°, roll control authority is lost for δP > 5°. This progression continues at higher angles of attack.
Figure 32. Roll control effectiveness of the wing-control Sparrow in the ϕ = 0° pitch plane.
For the φ =-45° pitch plane orientation, Fig. 33 shows the roll control effectiveness. All four fins are deflected for pitch control, and fins 2 and 4 are differentially deflected for roll. For this orientation and command, roll authority is maintained over the range of flow conditions depicted. A reduction in roll control effectiveness with increasing αc and δP is seen in the results, but the windward orientation of wing fin 4 helps to maintain roll authority.
Figure 33. Roll control effectiveness of the wing-control Sparrow in the ϕ =-45° pitch plane.

AIAA-2017-3399
15 © Analytical Mechanics Associates, Inc., published by American Institute of Aeronautics and Astronautics with permission.
A further example of when roll authority would be lost during flight is illustrated in Fig. 34. The flight condition is M∞ = 1.0 with combined angle of attack - sideslip and yaw control deflection of the vertical wings: α = 5°, β = 2°, δ1,3 = -2°. The roll control effectiveness is plotted as a function of the horizontal fin deflection angles. For these conditions, the roll authority is asymmetric with respect to δa = 0° (45 deg line in figure), and the missile experiences loss of roll control when δP > 5°.
Figure 34. Predicted transonic roll control effectiveness for combined α, β, and pitch, yaw, and roll control deflections.
IV. Conclusions This paper describes the prediction of the nonlinear aerodynamic characteristics of wing- and tail-control Sparrow missile configurations utilizing the MISL3 engineering-level prediction method. The equivalent angle of attack method employed by MISL3 is used to provide insights into the nonlinear missile aerodynamics of the configurations. Body- and fin-shed vortex effects, scaling of upwash effects, and deflected fin-on-fin interference effects are investigated. The ability of the method to generate large databases for flight simulations over a Mach number range from 0.8 to 4.6, angles of attack up to 48° with pitch deflections up to ±20°, was demonstrated. The database is compared to published data. The normal force prediction is within 10% of the published database over most of the flight regime, and the vehicle center of pressure is within a body radius for most conditions. The pitch plane database presented consisted of 1170 conditions (M∞, αc, δP); the MISL3 computational time to generate this database is less than 30 seconds utilizing a 2016 Intel® i7 CPU. The methodology is able to estimate the loss of roll control for the wing-control Sparrow at transonic speeds.
References 1. Lesieutre, D. J., "MISL3 Aerodynamic Analysis For Finned Vehicles With Axisymmetric Bodies,” AMA-NEAR TR
685, Analytical Mechanics Associates, Nielsen Engineering & Research Division, Santa Clara, CA, November 2016.
2. Lesieutre, D. J. and Quijano, O. E. "Studies of Vortex Interference Associated with Missile Configurations," AIAA 2014-0213, Jan. 2014.
3. McDaniel, M. A., Evans, C. and Lesieutre, D. J., "The Effect of Tail Fin Parameters on the Induced Roll of a Canard-Controlled Missile," AIAA 2010-4226, Jun. 2010.
4. Lesieutre, D. J., Love, J. F., and Dillenius, M. F. E., “Prediction of the Nonlinear Aerodynamic Characteristics of Tandem-Control and Rolling-Tail Missiles,” AIAA 2002-4511, Aug. 2002.
5. Lesieutre, D. J., Love, J. F., Dillenius, M. F. E., and Blair, A. B., Jr., “Recent Applications and Improvements to the Engineering-Level Aerodynamic Prediction Software MISL3,” AIAA 2002-0275, Jan. 2002.
6. Dillenius, M. F. E., Lesieutre, D. J., Hegedus, M. C., Perkins, S. C., Jr., Love, J. F., and Lesieutre, T. O., “Engineering-, Intermediate- and High-Level Aerodynamic Prediction Methods and Applications,” Journal of Spacecraft and Rockets, Vol. 36, No. 5, Sep.-Oct. 1999, pp. 609-620.
7. Lesieutre, D. J., Love, J. F., and Dillenius, M. F. E., "High Angle-of-Attack Missile Aerodynamics Including Rotational Rates - Program M3HAX," AIAA 1996-3392, Jul. 1996.
8. Allen, J. M., Shaw, D. S., and Sawyer, W. C., “Analysis of Selected Data From The Triservice Missile Data Base,” AIAA 89-0478, Jan. 1989.
9. Allen, J. M., “The Triservice Missile Database,” NASA/TM-2002-211653, June 2002.
Predicted Roll Control EffectivenessMach = 1.0, α = 5, β = 2, δ1,3 = -2
δ2
δ 4
-15 -10 -5 0 5 10 15-15
-10
-5
0
5
10
15
Cl
0.0130.01040.00780.00520.00260
-0.0026-0.0052-0.0078-0.0104-0.013
δP = (δ2 + δ4)/2δa = δ4 - δ2
positive roll controlauthority
+Clcommand
-Clcommand
Mach = 1.0α = 5β = 2δ1,3 = -2
no roll controlauthority
δP = 10
δP = 0
SPARROW Fin 1
2
3
4
δa
Cl
-5 0 5
-0.01
0
0.01
δP = 0 - controllable
δP = 10 - uncontrollable

AIAA-2017-3399
16 © Analytical Mechanics Associates, Inc., published by American Institute of Aeronautics and Astronautics with permission.
10. Hemsch, M. J. and Nielsen, J. N., “Extension of Equivalent Angle of Attack Method for Nonlinear Flowfields,” Journal of Spacecraft and Rockets, Vol. 22, No. 3, May Jun. 1985, pp. 304 308.
11. Hemsch, M. J. and Nielsen, J. N., “Equivalent Angle of-Attack Method for Estimating Nonlinear Aerodynamics of Missile Fins,” Journal of Spacecraft and Rockets, Vol. 20, Jul.-Aug. 1983, pp. 356 362.
12. Nielsen, J. N., Hemsch, M. J., and Smith, C. A., “A Preliminary Method For Calculating the Aerodynamic Characteristics of Cruciform Missiles to High Angles of Attack Including Effects of Roll Angle and Control Deflections,” ONR-CR215-226-4F, Office of Naval Research, Nov. 1977 (also NEAR TR 152).
13. Friedman, R. F., “Aerodynamic Stability and Control Report for the Sparrow III Model XAAM-N-6B and YAAM-N-6B Missile, Raytheon Report BR-1018, Nov. 1962.
14. Raytheon Corporation, “Tail Control Sparrow Wind Tunnel Test at NASA/Ames Research Ctr.,” Raytheon Report BR-9105, Apr. 1976.
15. Monta, W.J., “Supersonic Aerodynamic Characteristics of a Sparrow III Type Missile Model With Wing Controls and Comparison With Tail-Control Results.” NASA TP 1078, Nov. 1977.
16. Monta, W.J., “Supersonic Aerodynamic Characteristics of an Air-to-Air Missile Configuration With Cruciform Wings and In-Line Tail Controls.” NASA TMX 2666, Dec. 1972.
17. Mendenhall, M.R., and Nielsen, J.N., “Effect of Symmetrical Vortex Shedding on The Longitudinal Aerodynamic Characteristics of Wing-Body-Tail Combinations, NASA CR-2473, Jan. 1975.
18. Mendenhall, M. R., Perkins, S. C., Jr., and Lesieutre, D. J., "A Vortex Cloud Model for Body Vortex Shedding and Tracking," Tactical Missile Aerodynamics: Prediction Methodology, edited by M. R. Mendenhall, AIAA Progress in Astronautics and Aeronautics, 1992, pp. 225-285.