Embed Size (px)
Citation preview

AI, Autonomous Cars, Drones and MoreHow tech innovation is transforming the world
and generating investment returnsPresented by: Brijesh Jeevarathnam / Adams Street Partners

2
Confidentiality Statement and Other Important Considerations
This presentation (the “Presentation”) has been provided to the recipient on a confidential and limited basis and for educational purposes only. The recipient agrees not to copy, reproduce or distribute the Presentation, in whole or in part, to any person or party without the prior written consent of Adams Street Partners.
This Presentation is not investment advice or an offer or sale of any security or investment product or investment advice. Offerings are made only pursuant to a private offering memorandum containing important information. Statements in this Presentation are made as of the date of this Presentation unless stated otherwise, and there is no implication that the information contained herein is correct as of any time subsequent to such date. Projections or forward looking statements contained in the Presentation are only estimates of future results or events that are based upon assumptions made at the time such projections or statements were developed or made. There can be no assurance that the results set forth in such forward looking statements will be attained. General economic factors, which are not predictable, can have a material impact on the reliability of projections or forward looking statements.

Introduction
3

Today’s Discussion
4
1. Technology advances are accelerating, rapidly transforming the world
3. Venture Capital represents an excellent way to invest in emerging Tech innovation
2. Investors can access this transformation to generate strong financial returns

1. Tech Advances Are Accelerating, Transforming the World
5

6
Early Technology Eras Lasted Millennia
Stone Age
2,000,000 BCE
Bronze Age
3300 BCE
Iron Age
1200 BCE

7Source: 2017 PBS & WGBH Educational Foundation
Until James Watt’s Steam Engine Changed the World,…
Late Eighteenth Century

8
…Catalyzed A Revolution That Lasted Centuries,…

9Source: The Second Machine Age: Work, Progress, and Prosperity in a Time of Brilliant Technologies.
….And, Bent the Curve of Human Development

Industrial Revolution
1775
10
Subsequent Technological Progress Keeps Accelerating – Eras Last Decades, Not Centuries
Information Age
1990s
Electrification/Mass Production
1870
ElectronicsAge
1969

11
We are now in the
Information Technology Age

12
Information Technology (IT) Advances Have Built on a Long History of Innovation
Punch Cards
Electric Computer (ENIAC)
PortableComputer
Touch-BasedComputing
QWERTY Keyboard
MainframeComputer
Mobile Computing
Voice-BasedComputing
1832 1872 1943 1948 1975 1996 2007 2014

13
And Exceeded the Expectations of Some of the World’s Brightest Minds
"I think there is a world market for maybe five computers.”Thomas Watson, president of IBM, 1943
"There is no reason anyone would want a computer in their home."Ken Olsen, founder of Digital Equipment Corporation, 1977
"I predict the Internet will soon go spectacularly supernova and in 1996 catastrophically collapse.”Robert Metcalfe, 3Com founder and inventor of Ethernet, 1995
"No one will need more than 637KB of memory for apersonal computer." Bill Gates,1981

14
Today, Information Technology Seems Pervasive in the Headlines…
Ford just invested $1 billion in self-driving cars

15
…And in Our Everyday Lives
Circa 2007
Purchased something
Made a phone call
Accessed emailHailed a Taxi
Ordered out/ate out
Made a reservation
Navigated using GPS

16
Moore’s Law Predicted Exponential Gains in Compute Power Over Time
In 1960 Gordon
Moore, a founder
of Intel, accurately
predicted that
processing power
for computers
will double every
two years

17Source: http://pointsandfigures.com/2015/04/18/moores-law/
Moore’s Law Predicted Exponential Gains in Compute Power Over Time
In 1960 Gordon Moore, a founder of Intel, accurately predicted thatprocessing power for computers will double every two years

18*Million standardized operations per secondSource: GP Presentation. Nordhaus, William, The Progress of Computing, Version 4.4, Appendix Table 2, 2001.
The Cost of Compute and Storage Has Collapsed
$0.01
$0.10
$1.00
$10.00
$100.00
$1,000.00
$10,000.00
$100,000.00
$1,000,000.00Storage (Average Cost Per GB)
$0.00000001
$0.00000010
$0.00000100
$0.00001000
$0.00010000
$0.00100000
$0.01000000
$0.10000000
$1.00000000
$10.00000000
$100.00000000
$1,000.00000000
$10,000.00000000
$100,000.00000000
$1,000,000.00000000
Processor Speed ($ per MSOPS*)

19Source: ZME Science.
Household Electronics Today Generally Have as Much Compute Power as the Computers that Landed Apollo 11 on the Moon
1969 2017

20Source: ZME Science.
The Compute Power of An iPhone7 Overwhelmingly Exceeds That of Apollo 11 Computers
Launched in 1969 Launched in 2016>80 Million Times Faster

Major Tech Trends Are Converging
21
■ Increase in compute power and availability fueling mega trends in technology
1. Internet everywhere
2. Mobile everything
3. Cheaper, more efficient storage
4. Massive amounts of data
5. Machine learning
6. Cloud computing
■ Technology is becoming more ingrained in everyday life, and leading companies / figures in the technology industry have become household names

22Source: NY Times
Consumers Are Adopting Technologies Faster Than Ever
60
40
20
10
Telephone Washing Machine Cellphone Internet
Years to 50% US Market Penetration
~1870’s ~1925 ~1980s ~1990sTime PeriodIntroduced:

23Source: comScore MobiLens, U.S., Age 13+, 3 Mo. Avg. Ending Dec 2005 – 3 Mo. Avg. Ending Dec 2016
Smartphones Everywhere, Internet Access Ubiquitous
2% 3%6%
11%17%
27%
42%
54%
65%
75%79% 81%
0%
10%
20%
30%
40%
50%
60%
70%
80%
90%
2005 2006 2007 2008 2009 2010 2011 2012 2013 2014 2015 2016
Smartphone Penetration of Mobile Phone Market

24Source: Internet World Stats.
Providing Affordable Access to Technology for the World
0.0
0.5
1.0
1.5
2.0
2.5
3.0
3.5
4.0
Inte
rnet
Use
rs W
orld
wid
e (B
illio
ns)
50%of World
Population
<5%of World
Population

Source: Statista Digital Market OutlookNote: Figures account for total world population using the internet / a smartphone within the last 12 months 25
The World is More Connected Than Ever, a Development Which Looks Set to ContinueShare of world population connected to the internet from 2016 to 2021
+5.7 p.a.
+3.7 p.a.
53.2% 55.4% 57.5% 59.7% 61.8% 63.9%
38.2%41.6% 44.5%
46.9%48.8% 50.5%
2016 2017 2018 2019 2020 2021Internet penetration Mobile penetration

Source: U.S. Bureau of Labor Statistics. 26
“Information Technology Is Eating the World”Disrupting every piece of the consumer pie
Housing
TransportationFood
Pensions andSocial Security
Healthcare
Entertainment
ApparelEducation
Other
Distribution of Consumer Wallet by Category (1)
27Source: Public Sources.
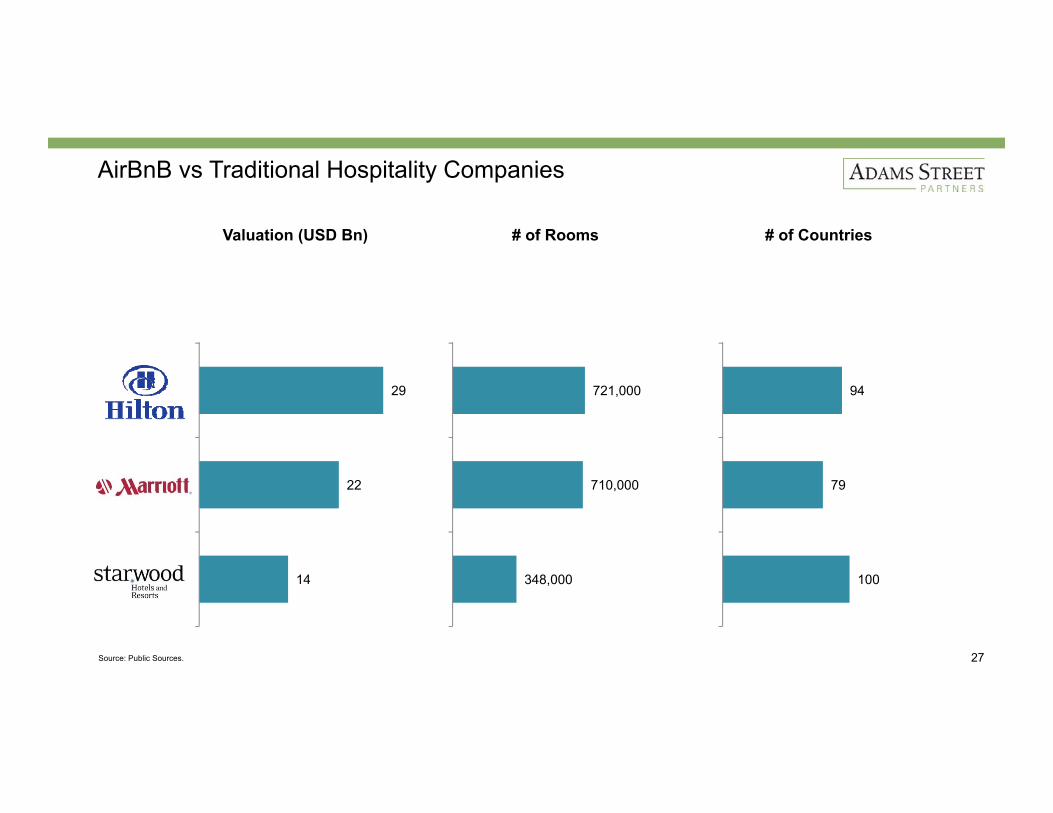
AirBnB vs Traditional Hospitality Companies
100
79
94
190
Starwood
Mariott
Hilton
AirBnB
# of Countries
348,000
710,000
721,000
1,000,000
Starwood
Mariott
Hilton
AirBnB
# of Rooms
14
22
29
31
Starwood
Mariott
Hilton
AirBnB
Valuation (USD Bn)

28Source: GP Presentation.
Transforming the Enterprise
Only 6% of the
$4 Trillion in
IT spend today
is spent on
cloud software

29Source: Internet World Stats.
Providing Affordable Access to Technology for the World
0.0
0.5
1.0
1.5
2.0
2.5
3.0
3.5
4.0 Billions of Internet Users Worldwide
Delivering More Apps and Services Over the Internet
Scalable Public Cloud Infrastructure
Private Cloud Infrastructure

30
Technology is Transforming Every Major Industry
Lets Take a Closer Look at Technology’s Impact on Three Big Industries:
Automotive1Healthcare2
Manufacturing& Logistics3
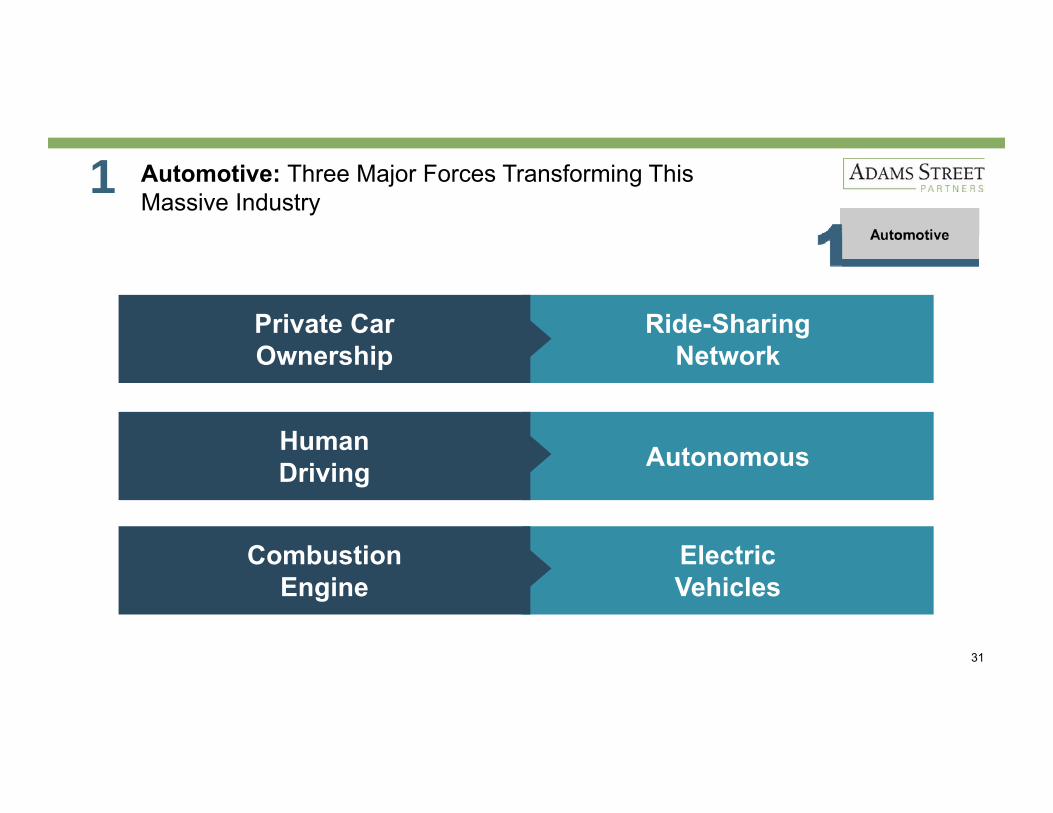
Ride-SharingNetwork
Autonomous
ElectricVehicles
31
Automotive: Three Major Forces Transforming This Massive Industry
Private CarOwnership
HumanDriving
CombustionEngine
1

32Source (# of rides, left to right): Business Insider; The Verge (as of June 2016); The Verge.
Private Car Ownership Giving Way to Shared / On Demand
2,000,000,000Total Rides
1,000,000,000Rides in 2015
162,600,000Rides in 2016
On Demand Transportation
New Ways of Renting Cars

33Source: GP Presentation.
Autonomous Driving
MONITORED DRIVING
DRIVERONLY
ASSISTED PARTIALAUTOMATION
CONDITIONALAUTOMATION
HIGHAUTOMATION
FULLAUTOMATION
NON-MONITORED DRIVING

34Source: Uber; Google.
Autonomous Driving

35
Autonomous Driving

Source: Yahoo! Finance, CB Insights, livemint Note: Market cap as of 04-20-2017 36
Market Valuation of New Entrants to Auto Industry Rival Those of IncumbentsMarket cap/valuation of selected companies in 2017 (in US$ billion)
147.3
75.3
74.3
68.0
51.0
49.8
33.8
6.9
3.0
3.0
Toyota Motor Corp.
Daimler AG
Volkswagen AG
Uber Technologies Inc.
General Motors Co.
Tesla Motors Inc.
Didi Chuxing
Lyft Inc.
ANI Technologies Pte Ltd. (Ola)
Grab Taxi Holdings Pte Ltd.
Automobile Manufacturers New Entrants

Source: WSJ. 37
The Automobile and Tech Industries Are CollidingAuto makers have come to Silicon Valley

38
Ripple Effects from Auto Transformation
Retail Delivery
Rental CarIndustry
Auto Insurance
Urban Planning
Autonomous, Electric,
Shared Automobiles

39
Technology is Transforming Every Major Industry
Lets Take a Closer Look at Technology’s Impact on Three Big Industries:
Healthcare2
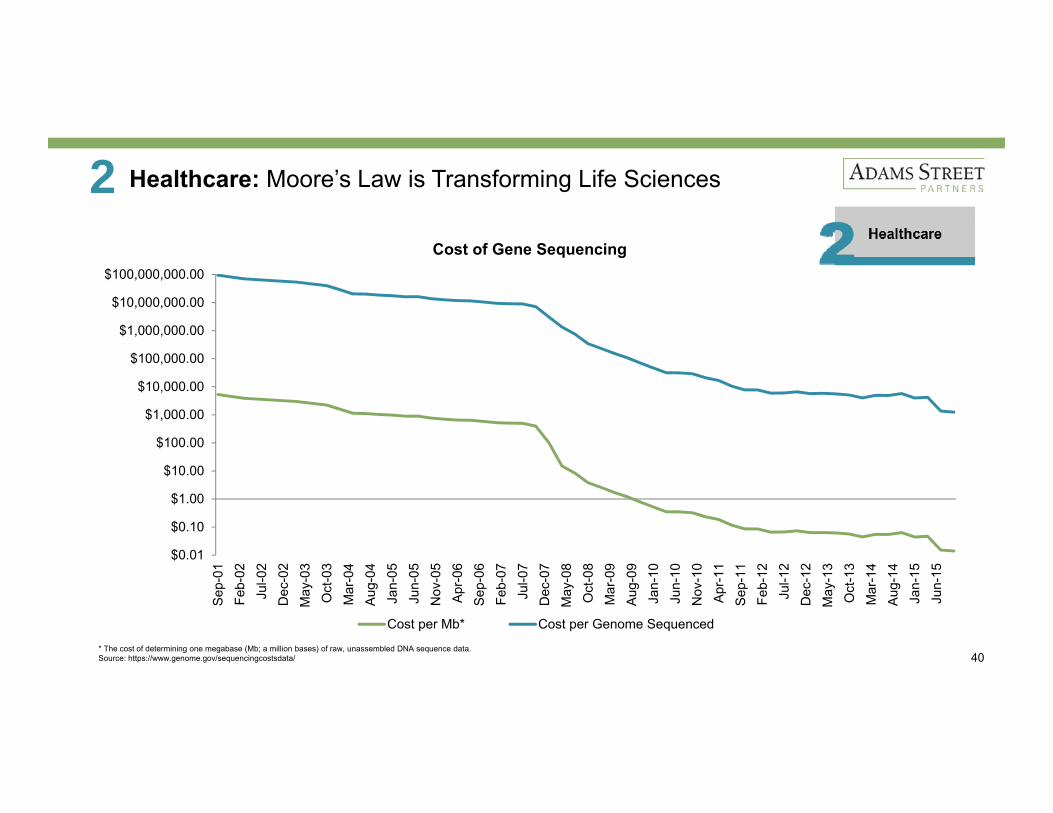
40* The cost of determining one megabase (Mb; a million bases) of raw, unassembled DNA sequence data.Source: https://www.genome.gov/sequencingcostsdata/
Healthcare: Moore’s Law is Transforming Life Sciences2
$0.01
$0.10
$1.00
$10.00
$100.00
$1,000.00
$10,000.00
$100,000.00
$1,000,000.00
$10,000,000.00
$100,000,000.00
Sep-
01Fe
b-02
Jul-0
2D
ec-0
2M
ay-0
3O
ct-0
3M
ar-0
4Au
g-04
Jan-
05Ju
n-05
Nov
-05
Apr-0
6Se
p-06
Feb-
07Ju
l-07
Dec
-07
May
-08
Oct
-08
Mar
-09
Aug-
09Ja
n-10
Jun-
10N
ov-1
0Ap
r-11
Sep-
11Fe
b-12
Jul-1
2D
ec-1
2M
ay-1
3O
ct-1
3M
ar-1
4Au
g-14
Jan-
15Ju
n-15
Cost per Mb* Cost per Genome Sequenced
Cost of Gene Sequencing

41
Convergence of Advances in IT and Life Sciences Are Transforming Healthcare
IT Advances Life Science Advances
■ Gene Sequencing
■ Gene Editing
■ Targeted Therapeutics
■ Behavioral Medicine
■ Data Science
■ Machine Learning
■ Computer Vision
■ Consumerization of Healthcare
■ Prevention■ Diagnosis■ Treatment

42
Disease Prevention: Using Data and Behavioral Medicine

43
Diagnosis: Deep Learning Algorithms and Computer Vision Leading to Better Anomaly Detection

44
Diagnosis: Deep Learning Algorithms and Computer Vision Leading to Better Anomaly Detection

45
Using Big Data and Machine Learning to Diagnose Earlier and Treat Better

46
Treatment: Gene Editing Has Potential to Eliminate Certain Diseases

47
Technology is Transforming Every Major Industry
Lets Take a Closer Look at Technology’s Impact on Three Big Industries:
Manufacturing& Logistics3

48
■ Advanced Materials
Manufacturing & Logistics: Multiple Vectors of Change3
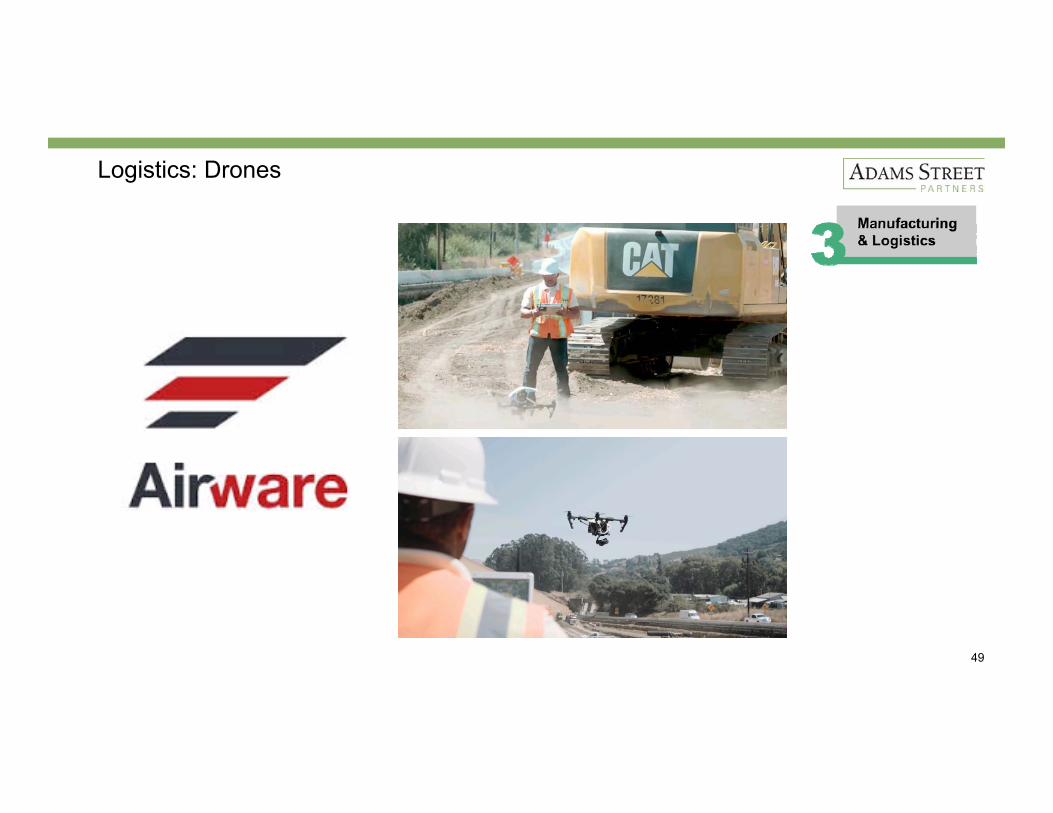
■ Drones
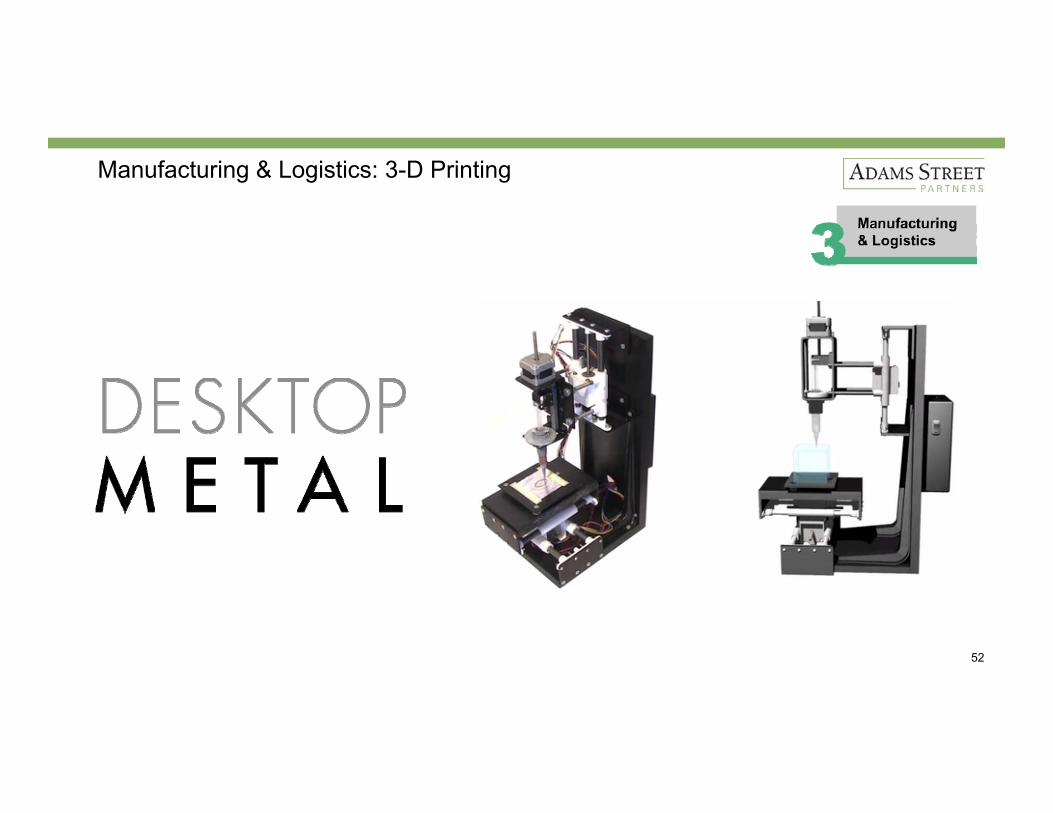
■ 3-D Printing
49
Logistics: Drones

50
Logistics: Drones

51
Logistics: Delivery Robots
Robots to deliver Yelp Eat24 dinners in two SF neighborhoods
52
Manufacturing & Logistics: 3-D Printing
2. Investors Can Access this Transformation to Generate Strong Financial Returns
53

Search
eCommerce
1999
Source: Pitchbook 54
New Technology Trends are Creating New MarketsCompanies organized by year of founding
Sharing Economy
Communicationsand Social Media
1991 1993 1995 1997 20052003 2007 2009 2013 20152001 2011 20171999

55Source: CapitalIQ, as of March 2017.
Tech is Becoming a Larger Portion of the Economy
15.1% 18.6% 20.8%
12/31/2005 12/31/2010 12/31/2016
15.9% 17.4% 19.4%
Tech Companies % of S&P 500 Revenues
Tech Companies % of S&P 500 Market Cap

56CapitalIQ as of May 1, 2017
Tech has Performed Well in the Public Markets
0%
50%
100%
150%
200%
250%
300%
2005 2006 2007 2008 2009 2010 2011 2012 2013 2014 2015 2016 2017
S&P 500 Russell 2000 IT

57Chart reflects total return over respective periods. Source: CapitalIQ as of May 1, 2017
Tech has Performed Well in the Public Markets
16%
27%
70%
59%
24% 25%
72% 69%
34%
57%
92%
147%
0%
20%
40%
60%
80%
100%
120%
140%
160%
1 Year Return 3 Year Return 5 Year Return 10 Year Return
S&P 500 Russell 2000 IT

58Market capitalizations as of December 31st for each respective year; 2017 market capitalization as of May 9, 2017.
Tech Companies Now Among Largest by Market Capitalization
Inte
llect
ual &
Hum
an C
apita
lPh
ysic
al C
apita
l Top 5 Publicly Traded Companies (by Market Cap)
Tech Other
2006
2011
2001
$406B
$446B
$406B $277B
$327B
$272B $261B $260B
$273B
$228B$237B
$356B
$293B
$376B
2017
$803B $653B $533B $455B $436B
$383B

3. Venture Capital Represents an Excellent Way to AccessEmerging Tech Innovation
59

60
What is Venture Capital?
Venture Capital Growth Equity LBO or IPO
Time
Rev
enue

61Source: Pitchbook as of 4Q 2016.
Some Famous Venture Backed Companies
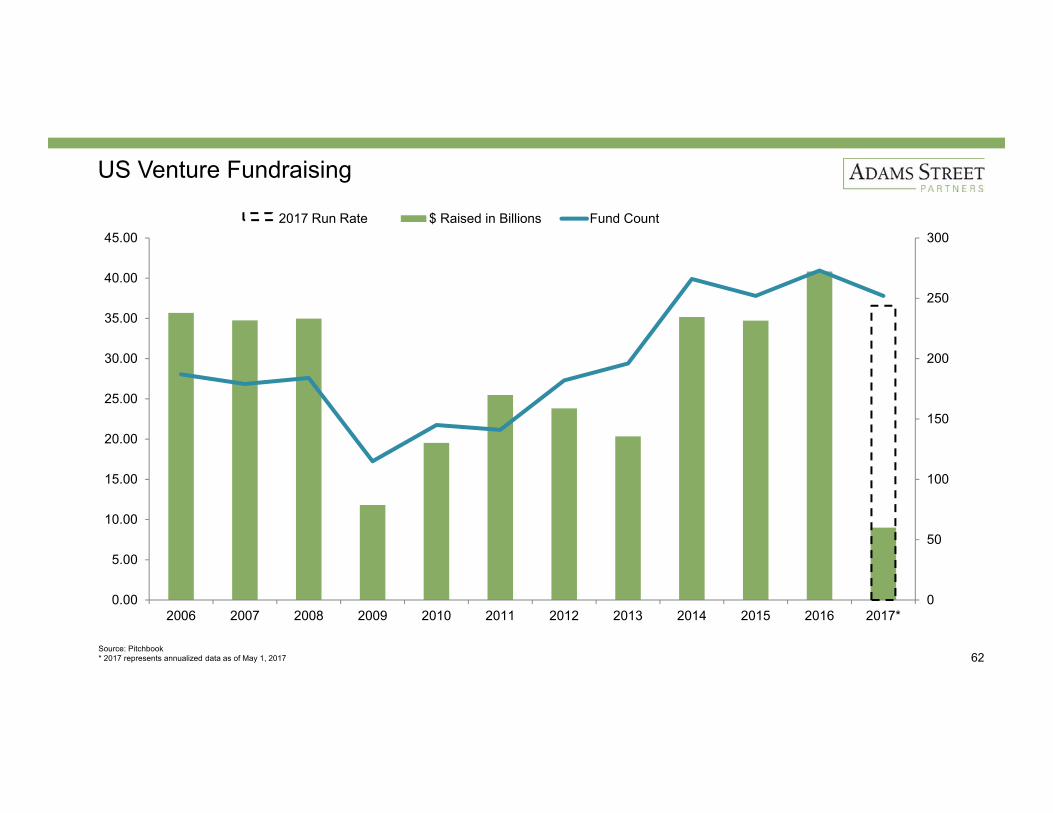
62Source: Pitchbook* 2017 represents annualized data as of May 1, 2017
US Venture Fundraising
0
50
100
150
200
250
300
0.00
5.00
10.00
15.00
20.00
25.00
30.00
35.00
40.00
45.00
2006 2007 2008 2009 2010 2011 2012 2013 2014 2015 2016 2017*
$ Raised in Billions Fund Count2017 Run Rate

*Reflects Microsoft’s purchase price in June 2016.Source: Capital IQ as of 5/1/2017. 63
Private Investors Have Benefitted from Pre-IPO Value CreationMarket capitalization at IPO vs. today
$19Billion
$26Billion*
$442Billion
Today$170Billion
$453Billion
$536Billion
Today
Cisco Amazon Microsoft Workday LinkedIn Facebook
$225 Million$560 Million $690 Million
$82 Billion
$8.9 Billion$8.3 Billion
1980’s – 1990’s 2010 – Present

Source: Pitchbook as of 4Q 2016. 64
Median Time from Initial Venture Capital Equity Funding to ExitAs of December 31, 2016
Companies are staying private longer
7.7 7.9
8.3
9.9
9.5
8.5 8.6
9.49.6
8.8
9.6
7.3
8.1
8.0
7.6 7.6 7.6 7.7
6.8
7.57.3 7.4
6
7
7
8
8
9
9
10
10
11
2006 2007 2008 2009 2010 2011 2012 2013 2014 2015 2016
Num
ber o
f Yea
rs
IPO M&A

Source: The Burgiss data presented here includes a set of funds in Asia, Europe, and US regions with vintage years 2002-2016 which are invested on a primary basis in venture capital and buyout partnerships, and excludes secondary investments. Numbers are subject to updates by Burgiss. Burgiss is a recognized source of private equity data, and the Burgiss Manager Universe includes funds representing the full range of private capital strategies. All net IRRs are net of GP fees, carried interest, and expenses. Calculations by Burgiss. Data sourced on May 02, 2017. Performance as of December 31, 2016. 65
Venture Industry Has Attractive Returns, With Wide Dispersion Between QuartilesAs of December 31, 2016
Dispersion of Burgiss Returns – Net IRR
Small LBO (<$1.0bn) Medium LBO ($1.0bn -$3.0bn) Large LBO ($3.0bn+) Venture
38.9%
17.4%
8.7%
(1.1%)
(31.5%)
31.3%
14.8% 8.8% 3.3%
(15.3%)
28.5%
15.9% 10.1% 5.2%
(10.1%)
42.5%
15.9%
7.1%
(3.0%)
(20.3%)
(40.0%)
(30.0%)
(20.0%)
(10.0%)
0.0%
10.0%
20.0%
30.0%
40.0%
50.0%
95th Percentile75th PercentileMedian25th Percentile5th Percentile

Active manager returns by quartile for period ending June 30, 2012. Fixed income and marketable equity performance based on annualized ten-year returns of BNY Mellon manager universes, adjusted for fees. Venture capital and LBO based on annualized since-inception IRRs of Cambridge Associates manager universes.Source: Yale Endowment, 2012 Report. 66
Venture Industry Has an Attractive Dispersion of Returns
25th Percentile 75th PercentileMedian
-10.0%
-5.0%
0.0%
5.0%
10.0%
15.0%
20.0%
25.0%
30.0%
U.S. Fixed Income U.S. LargeCapitalization Equity
U.S. SmallCapitalization Equity
U.S. LeveragedBuyouts
U.S. Venture Capital
Dis
pers
ion
of R
etur
ns

Source: Burgiss; “Has Persistence Persisted in Private Equity? Evidence From Buyout and Venture Capital Funds” 67
Access to Top Performers is ImportantPersistence of returns in venture capital
Top 5%
1st Quartile
2nd Quartile
3rd Quartile
Bottom 5%
42.5%
15.9%
7.1%
(3.0)%
(20.3)%
49%Of 1st Quartile Funds Generate
A Subsequent 1st Quartile Performing Fund
65%Of 1st Quartile Funds Generate A Subsequent 1st Quartile or 2nd Quartile Performing Fund

Keys to Building a High Performing Venture Capital Portfolio
68
■ Manager selection, access, and portfolio construction are paramount
■ Build a high-quality, concentrated portfolio of Venture managers
■ Keep a long-term investment horizon
■ Manage consistent exposure across time (and cycles)

Summary
69
■ Technology advances are accelerating, rapidly transforming the world
■ Investors can access this transformation to generate strong financial returns
■ Venture Capital represents an excellent way to invest in emerging Tech innovation

70
Additional Questions?Brijesh JeevarathnamPartner & Co-Head of Global Venture Fund Investments650 331 4869 / [email protected]
Steven Wilde, CFAPartner, Client Service312 553 7867 / [email protected]