Embed Size (px)
Citation preview

Budget Presentation
Abington Heights School District
April 18, 2012

Tonight’s Presentation• Current and projected economic environment
– Revenue status and outlook– Expenditure status and outlook
• Draft preliminary budget summary– Revenues– Expenditures– Fund Balance
• Budget Timeline

Revenue Status and Outlook

Revenue Shortfalls
• 2011‐2012 brought unprecedented state aid cuts (basic ed. Subsidy, charter school reimbursement, grant reductions, etc.)
• The economic recession has hampered local tax collections (high unemployment = lower wage tax)
• Act 1 Index caps the amount the district can raise taxes
• Interest earnings on checking have evaporated as interest rates dropped

State Revenue Decline
‐
2,000,000
4,000,000
6,000,000
8,000,000
10,000,000
12,000,000
14,000,000
2006‐07 2007‐08 2008‐09 2009‐10 2010‐11 2011‐12 YTD
AHSD State Revenues
State Revenues
State revenues have historically included: Basic Ed Subsidy, Special Ed Subsidy, Social Security Reimbursement, PSERS Reimbursement, Transportation Subsidy, Charter School Reimbursement, Accountability Block Grant, EAP Grant, etc.

Stagnant Local Revenues
‐
5,000,000
10,000,000
15,000,000
20,000,000
25,000,000
30,000,000
35,000,000
2006‐07 2007‐08 2008‐09 2009‐10 2010‐11 2011‐12 YTD
Local Revenues
Local Revenues
Local Revenues include Real Estate Tax, Wage Tax, Real Estate Transfer Tax, Checking Account Interest, Local Service Tax, Tuition, Etc.

Value of 1 Real Estate Tax Mil
180,000.00
185,000.00
190,000.00
195,000.00
200,000.00
205,000.00
2006‐07 2007‐08 2008‐09 2009‐10 2010‐11 2011‐12 2012‐13
Value of 1 mil (current Real Estate Tax)
Value of 1 mil (current Real Estate Tax)

Expiration of Stimulus Funds
2006‐07 2007‐08 2008‐09 2009‐10 2010‐11 2011‐12 YTDFederal Revenues 251,431 231,699 464,511 1,239,700 1,765,015 77,405
‐
200,000
400,000
600,000
800,000
1,000,000
1,200,000
1,400,000
1,600,000
1,800,000
2,000,000
Dollars
Federal Revenues

Expenditure Status and Outlook

Rapidly Increasing Expenses
Salary and Benefit Costs
Energy Costs
Special Education Costs
Transportation Costs
Charter School Costs (New charter)
Cyber Charter School Costs
Unfunded Mandates
Potential for School Choice/Vouchers

The PSERS Pension CrisisYear Pension Rate Estimated Annual
Pension Cost (All District Employees)
Est. Pension Cost over Previous Year
2010‐2011 5.64% $1,247,447* $207,748
2011‐2012 8.65% $1,850,430** $602,983
2012‐2013 12.36% $2,721,217 $870,787
2013‐2014 16.75% $3,724,611 $1,003,394
2014‐2015 21.25% $4,772,505 $1,047,894
2015‐2016 25.56% $5,797,886 $1,025,381
TOTAL INCREASE from 2011‐2016 = $4,550,439 – Millage equivalent of 22 mils
*2010‐11 Actual; **2011‐2012 Budget 1 mil = approximately $206,754Future projections assume a 1% growth in wages each year over base year 2011‐2012 Total Budgeted Salaries of $21,798,337

PSERS RATE & Millage
‐Act 1 index = 1.7%‐50% Reimbursement from state is factored in to these projections.
23,000,000
23,500,000
24,000,000
24,500,000
25,000,000
25,500,000
26,000,000
2012‐13 2013‐14 2014‐15 2015‐16
Total Real Estate Taxesif Raised to Act 1 LimitEach Year
Real Estate Tax IncreaseNecessary to Pay ONLYPSERS Increases

Future Pension Costs & Fund Balance
‐Projections assume a 1% wage growth in total salaries.50% Reimbursement from state is included in this calculation.
‐Pension fund balance at 7/1/11 is $6,888,558‐Pension would run out of funds in 2015 in this example
($2,000,000)
($1,000,000)
$0
$1,000,000
$2,000,000
$3,000,000
$4,000,000
$5,000,000
$6,000,000
$7,000,000
2010‐11 2011‐12 2012‐13 2013‐14 2014‐15 2015‐16 2016‐17
Dollars
Fund Balance Designatedfor Future PSERS Costs
Cumulative Increases InPension Cost Paid Out ofPension Fund Only

Medical Insurance Costs
• Health Care Costs are expected to rise by 11% in 2012‐2013 and each year for the next 5 years
• Cost per employee will be $1,214 more in 2012‐2013 with no plan design change

Medical Insurance Costs
2008‐09 2009‐10 2010‐11 2011‐12 YTD 2012‐2013Projected
2013‐2014Projected
2014‐2015Projected
2015‐2016Projected
Actual Cost $4,778,831 $4,976,598 $4,966,927 $5,338,693 $5,978,884 $6,636,561 $7,366,583 $8,176,907
$‐
$1,000,000
$2,000,000
$3,000,000
$4,000,000
$5,000,000
$6,000,000
$7,000,000
$8,000,000
$9,000,000
$10,000,000
Total Cost p
er Con
tract P
eriod
Abington Heights ‐ Actual & Projected Costs

Medical Insurance Costs
2008‐09 2009‐10 2010‐11 2011‐12 YTD 2012‐2013Projected
2013‐2014Projected
2014‐2015Projected
2015‐2016Projected
Per Employee Per Year $10,060.68 $10,328.52 $10,551.12 $11,824.32 $13,242.24 $14,698.89 $16,315.76 $18,110.50
$‐
$5,000
$10,000
$15,000
$20,000
$25,000
Employee
Cost p
er Year
Abington Heights ‐ Employee Cost Per Year

Future Healthcare Costs & Fund Balance
‐Projections assume a 11% Premium Increase each year.‐
‐Health Insurance fund balance at 7/1/11 is $7,360,631‐Health Fund would run out of funds in 2015 in this example
($8,000,000)
($6,000,000)
($4,000,000)
($2,000,000)
$0
$2,000,000
$4,000,000
$6,000,000
$8,000,000
Dollars
Fund Balance Designated forFuture PSERS Costs**
Cumulative Increases InHealth Care Costs Paid Outof Health Care Fund Only
COMBINED Future Pension and Healthcare Costs & Fund Balances
This graph combines the previous 2 graphs depicting fund balances and Increases in Pension and Healthcare costs
‐Combined fund balances at 7/1/11 are $14,249,189‐Both funds would run out of funds in 2015 in this example
($20,000,000)
($15,000,000)
($10,000,000)
($5,000,000)
$0
$5,000,000
$10,000,000
$15,000,000
Dollars
Total Pension and HealthcareFund Balances**
Cumulative Increases InPension and HealthcareCosts Paid Out of Healthcareand Pension Funds Only

Charter/Cyber Charter School Costs
• Cyber charter school bills continue to rise• Howard Gardner Charter School expected to be approved, costing the district an estimated $300,000
• Any savings achieved through efficiency will be essentially negated by this single budget item

Expense vs. Revenue Trend/Projection
$‐
$10,000,000
$20,000,000
$30,000,000
$40,000,000
$50,000,000
$60,000,000
RevenuesExpenditures
Projections assume 1% revenue growth, 1% salary growth, 8%‐10% benefit growth, 3% inflationary increases, and 0% debt service payment growth

New Fiscal Reality• Do more with less• Old system is unsustainable• Uncontrollable PSERS costs• Rapidly Rising Medical Insurance Costs• Act 1 index limitations

Preliminary Budget Overview2012‐2013

2012‐2013 Draft Budget Summary
Revenues ‐ $42,265,085
Expenses ‐ $44,427,889
Deficit ‐ $(2,162,804)
Budgeted Revenues2012‐2013

Governor’s Proposed 2012‐2013 Budget
• Flat or reduced revenues• Likely that moving away from formula driven reimbursements will lead to more costs being driven to the local level
• No Accountability Block Grant (KG – extra programs)
• Is 50% reimbursement on FICA and Retirement guaranteed?

Proposed 2012‐13 vs 2011‐122012‐2013 Governor’s Proposal
2011‐2012 State Aid In Similar Categories
Increase (Decrease)
Basic Education Funding
$5,875,375 $5,875,375 $0
Social Security Subsidy
$834,057 $834,057 $0
Transportation Subsidies
$1,076,464 $1,076,464 $0
Special Education Funding
$1,632,884 $1,632,884 $0
Accountability Block Grant
$0 $103,120 $(103,120)
Totals $9,418,780 $9,521,900 $(103,120)
NOTE: PASBO’s interpretation of Block Grant is that districts will receive at least what they Received last year. If any funds remain at the end of the year, more funds will be distributed.

Real Estate Taxes
0
20
40
60
80
100
120
140
19961997
19971998
19981999
19992000
20002001
20012002
20022003
20032004
20042005
20052006
20072008
20082009
20092010
20102011
20112012
Real Estate Tax Millage Rate
Millage Rate

Budgeted Expenses2012‐2013

Historical Budgeted Expenses
36,000,000
37,000,000
38,000,000
39,000,000
40,000,000
41,000,000
42,000,000
43,000,000
44,000,000
45,000,000
46,000,000
2006‐072007‐08
2008‐092009‐10
2010‐112011‐12
2012‐13
Budgeted Expenses
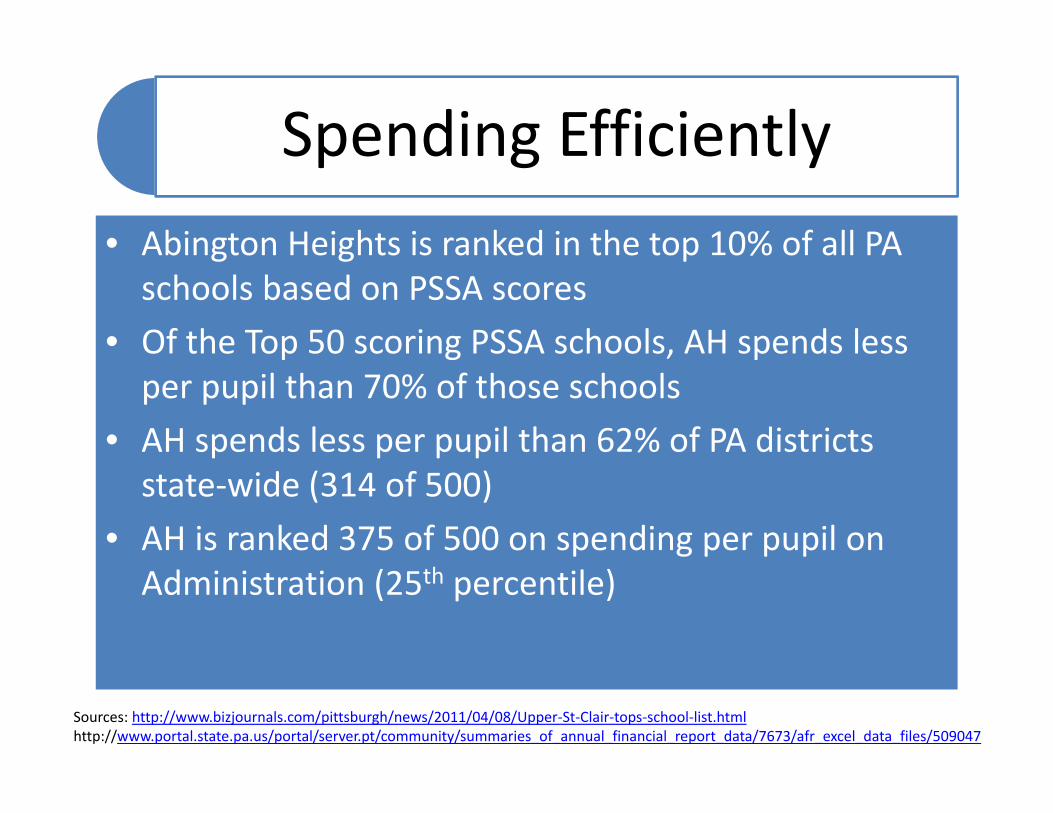
Spending Efficiently• Abington Heights is ranked in the top 10% of all PA schools based on PSSA scores
• Of the Top 50 scoring PSSA schools, AH spends less per pupil than 70% of those schools
• AH spends less per pupil than 62% of PA districts state‐wide (314 of 500)
• AH is ranked 375 of 500 on spending per pupil on Administration (25th percentile)
Sources: http://www.bizjournals.com/pittsburgh/news/2011/04/08/Upper‐St‐Clair‐tops‐school‐list.htmlhttp://www.portal.state.pa.us/portal/server.pt/community/summaries_of_annual_financial_report_data/7673/afr_excel_data_files/509047

Joint State GovernmentCommission
• The Pennsylvania Joint State Government identified Abington Heights with 25 other districts as a “lower spending” district deemed “high performing”. The commission is studying these 25 districts as a basis for future Senate deliberations on public school funding.
‐September, 2011

Where do we spend?
Salaries & Benefits, $31,950,620 , 72%
Purchase Prof & Tech
Serv., $1,493,681 ,
3%
Purch Prop Services,
$1,169,866 , 3%
Other Purchased Services, $3,648,944 , 8%
Supplies, $2,226,925 , 5%
Property, $30,000 , 0%
Other Objects, (Interest, etc), $104,580 , 0% Principal Payments on
Debt, $3,803,271 , 9%
2012‐2013 Budget

2012‐2013 Expense Increases
PSERS Retirement Contributions
+$694,000
Health Insurance Expenses
+$675,000
Howard Gardner Charter School
+$300,000

2012‐2013 Attritional Staffing Changes
• 3 Teaching Positions• 3 Maintenance/Custodial Positions• 3 Admin./Clerical Positions• Approximate savings = $500,000
• (All non‐replacements are tentative)

How to balance budget…
Reduce expenses
Increase Revenues
Utilize Fund
Balance

The Importance of Maintaining a Healthy Fund Balance
Flexibility in bad budget years to TEMPORARILY offset rising expenses
Balance of Fund Balance is
largely assigned to employees for Pension and Healthcare
Contingency for emergencies i.e.
Fires, Large Equipment Breakdowns, Lawsuits, etc.
Boosts credit rating to provide lower borrowing
costs

Fund Balances
$‐
$5,000,000
$10,000,000
$15,000,000
$20,000,000
$25,000,000
2002‐2003 2003‐2004 2004‐2005 2005‐2006 2006‐2007 2007‐2008 2008‐2009 2009‐2010 2010‐2011
Total of General Fund, Capital Reserve Fund, and Health Insurance Fund
Total Fund Balances

2012‐2013 Budget Timeline
4/18/12 ‐Budget
Presentation and
Discussion
5/2/12 ‐Further Budget
Discussions
5/16/12 –Preliminary Budget Passage
6/6/12 –Budget
Discussions
6/27/12 –Final Budget Passage

Summary• Abington Heights has been fiscally conservative over the years and is better prepared than many districts to weather the financial storm
• We are continuing to feel the nagging effects of the great recession
• The state is cutting/flat‐funding education and shifting expenses to the local level

Summary (Continued)• Rapidly rising expenses such as PSERS retirement, healthcare costs, and charter school tuition add to the budget crunch
• A healthy blend of revenue increases, expenditure decreases, and fund balance utilization is necessary to balance budget


![Mrunal [Budget] Interim Budget 2014 (Part 1of4)_ Revenue Reciepts, Direct Taxes, Indirect Taxes, Gross vs Net Taxes, Shortfalls in Collection » Mrunal](https://img.pdfslide.us/doc/110x75/577cca0f1a28aba711a5424c/mrunal-budget-interim-budget-2014-part-1of4-revenue-reciepts-direct-taxes.jpg)