Embed Size (px)
Citation preview
AHRQ Quality Indicators Software for Windows and SAS Version 4.4
Mamatha Pancholi, MS, Project Officer, Quality Indicators, AHRQ John Bott, MSSW, MBA, Senior Analyst, Quality Indicators, AHRQ
Jeffrey Geppert, EdM, JD, Research Leader, Battelle Memorial Institute Ann Borzecki, MD, MPH, VA Boston Healthcare System
Leslie Prellwitz, MBA, and Julie Cerese, RN, MSN, University HealthSystem Consortium
May 9, 2012
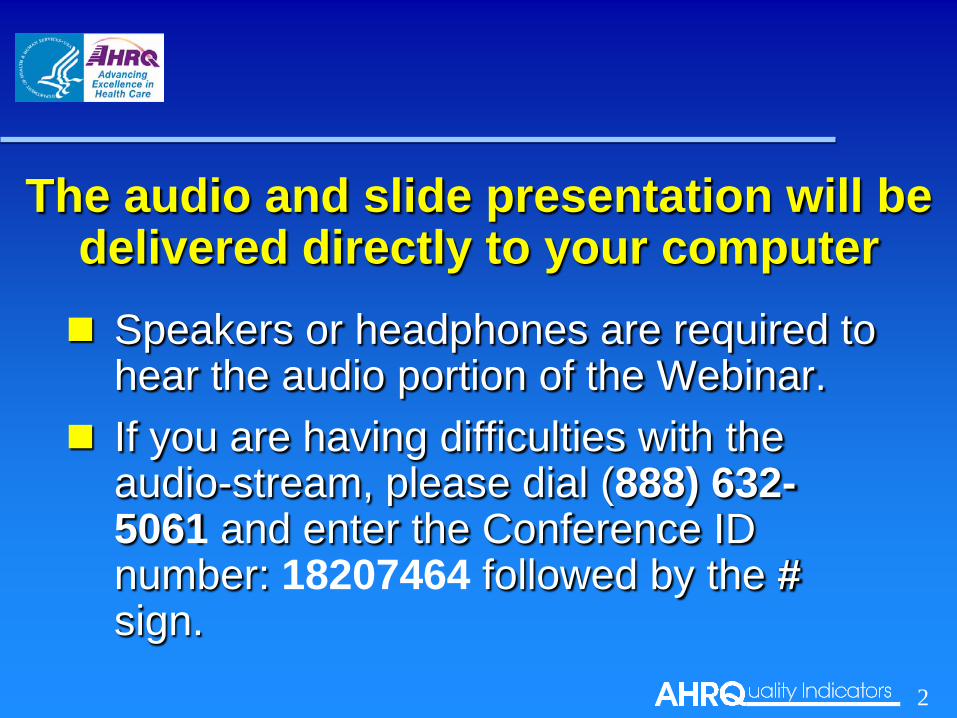
The audio and slide presentation will be delivered directly to your computer Speakers or headphones are required to
hear the audio portion of the Webinar. If you are having difficulties with the
audio-stream, please dial (888) 632-5061 and enter the Conference ID number: 18207464 followed by the # sign. 2
Technical Assistance
If you require technical assistance, or are having difficulties with the audio portion of this Webinar, please click on “Help”
3
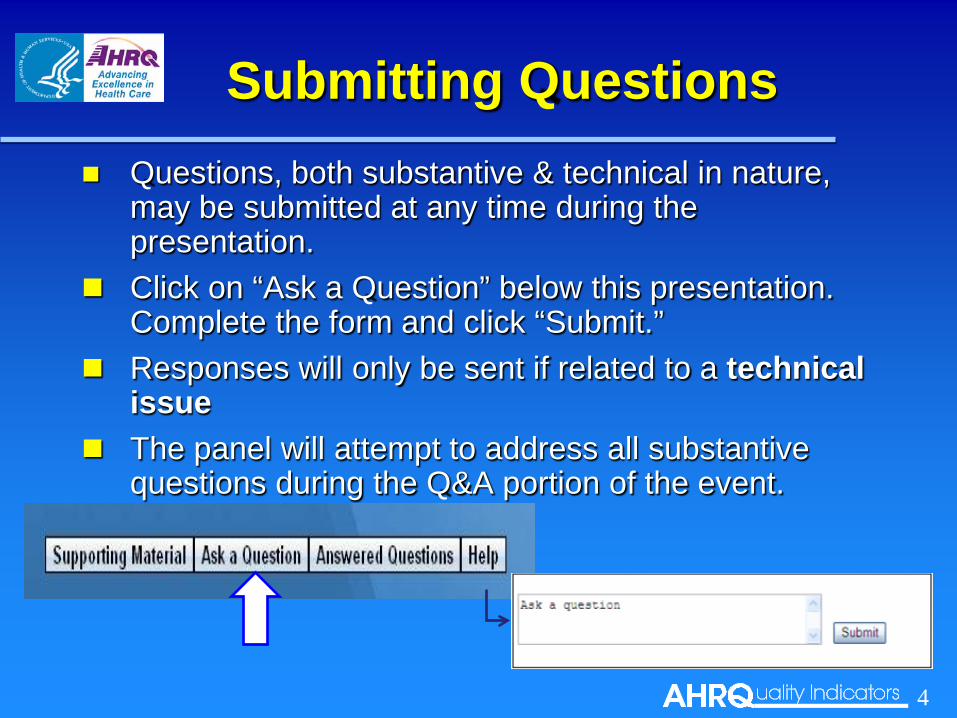
Submitting Questions Questions, both substantive & technical in nature,
may be submitted at any time during the presentation.
Click on “Ask a Question” below this presentation. Complete the form and click “Submit.”
Responses will only be sent if related to a technical issue
The panel will attempt to address all substantive questions during the Q&A portion of the event.
4
Accessing Slides
The PowerPoint presentation used during this Webinar can be found in the “Supporting Material” folder.
Click on “Supporting Material” below this presentation to access and download the PowerPoint Presentation.
5
Overview
Overview of the AHRQ QI Summary of Changes from V4.4 AHRQ QI Uses in Practice
– VA Boston Healthcare System – University HealthSystem Consortium
Questions and Evaluation
6
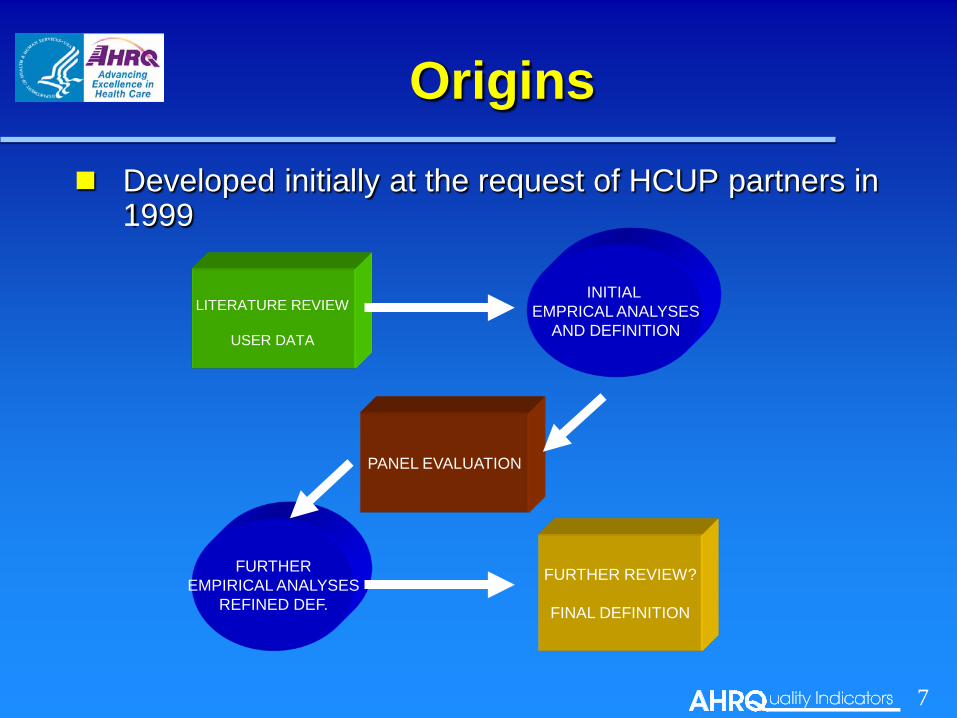
Origins
Developed initially at the request of HCUP partners in 1999
PANEL EVALUATION
FURTHER EMPIRICAL ANALYSES
REFINED DEF.
FURTHER REVIEW?
FINAL DEFINITION
INITIAL EMPRICAL ANALYSES
AND DEFINITION LITERATURE REVIEW
USER DATA
7
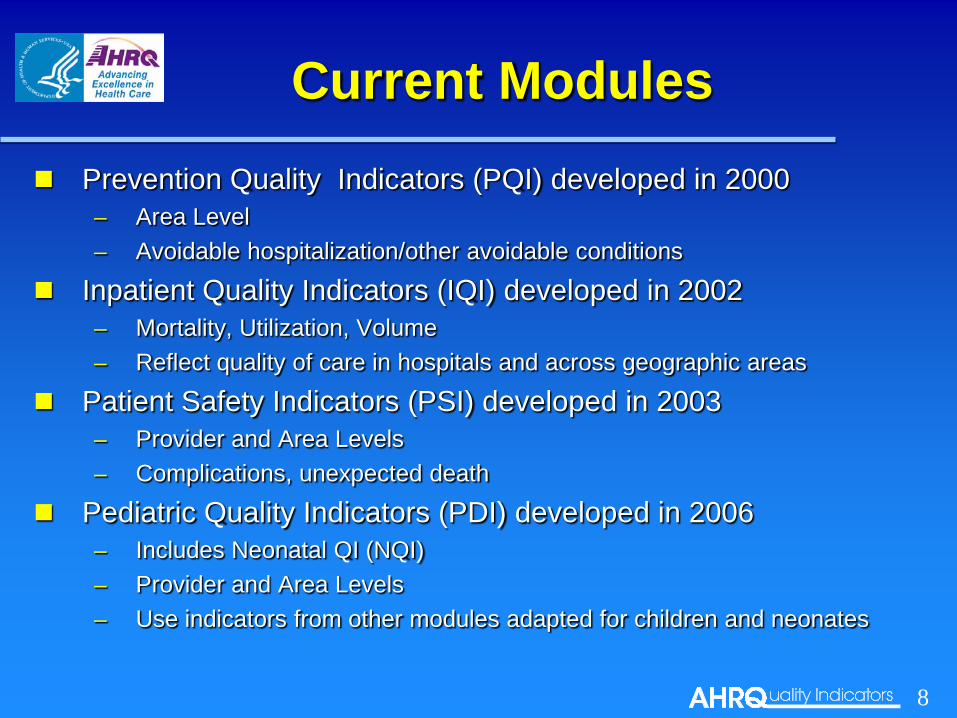
Current Modules Prevention Quality Indicators (PQI) developed in 2000
– Area Level – Avoidable hospitalization/other avoidable conditions
Inpatient Quality Indicators (IQI) developed in 2002 – Mortality, Utilization, Volume – Reflect quality of care in hospitals and across geographic areas
Patient Safety Indicators (PSI) developed in 2003 – Provider and Area Levels – Complications, unexpected death
Pediatric Quality Indicators (PDI) developed in 2006 – Includes Neonatal QI (NQI) – Provider and Area Levels – Use indicators from other modules adapted for children and neonates
8
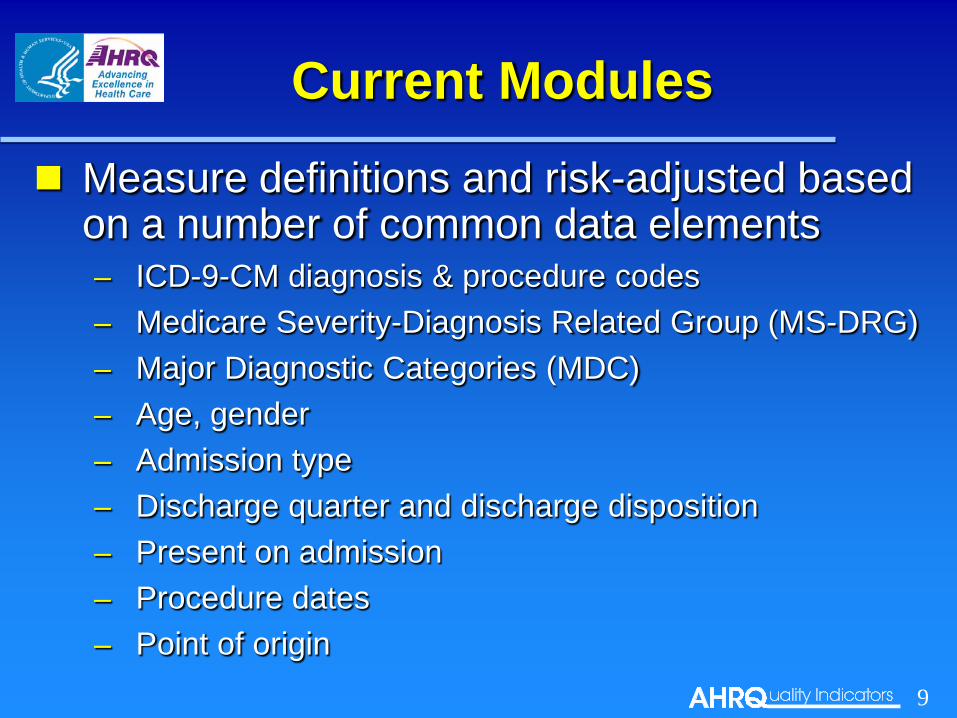
Current Modules
Measure definitions and risk-adjusted based on a number of common data elements – ICD-9-CM diagnosis & procedure codes – Medicare Severity-Diagnosis Related Group (MS-DRG) – Major Diagnostic Categories (MDC) – Age, gender – Admission type – Discharge quarter and discharge disposition – Present on admission – Procedure dates – Point of origin
9
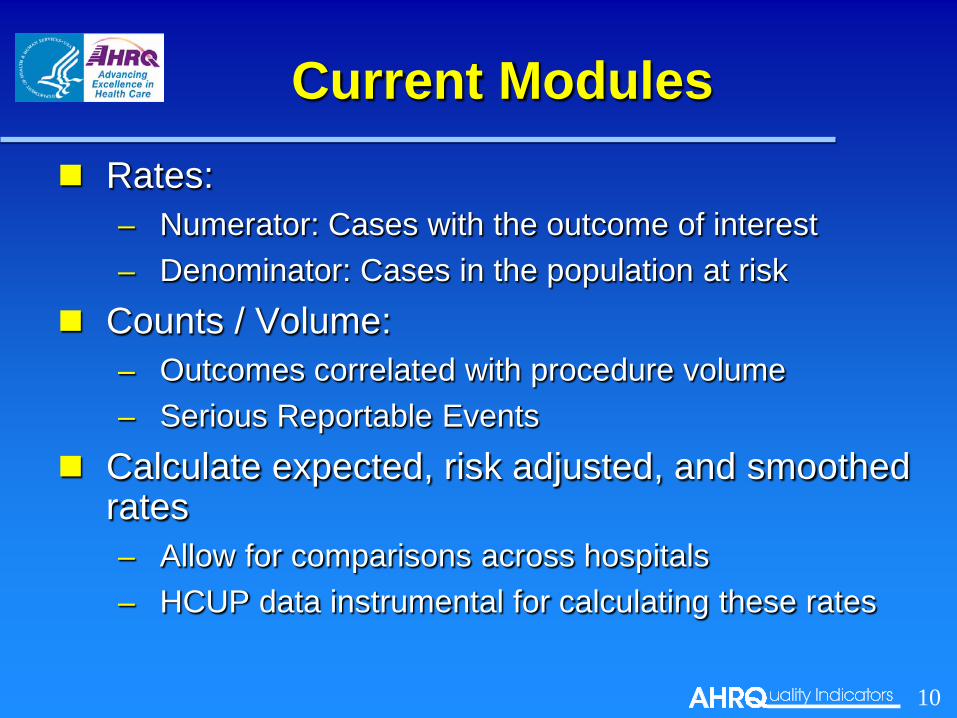
Current Modules Rates:
– Numerator: Cases with the outcome of interest – Denominator: Cases in the population at risk
Counts / Volume: – Outcomes correlated with procedure volume – Serious Reportable Events
Calculate expected, risk adjusted, and smoothed rates – Allow for comparisons across hospitals – HCUP data instrumental for calculating these rates
10
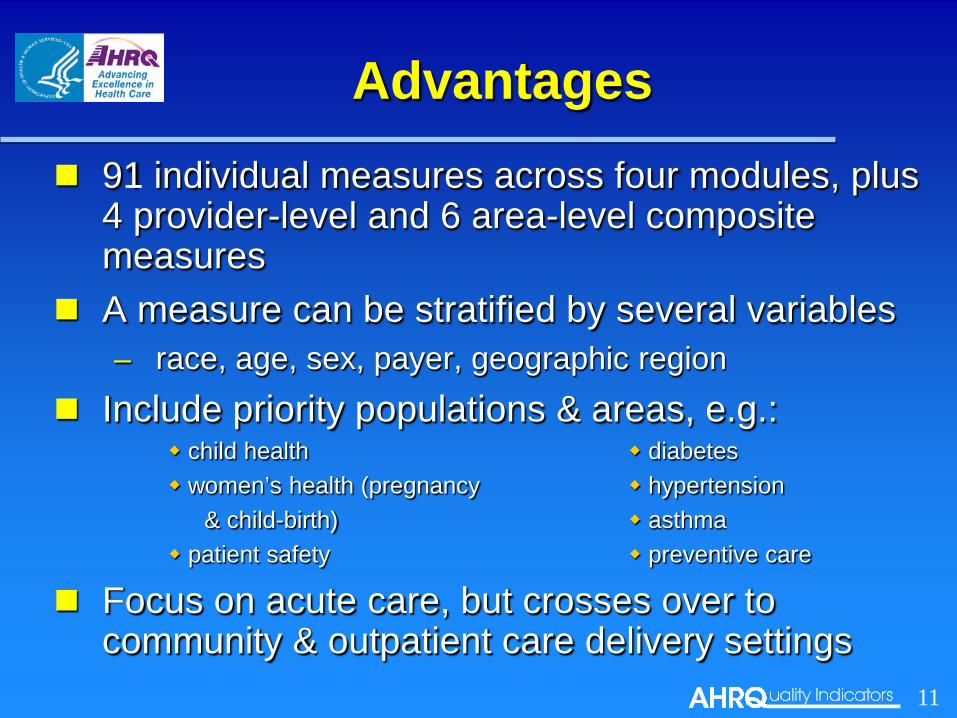
Advantages 91 individual measures across four modules, plus
4 provider-level and 6 area-level composite measures
A measure can be stratified by several variables – race, age, sex, payer, geographic region
Include priority populations & areas, e.g.: child health diabetes women’s health (pregnancy hypertension & child-birth) asthma patient safety preventive care
Focus on acute care, but crosses over to community & outpatient care delivery settings 11
Advantages
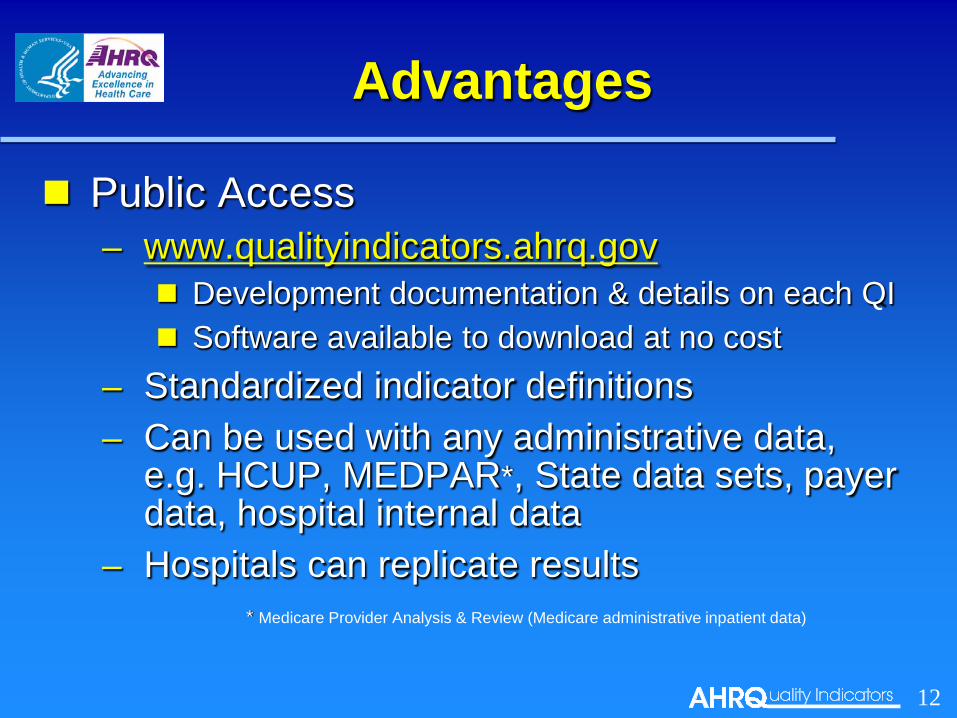
Public Access – www.qualityindicators.ahrq.gov Development documentation & details on each QI Software available to download at no cost
– Standardized indicator definitions – Can be used with any administrative data,
e.g. HCUP, MEDPAR*, State data sets, payer data, hospital internal data
– Hospitals can replicate results * Medicare Provider Analysis & Review (Medicare administrative inpatient data)
12
Advantages
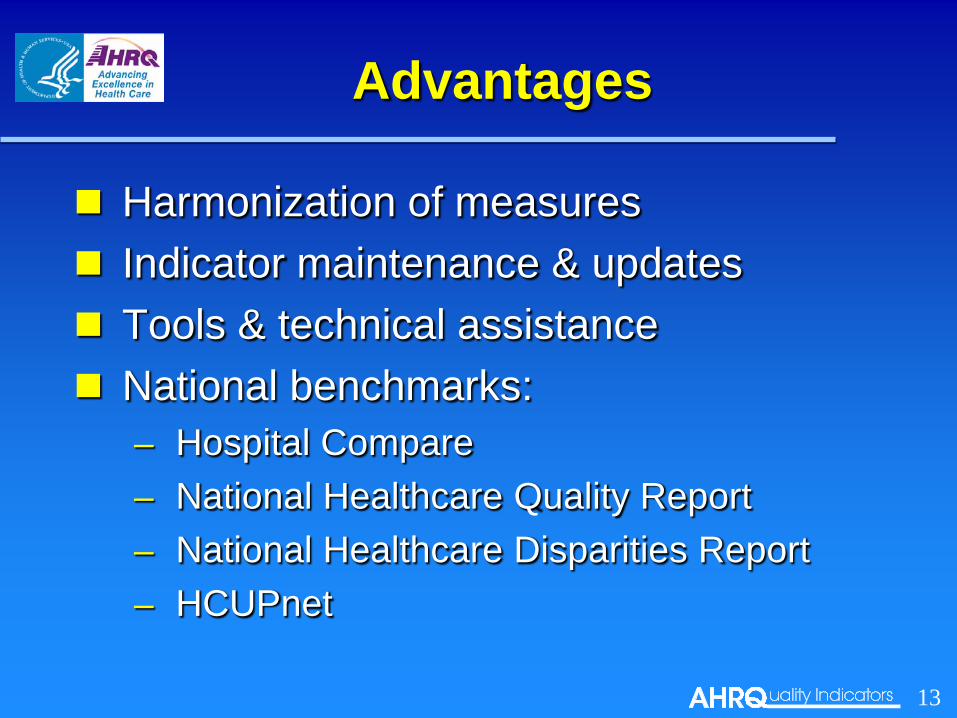
Harmonization of measures Indicator maintenance & updates Tools & technical assistance National benchmarks:
– Hospital Compare – National Healthcare Quality Report – National Healthcare Disparities Report – HCUPnet
13
Challenges
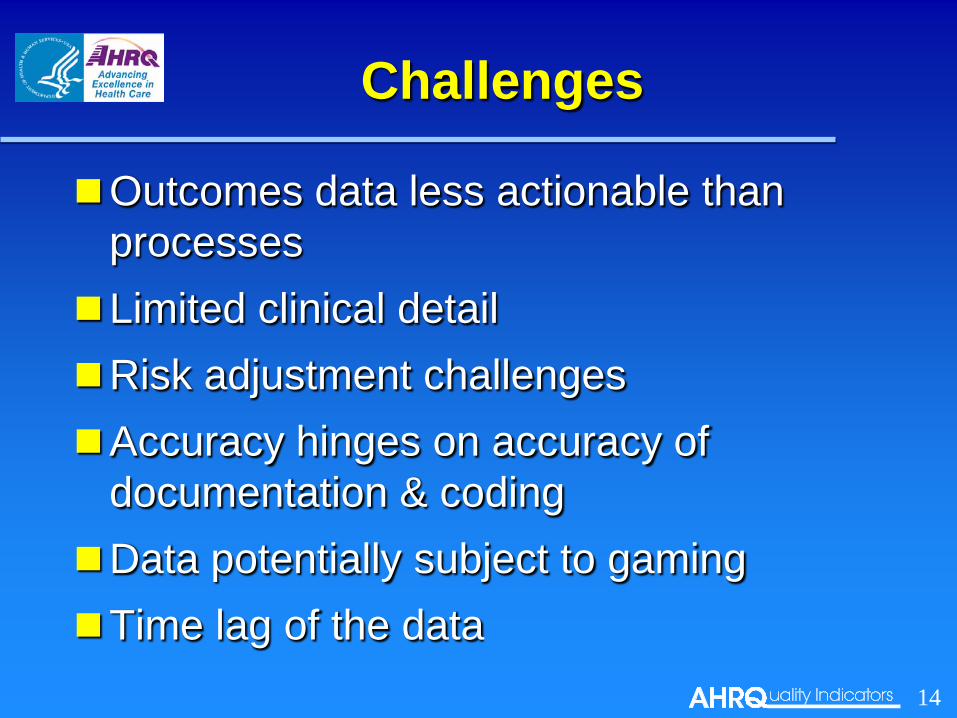
Outcomes data less actionable than processes Limited clinical detail Risk adjustment challenges Accuracy hinges on accuracy of
documentation & coding Data potentially subject to gaming Time lag of the data
14

Submitting Questions Questions, both substantive & technical in nature,
may be submitted at any time during the presentation.
Click on “Ask a Question” below this presentation. Complete the form and click “Submit.”
Responses will only be sent if related to a technical issue
The panel will attempt to address all substantive questions during the Q&A portion of the event.
15
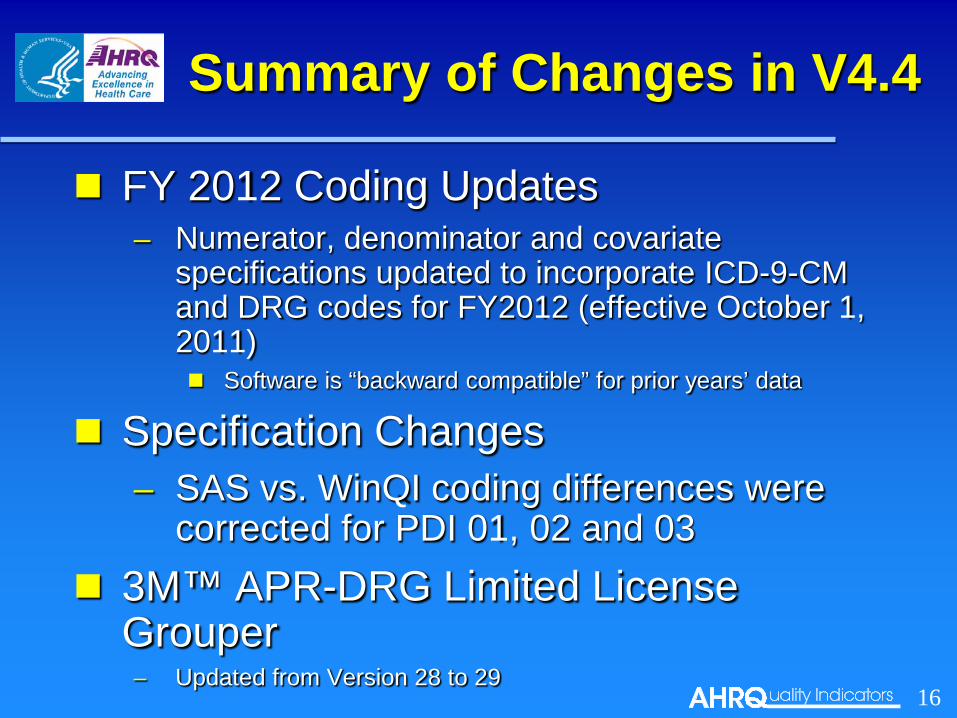
Summary of Changes in V4.4
FY 2012 Coding Updates – Numerator, denominator and covariate
specifications updated to incorporate ICD-9-CM and DRG codes for FY2012 (effective October 1, 2011) Software is “backward compatible” for prior years’ data
Specification Changes – SAS vs. WinQI coding differences were
corrected for PDI 01, 02 and 03 3M™ APR-DRG Limited License
Grouper – Updated from Version 28 to 29
16
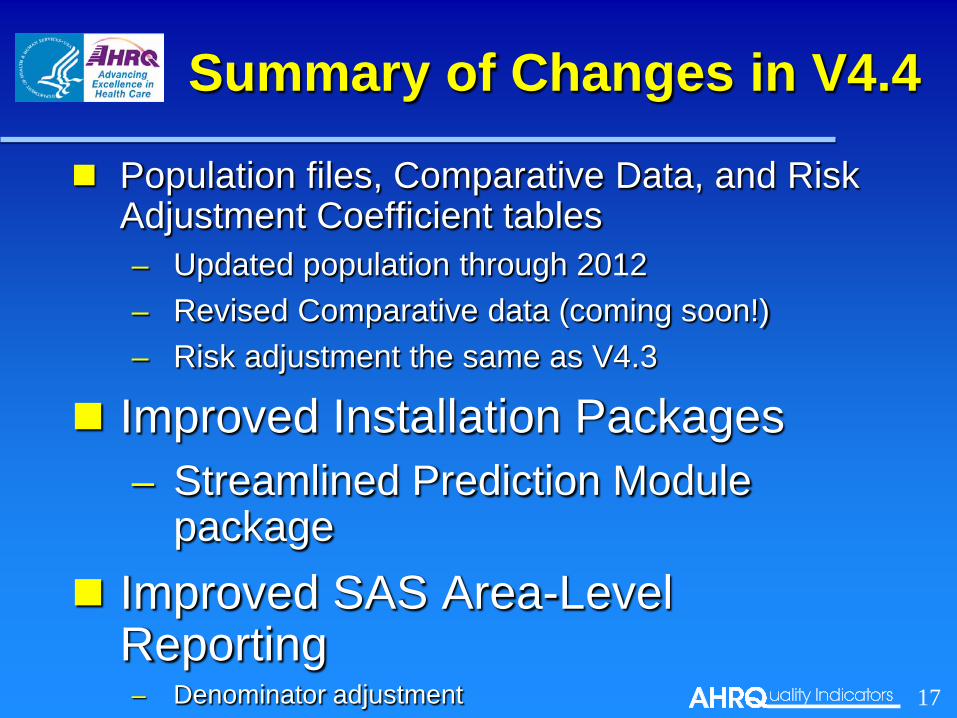
Population files, Comparative Data, and Risk Adjustment Coefficient tables – Updated population through 2012 – Revised Comparative data (coming soon!) – Risk adjustment the same as V4.3
Improved Installation Packages – Streamlined Prediction Module
package Improved SAS Area-Level
Reporting – Denominator adjustment 17
Summary of Changes in V4.4
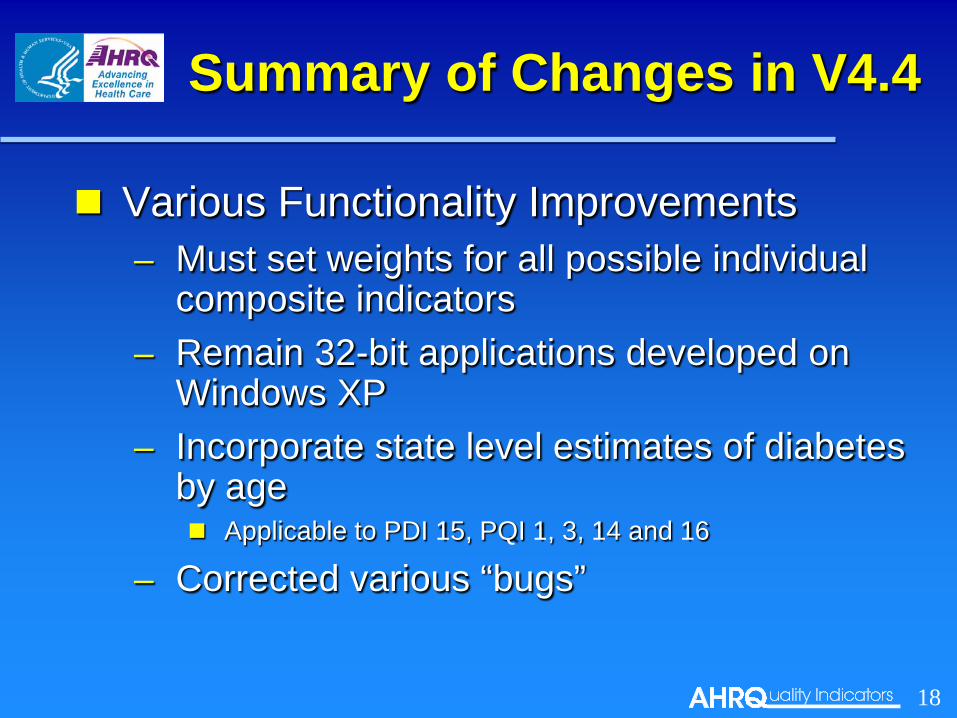
Various Functionality Improvements – Must set weights for all possible individual
composite indicators – Remain 32-bit applications developed on
Windows XP – Incorporate state level estimates of diabetes
by age Applicable to PDI 15, PQI 1, 3, 14 and 16
– Corrected various “bugs”
18
Summary of Changes in V4.4
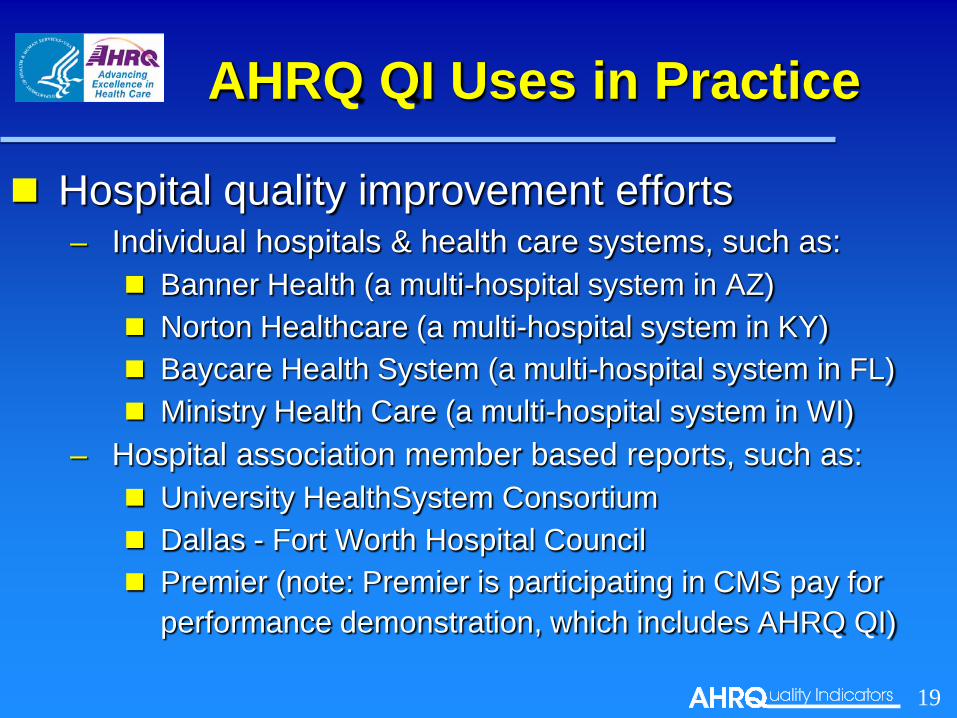
AHRQ QI Uses in Practice
Hospital quality improvement efforts – Individual hospitals & health care systems, such as:
Banner Health (a multi-hospital system in AZ) Norton Healthcare (a multi-hospital system in KY) Baycare Health System (a multi-hospital system in FL) Ministry Health Care (a multi-hospital system in WI)
– Hospital association member based reports, such as: University HealthSystem Consortium Dallas - Fort Worth Hospital Council Premier (note: Premier is participating in CMS pay for
performance demonstration, which includes AHRQ QI) 19
AHRQ QI Uses in Practice Hospital quality reporting
– Aggregate reporting: National, state, regional National Healthcare Quality / Disparities Reports Commonwealth Fund’s Health Performance Initiative
– Value based purchasing / pay for performance (P4P) CMS - Premier Demo Anthem of Virginia The Alliance (Wisconsin)
– Hospital level public reporting Statewide public reporting CMS Hospital Compare, including Veterans Affairs medical centers
– Hospital profiling: Public reporting & P4P Blue Cross / Blue Shield of Illinois
20
Ann Borzecki, MD, MPH
21
Why did we do the Virtual Breakthrough Series (VBTS)?
To learn about two things: 1. Can Patient Safety Indicators (PSIs) be used for quality
improvement? 2. Does the Virtual Breakthrough Series (VBTS) work as a
quality improvement method?
22
What is a Virtual Breakthrough Series (VBTS)
BTS: IHI developed collaborative model for improvement Key elements of BTS: 1. Topic selection 2. Faculty recruitment (expert panel) 3. Enrollment of participating facility teams 4. Change package development 5. Learning sessions - traditionally face-to-face * 6. Action periods 7. Model for improvement (PDSA cycle) 8. Summative congresses and publications (documentation of work
and presentation to non-participating organizations) 9. Measurement and evaluation
23
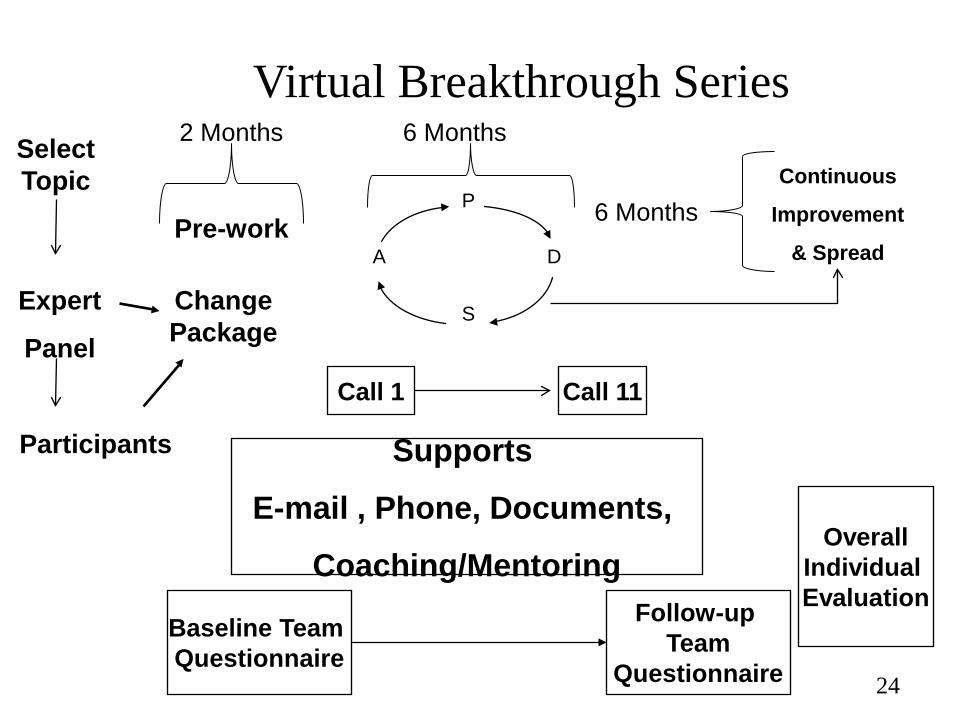
Supports
E-mail , Phone, Documents,
Coaching/Mentoring
The Virtual Breakthrough Series Select Topic
Expert
Panel
Change Package
Participants
Baseline Team Questionnaire
Follow-up Team
Questionnaire
P
S
A D
Continuous
Improvement
& Spread Pre-work
Call 1 Call 11
Overall Individual Evaluation
2 Months 6 Months
6 Months
24
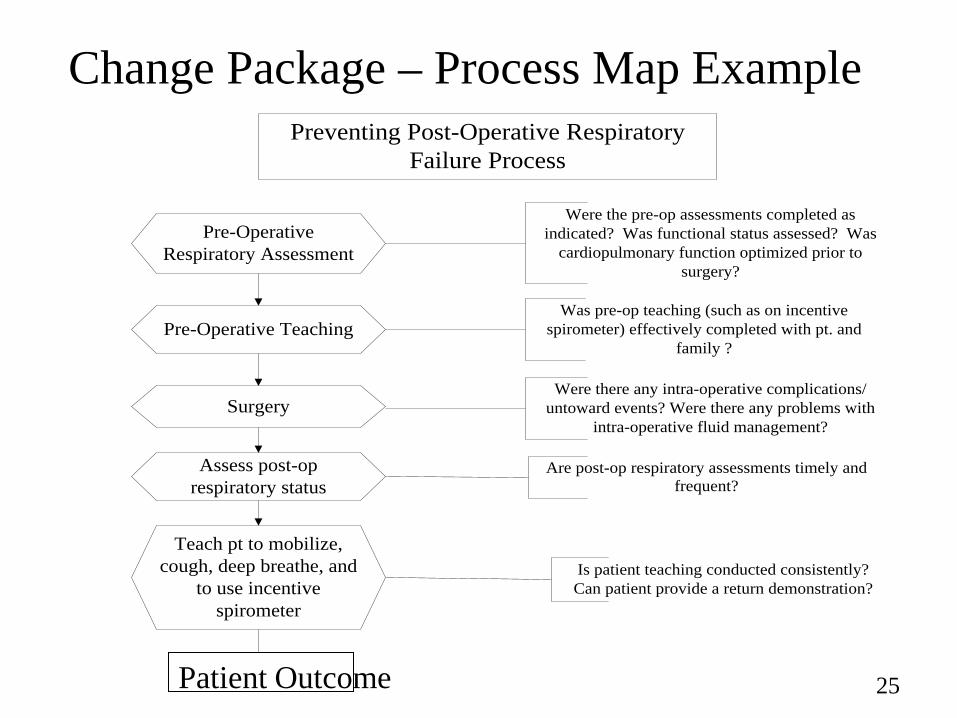
Change Package – Process Map Example Preventing Post-Operative Respiratory
Failure Process
Pre-Operative Respiratory Assessment
Surgery
Assess post-op respiratory status
Teach pt to mobilize, cough, deep breathe, and
to use incentive spirometer
Physician orders for preventive interventions
Are interventions implemented
Is patient teaching conducted consistently?Can patient provide a return demonstration?
Are post-op respiratory assessments timely and frequent?
Were there any intra-operative complications/untoward events? Were there any problems with
intra-operative fluid management?
Were the pre-op assessments completed as indicated? Was functional status assessed? Was
cardiopulmonary function optimized prior to surgery?
Pre-Operative TeachingWas pre-op teaching (such as on incentive
spirometer) effectively completed with pt. and family ?
Patient Outcome 25
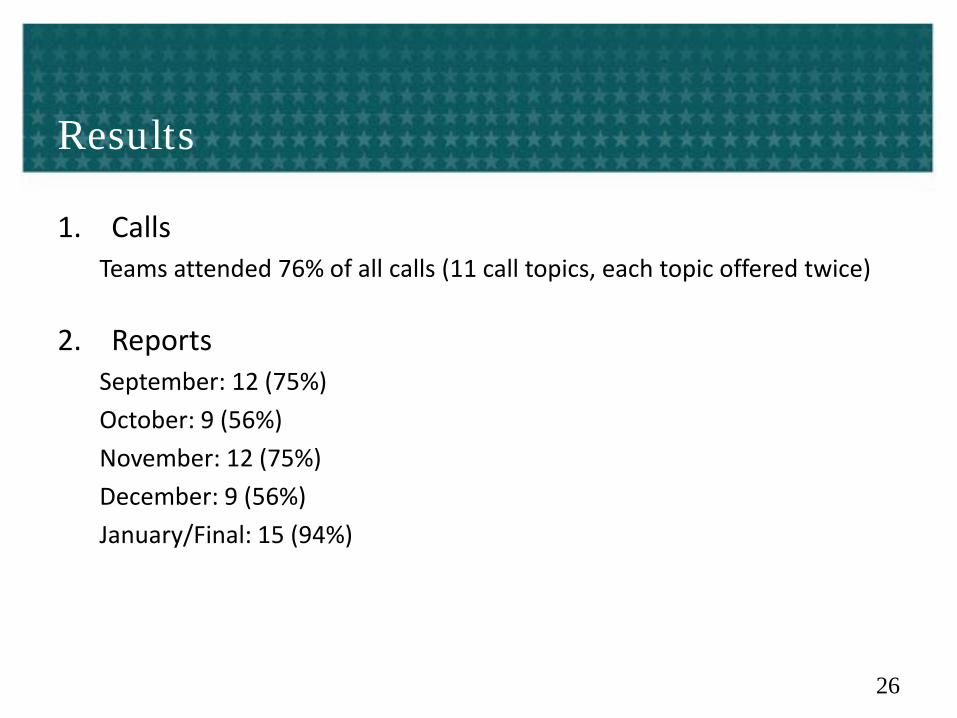
Results
1. Calls Teams attended 76% of all calls (11 call topics, each topic offered twice)
2. Reports September: 12 (75%) October: 9 (56%) November: 12 (75%) December: 9 (56%) January/Final: 15 (94%)
26
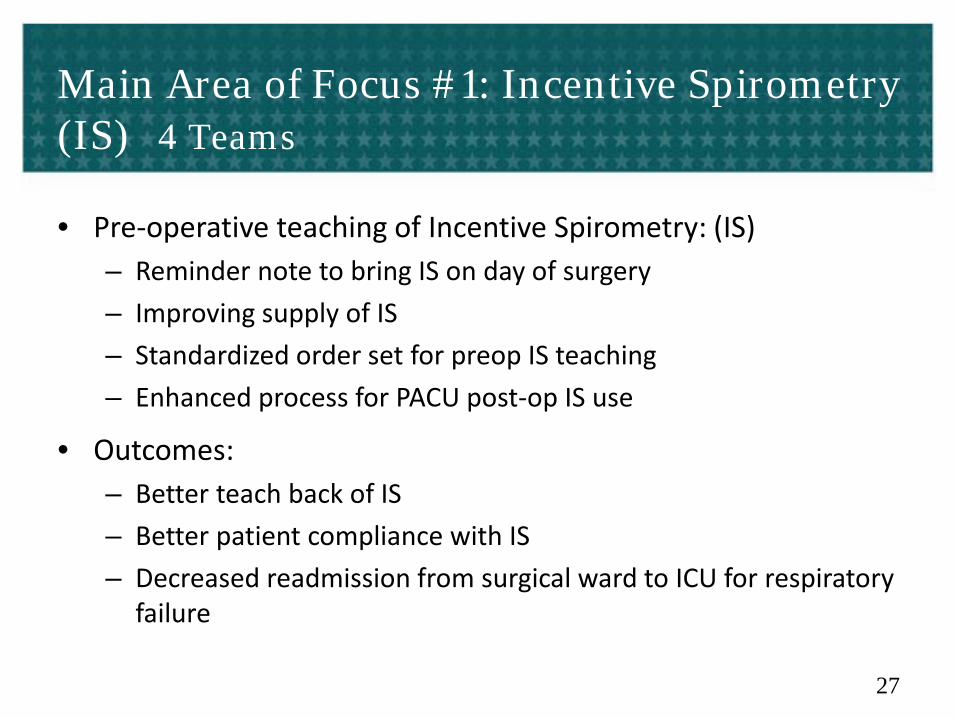
Main Area of Focus #1: Incentive Spirometry (IS) 4 Teams
• Pre-operative teaching of Incentive Spirometry: (IS) – Reminder note to bring IS on day of surgery – Improving supply of IS – Standardized order set for preop IS teaching – Enhanced process for PACU post-op IS use
• Outcomes: – Better teach back of IS – Better patient compliance with IS – Decreased readmission from surgical ward to ICU for respiratory
failure
27
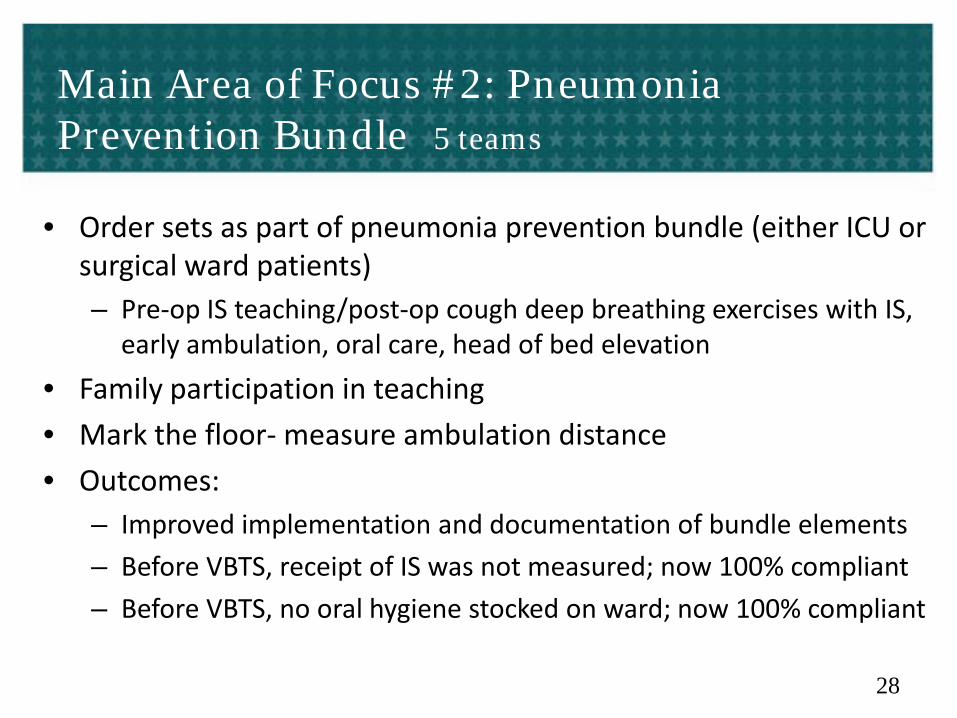
Main Area of Focus #2: Pneumonia Prevention Bundle 5 teams
• Order sets as part of pneumonia prevention bundle (either ICU or surgical ward patients) – Pre-op IS teaching/post-op cough deep breathing exercises with IS,
early ambulation, oral care, head of bed elevation • Family participation in teaching • Mark the floor- measure ambulation distance • Outcomes:
– Improved implementation and documentation of bundle elements – Before VBTS, receipt of IS was not measured; now 100% compliant – Before VBTS, no oral hygiene stocked on ward; now 100% compliant
28
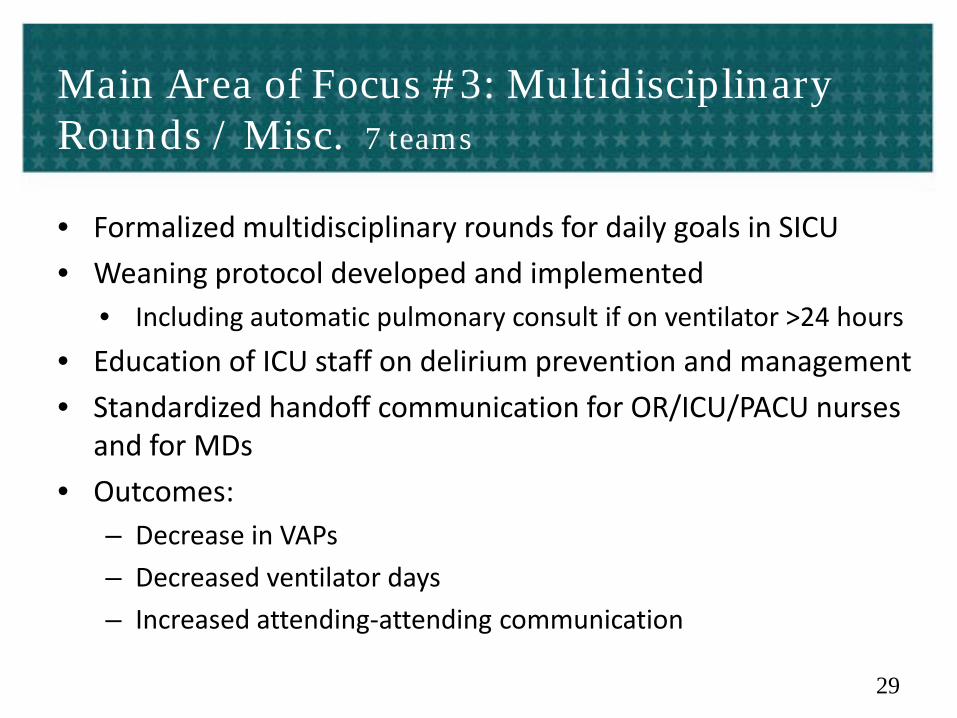
Main Area of Focus #3: Multidisciplinary Rounds / Misc. 7 teams
• Formalized multidisciplinary rounds for daily goals in SICU • Weaning protocol developed and implemented
• Including automatic pulmonary consult if on ventilator >24 hours • Education of ICU staff on delirium prevention and management • Standardized handoff communication for OR/ICU/PACU nurses
and for MDs • Outcomes:
– Decrease in VAPs – Decreased ventilator days – Increased attending-attending communication
29
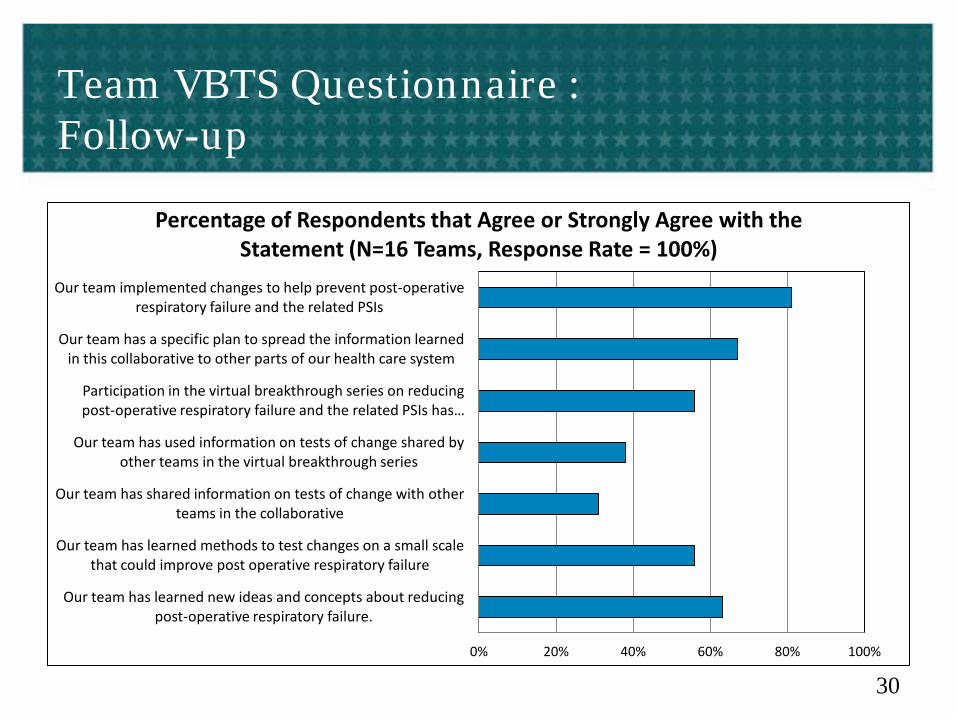
Team VBTS Questionnaire : Follow-up
0% 20% 40% 60% 80% 100%
Our team has learned new ideas and concepts about reducing post-operative respiratory failure.
Our team has learned methods to test changes on a small scale that could improve post operative respiratory failure
Our team has shared information on tests of change with other teams in the collaborative
Our team has used information on tests of change shared by other teams in the virtual breakthrough series
Participation in the virtual breakthrough series on reducing post-operative respiratory failure and the related PSIs has …
Our team has a specific plan to spread the information learned in this collaborative to other parts of our health care system
Our team implemented changes to help prevent post-operative respiratory failure and the related PSIs
Percentage of Respondents that Agree or Strongly Agree with the Statement (N=16 Teams, Response Rate = 100%)
30
What Now?
• Reaffirm leadership support • Team commitment & ownership of project • Standardize processes implemented during the VBTS • Use documentation (templates, checklists) • Continue data collection • Provide feedback to leadership
31
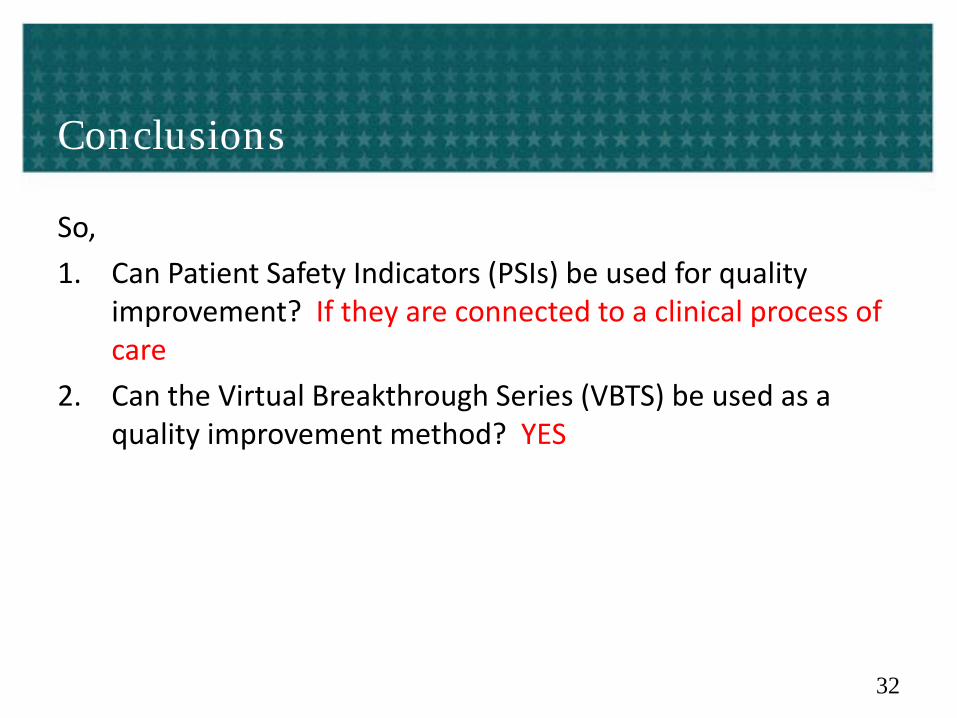
Conclusions
So, 1. Can Patient Safety Indicators (PSIs) be used for quality
improvement? If they are connected to a clinical process of care
2. Can the Virtual Breakthrough Series (VBTS) be used as a quality improvement method? YES
32
© 2011 UHC. All rights reserved.
UHC and UHC Member’s Focus on Improving the Patient Safety Indicators Julie Cerese Vice President, Performance Improvement Leslie Prellwitz Director, Analytics
33
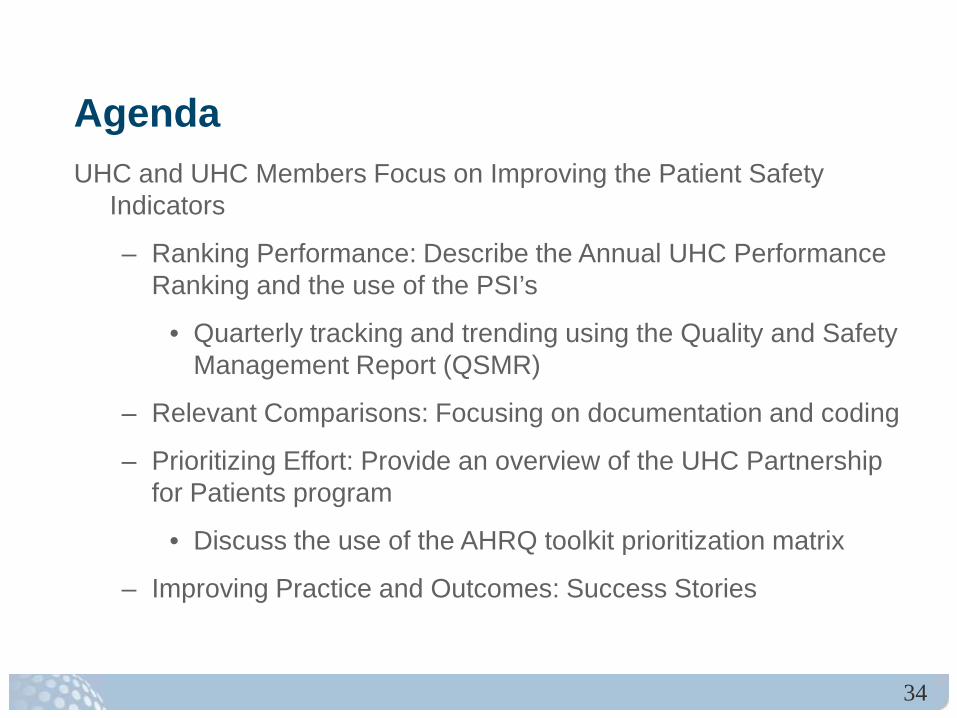
Agenda UHC and UHC Members Focus on Improving the Patient Safety
Indicators
– Ranking Performance: Describe the Annual UHC Performance Ranking and the use of the PSI’s
• Quarterly tracking and trending using the Quality and Safety Management Report (QSMR)
– Relevant Comparisons: Focusing on documentation and coding
– Prioritizing Effort: Provide an overview of the UHC Partnership for Patients program
• Discuss the use of the AHRQ toolkit prioritization matrix
– Improving Practice and Outcomes: Success Stories
34
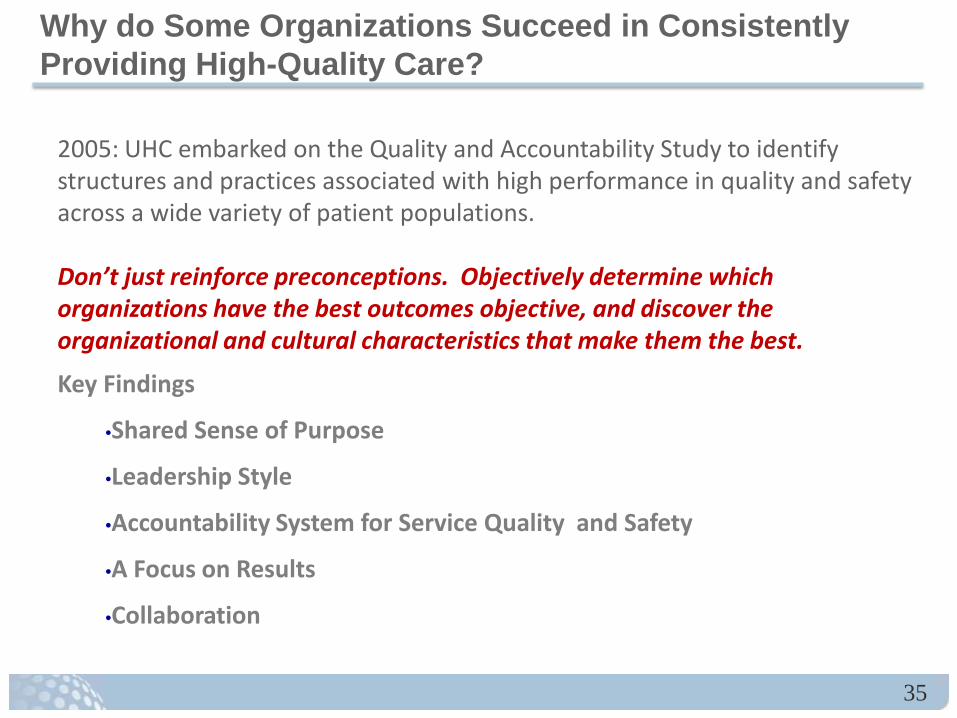
Why do Some Organizations Succeed in Consistently Providing High-Quality Care?
2005: UHC embarked on the Quality and Accountability Study to identify structures and practices associated with high performance in quality and safety across a wide variety of patient populations.
Don’t just reinforce preconceptions. Objectively determine which organizations have the best outcomes objective, and discover the organizational and cultural characteristics that make them the best.
Key Findings
•Shared Sense of Purpose
•Leadership Style
•Accountability System for Service Quality and Safety
•A Focus on Results
•Collaboration
35
What happened as a result of the 2005 study?
• Senior leaders started to think about quality differently
• Over 30 organizations have some type of event to present these findings to senior administrative and physician leaders
• Published in Academic Medicine in 2007, recognition that organizational style and characteristics drive clinical outcomes
• Intense focus on improvement
• Senior leaders receive an annual scorecard of their individual organizational performance on these metrics 36
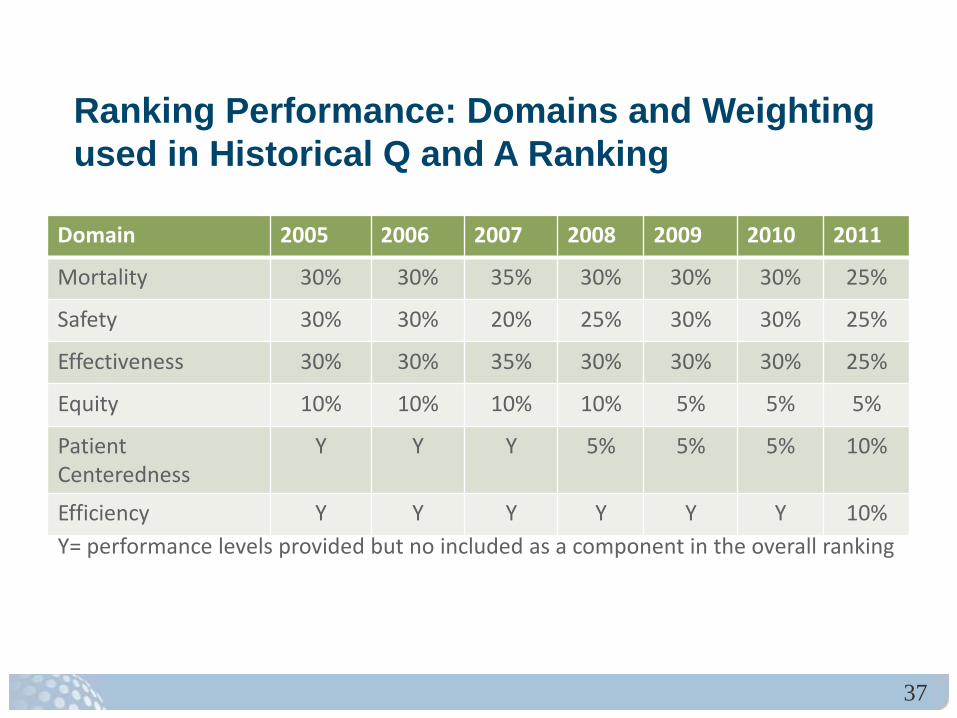
Ranking Performance: Domains and Weighting used in Historical Q and A Ranking
Domain 2005 2006 2007 2008 2009 2010 2011
Mortality 30% 30% 35% 30% 30% 30% 25%
Safety 30% 30% 20% 25% 30% 30% 25%
Effectiveness 30% 30% 35% 30% 30% 30% 25%
Equity 10% 10% 10% 10% 5% 5% 5%
Patient Centeredness
Y Y Y 5% 5% 5% 10%
Efficiency Y Y Y Y Y Y 10% Y= performance levels provided but no included as a component in the overall ranking
37
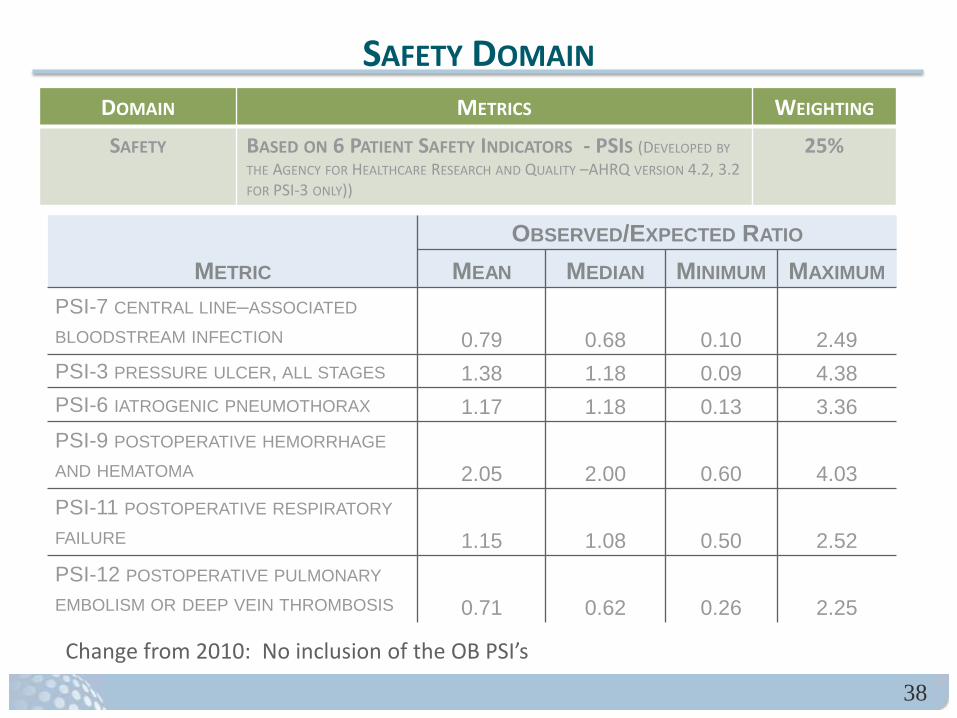
METRIC OBSERVED/EXPECTED RATIO
MEAN MEDIAN MINIMUM MAXIMUM PSI-7 CENTRAL LINE–ASSOCIATED BLOODSTREAM INFECTION 0.79 0.68 0.10 2.49 PSI-3 PRESSURE ULCER, ALL STAGES 1.38 1.18 0.09 4.38 PSI-6 IATROGENIC PNEUMOTHORAX 1.17 1.18 0.13 3.36 PSI-9 POSTOPERATIVE HEMORRHAGE AND HEMATOMA 2.05 2.00 0.60 4.03 PSI-11 POSTOPERATIVE RESPIRATORY FAILURE 1.15 1.08 0.50 2.52 PSI-12 POSTOPERATIVE PULMONARY EMBOLISM OR DEEP VEIN THROMBOSIS 0.71 0.62 0.26 2.25
SAFETY DOMAIN DOMAIN METRICS WEIGHTING SAFETY BASED ON 6 PATIENT SAFETY INDICATORS - PSIS (DEVELOPED BY
THE AGENCY FOR HEALTHCARE RESEARCH AND QUALITY –AHRQ VERSION 4.2, 3.2 FOR PSI-3 ONLY))
25%
Change from 2010: No inclusion of the OB PSI’s
38
Relevant Comparisons: Documentation Guideline Development Project
• Develop consensus guidelines for documenting PSIs and HACs • Compliant with national definitions and existing guidelines
• Provide consistent interpretation in areas of uncertainty
• Promote standardized reporting across members
• Enhance the accuracy and comparability of data
39
Guideline Development Process
• Literature review • Definitions, existing guidelines, data
analysis • Develop draft guideline
• Monthly conference calls • Ongoing networking via listserver
• Members submit comments on draft guideline • Final guideline published:
• ICD-9 coding decision matrix • ICD-10 issues
• Ongoing education and training
40
In Support of the HHS 3 Part Aim: The CMS Partnership for Patients is Focused on 2 Goals
• Keep patients from getting injured or sicker. By the end of 2013, preventable hospital-acquired conditions will decrease by 40% compared to 2010.
• Help patients heal without complication. By the end of 2013, preventable complications during a transition from one care setting to another will be decreased so that all hospital readmissions would be reduced by 20% compared to 2010.
The combined efforts of this partnership have the potential to save 60,000 American lives and to save as
much as $35 billion, including up to $10 billion in Medicare savings.
41
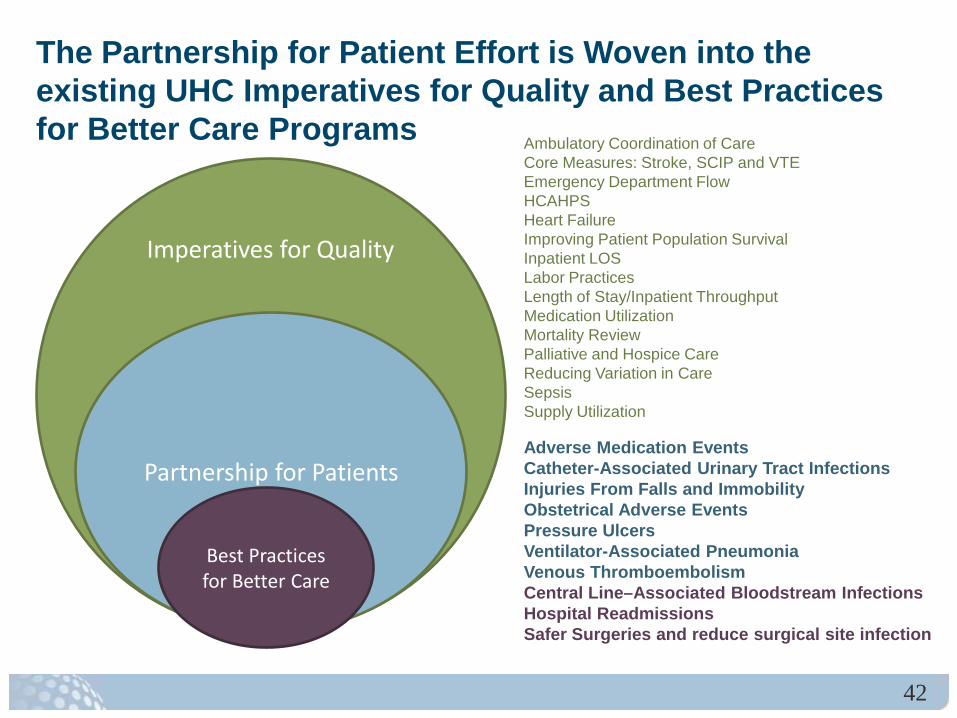
The Partnership for Patient Effort is Woven into the existing UHC Imperatives for Quality and Best Practices for Better Care Programs Ambulatory Coordination of Care
Core Measures: Stroke, SCIP and VTE Emergency Department Flow HCAHPS Heart Failure Improving Patient Population Survival Inpatient LOS Labor Practices Length of Stay/Inpatient Throughput Medication Utilization Mortality Review Palliative and Hospice Care Reducing Variation in Care Sepsis Supply Utilization Adverse Medication Events Catheter-Associated Urinary Tract Infections Injuries From Falls and Immobility Obstetrical Adverse Events Pressure Ulcers Ventilator-Associated Pneumonia Venous Thromboembolism Central Line–Associated Bloodstream Infections Hospital Readmissions Safer Surgeries and reduce surgical site infection
Imperatives for Quality
Partnership for Patients
Best Practices for Better Care
42
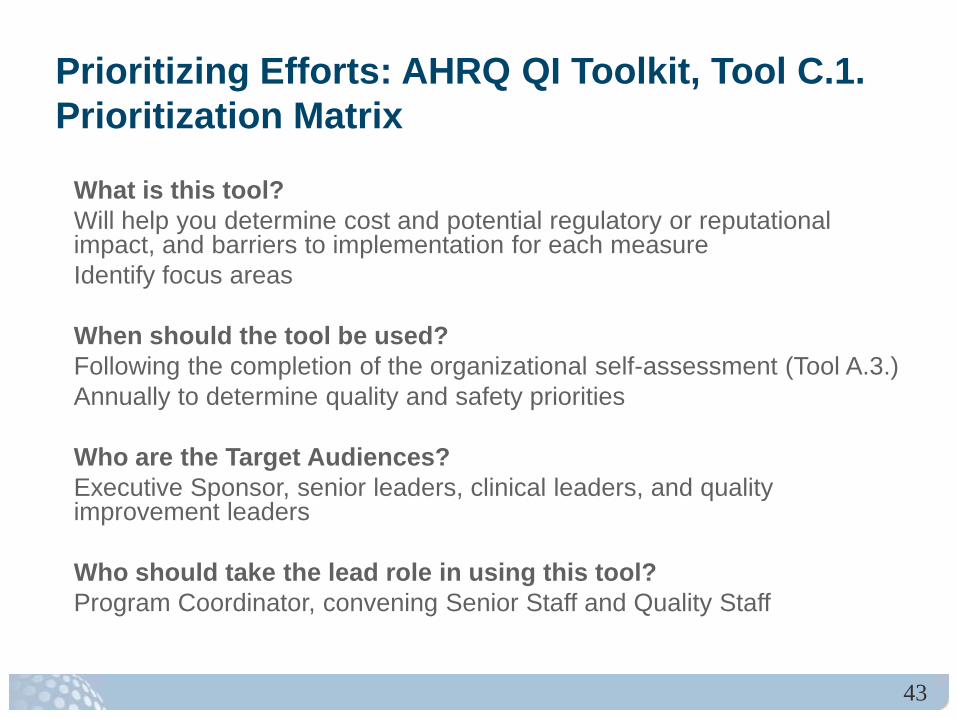
Prioritizing Efforts: AHRQ QI Toolkit, Tool C.1. Prioritization Matrix
What is this tool? Will help you determine cost and potential regulatory or reputational impact, and barriers to implementation for each measure Identify focus areas When should the tool be used? Following the completion of the organizational self-assessment (Tool A.3.) Annually to determine quality and safety priorities Who are the Target Audiences? Executive Sponsor, senior leaders, clinical leaders, and quality improvement leaders Who should take the lead role in using this tool? Program Coordinator, convening Senior Staff and Quality Staff
43
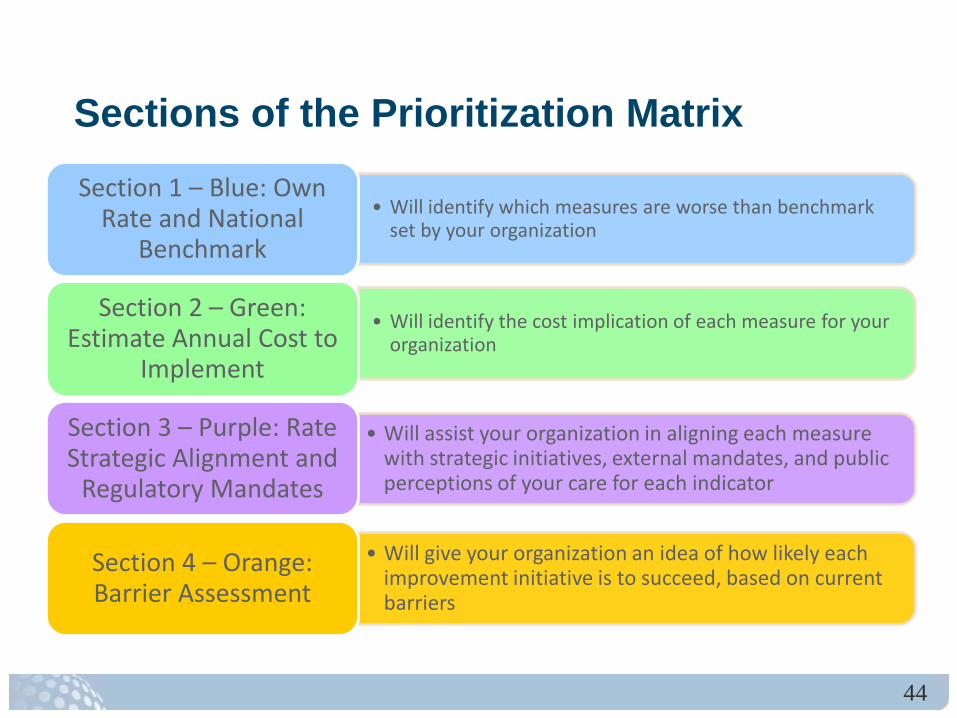
Sections of the Prioritization Matrix
• Will identify which measures are worse than benchmark set by your organization
Section 1 – Blue: Own Rate and National
Benchmark
• Will identify the cost implication of each measure for your organization
Section 2 – Green: Estimate Annual Cost to
Implement
• Will assist your organization in aligning each measure with strategic initiatives, external mandates, and public perceptions of your care for each indicator
Section 3 – Purple: Rate Strategic Alignment and
Regulatory Mandates
• Will give your organization an idea of how likely each improvement initiative is to succeed, based on current barriers
Section 4 – Orange: Barrier Assessment
44
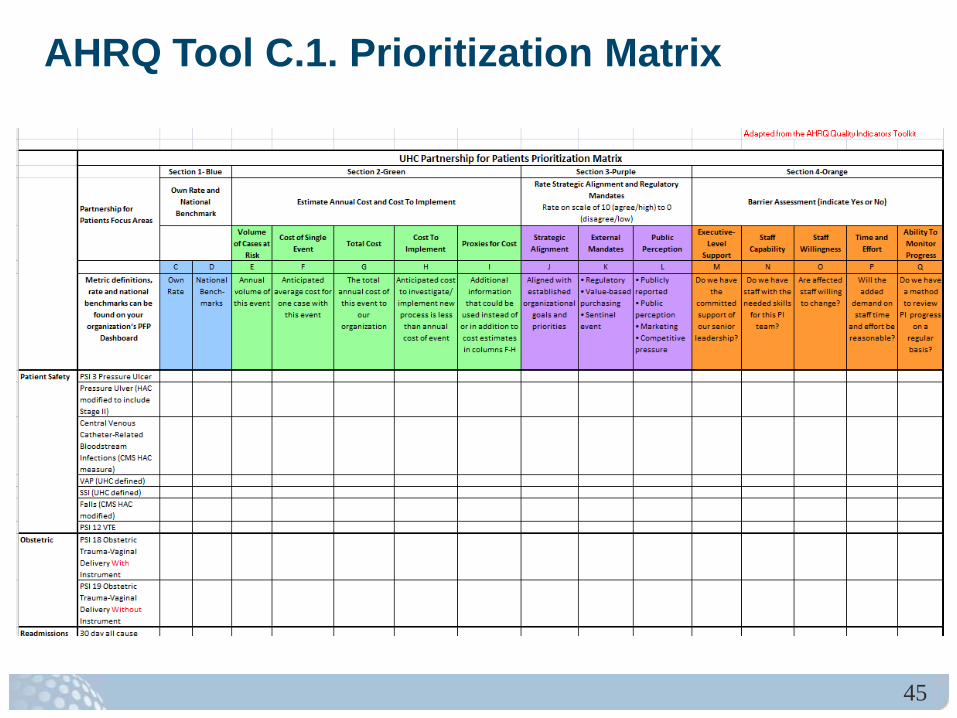
AHRQ Tool C.1. Prioritization Matrix
45
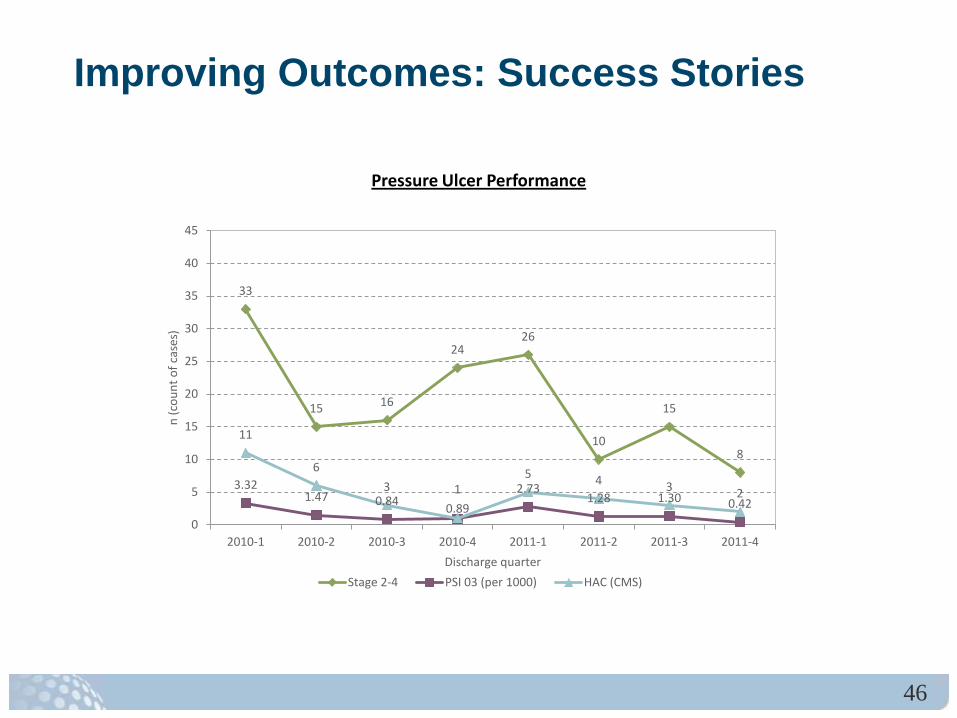
Improving Outcomes: Success Stories
33
15 16
24 26
10
15
8
3.32 1.47 0.84 0.89
2.73 1.28 1.30 0.42
11
6 3 1
5 4 3 2
0
5
10
15
20
25
30
35
40
45
2010-1 2010-2 2010-3 2010-4 2011-1 2011-2 2011-3 2011-4
n (c
ount
of c
ases
)
Discharge quarter
Pressure Ulcer Performance
Stage 2-4 PSI 03 (per 1000) HAC (CMS)
46
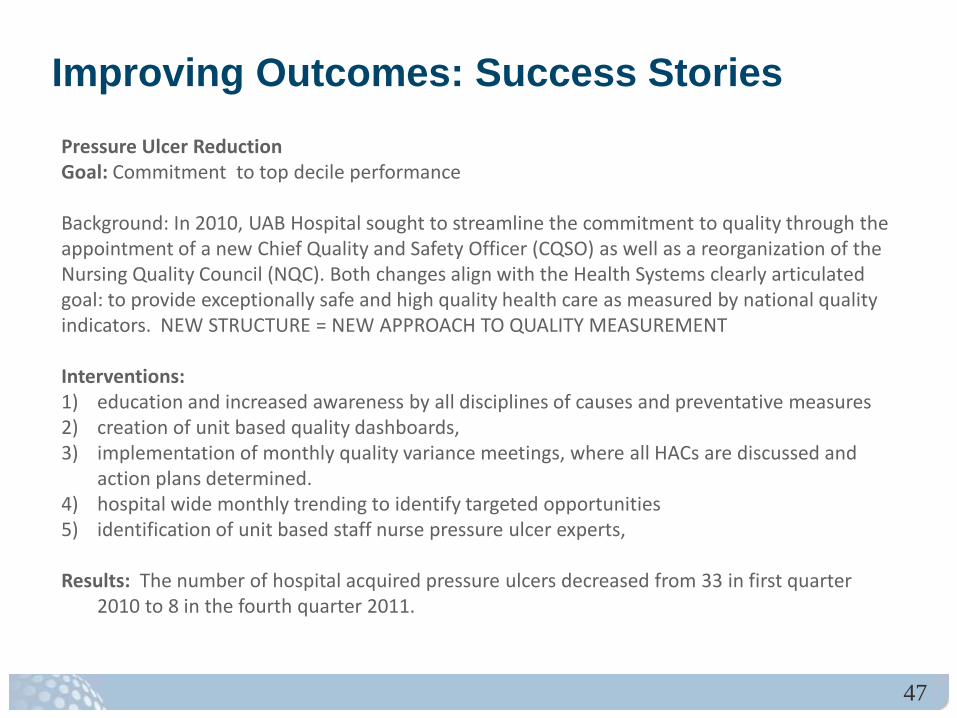
Improving Outcomes: Success Stories Pressure Ulcer Reduction Goal: Commitment to top decile performance Background: In 2010, UAB Hospital sought to streamline the commitment to quality through the appointment of a new Chief Quality and Safety Officer (CQSO) as well as a reorganization of the Nursing Quality Council (NQC). Both changes align with the Health Systems clearly articulated goal: to provide exceptionally safe and high quality health care as measured by national quality indicators. NEW STRUCTURE = NEW APPROACH TO QUALITY MEASUREMENT Interventions: 1) education and increased awareness by all disciplines of causes and preventative measures 2) creation of unit based quality dashboards, 3) implementation of monthly quality variance meetings, where all HACs are discussed and
action plans determined. 4) hospital wide monthly trending to identify targeted opportunities 5) identification of unit based staff nurse pressure ulcer experts,
Results: The number of hospital acquired pressure ulcers decreased from 33 in first quarter
2010 to 8 in the fourth quarter 2011.
47

Submitting Questions Questions, both substantive & technical in nature,
may be submitted at any time during the presentation.
Click on “Ask a Question” below this presentation. Complete the form and click “Submit.”
Responses will only be sent if related to a technical issue
The panel will attempt to address all substantive questions during the Q&A portion of the event.
48
Evaluation Questions
Please click on the “Evaluation” button below the slides to answer these four questions. How will/do you/your organization use the AHRQ
QI in practice? What future AHRQ QI Webinar topics would be
most useful for you/your organization? Are there additional improvements you
recommend to the QI? Please provide any additional feedback.
49
Additional Resources
Additional Resources Web site: http://qualityindicators.ahrq.gov
– QI documentation and software available
– Sign up for AHRQ QI listserv
Support E-mail: [email protected]
Support Phone: (888) 512-6090 (voicemail)
Staff: [email protected]
50