Embed Size (px)
Citation preview
Ahmed Helmy, USC 1
State Analysis and Aggregation for Multicast-based Micro Mobility
Ahmed Helmy
Electrical Engineering Department
University of Southern [email protected]
http://ceng.usc.edu/~helmy
Ahmed Helmy, USC 2
Outline• Motivation
– Multicast-based Mobility (M&M)
• Intra-domain M&M for micro-mobility
• Scalability Issues and State Aggregation
• Approaches to State Aggregation– prefix vs. bit-wise– perfect vs. leaky
• Performance Analysis
• Conclusions
Ahmed Helmy, USC 3
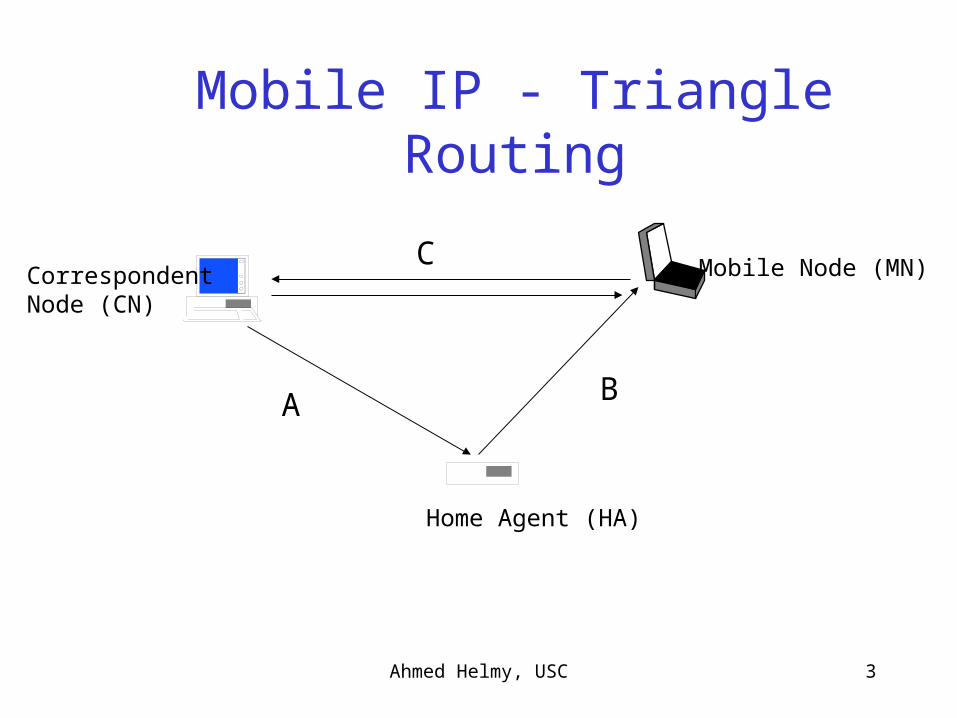
Home Agent (HA)
CorrespondentNode (CN)
Mobile Node (MN)
Mobile IP - Triangle Routing
A B
C
Ahmed Helmy, USC 4
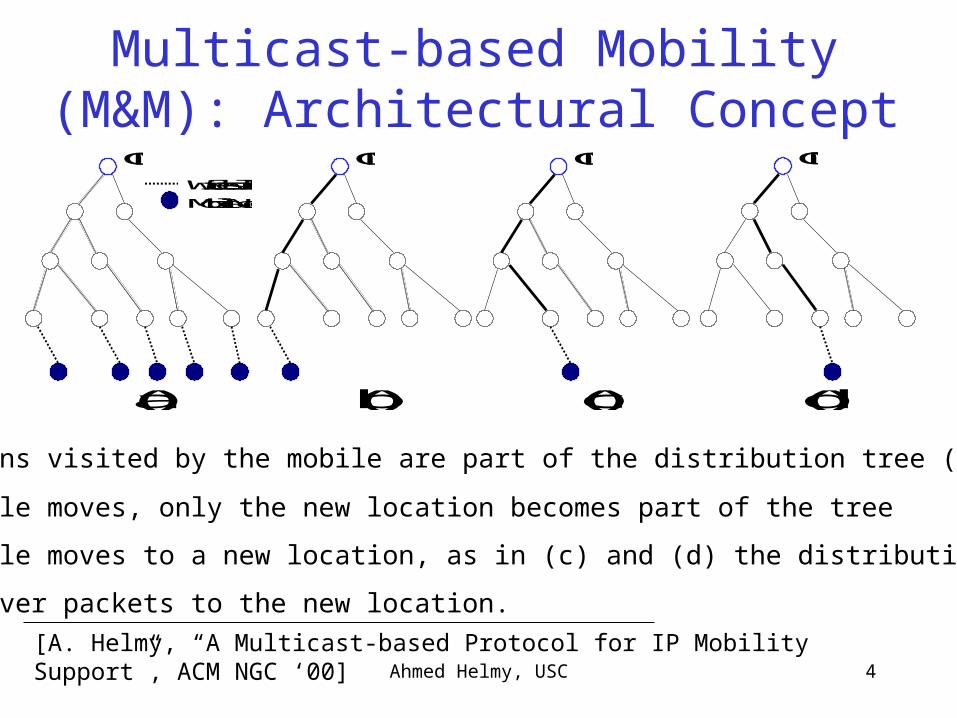
CN
Wireless link
Mobile Node
CN
CN
CN
(a) (b) (c) (d)
(a) All locations visited by the mobile are part of the distribution tree (at some point)
(b) When a mobile moves, only the new location becomes part of the tree
- When the mobile moves to a new location, as in (c) and (d) the distribution tree
changes to deliver packets to the new location.
Multicast-based Mobility (M&M): Architectural Concept
[A. Helmy, “A Multicast-based Protocol for IP Mobility Support”, ACM NGC ‘00]
Ahmed Helmy, USC 5
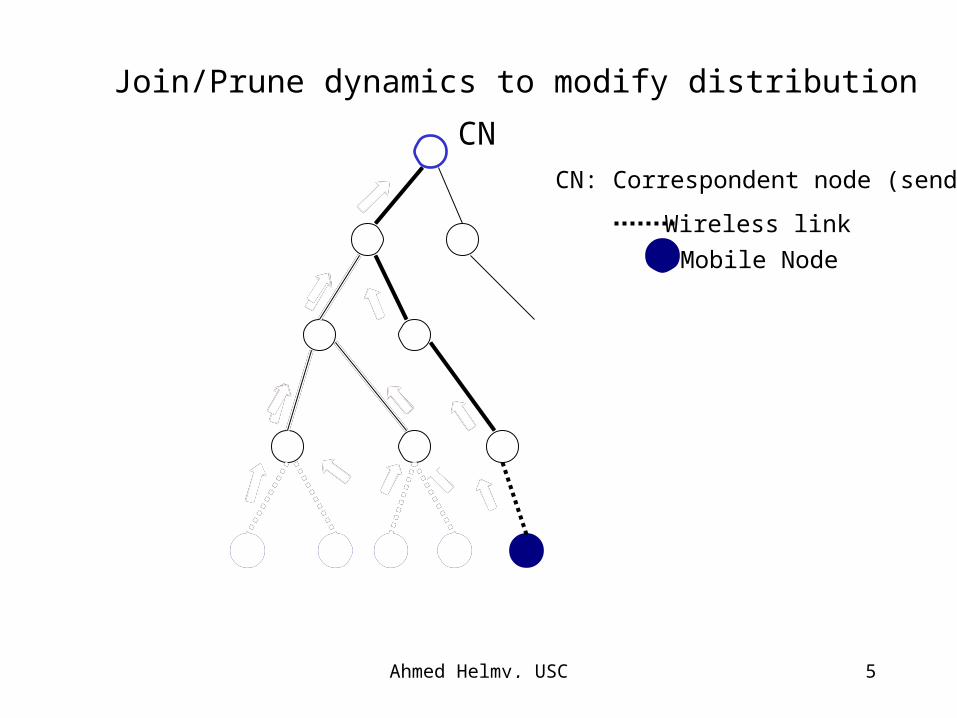
Join/Prune dynamics to modify distribution
CNCN: Correspondent node (sender)
Wireless link
Mobile Node
Ahmed Helmy, USC 6
0
5000
10000
15000
20000
25000
30000
35000
r 50
r 100
r 150
r 200
r 250
ts 50
ts 10
0
ts 15
0
ts 20
0
ts 25
0
ts 30
0
ts 10
00
ts 10
08_1
ts 10
08_2
ts 10
08_3
ti 100
0
ti 500
0ARPA
Mbo
ne_1
Mbo
ne_2 AS
Topology
Nu
mb
er
of
link
s
A+B, Random
A+B, Neighbor
A+B, Cluster
Average
0
2000
4000
6000
8000
10000
12000
14000
16000
r 50
r 100
r 150
r 200
r 250
ts 50
ts 10
0
ts 15
0
ts 20
0
ts 25
0
ts 30
0
ts 10
00
ts 10
08_1
ts 10
08_2
ts 10
08_3
ti 100
0
ti 500
0ARPA
Mbo
ne_1
Mbo
ne_2 AS
Topology
Nu
mb
er o
f lin
ks
C, Random
C, Neighbor
C, Cluster
Average
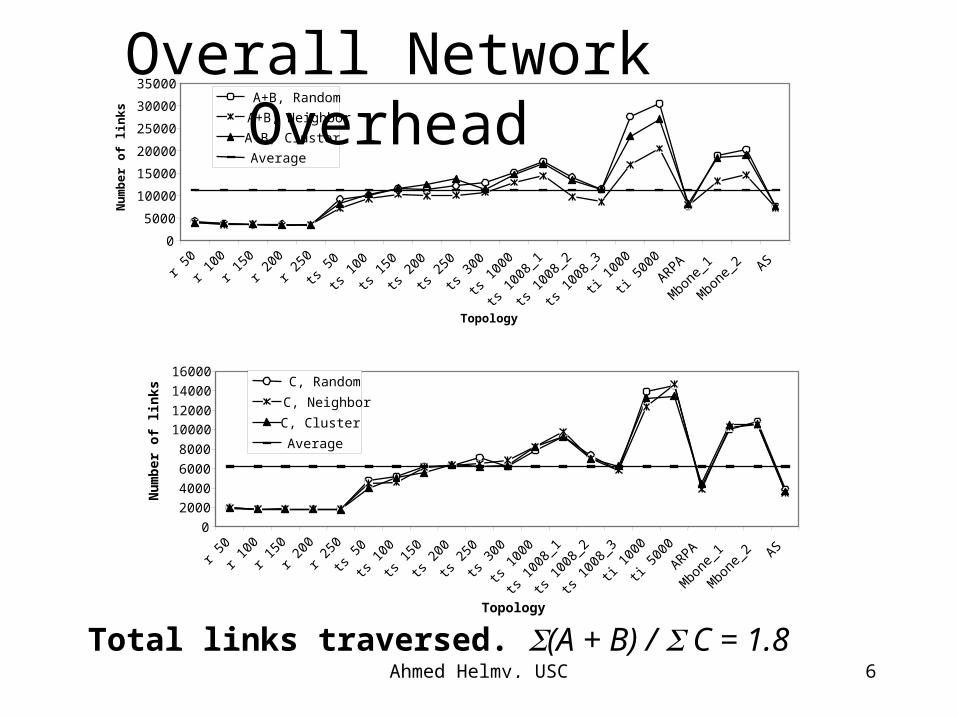
Total links traversed. (A + B) / C = 1.8
Overall Network Overhead
Ahmed Helmy, USC 7
1
1.5
2
2.5
3
3.5
4
4.5
5
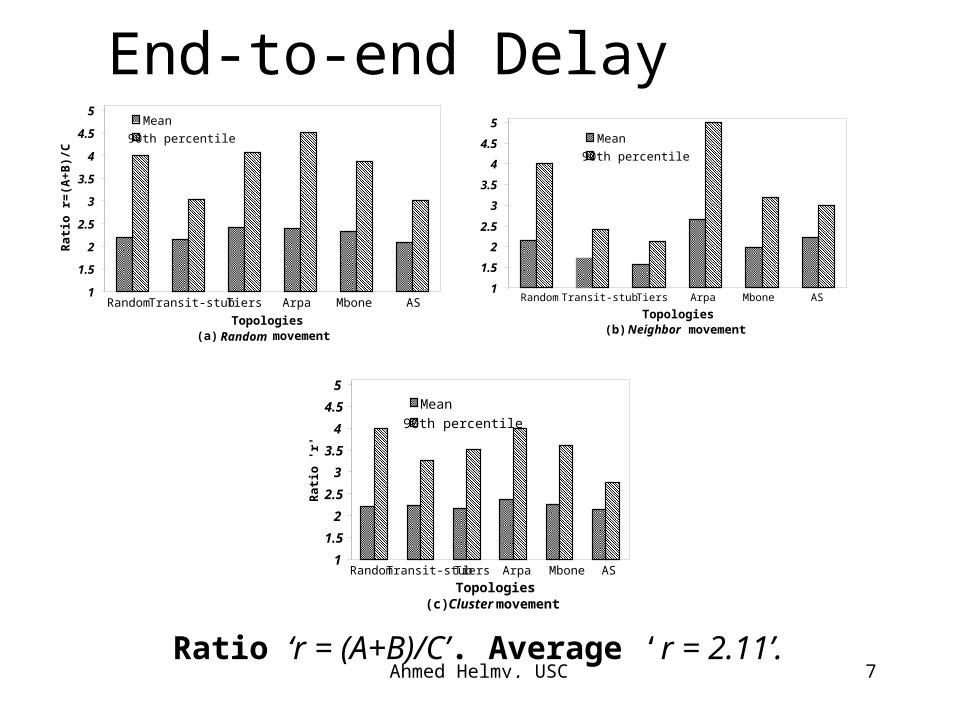
Topologies(b) Neighbor movement
Random Transit-stub Tiers Arpa Mbone AS1
1.5
2
2.5
3
3.5
4
4.5
5
Topologies(a) Random movement
Rat
io r
=(A
+B
)/C
Mean
90th percentile
Random Transit-stub Tiers Arpa Mbone AS
Mean
90th percentile
1
1.5
2
2.5
3
3.5
4
4.5
5
Topologies(c) Cluster movement
Rat
io 'r
'
Mean
90th percentile
Random Transit-stubTiers Arpa Mbone AS
Ratio ‘r = (A+B)/C’. Average ‘r = 2.11’.
End-to-end Delay
Ahmed Helmy, USC 8
0
0.5
1
1.5
2
2.5
3
3.5
4
4.5
Random Transit-stub
Tiers ARPA Mbone AS
Topology
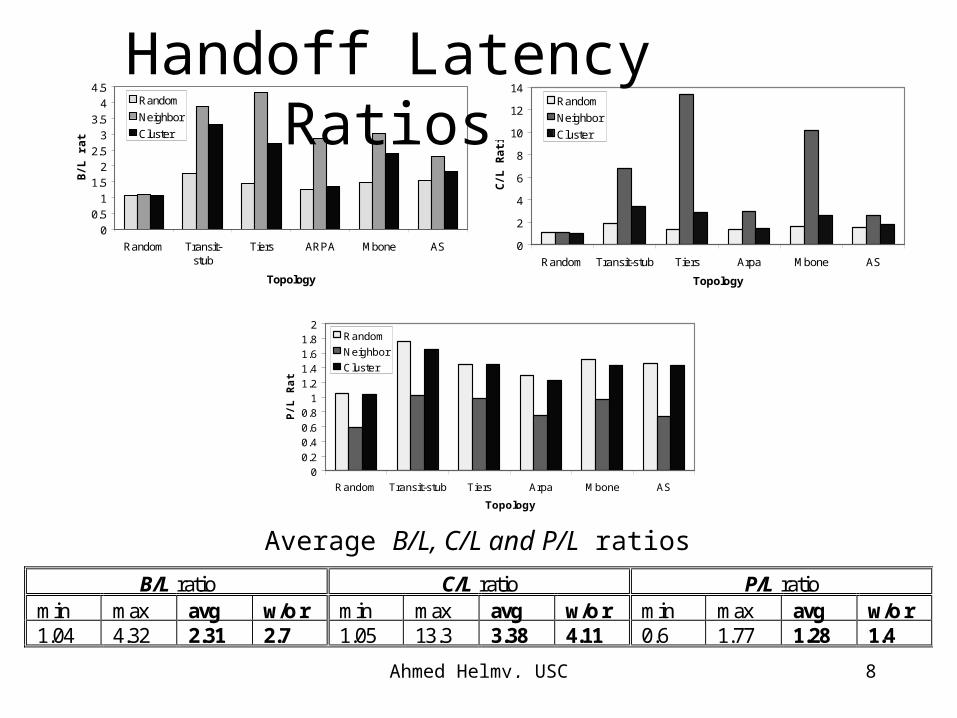
B/L
ra
tio
Random
Neighbor
Cluster
0
2
4
6
8
10
12
14
Random Transit-stub Tiers Arpa Mbone AS
Topology
C/L
Ra
tio
Random
Neighbor
Cluster
00.2
0.40.6
0.81
1.2
1.41.6
1.82
Random Transit-stub Tiers Arpa Mbone AS
Topology
P/L
Rat
io
Random
Neighbor
Cluster
Average B/L, C/L and P/L ratios
Handoff Latency Ratios
B/L ratio C/L ratio P/L ratiomin max avg w/o r min max avg w/o r min max avg w/o r1.04 4.32 2.31 2.7 1.05 13.3 3.38 4.11 0.6 1.77 1.28 1.4
Ahmed Helmy, USC 9
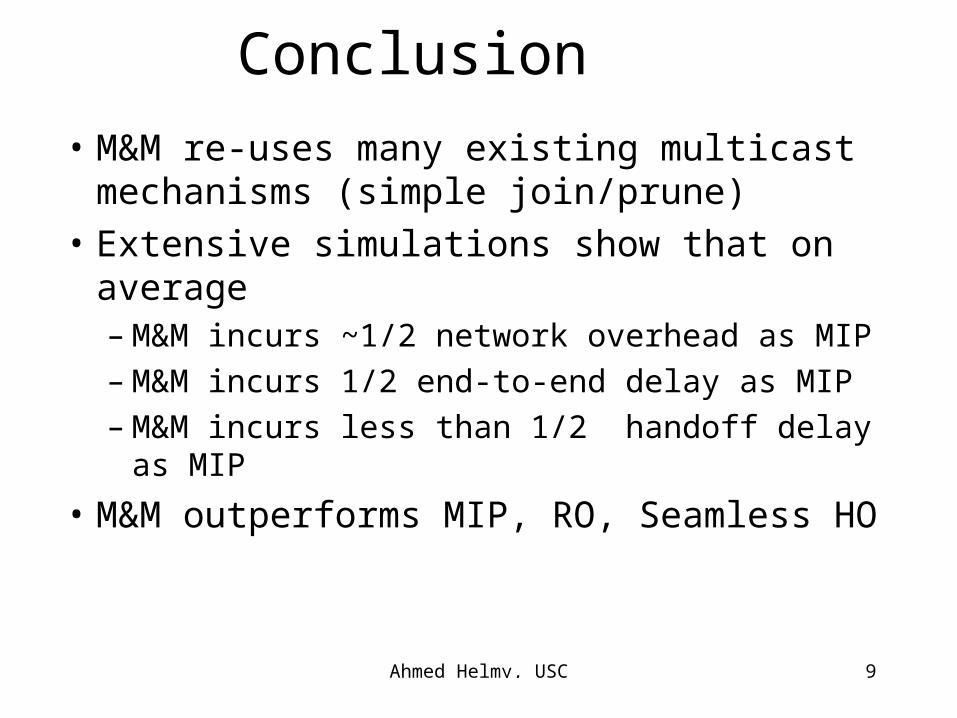
Conclusion
• M&M re-uses many existing multicast mechanisms (simple join/prune)
• Extensive simulations show that on average– M&M incurs ~1/2 network overhead as MIP– M&M incurs 1/2 end-to-end delay as MIP– M&M incurs less than 1/2 handoff delay as MIP
• M&M outperforms MIP, RO, Seamless HO
Ahmed Helmy, USC 10
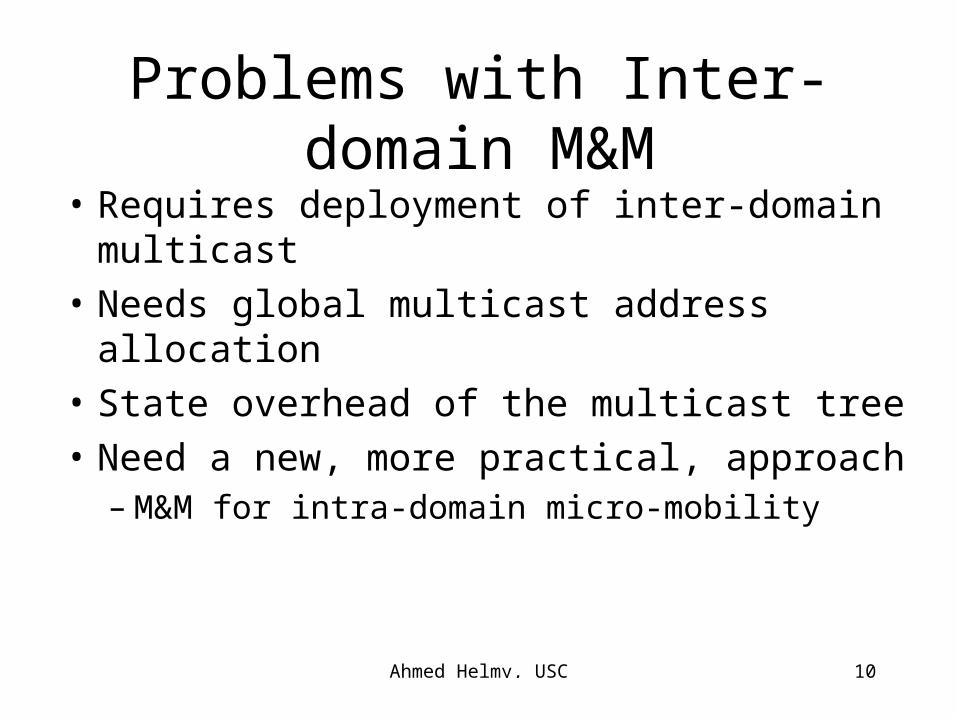
Problems with Inter-domain M&M
• Requires deployment of inter-domain multicast
• Needs global multicast address allocation
• State overhead of the multicast tree
• Need a new, more practical, approach– M&M for intra-domain micro-mobility
Ahmed Helmy, USC 11
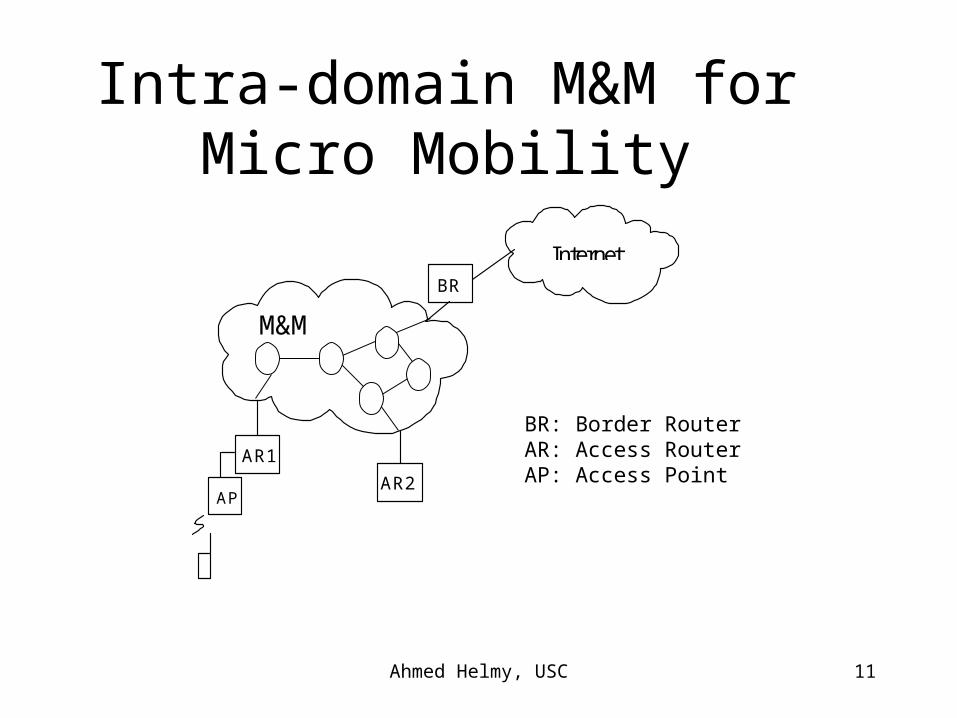
Intra-domain M&M for Micro Mobility
AR1
AR2
BR
Internet
AP
M&M
BR: Border RouterAR: Access RouterAP: Access Point
Ahmed Helmy, USC 12
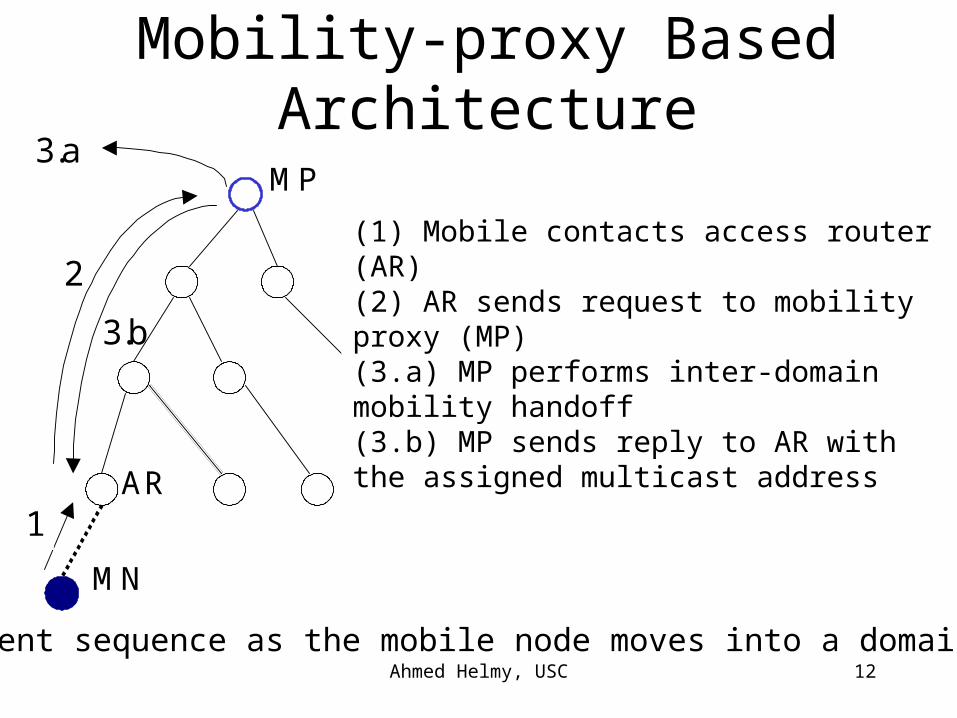
Mobility-proxy Based Architecture
2.
3.b
MP
MN
AR1
3.a
Event sequence as the mobile node moves into a domain
(1) Mobile contacts access router (AR)(2) AR sends request to mobility proxy (MP)(3.a) MP performs inter-domain mobility handoff(3.b) MP sends reply to AR with the assigned multicast address
Ahmed Helmy, USC 13
Mobility Proxy Mechanisms
• MP is dynamically elected and updated (similar to the PIM-SM RP bootstrap problem)
• MP keeps mapping for each visiting MN
• Another approach is to use algorithmic mapping [on-going work]
Ahmed Helmy, USC 14
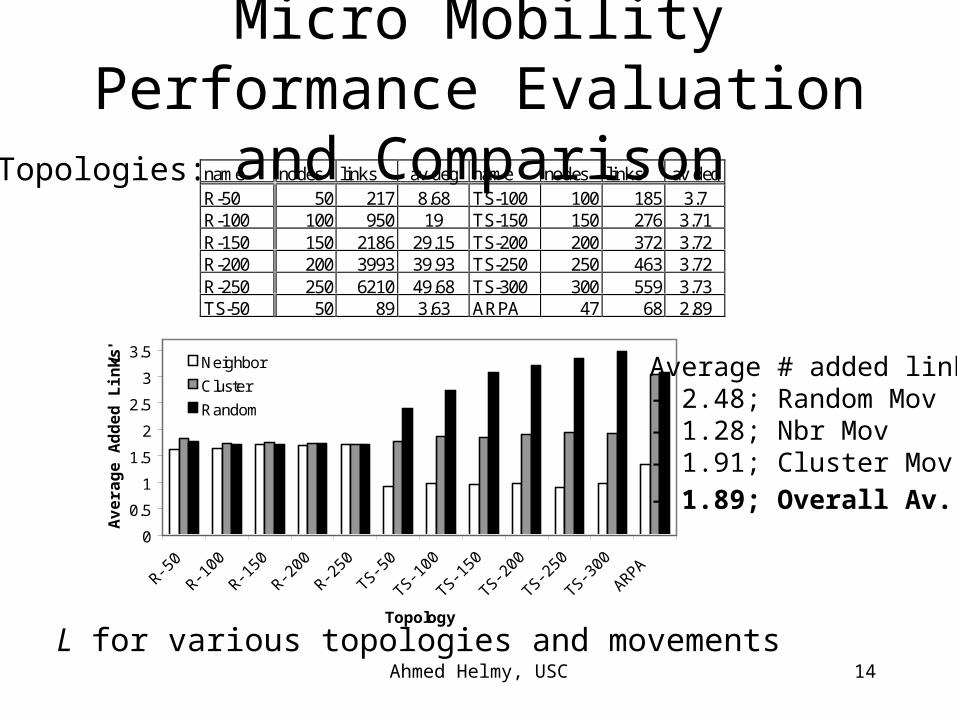
Micro Mobility Performance Evaluation and Comparison
name nodes links av deg name nodes links av degR-50 50 217 8.68 TS-100 100 185 3.7R-100 100 950 19 TS-150 150 276 3.71R-150 150 2186 29.15 TS-200 200 372 3.72R-200 200 3993 39.93 TS-250 250 463 3.72R-250 250 6210 49.68 TS-300 300 559 3.73TS-50 50 89 3.63 ARPA 47 68 2.89
Topologies:
0
0.5
1
1.5
2
2.5
3
3.5
R-50
R-100
R-150
R-200
R-250
TS-50
TS-100
TS-150
TS-200
TS-250
TS-300
ARPA
Topology
Av
era
ge
Ad
de
d L
ink
s 'L
'
Neighbor
Cluster
Random
L for various topologies and movements
Average # added links:- 2.48; Random Mov- 1.28; Nbr Mov- 1.91; Cluster Mov
- 1.89; Overall Av.
Ahmed Helmy, USC 15
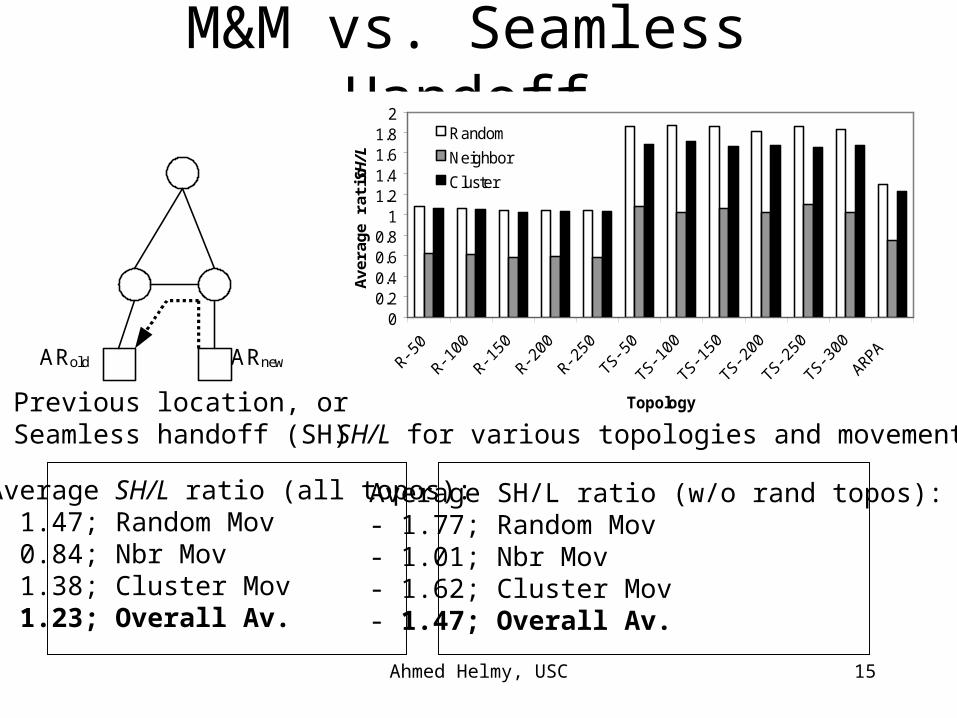
M&M vs. Seamless Handoff
00.20.40.60.8
11.21.41.61.8
2
Topology
Ave
rag
e ra
tio
S
H/L
Random
Neighbor
Cluster
SH/L for various topologies and movements
ARnewARold
Previous location, orSeamless handoff (SH)
Average SH/L ratio (all topos):- 1.47; Random Mov- 0.84; Nbr Mov- 1.38; Cluster Mov- 1.23; Overall Av.
Average SH/L ratio (w/o rand topos):- 1.77; Random Mov- 1.01; Nbr Mov- 1.62; Cluster Mov- 1.47; Overall Av.
Ahmed Helmy, USC 16
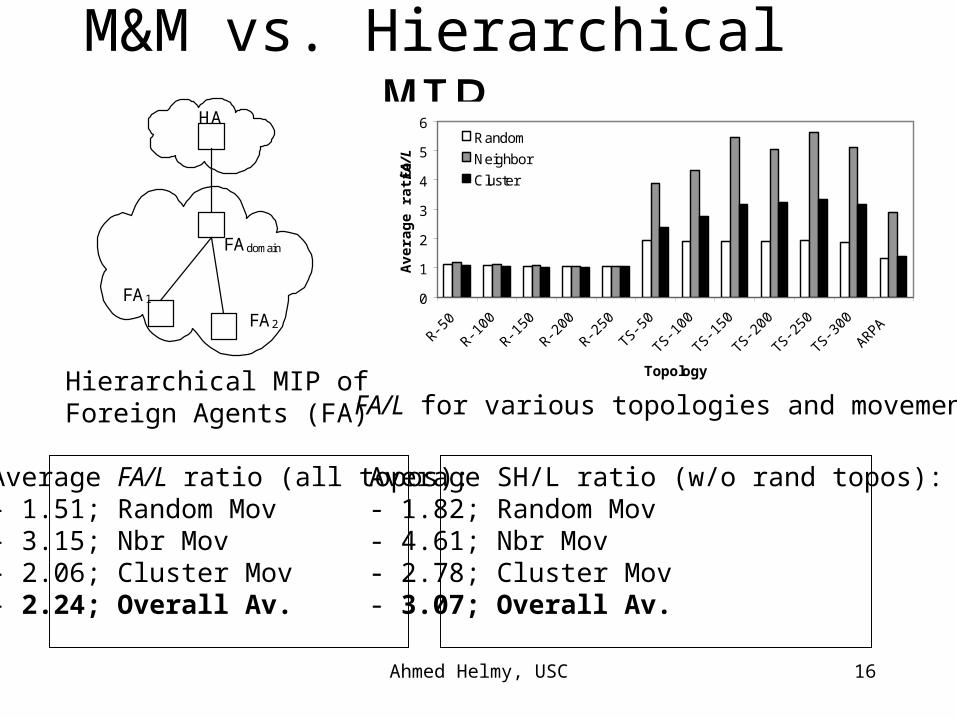
M&M vs. Hierarchical MIPHA
FAdomain
FA2
FA1
Hierarchical MIP ofForeign Agents (FA)
0
1
2
3
4
5
6
R-50
R-100
R-150
R-200
R-250
TS-50
TS-100
TS-150
TS-200
TS-250
TS-300
ARPA
Topology
Av
era
ge
ra
tio
FA
/L
Random
Neighbor
Cluster
FA/L for various topologies and movements
Average FA/L ratio (all topos):- 1.51; Random Mov- 3.15; Nbr Mov- 2.06; Cluster Mov- 2.24; Overall Av.
Average SH/L ratio (w/o rand topos):- 1.82; Random Mov- 4.61; Nbr Mov- 2.78; Cluster Mov- 3.07; Overall Av.
Ahmed Helmy, USC 17
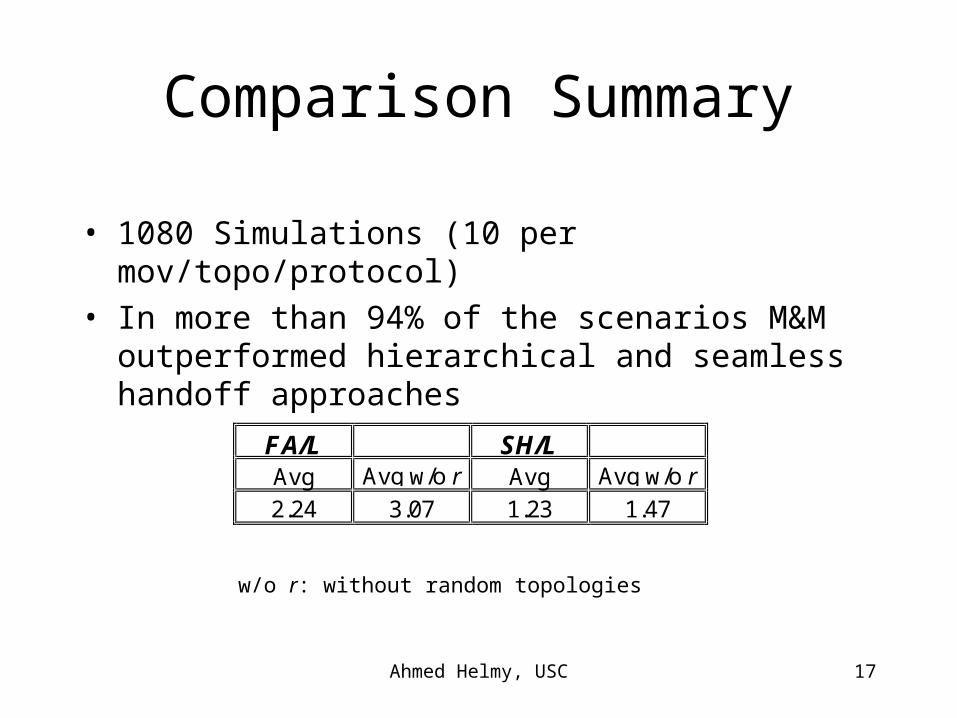
Comparison Summary
• 1080 Simulations (10 per mov/topo/protocol)
• In more than 94% of the scenarios M&M outperformed hierarchical and seamless handoff approaches
FA/L SH/LAvg Avg w/o r Avg Avg w/o r
2.24 3.07 1.23 1.47
w/o r: without random topologies
Ahmed Helmy, USC 18
Scalability Issues• Scalability of multicast state is still an issue
• Unlike unicast, multicast is location independent.
• Multicast addresses are not readily aggregatable. Aggregation may not be as intuitive as in unicast
• Need a deeper look into multicast aggregation in our architecture
Ahmed Helmy, USC 19
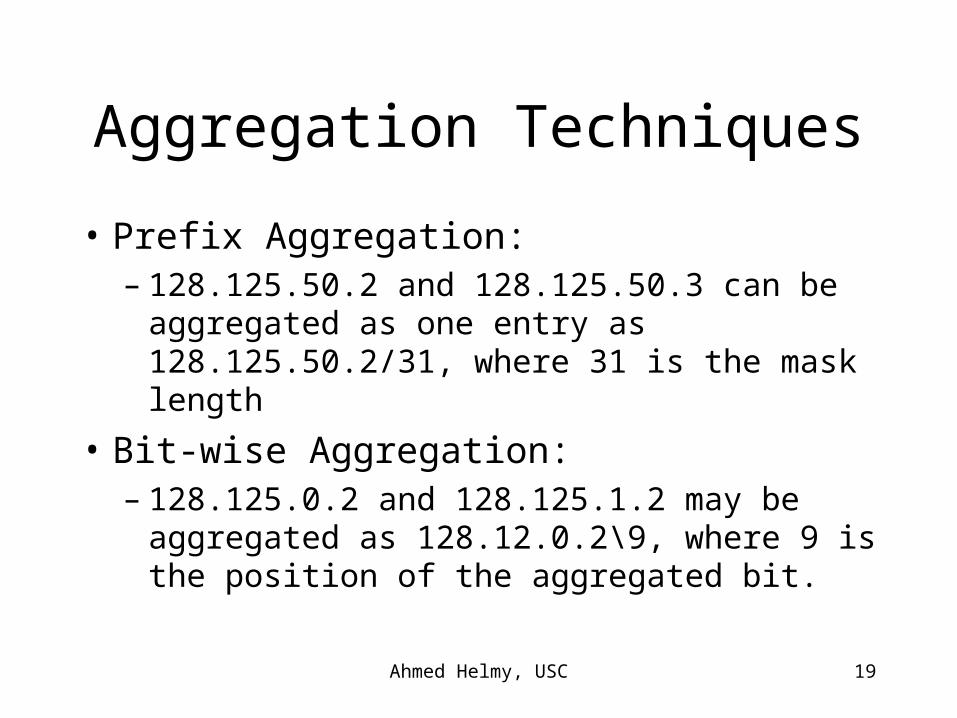
Aggregation Techniques
• Prefix Aggregation:– 128.125.50.2 and 128.125.50.3 can be
aggregated as one entry as 128.125.50.2/31, where 31 is the mask length
• Bit-wise Aggregation:– 128.125.0.2 and 128.125.1.2 may be aggregated
as 128.12.0.2\9, where 9 is the position of the aggregated bit.
Ahmed Helmy, USC 20
Aggregation Techs. (contd)
• Intuitively bit-wise aggregation gives more chances to aggregate
• Deeper look:– sequence of {0,4,1,2,3} leads to 3 states with
bit-wise, whereas with Prefix it leads to 2 states
• Leaky vs Perfect aggregation– mcast state {S,G,iif, oiflist} or sparse mode {*,G, RP-iff, oiflist}
– leaky does not compare the oiflist
Ahmed Helmy, USC 21
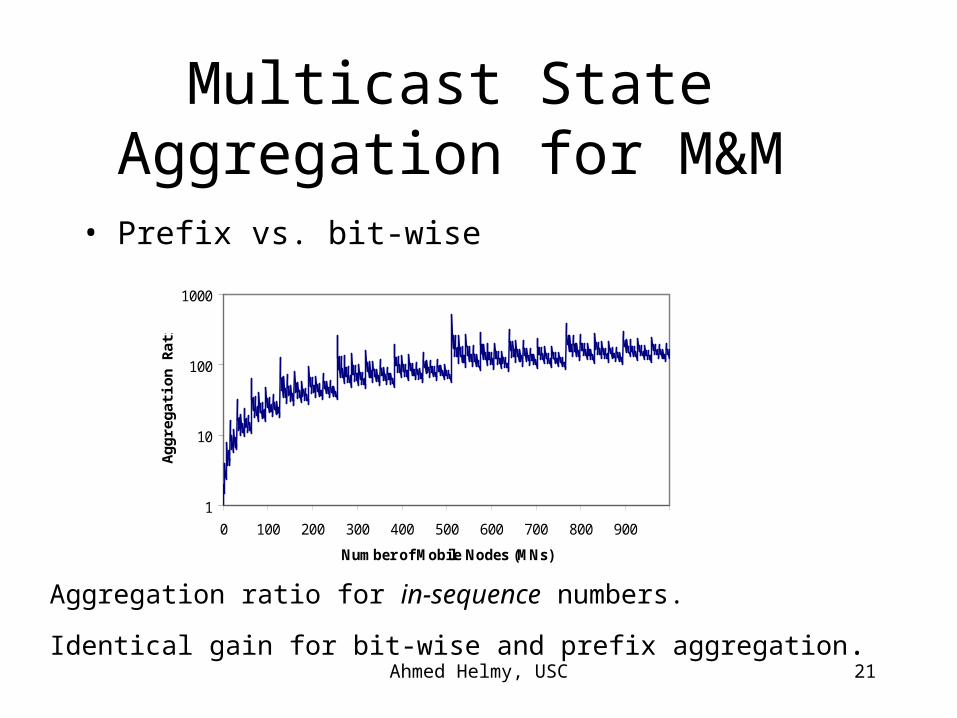
Multicast State Aggregation for M&M
• Prefix vs. bit-wise
1
10
100
1000
0 100 200 300 400 500 600 700 800 900
Number of Mobile Nodes (MNs)
Ag
gre
gat
ion
Rat
io
Aggregation ratio for in-sequence numbers.
Identical gain for bit-wise and prefix aggregation.
Ahmed Helmy, USC 22
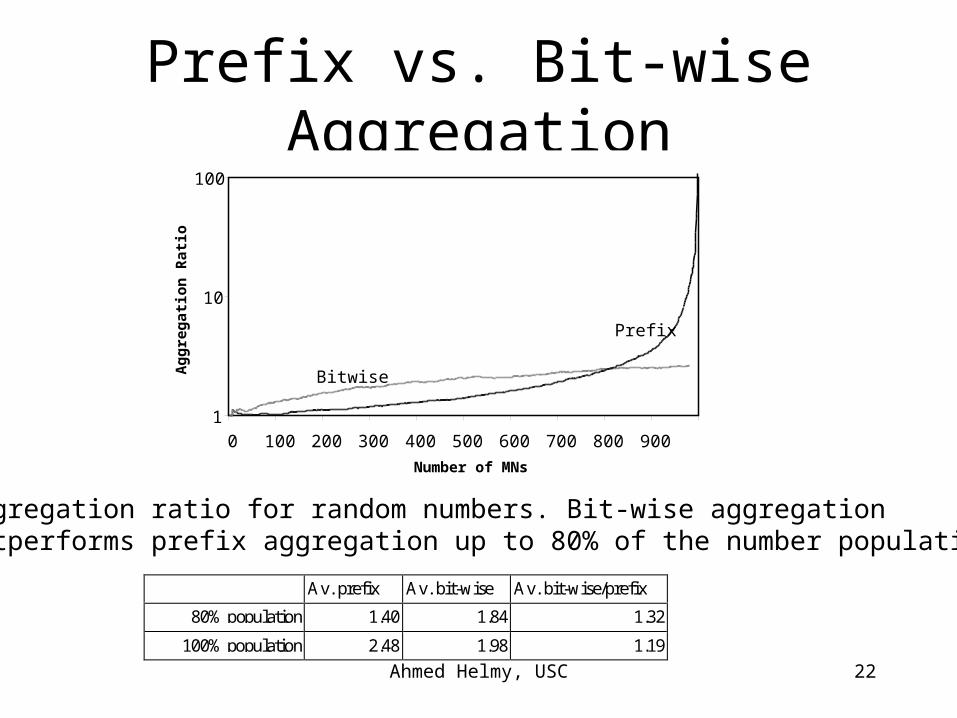
Prefix vs. Bit-wise Aggregation
1
10
100
0 100 200 300 400 500 600 700 800 900
Number of MNs
Ag
gre
gat
ion
Rat
io
Bitwise
Prefix
Aggregation ratio for random numbers. Bit-wise aggregation outperforms prefix aggregation up to 80% of the number population.
Av. prefix Av. bit-wise Av. bit-wise/prefix
80% population 1.40 1.84 1.32
100% population 2.48 1.98 1.19
Ahmed Helmy, USC 23
Multicast State Analysis
• Simulations to understand the distribution of state in the nodes and be in a better position to choose the appropriate aggregation using 2 sets of scenarios:– (1) Across space/topology: snapshot of 250k MNs
randomly distributed over the topology– (2) Across time: 1000MNs moving 40k moves
randomly
Ahmed Helmy, USC 24
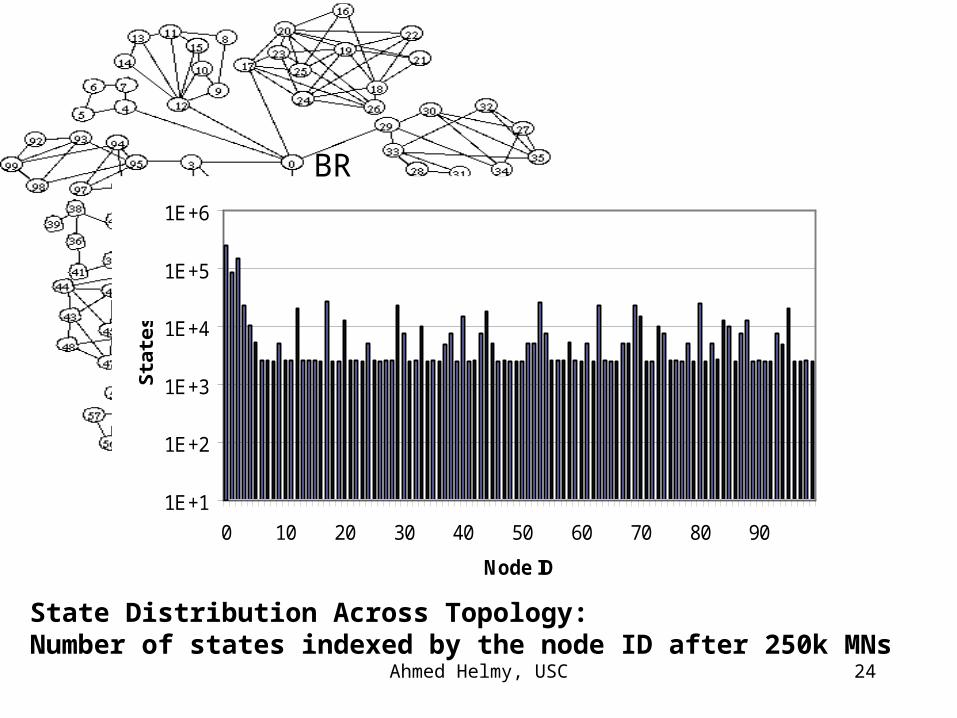
State Distribution Across Topology: Number of states indexed by the node ID after 250k MNs
1E+1
1E+2
1E+3
1E+4
1E+5
1E+6
0 10 20 30 40 50 60 70 80 90
Node ID
Sta
tes
BR
Ahmed Helmy, USC 25
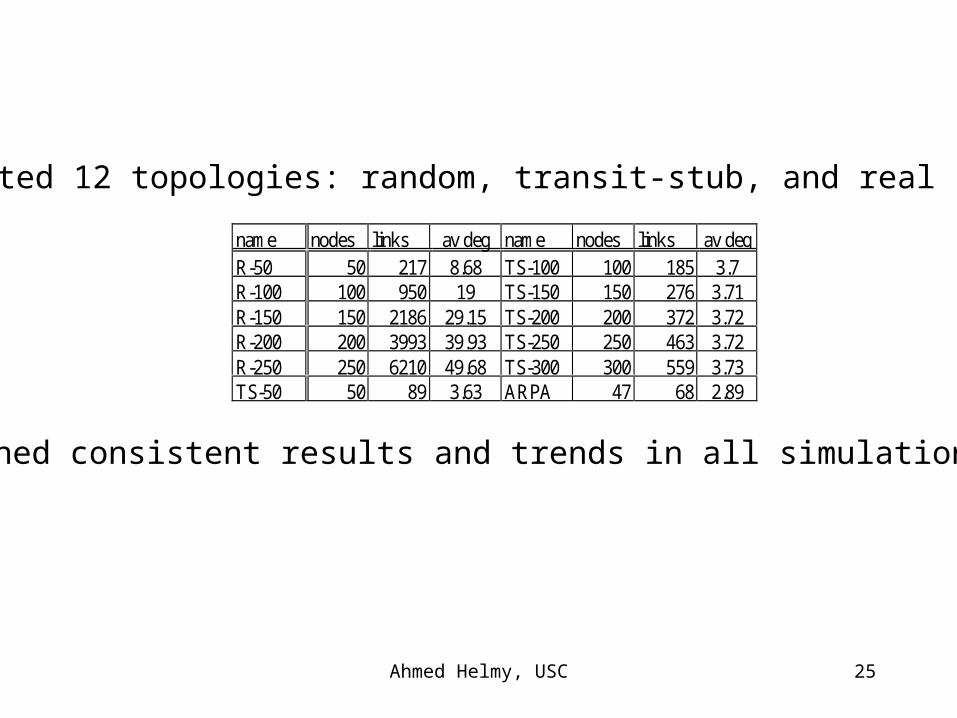
name nodes links av deg name nodes links av degR-50 50 217 8.68 TS-100 100 185 3.7R-100 100 950 19 TS-150 150 276 3.71R-150 150 2186 29.15 TS-200 200 372 3.72R-200 200 3993 39.93 TS-250 250 463 3.72R-250 250 6210 49.68 TS-300 300 559 3.73TS-50 50 89 3.63 ARPA 47 68 2.89
Simulated 12 topologies: random, transit-stub, and real networks
Obtained consistent results and trends in all simulations
Ahmed Helmy, USC 26
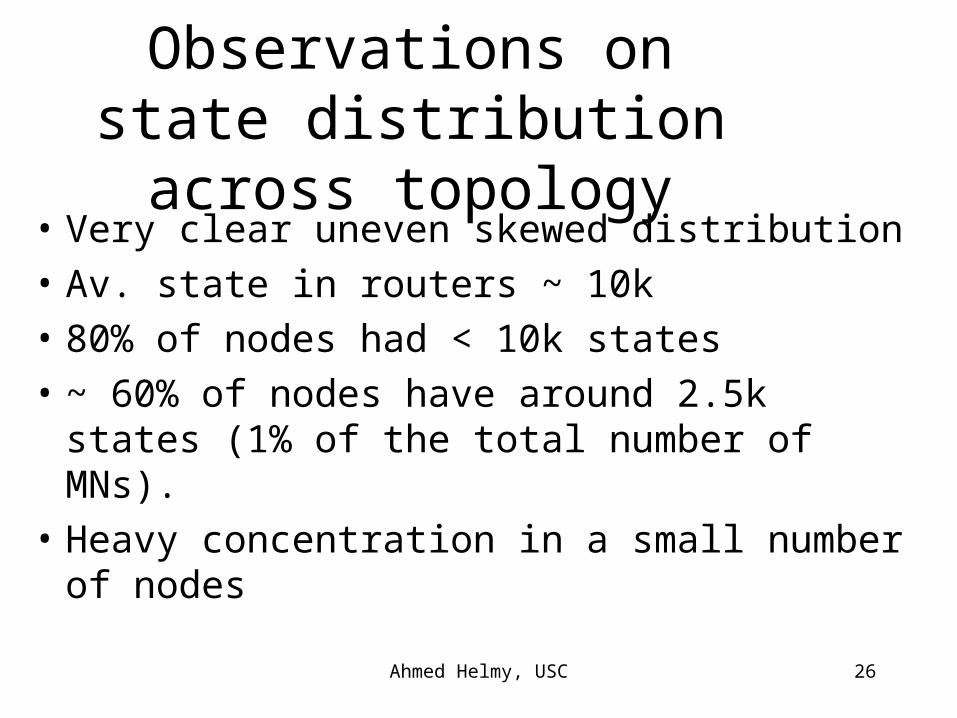
Observations on state distribution across topology
• Very clear uneven skewed distribution
• Av. state in routers ~ 10k
• 80% of nodes had < 10k states
• ~ 60% of nodes have around 2.5k states (1% of the total number of MNs).
• Heavy concentration in a small number of nodes
Ahmed Helmy, USC 27
10 3 6 9 12 15 18 21 24 27 30 33 36 39 42 45 48
Node ID
10
100
1000
Sta
te
Tim
e
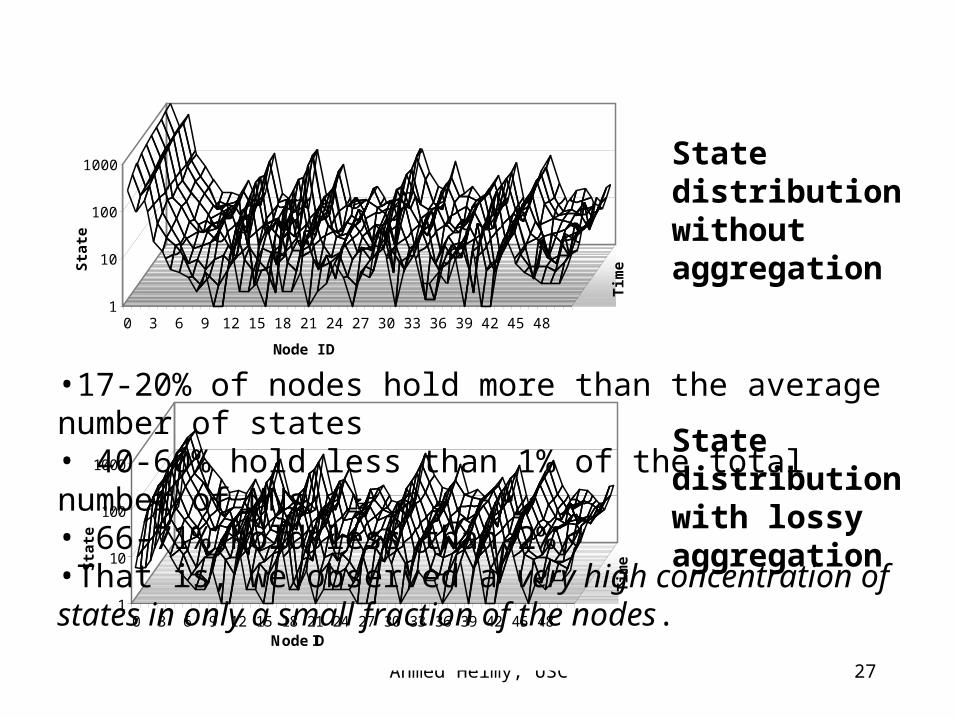
State distribution without aggregation
1
10
100
1000
0 3 6 9 12 15 18 21 24 27 30 33 36 39 42 45 48Node ID
Sta
tes
Tim
e
State distribution with lossy aggregation
•17-20% of nodes hold more than the average number of states• 40-60% hold less than 1% of the total number of MNs• 66-71% hold less than 2%•That is, we observed a very high concentration of states in only a small fraction of the nodes.
Ahmed Helmy, USC 28
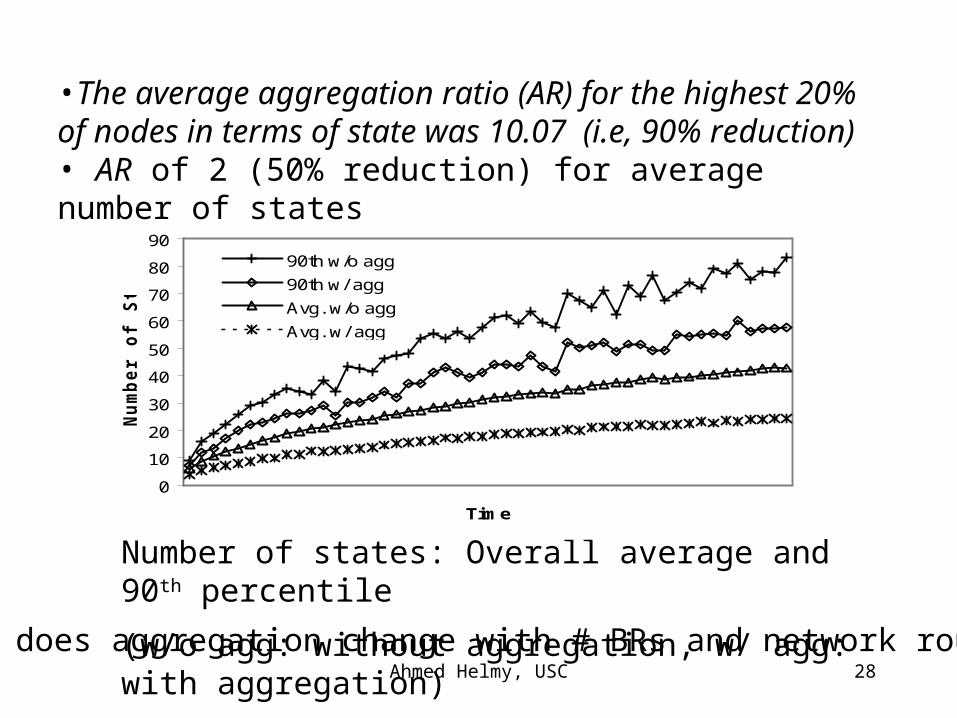
Number of states: Overall average and 90th percentile
(w/o agg: without aggregation, w/ agg: with aggregation)
0
10
20
30
40
50
60
70
80
90
Time
Nu
mb
er
of
Sta
tes
90th w/o agg
90th w/ agg
Avg. w/o agg
Avg. w/ agg
•The average aggregation ratio (AR) for the highest 20% of nodes in terms of state was 10.07 (i.e, 90% reduction)• AR of 2 (50% reduction) for average number of states
• How does aggregation change with # BRs and network routers
Ahmed Helmy, USC 29
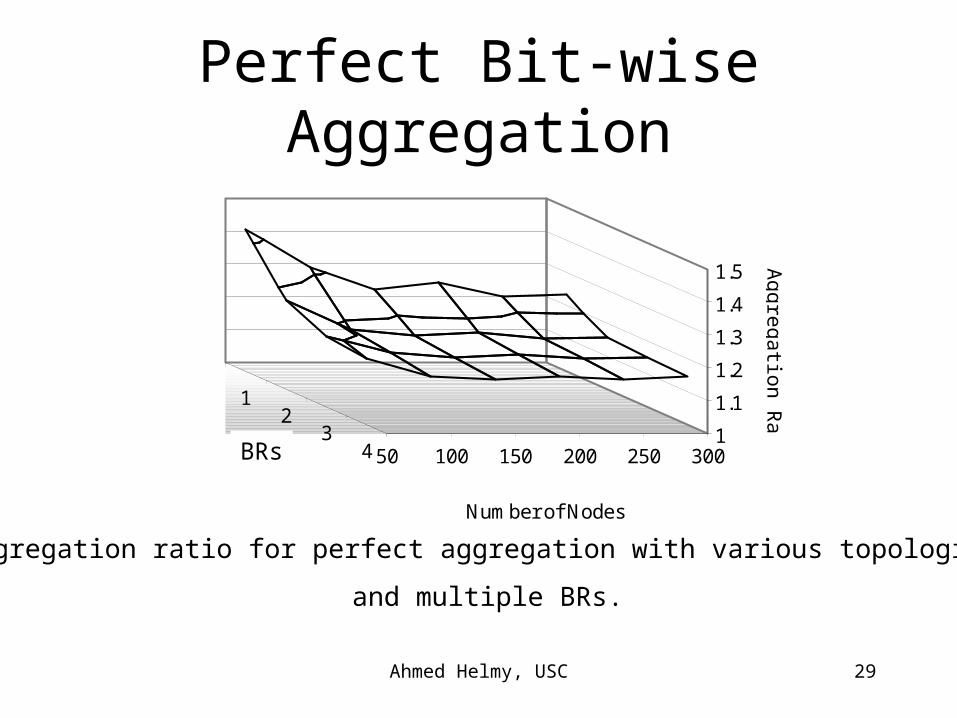
Perfect Bit-wise Aggregation
1
1.1
1.2
1.3
1.4
1.5
12
34 50 100 150 200 250 300
Number of Nodes
Ag
gre
ga
tion
Ra
tio
MPs
Aggregation ratio for perfect aggregation with various topologies
and multiple BRs.
BRs
Ahmed Helmy, USC 30
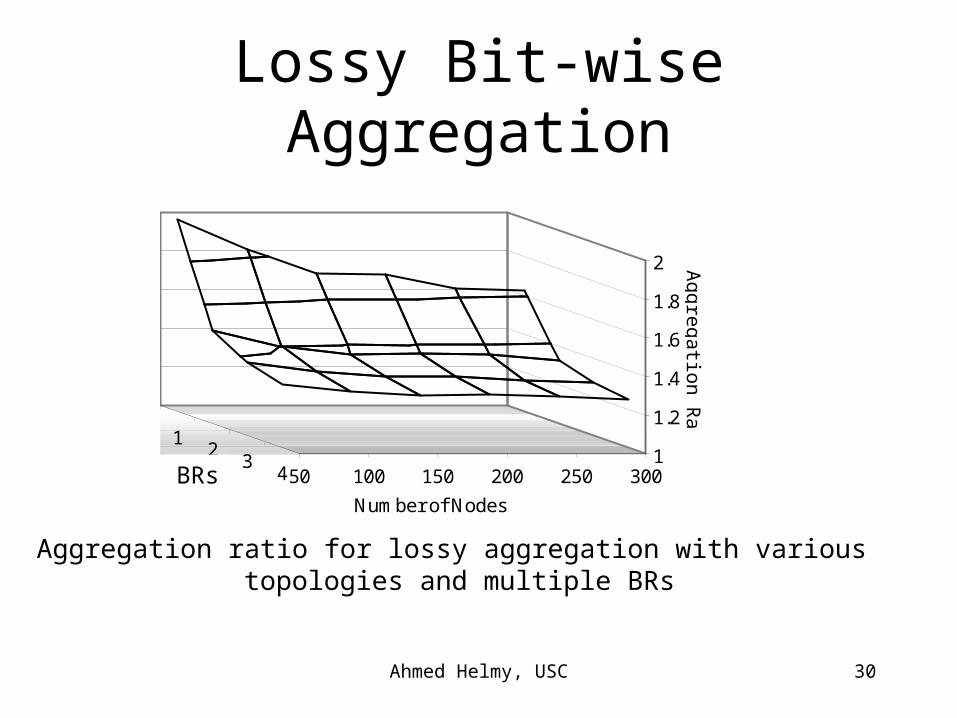
Lossy Bit-wise Aggregation
1
1.2
1.4
1.6
1.8
2
12
3450 100 150 200 250 300
Number of Nodes
MPs
Ag
gre
ga
tion
Ra
tio
Aggregation ratio for lossy aggregation with various topologies and multiple BRs
BRs
Ahmed Helmy, USC 31
Conclusions• Aggregation increases with
– decrease in number of BRs– increase in number of MNs– decrease in number of network routers
• We get better aggregation ratios with concentration of the multicast state
• The more concentration, the worse the problem, but the more effective the aggregation
• Bit-wise aggregation can reduce state by 90% in nodes with the highest 20% states