Embed Size (px)
Citation preview

AGWISE PART B: NHT PROJECT NO.
979304
WASTE REUSE STRATEGIES FOR RURAL DEVELOPMENT AND
SUSTAINABILITY
A Natural HeritageTrust funded
project
livestock
cropping
P Pittaway, V Slizankiewicz and M Spence
National Centre for Engineering in Agriculture University of Southern Queensland
Toowoomba
NCEA Publication n0 179714/1 July 2001

A Natural
Heritage Trustfunded project
AGWISE B
Appendix E Waste Resource Manual
Waste Resource Manual APPENDIX E
AGWISE
WASTE RESOURCE MANUAL
SOLID WASTE MANAGEMENT IN THE QLD MURRAY
DARLING BASIN
Page 1 of 52
Waste Resource Manual APPENDIX E
Table of Contents Introduction…………………………………………………………… 3 Timber Industry……………………………………………………… 5 Cotton Industry……………………………………………………… 15 Sewage……………………………………………………………….. 18 Abattoirs……………………………………………………………… 28 Dairy Industry……………………………………………………….. 34 Intensive Poultry Industry…………………………………………... 39 Intensive Piggery Industry…………………………………………… 45 Intensive Feedlot Industry…………………………………………… 51
Page 2 of 52

Waste Resource Manual APPENDIX E
AGWISE – Waste Resource Manual:
SOLID WASTE MANAGEMENT IN THE QLD MURRAY DARLING BASIN
Introduction The AGWISE project is a novel and wide reaching implementation strategy to promote the re-use of organic wastes within the QLD Murray Darling Basin. The project encompasses statutory planning, mapping of organic waste producing industries, identification and analysis of environmental threats and risks associated with organic wastes; identification and promotion of organic waste treatment options; and promotion of economically viable waste re-use options. The project team consists of National Centre for Engineering in Agriculture (NCEA), Dept of Natural Resources (DNR), Dept of Primary Industries (QDPI), local and State Government agency staff and is managed by the Eastern Downs Regional Organisation of Councils (EDROC). The project if funded by the Natural Heritage Trust (NHT). The literature review is the first step in the collection and collation of available information leading to the economic and viable re-use of organic wastes. Table 1 provides and overview of the relationship of the literature review within the overall project framework. It is intended that the literature review will expand into a resource manual for the large number of organic waste producing industries within the Basin.
Table 1: Literature Review within Project Framework
LIT REV DEFINE AVAILABLE
RESOURCES (GIS)
OUTCOME
Waste sources by industry Waste types identified and
located by industry
Grouping by economic
distances
Volumes by industry Predicted/actual vol by sub-
catch
Total volume to be re-used
Characteristics by industry Predicted/actual nutrient
load by sub-catch
Total load to be managed –
threats vs opportunities
Generic Treatment &/or
management techniques
Current vs available
treatment options
Identification of BPEM and
adoption
The following report is a result of a literature review undertaken on the existing solid organic waste producers located within the Queensland Murray Darling Basin.
Page 3 of 52

Waste Resource Manual APPENDIX E
The literature review investigated a number of factors relating to the industry. These included:
�� General description of the industry, �� Where waste is derived in the industry, �� Volumes of waste (how to calculate waste for the particular industry), �� Generic characteristics of waste and factors which affect them, �� Generic treatment &/or management techniques for waste produced.
Aim To report on organic waste management for industries within the QLD Murray Darling Basin. Objectives Specific objectives (as shown in Table 1) are to identify and record: waste sources and volumes, generic waste characteristics current and potential waste management techniques, SWOT Analysis It is expected that a SWOT analysis for individual industries will be undertaken during the subsequent stages of the project. It is expected that the SWOT analysis will enable a comparison of waste sources and treatments leading to a better understanding of the issues collective waste re-use options.
Page 4 of 52

Waste Resource Manual APPENDIX E
TIMBER INDUSTRY References: Barnes, D. (1997) ‘Guidelines for the Composting of Feedlot Manure, Sawmill Timber Residues and Cotton Trash – Thesis.’ Toowoomba: University of Southern Queensland. French, J.R.J., Robinson, P.J., Yazaki, Y., and Hillis, W.E. (1979) ‘Bioassays of Extracts from White Cypress Pine (Callitris columellaris F. Muell.) against Subterranean Termites.’ Germany: Walter de Gruter and Co. Gasser, JKR (ed.) (1985) ‘Composting of Agricultural and other wastes,’ London: Elsevier Applied Science Publishers. Hancock, J. (1993) ‘Business Opportunities with Secondary Timber Products.’ Queensland: Timber Research and Development Advisory Council. Haug, R. (1993) ‘The practical Handbook of Compost Engineering,’ Boca Raton; Lewis publishers. Hillis W.E., Brown A.G. (1984) ‘Eucalypts for wood production,’ Australia: CSIRO Australia/ Academic Press. Manahan, S.E. (1990) ‘Environmental Chemistry: fourth Edition,’ United States: Lewis Publishers. Miller, J.H., Jones, N. (1995) ‘Organic and Compost-Based Growing Media for Tree Seedling Nurseries,’ United States: The World Bank. Ministry of Agriculture, Fisheries and Food (1976) ‘Organic Manures – Bulletin 210,’ London: Her Majesty’s Stationery Office. National Occupational Health and Safety Commission (1999) ‘National Code of Practice for the Safe Handling of Timber Preservatives and Treated Timber,’ Australia: Commonwealth of Australia. http://www.worksafe.gov.au Timber Research and Development Advisory Council (August 1994) Timber Residue Study – Queensland, New South Wales, Victoria and South Australia.’ Queensland: Timber Research and Development Advisory Council. ‘Utilisation of Cypress Sawmill Residues in the Eastern Downs – Thesis.’ (1996) Pers comm. Yazaki, Y. (1983) ‘Volatility of Extractive Components In White Cypress Pine (Callitris columellaris F. Muell.).’ Melbourne: CSIRO Division of Chemical Technology. Yazaki, Y., Hillis, W.E. (1977) ‘Components of the Extractive from White Cypress Pine Callitris columellaris F. Muell Heartwood Which Affect Termites.’ Melbourne: CSIRO Division of Building Research.
Page 5 of 52
Waste Resource Manual APPENDIX E
Internet Sources
�� Cornell University Compost Pages
http://www.cfe.cornell.edu.compost/calc/lignin.html
http://www.cals.cornell.edu/dept/compost/frame1.html
http://www.cals.cornell.edu/dept/compost/OnFarmHandbok/apa.taba1.html
Page 6 of 52

Waste Resource Manual APPENDIX E
General Sawmilling is the cutting, sawing, chipping, compressing, machining or milling of logs, drying logs in a kiln or manufacturing secondary wood products in a mill. Timber milled in the Eastern Downs include:
Species Percentage of total milled
�� White cypress pine (Callitris glaucophylla) 90
�� Spotted gum (Eucalyptus maculata)
�� Narrow - leaved red ironbark (Eucalyptus
crebra)
10
Sawlogs are stripped of branches and leaves prior to being taken to the sawmill. The wastes generated at the sawmill are referred to as residues. Waste Sources Sources for waste production can be shown diagrammatically. Figure XX shows the processes undertaken from cutting to the final product.
Figure xx: Processes of log to retailer and Wastes (Residues) that may arise
p
Tnd
Acquisition of timber Activity: Trees are cut, strippedof branches and loaded onto trucks. Waste: sawdust, branches, leaves, doze
Milling operationActivity: milling offinal product. Maydressing of timberWaste: Sawdust, hearts, bark, dock
Retailer:Activity: selling oinclude dressing tspecific lengths Wastes: sawdustoffcuts
Trans
he major area where residues arise is during the mot produce any timber wastes but may result in iscuss wastes produced at the timber treatment pla
Page 7 of 52
Trans
logs for desired include . shavings, wings, ings and chips
f final product may imber or cutting to
, shavings, and
port
illing operation. Treachemical wastes. Thisnt.
Treatment of timberActivity: treating timber by chemical means Waste: no timber waste
p
ting timber report wil
Trans
will l not

Waste Resource Manual APPENDIX E
Timber mills inputs include logs, power, human resources and machinery equipment. The residues produced during the timber milling include: �� Sawdust: Sawdust occurs when a log is milled. The particles created by the cutting
action of the saw. Sawdust particles can be fibrous, granulated or a combination of both. Particle size can vary but are typically in the range of 2-4mm in length and 0.5-2.5mm in thickness for cypress and 3-5mm in length, 0.5 – 1 mm in thickness and width for hardwood.
The growing trend with sawmills appears to be the collection of sawdust for use
elsewhere (co-composting or as bedding in poultry sheds).
�� Shavings: Are produced when timber undergoes a “dressing” (timber is machined into various sizes and shapes) operation. Particle size is typically 0.3-0.5 mm in thickness, 10mm in length and 5mm in width for cypress and hardwood.
�� Shavings are usually collected in a hopper and used in the same manner as sawdust.
Problems may arise if the timber being dressed has been chemically treated in some way as this can affect the potential reuse of the shavings.
�� Wings: Outer parts of a log produced when a log is cut into a square or rectangular
shape. Wings can be converted into chips however problems with machinery can occur if bark is still intact.
�� Dockings: The offcuts resulting from the trimming of timber to a specific length.
Although the docking length, width and thickness may vary, generally they are 300mm, 75-100mm and 25-75mm respectively. Dockings can be chipped however it is important to be wary of chemically treated timber.
�� Hearts: Hearts are the centres of the log. Often the centre of the log could be damaged
in some way and becomes useless. Chipping this section is possible and can then be used in other applications.
�� Doze: Doze is the name given to the rotten or decayed part of the log, caused by a
small beetle that burrows into the trunk and lays eggs, where the offspring grow. Where the offspring grow the tree is unable to recover and hence the rot. Doze can occur in the side of the log or in the heart and are referred to as yellow and brown doze respectively. If a tree is affected by brown doze the tree is considered useless and is usually burnt, if it is affected by yellow doze than the effected areas can be removed, allowing the remainder of the log to be used.
�� Bark: In the case of cypress the bark is quite stingy and has a tendency to cling to the
log. This causes more wear on machinery components than what is necessary. Tools used for debarking are available however some millers are yet to be convinced hat the cost and effectiveness of the machine are justifiable. Bark can range in size however it is not uncommon for lengths of bark up to 3m.
�� Chips: Chips are biscuit size wood particles obtained from the processing of wings,
hearts and dockings. Machinery containing a blade cuts the incoming material into smaller items, which can be used in landscaping applications. The chipper blade determines the size of the chip although specific dimensions can be achieved by particular applications.
Page 8 of 52

Waste Resource Manual APPENDIX E
Typical Waste Volumes Sawmills attempt to maximise the recovery rate and minimise residues. The ‘recovery rate’ will vary from mill to mill and depend on the type of timber being processed. The ‘recovery rate’ is typically in the range of 33 – 50% of the incoming sawlog. For Example: If a timber mill had an average annual volume of log input that equated 12000 m3, The amount of saleable timber produced at this mill will be in the range of 3960 – 6000 m3 per year. The remainder of the log will become residue (sawdust, shavings, bark, etc). Table xx: ‘Types and Quantities of Secondary Timber Products Produced in Queensland”, gives an indication of the percentage of residues produced in a typical milling operation. Variables that affect the amount of residue produced include:
�� Type of timber milled, �� Age of timber, �� Overall quality of the incoming logs, �� Experience of the miller, �� Machinery used in the milling operation, �� Desired end product.
The information provided in the table below should be used as indicative values, as variance in the total residue type will vary as a result of the above variables. Additional figures for cypress have been included in brackets as a result of studies undertaken by Slizankiewicz (pers comm., 1996). The figures for cypress are based on a questionnaire sent to cypress sawmills in the Eastern Downs Region (Toowoomba – Roma).
Page 9 of 52

Waste Resource Manual APPENDIX E
Table 1: Types and Quantities of Secondary Timber Products Produced in Queensland (Based on a 1991 TRADAC Survey and Slizankiewicz (1996, p11))
Average quantity of product as a percentage
of total milling timber volume processed
Product Type Brief Product
Description
Pine %(1) Hardwood % Cypress %
Sawdust Fine wood particles 13.8 14.7 14.8
(10%)
Wings Various length,
usually tapering
sections
0.8 25.4 41.3
(25%)
Hearts Centre of logs - 11.9 (2%)
Chips Biscuit type wood
particles
28.1 4.5 (3%)
Shavings Small thin particles 10.0 3.0 1.6
(6%)
Dockings Short length pieces,
variable sections
1.2 2.5 3.3
(6%)
Bark Outer part of log 30.4(2) (3) (3)
(6%)
Total(4) 87(4) 62(4) 61(4)
Source: Hancock (1993, p.5) Table 2. Slizankiewicz (pers.comm. 1996)
Notes: (1) Pine has been included as a comparison.
(2) Bark volumes are given as loose volumes rather than solid wood volumes.
(3) Hardwood and cypress bark is not often separated in the normal saw milling process. The bark is generally included with the wings.
Although doze is considered a residue, it is included in the hearts and wing calculations.
(4) Totals based on industry not summation
The difference in results between TRADAC and Slizankiewicz are due to: �� The study conducted by TRADAC did not separate the volume of bark from that of
wings �� Sawmills that chip wing residue are minimal and were not considered. In the QMDB region there are a seventy-three sawmills. The volume of logs milled each year is approximately 360,000 m3. As indicated previously in the report, the timber milled in this region is predominantly white cypress pine (approximately 90%). The following table is gives an indication of the amounts of timber milled and residues produced in the QMDB each year.
Page 10 of 52

Waste Resource Manual APPENDIX E
Table 2: Approximate Quantities of waste produced in the QMDB (indicative values only)
Volumes in cubic metres Mill Type
Incoming log Log output* Sawdust** Other
residues***
Cypress 324,000 106,920 – 162,000 47,950 276,050
Hardwood 36,000 11,880 – 18,000 5,290 30,710
Source: Derived from Databases Notes:
* Calculated from recovery rates of cypress and hardwood being in the range of 33 – 50%.
** Calculated by using values in Table 1 Types and quantities of secondary timber products produced in Qld. (TRADAC results)
*** Incoming log minus sawdust Waste Characteristics Characteristics of timber residues are usually based upon physical properties such as size, density, strength, durability, shrinkage and permeability. ‘Table 3: Typical Uncompacted Densities at various Moisture Contents of Cypress and Hardwood Residues’ is an indication of typical densities found in various residues.
Table 3: Typical Uncompacted Densities at Various Moisture Content of Cypress and Hardwood Residues
Sawdust
Moisture Condition Species Density (kg/m3)
General M/C (%) Hardwood Cypress
Fresh 50% 298 293
Seasoned 12% 224 221
Fully Dried 0% 200 198
Chips
Moisture Condition Species Density (kg/m3)
General M/C (%) Hardwood Cypress
Fresh 50% 336 -
Seasoned 12% 251 -
Fully Dried 0% 224 -
Hearts, Wings & Dockings
Moisture Condition Species Density (kg/m3)
General M/C (%) Hardwood Cypress
Fresh 50% 1200 850
Seasoned 12% 1000 700
Source: Adapted from Hancock (1993, pp. 6-9)
Page 11 of 52

Waste Resource Manual APPENDIX E
Note: �� M/C is moisture content. �� The density of shavings and bark depend on particle size, shape, degree of
compaction and the moisture content. The timber industry generally adopts a conversion factor of between 2 and 6 when converting solid wood densities to shaving densities. In general for bark, the density is typically between 200kg/m3 and 400kg/m3.
The physical (and chemical) characteristics of timber will undoubtedly vary with the different species of timber milled (pers. comm. Michael Kennedy Department of Forestry 1999). The chemical characteristics of timber include cellulose, hemicellulose, lignin (lignin combined with cellulose form the woody tissue of trees), sapwood components, water contents and Kino (gum which certain trees produce). Research undertaken by Hillis (1984, p260) on eucalypts, suggests that chemical characteristics will vary depending on species of eucalypts, however in general:
�� the cellulose content can range from 40 – 60%,
�� hemicelluloses will range from 12-22%, and
�� lignins range between 15 – 22%. Sapwood components vary during the year due to results of insect attacks, foliage growth and demands of seed production. Chemical components vary between species of timber. Timber residues usually possess low nitrogen content and a high carbon content (pers. comm. Michael Kennedy Department of Forestry 1999). ‘Table 4: Chemical Characteristics of timber residues,’ is a collation of various data available. The table should be used as indicative values only as the information obtained does not indicate the species of timber tested nor the age of the residue. These two factors can affect the chemical characteristics of the residues. If analysis is required for a specific operation than testing of the residues should be undertaken.
Page 12 of 52

Waste Resource Manual APPENDIX E
Table 4: Chemical Characteristics of Timber Residues Source Material Nitrogen C/N ratio Available
phosphorus % Potash % Lignin % Bulk
density kg/m3
Cornell web page
Sawdust 0.06-0.8 200-750 0.01 – 0.5 0.04 – 1.4 350-450
Ministry of Agriculture, fisheries and
food
Sawdust 0.10-0.9
(0.2)
269-539 0.01-0.5
(0.06)
0.04-1.4
(0.07)
- -
Ministry of Agriculture, fisheries and
food
Shavings 0.4 - 0.1 0.9 - -
Cornell web page
Hardwood residues
0.06-0.11
451-819 - - 15-28 445-620
Cornell web page
Lumber mill waste
0.13 170 - - 15-28 -
Cornell web page
Hardwood bark
0.10-0.41
116-436 - - 15-28 -
Haug (1993) Sawdust 0.1 200-500 - - - -
Gasser (1984, p
204)
Fresh bark 0.4-0.6 75-110 - - 15-28 -
Ranges in the throughout the chemical characteristics (i.e. nitrogen, C: N ratio, etc) can be a result of species of timber tested (e.g. hardwood or softwood) and the age of the residue tested, (fresh sample or obtained from stockpile). It was assumed from that nitrogen and phosphorus results obtained are those available for plant uptake. Chemically treated timbers include softwood varieties (e.g. pine) and hardwood species. Cypress timbers are naturally resistant to pests such as termites. Chemicals used in the treatment of timbers to withstand attack from pests such as termites, fungi and marine borers include:
�� Copper-chrome-arsenic compounds �� Pentachlorophenol (PCP), creosote �� Sodium pentachlorophenate (“Santobrite”, “Sapco”, “Pentabrite” and others) �� Boron compounds (“Timbor”, “Borax”, “Borotreat” and others) �� “Captafol” �� “Folpet”
The two most hazardous of these components in these preparations are arsenic, pentachlorophenol/creosote. �� Copper Chrome Arsenic (CCA): identifiable by its green appearance. Arsenic can be
absorbed through the skin or inhaled in dust or spray. The effects on human health from arsenic can range from skin irritation to bowel upsets. If timber residues were to be used in other applications such as composting there is a chance of a health risk.
�� Pentachlorophenol (PCP)/creosote: identifiable from its pungent odour. It is derived as
a by-product of metallurgical coke ovens (low boiling distillate of coal tar). Similar to CCA, PCP can be absorbed into the human through the skin or inhaled. The resulting affects can range from bronchitis to vomiting.
Page 13 of 52

Waste Resource Manual APPENDIX E
Although sawmills do not treat timber at the mill, there are only a few cases where treated timber is processed at mills in the QMDB. In this case the residues (e.g. sawdust and shavings) are not separated from non-treated residues. The chance of obtaining treated mill residues appears to be minimal. If the residues were to be reused in applications such as composting this could pose a problem. It is recommended that safety precautions be followed when using any treated timber products and by-products. Information on products used to treat timber are listed in Australian Standards AS 1605 and the ‘National Code of Practice for the Safe Handling of Timber Preservatives and Treated Timber’ (1989). If treated mill residues are used in applications such as composting it is important to monitor for toxicities in the soil and plants as the preservatives from treated timber may damage young crop plants. Treatment/Reuse Options Timber residues can be reused or value added by (co) composting applications, bedding for intensive animal industries, nursery applications, Medium Density Fibreboard (MDF), Landcare applications to stop erosion and electricity generation (co-generation), heating and drying applications. The reuse options of timber residues can be hindered due to a number of reasons being:
�� Distance from markets, �� Resource security is not guaranteed therefore there does not appear
to be a cost benefit for some sawmills to develop re-use infrastructure,
�� Lack of relevant equipment and change over costs from current practices can be quite high, �� Transport costs and other economic factors. �� Treatment of timber.
Large residues such as wings, hearts and dockings are often burnt on site if recovery is not possible or chipping is unavailable. Residue reuse (particularly shavings and sawdust) can be hindered if the timber has been chemically treated (it is important to note that if a timber is treated, than arsenic or other hazardous compounds may be present in residues which may cause toxins in soils and plants).
Page 14 of 52
Waste Resource Manual APPENDIX E
3.0 COTTON INDUSTRY References:
Anthony WS, Mayfield WD, (1994), ‘Cotton Ginners Handbook.’ America: United States Department of Agriculture. Barnes, D. (1997) ‘Guidelines for the Composting of Feedlot Manure, Sawmill Timber Residues and Cotton Trash – Thesis.’ Toowoomba: University of Southern Queensland. Miller, J.H., Jones, N. (1995) ‘Organic and Compost-Based Growing Media for Tree Seedling Nurseries,’ United States: The World Bank.
Internet Sources:
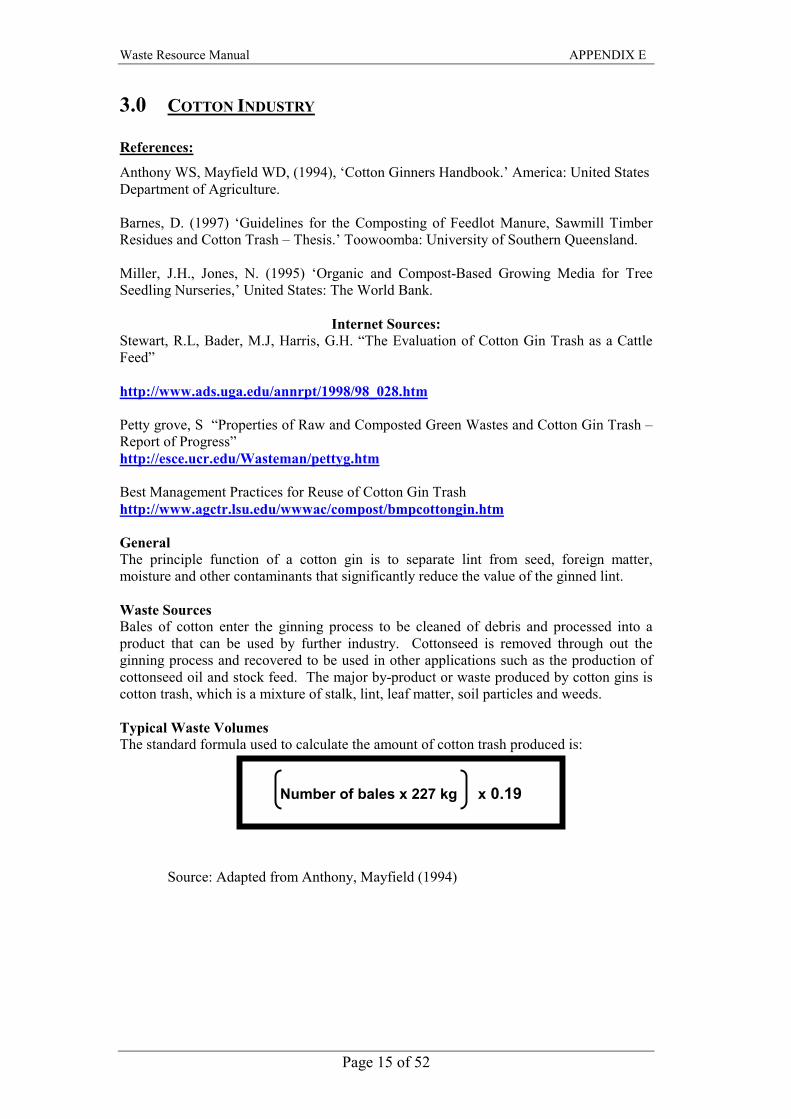
Stewart, R.L, Bader, M.J, Harris, G.H. “The Evaluation of Cotton Gin Trash as a Cattle Feed” http://www.ads.uga.edu/annrpt/1998/98_028.htm Petty grove, S “Properties of Raw and Composted Green Wastes and Cotton Gin Trash – Report of Progress” http://esce.ucr.edu/Wasteman/pettyg.htm Best Management Practices for Reuse of Cotton Gin Trash http://www.agctr.lsu.edu/wwwac/compost/bmpcottongin.htm General The principle function of a cotton gin is to separate lint from seed, foreign matter, moisture and other contaminants that significantly reduce the value of the ginned lint. Waste Sources Bales of cotton enter the ginning process to be cleaned of debris and processed into a product that can be used by further industry. Cottonseed is removed through out the ginning process and recovered to be used in other applications such as the production of cottonseed oil and stock feed. The major by-product or waste produced by cotton gins is cotton trash, which is a mixture of stalk, lint, leaf matter, soil particles and weeds. Typical Waste Volumes The standard formula used to calculate the amount of cotton trash produced is:
Source: Adapted from Anthony, Mayfield (1994)
Number of bales x 227 kg x 0.19
Page 15 of 52

Waste Resource Manual APPENDIX E
Waste Characteristics Waste characteristics of cotton trash will vary according to age of the trash. ‘Table 5: Typical Nutrient Levels (percentage) found in Cotton Trash’ is an indication of typical nutrient levels found in cotton trash residues. The table is a result of a number of studies undertaken by various people.
Table 5: Typical Nutrient Levels (percentage) found in Cotton Trash
Nutrient Levels (as Percentage of
total nutrient content)
Moisture
%
Source Trash type
N P K
C:N
ratio
Pettygrove composted 2.4 0.3 1.58 10:1 -
Miller et al
(1995)
Unknown 1.32 0.45 0.36 - -
Stewart et al. unknown - 0.12-0.36 0.8-2.29 - 8.3-60
http://www.agct
r.lsu.edu/wwwac
/compost/bmpco
ttongin.htm
Raw trash 0.64-2.23 0.093-
0.323
0.176-1.58 - -
http://www.agct
r.lsu.edu/wwwac
/compost/bmpco
ttongin.htm
Composted 1.52-2.18 0.32-0.56 0.1-0.2 - -
The unknown trash type listed in the above table called so due to information supplied not indicating whether the trash was fresh or composted.
Evidence from Queensland Cotton – Dalby Cotton Gin has shown that trash will readily compost by itself with not additives such as water and frequent turning. Since this is the case, if cotton trash is stored to be used later in applications, the nutrient content will vary.
Page 16 of 52

Waste Resource Manual APPENDIX E
Treatment Options Utilisation of cotton trash varies from Gin to Gin. There is a greater understanding amongst ginners and farmers on the advantages of utilising trash. Options on the reuse of cotton trash as indicated by studies undertaken in the United States are:
�� Feed supplement for cattle and ruminants: Although this is an option many concerns have arisen with chemical residue found in the trash and is no longer seen as being favorable.
�� Raw application to land: Cotton trash can be applied to land however can lead
into problems including:
�� Leaching of chemicals into the soil and groundwater, �� Loss of nitrogen, �� Spreading of diseases (if diseased trash is used), and �� Difficulty of spreading.
�� Composting or co-composting the cotton trash is perhaps the most favourable option. This enables the trash to:
�� Convert the nutrients into a form that is readily accessible to plants, �� Composted trash is easier to spread, �� Some diseases are killed due to heat of the compost, (therefore
minimising the risk of spreading disease). (Risk of spreading disease is further minimised if diseased trash is separated from other trash prior to composting).
�� Some of the chemicals will have already been leached prior to compost reuse.
Page 17 of 52

Waste Resource Manual APPENDIX E
4.0 SEWAGE References:
Australian and New Zealand Environment and Conservation Council (ANZECC) (1997) ‘Guidelines for Sewerage Systems – Effluent Management.’ Australia: Australian Water Resources Council. Australian and New Zealand Environment and Conservation Council (ANZECC) (August 1992) ‘Draft Guidelines for Sewerage Systems – Acceptance of Trade Wastes (industrial Wastes).’ Australia: Australian Water Resources Council. Australian and New Zealand Environment and Conservation Council (ANZECC) (1994) ‘Environmental Guidelines for Sludge Disposal.’ Australia: Department of Environment and Heritage Beavers, P.D. (April 1996) ‘Interim Guidelines for Reuse or Disposal of Reclaimed Wastewater.’ Brisbane: Department of Natural Resources.
Bryan A, Gardner T & Beavers P (1994) ‘Sewage Effluent Generation, Disposal and Re-use in Queensland – A survey of current practices.’ Queensland: State of Queensland Department of Primary Industries. Department of the Environment (19920 ‘Code of Practice for Agricultural Use of Sewage Sludge,’ London: Her Majesty’s Stationery Office. Department of Natural Resources (1997/8) ‘Draft Queensland Murray – Darling Basin – Basin Sustainability Program Annual Report 1997-98,’ Queensland: Department of Natural Resources. Manahan, S.E. (1984) ‘Environmental Chemistry Fourth Edition’, Boston: Lewis Publishers. Ministry of Agriculture, Fisheries and Food (1976) ‘Organic Manures – Bulletin 210,’ London: Her Majesty’s Stationery Office. Smith, S.R. (1996) ‘Agricultural Recycling of Sewage Sludge and the Environment.’ England: CAB International. Metcalf and Eddy Inc (1991) ‘Waste water Engineering Treatment, Disposal and Re-use 3rd Edition.’ USA: McGraw – Hill Inc. University of Southern Queensland (date unknown) ‘Solid And Liquid Waste Treatment – Book of Readings,’ Toowoomba: Distance Education Centre. Water Resources Commission. (1991) ‘Guidelines for Planning and Design of Sewerage Schemes vol. 1 & 2.’ Whitten, D.G.A, Brooks, J.R.V., (1972) ‘The Penguin Dictionary of Geology’, England: Penguin Books Ltd. Yoong, E. (1995) ‘Study Guide to water and Wastewater Engineering.’ Toowoomba: Distance Education Centre – University of Southern Queensland.
Page 18 of 52

Waste Resource Manual APPENDIX E
Internet Sources:
�� Case Study from United States
http://www.dep.state.pa.us/dep/biosolids/what_are.htm
�� Paper from Yarra Valley Water
http://www.yvw.com.au/sewerage/sewcomp.htm
�� Cornell Research project
http://www.cfe.cornell.edu/wmi/Sludge/ResProj.html
�� Cornell Research project
http://www.cfe.cornell.edu/wmi/Sludge/Recommends.html
�� Zeolite
http://www.mall-net.com/mcs/zeolite.html
http://triger.ch.umist.ac.uk:8081/zeolites/web/zeochap1.htm
Page 19 of 52

Waste Resource Manual APPENDIX E
General Sewage is the waste matter (both liquid and solids), which is transported via sewerage systems. The aim of sewage treatment is to separate suspended solid matter and organic matter from the liquid effluent. The liquid effluent is then treated to a standard that is acceptable to release to land or a water body. Sources of sewerage wastes include: �� Domestic: solid and liquid wastes made up from sinks, baths, showers, and toilets,
laundry and other sources. This category not only includes homes but businesses, hospitals, schools and recreational areas.
�� Industrial and trade wastes: This is a highly variable waste stream. Wastes water can
range from clean water to highly variable such as corrosive, poisonous, flammable or explosive substances. These can be organic or in a mineral content.
�� Urban storm water: Runoff from impervious surfaces (roofs, roads etc). Can contain
litter and other sorts of trash from trees etc. �� Agricultural: Constitute of non-point sources and contain high Phosphorus (P) and
Nitrogen (N). This is mainly runoff from irrigation areas or overtopping from storage areas.
�� Infiltration: Seepage from pipes that are structurally defective in some way. Waste Sources A majority of the matter treated by a sewage treatment plant is liquid (approximately 99% is in the liquid form). The sewage treatment process is summarised in Appendix xx. Larger communities (e.g. Brisbane) will have all forms of sewage treatment (primary, secondary and tertiary), smaller communities however will often posses primary &/or secondary treatment only. This depends upon the discharge license they have been issued. The discharge license will include conditions/specifications to which the operator is required to treat the wastewater prior to releasing either for irrigation purposes or discharge to a water body. Since the sewage treatment systems will vary so does the amount of the solid material and the final quality of wastewater. Solid wastes, which are derived from the sewage treatment process, include:
�� Gross screenings – disposed of by landfill. These include gross solids such as paper and faeces.
�� Sludge – from (various) treatment chambers and processes undertaken during the treatment of wastewater.
�� Grit – Settled material from the treatment process.
The more technologically advanced the system often the better quality of the wastewater at the end. When industrial wastes are introduced into the sewage treatment process an increase in heavy metals may be an issue.
Page 20 of 52

Waste Resource Manual APPENDIX E
Typical Waste Volumes Waste volumes are determined by the volume of inflow to a sewage treatment plant and the effectiveness of the system to separate solids from the liquid stream. The different treatment stages (primary, secondary and tertiary) are designed to remove certain traits/nutrients contained in raw sewage. Treatment systems are designed to remove specific quantities of total suspended solids (TSS) and reduce the biochemical oxygen demand (BOD5). Table xx indicates the typical removal of these traits in the different treatment systems. Although tertiary treatment values are included it is important to note that there are no tertiary treatment systems in the QMDB. These values have been included for reference purposes only. Tertiary treatment should result in fewer nutrients than that of secondary treatment. It is important to point out that there are only two treatment plants in the QMDB that are capable of removing nutrients these are Toowoomba and Dalby, which possess a biological nutrient removal (BNR) plant. This system is quite effective and able to strip the effluent of nutrients (namely nitrogen and phosphorus). Other sewage treatment plants within the QMDB rely on secondary treatment, which do not remove phosphorus.
Table 6: Designed Removal of TSS and BOD5 in the Various Treatment Systems
Designed removal Treatment Systems
TSS (%) BOD5 (%)
Primary 40-75 25-40
Secondary 70-95 85-95
Tertiary >75 >85
Source: Yoong (1995) From studies undertaken by the Department of Natural Resources, figures on effluent volumes have been calculated for the sewage treatment plants located in the QMDB. These are shown in table xx: ‘Effluent volumes and phosphorus loads for the QMDB sewage treatment plants.’
Page 21 of 52

Waste Resource Manual APPENDIX E
Table 7: Effluent Volumes and Phosphorus Loads for QMDB Sewage Treatment Plants
Sewage Treatment Level Effluent
Volume
Effluent
Phosphorus
Load
% Total
Effluent
Town/plant
Secondary1 (no
nutrient removal)
Nutrient
Removal2
(megalitres
per annum)
(tonnes per
annum)
%
Toowoomba Stage 3 1 3413 40.96 42.42
Warwick 1 844 10.13 10.49
Roma 1 783 9.40 9.73
Charleville 1 438 5.26 5.44
Cunnamulla 1 438 5.26 5.44
St George 1 328 3.94 4.08
Toowoomba Stage 4 1 3413 3.41 3.53
Oakey 1 283 3.40 3.52
Chinchilla 1 230 2.76 2.86
Pittsworth 1 172 2.06 2.14
Miles 1 121 1.45 1.50
Mitchell 1 117 1.40 1.45
Tara 1 80 0.96 0.99
Clifton 1 79 0.95 0.98
Millmerran 1 78 0.94 0.97
Killarney 1 66 0.79 0.82
Dalby 1 730 0.73 0.76
Jandowae 1 55 0.66 0.68
Cambooya 1 38 0.46 0.48
Wyreema 1 37 0.44 0.45
Dirranbandi 1 33 0.39 0.41
Cecil Plains 1 22 0.26 0.27
Meandarra 1 18 0.22 0.22
Rosenthal Hts 1 17 0.20 0.21
Bollon 1 10 0.12 0.13
Dalveen 1 1.6 0.02 0.02
Totals 24 2 11,844 96.56 100.00
Source: Department of Natural Resources (1997/8, p34)
Page 22 of 52

Waste Resource Manual APPENDIX E
From the above table it can be deducted that the total volume of sewage wastes may be quite minimal when compared to other waste producing industries within the QMDB. The treatment plants at Toowoomba, Warwick, Roma and Dalby produce a large amount of effluent however these larger towns also have industries discharging into the sewer. This can result in an increase in heavy metals being present in the effluent. Solid effluent volumes have not been calculated for the above towns, however employees within smaller townships councils (e.g. Clifton and Pittsworth) have stated that, the sludge derived at the sewage treatment plant(s) is equal to one truckload per year. Solids contained in the sewage can include sand, food scraps, faeces and paper. The amount of solids that are produced by sewage treatment plants depends on a number of factors. These include:
�� Type of system used, �� Age of system, �� Volume of inflow, �� Size of community and enterprises (size and type) located in township, �� Whether or not there is a town water supply.
The type and age of system can determine how effective the system is at removing total solids from the effluent. The volume of inflow and the size of the community and enterprises will affect the characteristics and type of wastes flowing into the treatment plant. For instance a small community may have a number of houses on rainwater, therefore the water used may be minimal which will affect the total volume of water entering the sewage system. Solids have not been calculated for the sewage treatment plants located in the QMDB. Total volumes of solids are generally be monitored or recorded by Councils. Waste Characteristics Waste Characteristics (particularly chemical) will vary depending on a number of factors. These include: �� The amount and type of industry waste entering a sewage system, �� The type of industries located around the township (e.g. Cropping farms may result in
a high pesticide residue found in influent to sewage treatment plants), �� The treatment process used.
�� Age of the treatment process as this may affect the effectiveness of the treatment process, and
�� The type of treatment technologies available (e.g. if both primary and secondary
treatment is available),
�� The size of the treatment plant. Characteristics of inflow can vary greatly depending on industries located in and around the town and which are discharging into the sewer system. Table xx:’Typical compositions of untreated domestic wastewater (indicative only)’ indicates nutrient levels that may be present in untreated domestic wastewater. These values should be used as indicative values. If analysis is required for individual sites, tests should be undertaken. Treated effluent chemical characteristics will depend on what has been deemed acceptable to discharge (to land or water body) in the license conditions. Appendix xx gives an indication of the characteristics of effluent after various treatments. Table 5: Typical Composition of Untreated Domestic Wastewater (indicative only).
Page 23 of 52

Waste Resource Manual APPENDIX E
Table 8: Chemical Characteristics of Sewage (indicative only) Concentration of nutrients
Contaminants
Unit Weak Medium Strong
Solids, Total (TS) mg/L 350 720 1200
Dissolved, total (TDS) mg/L 250 500 850
Fixed mg/L 145 300 525
Volatile mg/L 105 200 325
Suspended Solids (SS) mg/L 100 220 350
Fixed mg/L 20 55 75
Volatile mg/L 80 165 275
Settleable Solids ml/L 5 10 20
Biochemical Oxygen Demand 5 day at 20oC mg/L 110 220 400
Total organic carbon (TOC) mg/L 80 160 290
Chemical Oxygen demand (COD) mg/L 250 500 1000
Nitrogen (total as N) mg/L 20 40 85
Organic mg/L 8 15 35
Free ammonia mg/L 12 25 50
Nitrites mg/L 0 0 0
Nitrates mg/L 0 0 0
Phosphorus (Total P) mg/L 4 8 15
Organic mg/L 1 3 5
Inorganic mg/L 3 5 10
Chlorides* mg/L 30 50 100
Sulfate* mg/L 20 30 50
Alkalinity (as CaCO3) mg/L 50 100 200
Grease mg/L 50 100 150
Total Coliform No./100m
L
106 – 107 107 - 108 107 - 109
Volatile organic compounds (VOCs) ug/L <100 100 - 400 >400
Source: Metcalf and Eddy (1991, pp. 109 –110) Note: *Values should be increased by amount present in domestic water supply Characteristics of sewage sludge can vary greatly depending on the wastewater sources. Sewage sludge components can include nutrients (such as nitrogen and phosphorus), heavy metals (e.g. arsenic, cadmium, chromium, lead, maganese, nickel and selenium), organic compounds (e.g. organochlorine pesticides and PCB’s), and pathogens (e.g. viruses, bacteria, helminthes and protozoan). Treatment Options Legislative guidelines define acceptable primary, secondary and tertiary programs for individual sites. The waste streams’ exiting the treatment systems represents the only resource potentially available to agriculture. These include: 1. Biosolids/sludge – the solid residue from a treatment process. 2. Liquid effluent from primary, secondary and tertiary streams. Raw sewage and raw sewage screenings are not available for re-use.
Page 24 of 52

Waste Resource Manual APPENDIX E
Sewage Attachment A shows the basic processes that occur at a sewage treatment plant. The sludge that is collected from primary, secondary and tertiary treatment is biologically processed. This process produces what is commonly known as biosolids. If sludge is not processed further it will either be disposed of in landfill or other disposal facilities. It is recommended that the treated sludge be not used in applications of food crops (especially ‘salad crops’). There are many arguments for and against the use of sewage sludge in agriculture. The main concern is the amount of heavy metals that are found in the sludge and the associated risks to human and environmental health. Sludge can be windrowed (stockpiled/ composted) for three years until such time it is deemed as safe to be used in certain applications. Sludge may be treated with lime to stabilise the sludge and kill pathogens.
Vermicomposting and composting are alternative treatment options however; the concerns of heavy metals still exist. It is necessary to use bulking agents such as straw, green waste or sawdust when using sewage sludge in these applications. This is due to the sewage sludge physical nature, which lends itself to being dense, allowing very little pore space for oxygen to circulate. This can cause anaerobic conditions to develop, which creates odour, acts as an impediment to composting and cause unfavourable conditions for vermiculture/worms. In some cases zeolite is used to stabilise sludge prior to composting or vermiculture practices.
Zeolite is a group of aluminium silicate minerals displaying reversible dehydration.Zeolites show powerful properties of Base Exchange or ion – exchange properties. Zeolite is a porous material having a highly regular structure of pores and chambersthat allow some molecules to pass through and causes others to be either excluded, orbroken down. Zeolite is used to remove ammonia and ammonia ions from wastewater and sludge. Zeolite is able to remove 90% or more of the ammonia concentration. Otherapplications for zeolite include de-nitrification, heavy metals absorption and sludge conditioning. It is used in organic fertiliser and potting mix, in stock feeds and in horticulture. Although zeolite occurs naturally it can also be synthetically made. Further researchfor the use of zeolite is underway in a number of fields including piggeries, feedlots,for odour reduction, industrial uses for water and air filtration and heavy metal recovery in mining, as well as horticulture, to improve yield and fertiliser efficiency.
Effluent from sewage treatment processes can be applied to land or discharged to inland waters. It is necessary that for liquid effluent is treated to levels prior to being applied to land or discharged to waterways. Appendix xx gives a summary of treatment levels. It is recommended that sewage effluent be not applied to ‘salad crops’ (crops such as lettuce) as concerns of bacteria exist and the possible affect on human health issues. Sewage Attachment B Advantages and disadvantages of Using Sewage by-products give a summary of how sewage wastes can be further utilised.
Page 25 of 52

Waste Resource Manual
Attachment One Sewage Treatment P
Collection Via sewer (pipes)
Primary Treatment (physical process)
Sludge digestion: The use oprocesses to thicken and s
sludge.
�� Grit chambers – removes heavier suspended solids (mainly inorganic);
�� Primary sedimentation tanks – moves lighter floating and settleable
�
��
Waste water Sludge
Landfill
Initial screening – removes floating matter;
Pa
APPENDIX E
rocess
Secondary Treatment (biological process)
Converts the dissolved and non-settleable organic matter into a
settleable form through biological oxidation. Processed via:
Tertiary Treatment (physical, chemical and biological processes). Further reduces nutrients, solids and organics from secondary treatment
f biological tabilise the
Use of secondary sedimentation or clarification tanks Biological filters or activated sludge:
� Filtration and/or disinfection.
�� Retention and maturation ponds;
�� Biological treatment;
Treated wastewater is discharged according to licence conditions
ge 26 of 52
Waste Resource Manual APPENDIX E
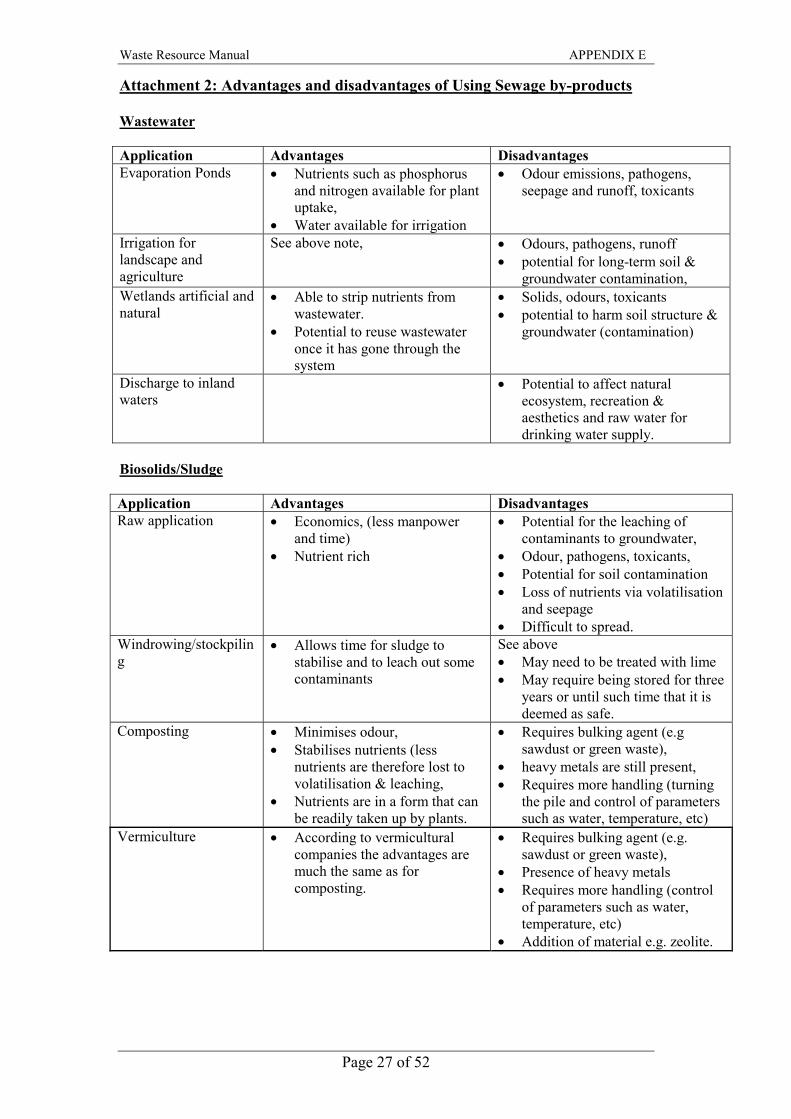
Attachment 2: Advantages and disadvantages of Using Sewage by-products Wastewater Application Advantages Disadvantages Evaporation Ponds �� Nutrients such as phosphorus
and nitrogen available for plant uptake,
�� Water available for irrigation
�� Odour emissions, pathogens, seepage and runoff, toxicants
Irrigation for landscape and agriculture
See above note, �� Odours, pathogens, runoff �� potential for long-term soil &
groundwater contamination, Wetlands artificial and natural
�� Able to strip nutrients from wastewater.
�� Potential to reuse wastewater once it has gone through the system
�� Solids, odours, toxicants �� potential to harm soil structure &
groundwater (contamination)
Discharge to inland waters
�� Potential to affect natural ecosystem, recreation & aesthetics and raw water for drinking water supply.
Biosolids/Sludge Application Advantages Disadvantages Raw application �� Economics, (less manpower
and time) �� Nutrient rich
�� Potential for the leaching of contaminants to groundwater,
�� Odour, pathogens, toxicants, �� Potential for soil contamination �� Loss of nutrients via volatilisation
and seepage �� Difficult to spread.
Windrowing/stockpiling
�� Allows time for sludge to stabilise and to leach out some contaminants
See above �� May need to be treated with lime �� May require being stored for three
years or until such time that it is deemed as safe.
Composting �� Minimises odour, �� Stabilises nutrients (less
nutrients are therefore lost to volatilisation & leaching,
�� Nutrients are in a form that can be readily taken up by plants.
�� Requires bulking agent (e.g sawdust or green waste),
�� heavy metals are still present, �� Requires more handling (turning
the pile and control of parameters such as water, temperature, etc)
Vermiculture �� According to vermicultural companies the advantages are much the same as for composting.
�� Requires bulking agent (e.g. sawdust or green waste),
�� Presence of heavy metals �� Requires more handling (control
of parameters such as water, temperature, etc)
�� Addition of material e.g. zeolite.
Page 27 of 52
Waste Resource Manual APPENDIX E
5.0 ABATTOIRS References:
Australian and New Zealand Environment and Conservation Council (ANZECC) (December 1994) ‘Environmental Management Guidelines - Draft’ Queensland: Department of Environment and Heritage. Hodgens, N. (1991) “Pig and Poultry Products – Pig Products Study Book 2,’ Queensland: Distance Education Centre, University of Southern Queensland. Johns, M.R., Harrison, M.L., Hutchinson, P.H., Beswick, P. (1996) ‘Sources of Nutrients in Wastewater from Integrated Cattle Slaughterhouses – Paper,’ Britain: Elsevier Science Ltd. McNeil, I., Husband, P. (1995) ‘Water and Waste Minimisation.’ Queensland: Australian Meat Technology Pty Ltd. Meat Research Corporation (April 1994 – June 1998) ‘Meat Industry EnviroFacts – Environmental Issues Newsletter.’ Miller, J.H., Jones, N. (1995) ‘Organic and Compost-Based Growing Media for Tree Seedling Nurseries,’ United States: The World Bank. Scaria, K.J. (1989) ‘Economics of animal by-products utilisation.’ Italy: Food and Agriculture Organization of the United Nations. World’s Poultry Science Association (1974) ‘Proceedings from The Australasian Poultry Science Convention.’ Australia: Australian Branch of the World’s Poultry Science Association. Internet Sources �� Slaughtering Paper http://www.clues.abdn.ac.uk:8080/mirrors/growth/ch1.9.html �� Cornell University Compost pages http://www.cals.cornell.edu/dept/compost/frame1.html http://www.cals.cornell.edu/dept/compost/OnFarmHandbok/apa.taba1.html �� Abattoir process papers http://www.usd.gov.hk/ENH/meat/pigflow2.gif http://www.usd.gov.hk/ENH/meat/catflow2.gif �� Red Meat facts Paper http://dove.mtx.net.au/~kyloes/redmeatfacts.html
Page 28 of 52

Waste Resource Manual APPENDIX E
General Abattoirs slaughter animals (sheep, cattle, pigs or chickens) for commercially producing meat or meat products for human consumption. Abattoirs can provide meat for the domestic market, overseas market or both. Small butcheries and abattoirs are not included in the above definition, as operation frequency and size do not make them a major contributor to waste loads in the QMDB. Fifteen operational abattoirs located in this region have been identified to date. A few of these specialise in specific animals (pigs or cattle only), whilst the others slaughter a combination of animals. The processes involved in the abattoir process can be seen diagrammatically in Figure A: ‘Typical processes undertaken in an abattoir’. For a more detailed description of the processes undertaken at an abattoir see Appendix xx or the following web sites. http://www.usd.gov.hk/ENH/meat/catflow2.gif, http://www.usd.gov.hk/ENH/meat/pigflow2.gif and http://www.clues.abdn.ac.uk:8080/mirrors/growth/ch1.9.html
Figure A: Typical processes undertaken at an Abattoir
Stunning
Lairage (Holding pens)
Wastes produced from the above activiti
Activity Was
�� Lairage ��
�� Stunning ��
�� Exsanguination ��
�� Scalding and hairing ��
�� Evisceration ��
�� Boning and packaging ��
Pa
Exsanguination (Sticking and
Scalding and dehairing
es include:
te Produced
Manure (urine and faeces), pen w
None
Blood, wastewater from cleaning
Hair, feathers
Non-edible offal, fat, trimmings,
wastewater from cleaning, paunc
Bones, trimmings, packaging was
ge 29 of 52
Evisceration (Cleaning and trimming of
Dressed
Boning andTransport to
ashdown
.
non-renderable offcuts,
h.
tes

Waste Resource Manual APPENDIX E
Waste Sources
A majority of the waste produced in an abattoir is in a liquid form. Wastewater is generated from wash down of yards, transport vehicles and wash down from the slaughter sheds. Solid wastes are generated from the following areas:
�� Animal holding yards,
�� Slaughter house/processing areas,
�� Waste treatment plants,
�� Paper and plastics from packaging,
�� None rendered animals (may include diseased animals or off cuts),
�� General maintenance, kitchen and office wastes.
Paper and plastics from packaging and kitchen and office wastes are collected and taken to landfill by commercial rubbish collectors (e.g. JJ Richards and Sons Pty Ltd). Wastes from the other waste sources include manure (urine and faeces), blood, fat tissue, hair, feathers, wool, trimmings, bone, paunch and condemned material (foetal material, inedible tallow). Some of this material is able to be rendered, value-added (e.g. blood meal) or for nursery applications. It is important to note that the major wastes that are of concern will include wastewater, manure and paunch. Typical Waste Volumes Waste volumes will vary greatly between animal types slaughtered and abattoir operations. Effectively the larger the animal slaughtered is the greater the volume of liquid effluent generated. Other factors that impact upon volumes include: �� The amount of manure produced will depend on the time spent by the animals in the
holding yard prior to slaughter. �� Solid wastes can depend on the effectiveness of the screens and volume of liquid
effluent can depend on the current practices (e.g. water reuse during the various processes).
�� Throughput per day. The amount of animals slaughtered per day can affect the volumes of generated effluent.
Water consumption in an abattoir can be quite high. Wastewater generated will depend on the management practices of the abattoir and the efficiency of recycling or reuse in other areas. A survey undertaken by the Meat Research Corporation (April 1995) found that from the seven abattoirs surveyed, water consumption ranged between 3.3 – 11.7 kL/tonne of Hot Standard Carcass Weight (HSCW), with the average water consumption being 7.4 kL/tonne HSCW. Solid wastes of concern include manure, diseased carcasses and paunch. Other by-products such as bone, blood, hides and skins and offal are often value added and are not considered a waste product in this report.
Page 30 of 52

Waste Resource Manual APPENDIX E
Table 9: Approximate amount of wastes produced during the abattoir process for
pigs and cattle (indicative only)
Animal Manure (kg/day) Offal and paunch (% Of total body weight)
Cattle 18-36 23.2 Pigs 16-19 24
Adapted from: Hodgens (1991, p4.8), Scaria, K.J. (1989), Red Meat Facts web site, http://www.clues.abdn.ac.uk: 8080/mirrors/growth/ch1.9.html, Various EnviroFacts Newsletters.
Table 9 gives an indication of waste volumes. However if volumes are required for an individual site it is recommended that volumes be measured at the site. The values indicated above will vary according to the size and age of the animal, amount of material included in the final product (e.g offal is often recovered and used in other applications e.g. rendered).
Waste Characteristics Effluent characteristics vary greatly with the animal being processed. The Meat Industry EnviroFacts Vol. 2 No. 1 April 1995 indicates typical pollutant levels and daily masses in wastewater containing manure and paunch. The following table(s) should be used for indicative values only as little background information was supplied with the results. The animal(s) processed in these tables are unknown. Table 10: Typical pollutant levels and daily masses in wastewater containing manure
and Paunch (Indicative) Analysis Typical Range
(mg/L)
Minimum Recorded value
(mg/L)
Range of Daily Masses
(kg/tonne HSCW) Total Suspended Solids 800-4500 824 0.8-2.3 Total Phosphorus 80-140 81 0.02-0.35 Total Nitrogen 90-320 89 0.06-0.73 COD 3000-13500 3310 2.7-13.7 Sodium 300-750 320 0.14-1.61 Oil and Grease 600-1500 670 0.6-4.3 Temperature Cold-Warm 31oC - pH 6.8-7.9 N/A -
Source: EnviroFacts Vol. 2 No. 1 April 1995, page 1 Note: HSCW – Hot Standard Carcass Weight Waste characteristics should be analysed at individual plants if required. The variation in levels and masses can be affected by the process and animal(s) slaughtered at the plant. The above values can be used to calculate volumes of pollutant levels in abattoir waste streams.
Page 31 of 52

Waste Resource Manual APPENDIX E
Example: Question: An abattoir slaughtering 1000 head of cattle per day, during a five-day week. If the HSCW is on average 350kg, what is the average amount of total nitrogen (tonnes) produced in the waste stream each year? Answer: Table 10 suggests total Nitrogen range 0.06 – 0.73 kg/tonne. HSCW. Average = 0.4 kg/tonne. HSCW Conversion of HSCW into tonnes = 350kg/1000 = 0.350 tonnes :.Nitrogen per day = 0.0.4kg/Tonne x 1000 x 0.350 Tonnes =140 kg of N per day For 5 day 140 kg x 5 = 700 kg/week There are approximately 45 working weeks in a year Therefore, in one year 700kg/wk x 45wk = 31.5 tonnes of Nitrogen per year Treatment Options Abattoirs have various systems available to them for treatment of wastewater. The wastewater treatments should allow for fat recovery as fat is a useful by-product. Systems available have various removal efficiencies as indicated in Table 11. Wastewater treatment is necessary to remove solids from the liquid stream. Once the solids are removed from the liquid stream, wastes disposal becomes more efficient.
Table 11: Removal efficiencies of wastewater treatment unit processes
Removal efficiency (%)a System
Suspended solids
Fat, oil and grease Biological oxygen demand
Screening 15-60 N/Ab N/A Centrifugation 50-60 50-60 N/A
Catch basins (settling basins) 40-50 50-60 20-30 Air Flotation 60 30-90 25-60
a Removal efficiencies reported are for ideal operating conditions
b Not available
Source Meat Industry EnviroFacts (August 1995, p4) After the initial treatment of the wastewater via one or more of the above systems mentioned in Table xx, liquid effluent is treated by lagoons (anaerobic and aerobic) or other effective means. Once treated the liquid waste stream can be irrigated, or released into a sewer system, (dependant on licence conditions). It is important to schedule irrigate as to minimise the affect on the environment and maximise plant uptake of the nutrient rich wastewater. Re-use of the wastewater can be inhibited by the pathogens present and the system used to treat the wastewater.
Page 32 of 52

Waste Resource Manual APPENDIX E
As mentioned prior a majority of by-products can be used in other applications these include: �� Blood can be used in stock feeds, fertiliser applications, food processing (e.g.
sausages), �� Bone is used in stock feed, fertiliser, glue or rendered. �� Trimmings, meat scraps are often taken to be rendered. �� Hair and wool can be can be composted or other applications. �� Fat is used in a range of applications such as lubricants, candles, fertilisers, animal
feeds, margarine and glycerine for explosives. �� Hoof and horns: Rendered. �� Hides and skins can be used for leather goods. Manure and paunch have successfully been treated by composting and by vermiculture (worm treatment) to make a quality fertiliser and soil conditioners. Manures can be applied to agricultural areas as mentioned in other sections of this report. It is necessary to schedule application of manures, composts etc, to ensure that there is minimal damage to the environment. If dead animals are required to be disposed due to death prior slaughtering, the animal can be disposed of by burial, landfill or composting (with sawdust).
Page 33 of 52

Waste Resource Manual APPENDIX E
6.0 DAIRY INDUSTRY References: Australian and New Zealand Environment and Conservation Council (ANZECC) (December 1995) ‘Draft Effluent Management Guidelines for Dairy Sheds.’ Victoria: Commonwealth of Australia. Danalewich, J.R., Papagiannis, T.G., Belyea, R.L., Tumbleson, M.E., Raskin, L. (March 1998) ‘Characterization of Dairy Waste Streams, Current Treatment Practices, and Potential for Biological Nutrient Removal – in Water Research (pp. 3555-3572). Gasser, JKR (ed.) (1985) ‘Composting of Agricultural and other wastes,’ London: Elsevier Applied Science Publishers. Harris, J. (1984) ‘Silage Management in Queensland.’ Brisbane: Queensland Department of Primary Industries. Haug, R. (1993) ‘The practical Handbook of Compost Engineering,’ Boca Raton; Lewis publishers. Miller, J.H., Jones, N. (1995) ‘Organic and Compost-Based Growing Media for Tree Seedling Nurseries,’ United States: The World Bank. Ministry of Agriculture, Fisheries and Food (1976) ‘Organic Manures – Bulletin 210,’ London: Her Majesty’s Stationery Office. Redding, G.J., Foster, M.P. (February 1998) ‘Functional Design Handbook for Australian Farm Buildings.’ Victoria: Agricultural Engineering Section, Department of Civil and Agricultural Engineering, The University of Melbourne. Rustin, B., Lundar, A., Eide, O., �degaard, H. (1993) ‘Chemical pretreatment Of Dairy Wastewater: Paper in Water Science Technology Vol. 28. No.2 pp. 67-76,’ Great Britain. Wrigley, R. (1994) ‘Managing Dairy – Shed Wastes – Vol. 2.’ Victoria: Dairy Research and Development Corporation. Internet Sources �� Draft effluent Management Guidelines for Dairy Sheds http://www.environment.gov.au/epg/pubs/dairysheds.html �� Making Water Conservation a Reality in the Dairy Industry http://ats.com.au/~hortech/dairy.htm �� Dairy Waste Management http://www.drdc.com.au/research/note_4.html �� Murray region Dairy Industry Development Plan http://www.murraydairy.org.au/develop.html �� DAIRYPRAC: Environmentally Friendly Farming – Roger Wrigley http://www.dairypage.com.au/Dairyprac/environm.htm Cornell University On farm composting Handbook http://www.cals.cornell.edu/dept/compost/OnFarmHandbok/apa.taba1.html
Page 34 of 52

Waste Resource Manual APPENDIX E
General Dairy wastes are those derived from the milking of cows in a confined area (usually a shed). Although dairy cattle are free to roam paddocks and not all cows are milked, it is important to note that wastes from dairies are calculated on those cows milked in the shed environment only. (Manures are not calculated for in the paddock). Dairy shed effluent and management can be represented diagrammatically in the figure below.
Figure 12: Diagrammatic Representation of Dairy Shed Effluent and its Overall
Source: ANZECC Draft Guidelines (1995,p8)
Page 35 of 52

Waste Resource Manual APPENDIX E
Waste Sources From the above diagram a number of waste sources have been identified. These include:
�� The shed and yard: which will include wastes such as: �� Manure (urine and faeces), �� Wash down from yard and shed which will include detergent and disinfectant
residues, sand, soil and gravel, �� Spilt milk, �� Waste feed, �� Semi solid – solid scrapings from the yard. �� Storage pits and lagoons, which are treatment facilities for treating may result
in sludge, build up.
Large dairies may have screens in place to separate solid effluent from the liquid effluent stream, in which case another waste would be the screenings. Typical Waste Volumes Management practices will affect the amount of liquid and solid wastes generated at a dairy. The amounts of water used for washing down the shed and yards will not only affect the volume of the liquid stream but also the concentration of effluent components. Waste volumes vary greatly between farms. Factors that affect the volume of waste produced in dairy sheds include: �� Season, �� Herd size, �� Duration of milking, �� Breed of cow, and �� Management practices (e.g. whether or not wastewater is reused). Quantities of dairy shed waste volumes are indicated in the table below. Unless volumes are measured or calculated for individual farms the following should be used as indicative values only.
Table 13: Quantities of Dairy Shed Waste volumes (indicative only) Amount (L/cow/yr) Wrigley Dung and Urine Effluent – Pit & milk room Effluent – Yard washdown Uncontaminated water (coolers, roofs)
750
1840 5840 15400
Redding et al. Total Manure production – liquid* Total manure production – Solid*
1110 – 1550**
1080-1520**(kg/cow/yr)
Source: Adapted from Wrigley (1994, p 28) Redding, Foster (1988, p144), ANZECC Draft Guidelines (1995 p8) Notes: *Results adapted from Redding et al. Based on 450 – 635 kg cows.
**Calculated based on ANZECC Guideline recommendation that 8% of daily excretion is found in dairy shed waste.
Page 36 of 52

Waste Resource Manual APPENDIX E
The above table focuses around the shed environment only and does not consider dry cows or younger cows that may be grazing in the paddock environment. Results for total manure production (liquid and solid) have been included in the table to indicate variation. The discrepancy in the results from those listed above could be a result of many factors, including:
�� Over or under estimation of manures per cow, �� Length of time the cow spends in the milking shed or yard.
The results found by Wrigley have been adopted in the ANZECC Draft Guidelines which are used by environmental regulators as a guide for waste characteristics and volumes. The results obtained by Wrigley provide a better breakdown of waste types, whereas the results provided by Redding et al appear to be volumes produced by the cow not the overall operation. (ie. The overall operation will include the washdown of the shed etc.). Waste Characteristics Waste characteristics will vary with the management practice adopted by the individual dairy and a number of other factors. The table below indicates the variation of characteristics found in the literature.
Table 14: Compilation of dairy Shed waste Characteristics based on per cow
Nutrient Content* kg/day
Source Water %
Density kg/m3
Total Solids (TS) kg/day
Volatile Solids (VS) kg/day
BOD5
kg/day C:N Ratio
N P K Redding et al. (1988, p144)
87.3 995 4.7-6.6 3.9-5.4 0.77-1.1
0.19-0.26 0.033-0.046 0.12-0.17
Wrigley (1994) - - 4.2-4.4 3.2-3.4 0.68-0.98
15:1 – 30:1
0.16-0.24 0.025-0.029 0.12-0.31
Haug (1993 p250)
- - - - - 18:1 1.7-2.0* 1.0* 2.0*
Cornell University
79-83 460-582 - - - 13:1 – 18:1
2.7-3.7* - -
Miller et al. (1995 p52)
- - - - - - 0.29-0.58*
0.17-1.0* 0.1-1.5*
Source: Adapted from Redding, Foster (1988, p144), Wrigley (1994), Haug (1993, p250), Miller et al. (1995, p52), and ‘On-farm Composting Handbook’. Notes: *Figures are percentage of total nutrient content Variations in results are due to a number of factors including:
�� Different units used (e.g. kg versus percentage)
�� Dependant of feed intake of cattle (e.g. Grain fed and pasture compared to exclusively pasture fed cows),
�� Management practices undertaken at the dairy,
�� Fresh water versus recycled water for wash down.
�� Studies were undertaken in different states or countries.
Page 37 of 52

Waste Resource Manual APPENDIX E
It was mentioned earlier in the report that feed may be wasted. Feed wastes can include grain and silage. Silage is the green fodder preserved in a mound, silo or silage pit for use during a later season. Volumes of silage (as do grain) will vary from dairy to dairy and characteristics will vary according to the crop type used for silage, and maturation of the silage. Wasted feed such as silage can be used in various composting applications, if it is not recovered in a different way. The table below is an indication of components of whole plant silage, it is important to note that characteristics may vary for plant used and maturation of silage:
Table 15: Components of whole plant silage (Indicative Values Only) Nutrient Average Range Possible
Nitrogen (%) 1.66 0.77-3.04 Dry Matter (%) 35.0 25-60 Phosphorus (%) 0.28 0.13-0.73 Potassium (%) 0.96 0.38-1.96
Source: Adapted from Harris (1984, p 89) and ‘On-Farm Composting Handbook’ The variation in possible nutrient contents will depend on:
�� Material ensilaged, �� Maturation of the silage, �� Initial nutrient percentage of material prior to ensiling.
Treatment Options The size of the dairy will often determine what treatment practices are available for dairy waste management. Large dairies may have screens available for solid separation, however a majority will have nothing. A majority of the waste from a dairy shed will be in a liquid form. Liquid wastes can be reused for irrigation on crops or pasture. Scheduling irrigated wastewater will be required to ensure runoff and leaching into the ground water is minimal and the nutrients taken up by the crop or pasture are optimised. Solids (sludge and manure) generated from the dairy process can be successfully applied to land however nutrient loss and physical handling often poses problems. The manure can be stockpiled until it can be applied to land. A more effective means of applying solids to land is by composting or co-composting with feed wastes. Composting allows nutrients to be more available to plants rather than being lost to volatilisation. It also allows the solid matter to be more easily spread. (Stockpiled manure ‘bulks’ and is often hard to spread whilst composted manure does not). The use of vermiculture is also an effective means of treating solid wastes from dairy sheds. Vermiculture requires management to ensure that moisture content, temperature and other factors are maintained at a level to ensure the worms are working efficiently. If pharmaceuticals are used on dairy herds this can affect worms especially if the manure contains traces of chemicals designed to kill intestinal worms.
Page 38 of 52

Waste Resource Manual APPENDIX E
7.0 INTENSIVE POULTRY INDUSTRY References: Australian and New Zealand Environment and Conservation Council (ANZECC) (August 1994) ‘Intensive Poultry Farms – Draft Environmental Guideline.’ Queensland: Department of Environment and Heritage. CIGR – The International Commission of Agricultural Engineering (ed.) 1999 “CIGR Handbook of Agricultural Engineering – Animal Production & Aquacultural Engineering Volume 2“Chapter 6 Waste management and recycling of Organic Matter:”” United States of America: American Society of Agricultural Engineers. Miller, J.H., Jones, N. (1995) ‘Organic and Compost-Based Growing Media for Tree Seedling Nurseries,’ United States: The World Bank. Ministry of Agriculture, Fisheries and Food (1976) ‘Organic Manures – Bulletin 210,’ London: Her Majesty’s Stationery Office. Patil, M.S. (1991) ‘Pig and Poultry Products – Study Book 1: Poultry Products.’ Toowoomba: Distance Education Centre. Redding, G.J., Foster, M.P. (February 1998) ‘Functional Design Handbook for Australian Farm Buildings.’ Victoria: Agricultural Engineering Section, Department of Civil and Agricultural Engineering, The University of Melbourne. World’s Poultry Science Association (1974) ‘Proceedings from The Australasian Poultry Science Convention.’ Australia: Australian Branch of the World’s Poultry Science Association. Internet Sources �� Alabama Cooperative Extension System http://ext.msstate.edu/anr/poultry/poultrypapers/twsdisp.htm
http://www.msstate.edu/dept/poultry/complit.htm �� Mitchell C.C. (1995) ‘Boiler Litter as a Source of N for Cotton,’ http://hubcap.clemson.edu/~blpprt/chick.html �� Mitchell C.C., Donald, J.O., Martin, J (1995) ‘The value and Use of Poultry
Manures as Fertilizer’ http://hubcap.clemson.edu/~blpprt/Aub-244.html
�� Poultry Manure as a Fertiliser source http://ces.soil.ncsu.edu/soilscience/publications/Soilfacts/AG-439-05/body.htm http://bae00du.bae.ncsu.edu/bae/programs/extension/publicat/wqwm/ag439_5.html �� Virginia Cooperative Extension: linked with Alabama Cooperative Extension http://ext.msstate.edu/anr/poultry/poultrypapers/twsdisp.htm
�� Composting Dead Poultry http://www.ext.vt.edu/pubs/poultry/442-037/442-037.html
�� Fulhage, C.D., Vandepopuliere, J.M., Lyons, J.J. (University of Missouri –Columbia) �� Composting layer Mortalities: Agri-Foods Composter http://muextension.missouri.edu/xplor/waterq/wq0211.htm
Page 39 of 52

Waste Resource Manual APPENDIX E
�� Fertiliser under Organic farming http://www.ozemail.com.au/~qrhee/worm030.htm �� Poultry Manure Management http://www.nal.usda.gov/wqic/Bibliographies/poultry.html �� Mississippi State University
�� ‘Broiler Litter as a Feed or Fertiliser in Livestock Operations’ http://ext.msstate.edu/pubs/pub1998.htm
�� Nitrate in Ground water: Sources and Concerns
http://www.inform.umd.edu/EdRes/Topic/AgrEnv/ndd/watermgt/NITRATES_IN_GROUNDWATER_SOURCES_AND_CONCERNS.html �� Animal Waste II: Animal Agriculture http://www.cnie.org/nle/ag-48a.html
Page 40 of 52

Waste Resource Manual APPENDIX E
General The poultry industry consists of two distinct sub-industries, one based upon egg production (layers) whilst the other is based upon meat production (broilers). There are a number of ways to undertake these activities however this part of the report will focus on chickens raised in sheds for either egg production or meat production. Broilers: Chickens are housed and raised within large sheds, where they are fed and watered almost continuously and there is some degree of climate control. The chickens are reared on 150-200 millimetres of deep litter (bedding material) such as straw, wood shavings and/or sawdust. The chickens are removed for processing at 6-8 weeks of age. Once removed the litter is removed and the shed is cleaned and the cycle repeated. Layers: Layers are introduced to cages (within sheds) at an approximate age of 20 weeks. Cages are designed so that droppings fall through the wire mesh floor and collect in dry ‘cones’ of manure beneath the cages. It is suggested that laying hens are kept for one year and than sold to an abattoir or as dressed hens. (Free-range layers can be hosed in sheds similar to that of broiler chickens or allowed to roam in a yard. Wastes would be similar to broiler chickens in this case). Waste Sources Waste types can be the same for both industries however; they do vary depending on the desired output of production. The wastes produced include:
�� Manure �� Defected eggs – these may include eggs that are of poor shell quality,
damaged shells, unhatched embryo, blood spots or aged eggs. �� Bedding material – bedding material can include straw, sawdust and manure
mixtures and some feed. �� Spilt feed or uneaten feed. �� Feathers, �� Dead animal: these may include diseased chickens.
Typical Waste Volumes Volumes of manure, mortalities and litter will vary between laying hens and broiler chickens. The volumes will depend on management practices, animal hygiene and the feed conversion of the animal.
Mortalities Mortalities in poultry farms generally falls into two categories: 1. Normal mortalities that occur on a daily or weekly basis and 2. Whole flock disposals that can occur if there is a disease outbreak. Fluctuations in poultry mortality are not uncommon. In Australia it is suggested that on average the mortality rates for broiler and laying hens are as follow (ANZECC Draft Guidelines for Poultry Sheds 1994): �� Broiler Flocks: The average mortality rate is 4% over a seven-week growing period.
The turn over for broilers is five batches per year on average. �� Laying hens: The average mortality rate is approximately 1% per month.
Page 41 of 52

Waste Resource Manual APPENDIX E
Litter The volume of litter/bedding produced each year will depend on:
�� Size of the sheds, �� How often litter is removed from the sheds, �� Depth of litter applied. (Sources from the United States suggest a litter depth
of 120-150 cm, be applied to the shed floor).
Manure Production Manure generated from poultry farms generally varies between broiler and laying hens. Table 16 indicates the volume of manures able to be generated in poultry farms.
Table 16: Quantities of manure (various sources) Total Manure Production Source
Layers (kg/day)
Broilers (kg/day)
Layers (L/day)
Broilers (L/day)
Redding et al. (1988, p144) 0.1 0.06 0.1 0.07 ANZECC Draft Guidelines (1994) 0.14* 0.27* - - CIGR (1999, p178) 0.06 0.08 0.06 0.08 Animal Waste II 0.1** 0.16** - -
Notes:
*Total manure including liquid. **Adapted from Animal Waste II
The differences in results from the above table could be due to the following: �� Manure totals (kg/day) includes solids and liquid volumes, �� Results based on findings of sheds with different management practices; it
appears that some management practices include sheds being hosed/cleaned on a regular basis.
�� Waste calculations varied between the four sources.
Page 42 of 52

Waste Resource Manual APPENDIX E
Waste Characteristics Characteristics of waste will vary due to a number of reasons. These include:
�� Feed type available to the chickens, �� Age of the chickens, �� If chickens are broiler or laying hens, �� Type of housing and operational procedures (e.g. if manure is collected daily
or monthly), �� If there is litter in the shed, �� Litter type (straw, sawdust etc) �� Frequency of the litter being changed.
Table 17 indicates variations that can occur in poultry manure as a result of the above factors.
Table 17: Characteristics of Poultry Manure Nutrient Content
kg/day Source Poultry Water
% Density kg/m3
Total Solids (TS)
kg/day
Volatile Solids (VS)
kg/day
C:N ratio
N P K Layers* 74.8 960 0.024 0.017 - 0.0013 0.0005 0.00054 Redding et al
(1998, p144) Broiler* 74.8 960 0.016 0.011 - 0.0011 0.00024 0.00034 Layer 71 - - - 0.3-
5.7:1 0.011 0.007 0.005 Ministry of
Agriculture, fisheries & food (1976,
p22-5)
Broiler** 28-31 - - - 0.4-5.4:1
0.011-0.016
0.009-0.011
0.001
Miller et al (1995, p52)
Chicken - - - - - 0.0163 0.0154 0.006-0.01
Layer as excreted
75 - 0.015 0.01 7:1 0.0008 0.00031 0.00034
Broiler as excreted
75 - 0.02 0.015 8:1 0.0011 0.00034 0.0005
Layer high rise
50 - 0.012 - - 0.0004 0.00027 0.0003
CIGR (1999, pp. 178-9)
Broiler (litter)
24-34 - 0.026 0.021 9:1 0.0003 0.00034 0.0004
Notes: * Based on figures of N, P, K (kg/day/bird) **Figures vary according to deep litter or broiler only. The figures appear to vary greatly in nutrient content. This can be due to a number of reasons including:
�� Age of manure sampled, �� Type of feed, �� Sampling point (e.g. if characteristics were sampled after storage, taken from
within the shed), �� If material analysed included other material such as litter.
Page 43 of 52

Waste Resource Manual APPENDIX E
Treatment Options Any dead poultry must be disposed of a way so that no disease is spread to other birds. If there is mass mortality from a disease outbreak birds are disposed in such a way to eliminate disease spreading to new and existing flocks. Composting, burial or other acceptable means can effectively dispose of normal mortality. There is extensive literature available on the composting of poultry mortalities and litter/bedding. These references can be found via the Internet at the following sites:
�� http://www.ext.vt.edu/pubs/poultry/442-037/442-037.html
�� http://muextension.missouri.edu/xplor/waterq/wq0211.htm
�� http://www.msstate.edu/dept/poultry/complit.htm Manures from the birds are collected in different ways. Laying hen sheds are designed to have manure (dry cones) scraped from under the pens. Broiler sheds are removed once each time the end of a cycle of grown to market stage is complete. Wastes can be directly spread to land however as for other application rates a soil analysis should be undertaken to ensure nutrient balance. Wastes from the poultry industry can be successfully composted. The deep litter systems for broilers seems to lend itself more readily for this application although introducing sawdust, straw to laying hen manure will work quite effectively. It has been a misconception that a majority of chicken manures are used in fertiliser applications (e.g. “Dynamic Lifter”) and poultry farms on the Darling Downs have little wastes to be of concern.
Page 44 of 52

Waste Resource Manual APPENDIX E
8.0 INTENSIVE PIGGERY INDUSTRY References: Australian and New Zealand Environment and Conservation Council (ANZECC) (December 1995) ‘Draft Effluent Management Guidelines for Intensive Piggeries.’ Victoria: Commonwealth of Australia Casey, K.D, Gardner, E.A McGahon, E.J (1995) ‘Characterisation of Piggery anaerobic Lagoons in Southern Queensland. Proceedings of Manipulation Pig Production V,’ Canberra: Australasian Pig Science Association Conference. CIGR – The International Commission of Agricultural Engineering (ed.) 1999 “CIGR Handbook of Agricultural Engineering – Animal Production & Aquacultural Engineering Volume 2“Chapter 6 Waste management and recycling of Organic Matter:”” United States of America: American Society of Agricultural Engineers. Intensive Livestock Environmental Management Group (1997) ‘Environmental Management Guidelines for Queensland Piggeries.’ Toowoomba: The State Of Queensland, Department of Primary Industries.
Kruger, I., Taylor, G., Ferrier, M. (1995) ‘Australian Pig Housing Series – Effluent at Work.’ Tamworth: NSW Agriculture.
Patil, M.S. (1991) ‘Pig and Poultry Products – Study Book 2: Pig Products.’ Toowoomba: Distance Education Centre. Redding, G.J., Foster, M.P. (February 1998) ‘ Functional Design Handbook for Australian Farm Buildings.’ Victoria: Agricultural Engineering Section, Department of Civil and Agricultural Engineering, The University of Melbourne. Internet Sources Department of Primary Industries: Piggery Publications list http://www.dpi.qld.gov.au/ilems/information/Piggerypub/content.html Ontario http://www.gov.on.ca/OMAFRA/english/livestock/swine/facts/85-109.htm
Page 45 of 52

Waste Resource Manual APPENDIX E
General The intensive piggery industry is the production of pigs in confined spaces. A “piggery includes buildings in which the animals are housed and adjoining yards, loading and unloading areas, effluent and solids collection, storage and treatment facilities, and feed preparation and storage areas.” (Intensive livestock Environmental Management Group 1997, p 1). To date the AgWise project has identified 177 intensive piggeries within the QMDB. These piggeries vary in size and management. From information collected and calculations from the AgWise database the total number of pigs and manure have been calculated. �� Number of pigs (per year) = 219,000 �� Manure total (per year) = 2282 tonnes �� Average herd size (per site) = 1275 pigs �� Average amount of volume (per site) = 13.15 tonnes per year
Waste Sources The following report on intensive piggery operations will emphasize the wastes produced from a traditional housing system where flushing sheds on a frequent basis is undertaken. As the traditional housing systems are a majority within the QMDB other systems including “ecoshelters” (deep litter systems) will not be delved upon. Pig production involves inputs such as feed, water, power, feed additives, pharmaceuticals, human resources, and other materials. Waste produced can be in several forms:
�� Wasted or spoilt feed, �� Pig slurry, �� Dead pigs and placental material, �� Bedding material
Generally, most piggery operations involve the collection of wastes by underfloor trenches of various design, sizes, and methods of operation. This waste is an effluent or slurry that is conveyed to sumps or a screen where solids can be separated. Liquid effluent is then treated in lagoons (anaerobic, facultative, aerobic or a combination) prior to being recycled or irrigated onto crop or pasture. (Refer to piggery attachment one).
Typical Waste Volumes Factors that affect volumes of wastes in a piggery include:
�� The number and age of pigs,
�� The treatment type used for processing wastes (e.g. if there is a mechanical means of separating solid waste from effluent, or if the pen is dry scraped rather than hosed).
�� The housing type of the pigs will also affect waste volumes. “Ecoshelters” will have a greater proportion of solid wastes compared to that of a slatted floor shed, which is cleaned by hosing.
�� Feed type. It is known that certain feed will not be digested as well by the pigs.
�� Cleaning frequency of the sheds,
�� Time of the year. Some piggeries are equipped with sprinkler systems as a mechanism to cool down the pigs when it gets to hot,
�� Efficiency of drinking nozzles.
�� Equipment type available.
�� If recycling of water is occurring or not.
Page 46 of 52

Waste Resource Manual APPENDIX E
The Queensland Department of Primary Industries uses standard pig units (SPU’s) as a unit of measurement to determine the size of a pig production enterprise in terms of its waste output. One SPU is defined as “the equivalent amount of volatile solid to that produced by an average size grower pig (approximately 40kg). Volatile solids are the portion of the total solids driven off as volatile combustible gases heated at 550oC (+/- 50oC) for at least 20 minutes. This provides an approximation of the organic matter content.” (Intensive livestock Environmental Management Group 1997, p 9). The table below gives the SPU equivalent for all classes of pigs.
Table 18: SPU Equivalent multipliers for each class of Pig
Pig Classification Mass Range (kg)
Age Range (wks)
SPU Multiplier
Gilt 100 – 160 24 - 30 1.8 Boar 100 - 250 24 - 128 1.6 Gestating Sow 160 - 230 - 1.6 Lactating sow 230 - 160 - 2.5 Sucker 1.4 - 8 1 - 4 0.2 Weaner 8 - 25 4 - 10 0.5 Grower 25 - 55 10 - 16 1.0 Finisher 55 - 100 16 - 24 1.6
Source: Intensive livestock Environmental Management Group 1997, p 9
The table above allows the number of equivalent pigs to be calculated. It is not a means of calculating manure. Once the number of equivalent pigs is known then calculations for manure using worksheets can be undertaken. Waste Characteristics
Waste characteristics will vary between individual piggeries. Characteristics of waste produced at a piggery will be affected by the following factors:
�� Feed (diets e.g. protein diets, phytase),
�� Feed conversion ratio of the animal, (certain feeds will allow pigs to digest feed better and result in the pig gaining weight, whilst other feed types simply pass through the pig’s system).
�� Treatment type (anaerobic ponds will vary from that of aerobic pond characteristics, etc) and frequency of which it is treated (are sheds washdown one a week or once a day?).
�� Effluent reuse (e.g. recycling liquid effluent can increase concentration levels in the effluent stream)
�� Age of pigs and pig type. The following table gives an indication of how waste characteristics can vary with the treatment process and age of the animal.
Page 47 of 52

Waste Resource Manual APPENDIX E
Figure 19: Piggery Effluent Characteristics Nutrient Content
kg/day Literature source Waste source Water
% Density kg/m3
Total Solids (TS)
kg/day
Volatile Solids (VS)
kg/day
C:N ratio
Total N P K Weaner 90.8 960 0.1 0.08 - 0.0073 0.0024 0.0045Grower 90.8 960 0.18 0.14 - 0.013 0.0044 0.0091Finisher 90.8 960 0.41-0.54 0.33-0.44 - 0.031-0.041 0.010-0.014 0.020-0.027
Gestate sow 90.8 960 0.37 0.3 - 0.028 0.010 0.018
Redding et al (1998, p144)
Boar 90.8 960 0.45 1.1 - 0.035 0.012 0.023Ministry of Agriculture, fisheries
& food (1976, p22-5) 31-99 - - - - 0.0004-0.0048 0.0002-0.0042 0.0002-0.0033
Grower 90 - - - 7:1 0.0042 0.0016 0.0012Gilt 90 - - - 7:1 0.0024 0.0008 0.0013
Lactating sow 90 - - - 6:1 0.0047 0.0015 0.003 Gestating sow 90.8 - - - 6:1 0.0019 0.0006 0.0012
Boar 90.7 - - - 6:1 0.0015 0.0005 0.001
CIGR (1999, pp. 178-9) As excreted
Weaner 90 - - - 8:1 0.00060 0.00025 0.0035Anaerobic ponds - - 0.3 0.13 - - 0.007 0.0036
Sludge - - 0.0204 0.0063 - - 0.3723 0.17Kruger et al. (1995)
Pig slurry (not screened)
- - 0.67 - - - 0.85 0.062
Anaerobic Ponds - - 0.12-1.3 0.02-0.4 - - 0.001-.0.012 0.001-0.1845Casey et al (1995)
Sludge - - 0.063-0.343 0.0015-0.02 - - 0.07-2.80 0.02-0.35
Pig slurry
Page 48 of 52

Waste Resource Manual APPENDIX E
Treatment Options Depending on the size of the piggery and casts available will determine the way that wastes are treated. Liquid effluent as mentioned prior could be irrigated onto pasture or crops. Some piggeries have evaporation ponds for liquid effluent. If available screens are used to separate liquid effluent from solid effluent. The screenings are then available to be used in raw application, composting or vermiculture applications. With pig on litter systems the bedding or litter can be used in composting applications. There are ranges of recommended treatment options available to dispose of dead pigs; these include burial, burning and composting. The project will focus on the composting of pig cadavers at demonstration sites. Removal of sludge from ponds requires the dewatering of the ponds and the collection of the sludge. Practices for sludge disposal have included direct application to land and vermiculture. A case study to be written for the project will look at various applications of worms (vermiculture) in the treatment of piggery wastes. Table 20: Average measured effluent characteristics at different stages of the treatment process from various random samples from piggeries in QLD, NSW, and WA.
Parameter Units Prior to screen
Screened liquids
Pond 1 liquor (Screened)
Sludge (Kruger et al)
Final Pond
Total Solids mg/L 49500 8618 3623 Total Suspended Solids
mg/L 6715 447
Volatile Solids mg/L 4411 1809 Phosphorus mg/L 850 109 1696 44 Ortho-phosphorus mg/L 78 1082 28.5 TKN mg/L 2175 1391 854 2617 384 Ammonia Nitrogen mg/L 1800 398 1156 249 Potassium mg/L 618 Sulphate mg/L 69 5.2 26 BOD mg/L 11365 pH mg/L 6.7 7.5 7.7 7.3 8
EC dS/m 10.1 10.3 8.5 Copper mg/L 2.43 25
Chloride mg/L 792 232 810 Sodium mg/L 623 108 603 Calcium mg/L 2210
Magnesium mg/L 833 Source: Kruger, Taylor, Ferrier (1995, p.39) Table 20.
Page 49 of 52

Waste Resource Manual APPENDIX E
INTENSIVE FEEDLOT INDUSTRY References:
Agricultural and Resource Management Council of Australia and New Zealand (ARMCANZ) (1997) ‘National Guidelines for Beef Cattle Feedlots in Australia.’ Australia: Commonwealth of Australia. Clarke, R. (compiler) (1991) ‘Feedlotting Notes – a collection of farm notes.’ Brisbane: Queensland Government. Department of Primary Industries (July 1996) ‘Farm Note Agdex 538 Fertilising with Animal Manures.’ Queensland: The State of Queensland, Department of Primary Industries. Intensive Livestock Environmental Management Services (March 1999) ‘Reference Manual for the Establishment and Operation of Beef Cattle Feedlots in Queensland – Draft 6 March 1999.’ Brisbane: The State of Queensland, Department of Primary Industries. Powell, E (1998) ‘Feedlot Manure a Valuable Fertiliser.’ Dalby: Evan Powell Rural Consultants. Redding, G.J., Foster, M.P. (February 1998) ‘ Functional Design Handbook for Australian Farm Buildings.’ Victoria: Agricultural Engineering Section, Department of Civil and Agricultural Engineering, The University of Melbourne. Tucker, R.W., Watts, P.J., Lott, S.L., Jukes, P. (1991) ‘Lot Feeding in Australia – A Survey of the Australian lot feeding industry.’ Brisbane: Queensland Government. GENERAL “A beef cattle feedlot is a confined yard area with watering and feeding facilities where cattle are completely hand or mechanically fed for the purpose of production. This does not include the feeding or penning of cattle in this way for weaning, dipping or similar husbandry purposes or for drought or other emergency feeding, or at a slaughtering place or in recognised saleyards.” (ARMCANZ, 1997, p.1) The AgWise project has identified Waste Sources Feedlot pens are designed with a slope to encourage runoff, which is collected in a sedimentation pond. Feeding troughs are placed at the upper end of the pens for ease of feeding. From the diagram below effluent is shown, as being liquid form, other forms of effluent will include scrapings from the pen (manure) and effluents derived from truck washdown. Wastes also include dead animals, sludge from sedimentation system and holding ponds and any wasted feed. A schematic layout of a feedlot is shown:
Page 50 of 52
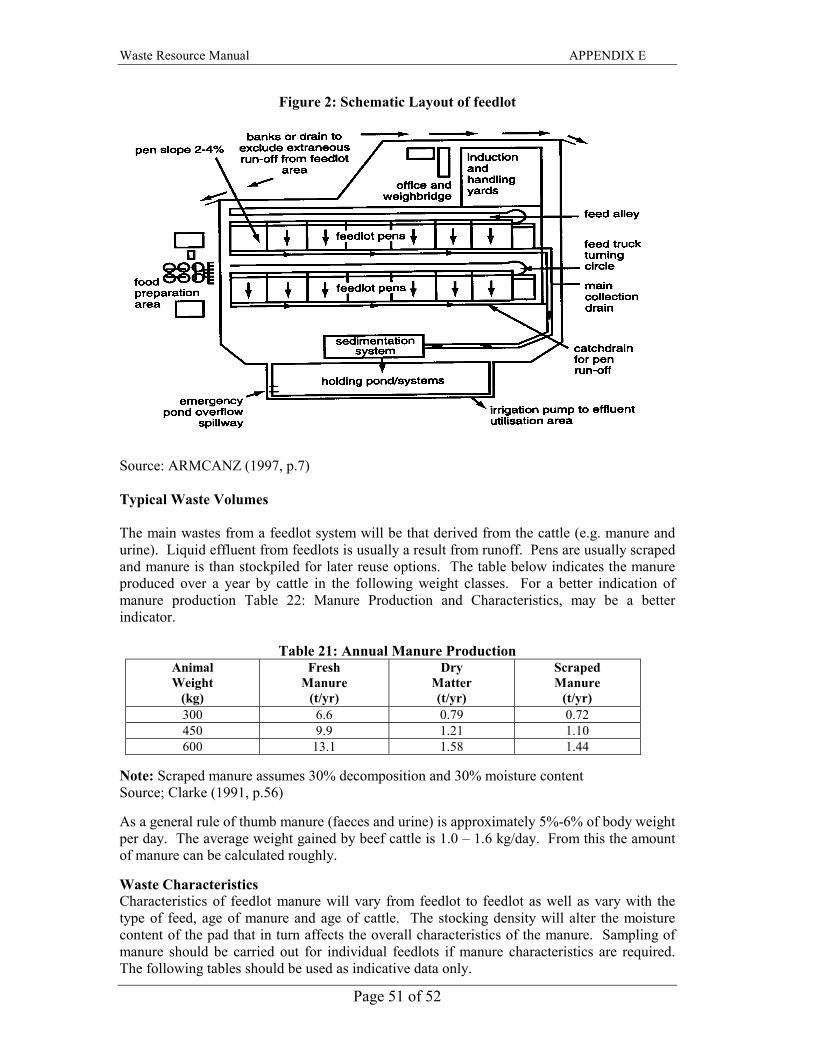
Waste Resource Manual APPENDIX E
Figure 2: Schematic Layout of feedlot
Source: ARMCANZ (1997, p.7) Typical Waste Volumes The main wastes from a feedlot system will be that derived from the cattle (e.g. manure and urine). Liquid effluent from feedlots is usually a result from runoff. Pens are usually scraped and manure is than stockpiled for later reuse options. The table below indicates the manure produced over a year by cattle in the following weight classes. For a better indication of manure production Table 22: Manure Production and Characteristics, may be a better indicator.
Table 21: Annual Manure Production Animal Weight
(kg)
Fresh Manure
(t/yr)
Dry Matter (t/yr)
Scraped Manure
(t/yr) 300 6.6 0.79 0.72 450 9.9 1.21 1.10 600 13.1 1.58 1.44
Note: Scraped manure assumes 30% decomposition and 30% moisture content Source; Clarke (1991, p.56) As a general rule of thumb manure (faeces and urine) is approximately 5%-6% of body weight per day. The average weight gained by beef cattle is 1.0 – 1.6 kg/day. From this the amount of manure can be calculated roughly. Waste Characteristics Characteristics of feedlot manure will vary from feedlot to feedlot as well as vary with the type of feed, age of manure and age of cattle. The stocking density will alter the moisture content of the pad that in turn affects the overall characteristics of the manure. Sampling of manure should be carried out for individual feedlots if manure characteristics are required. The following tables should be used as indicative data only.
Page 51 of 52
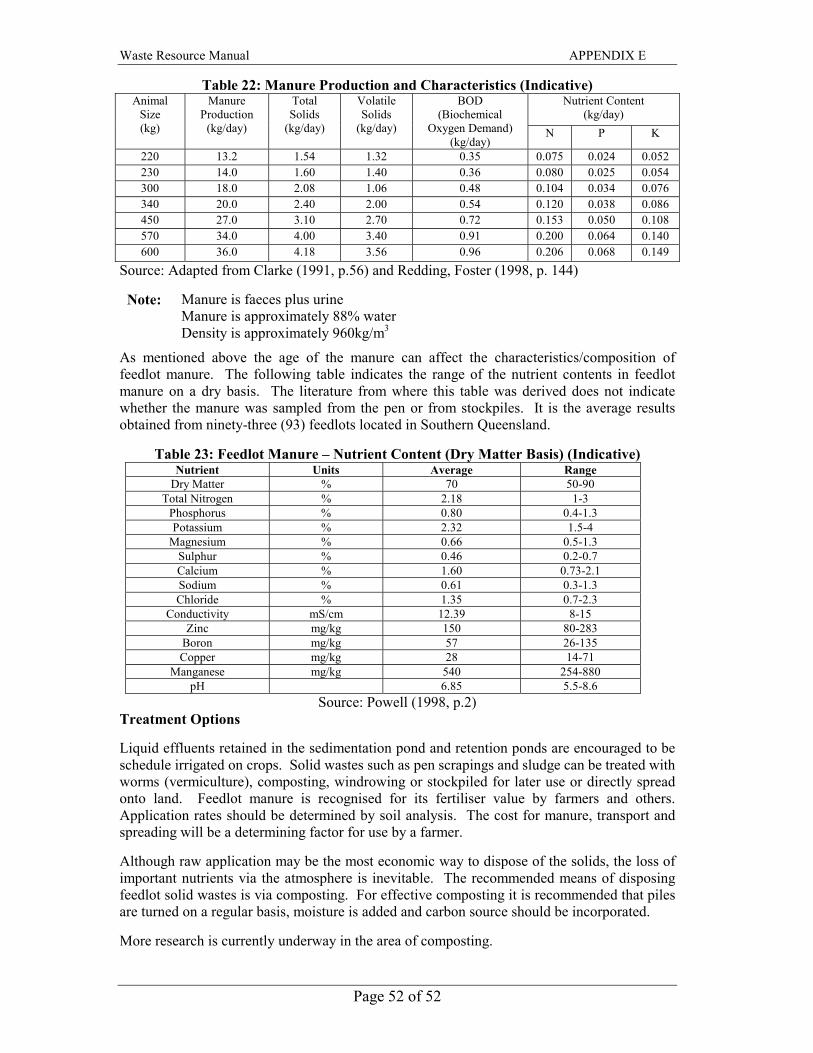
Waste Resource Manual APPENDIX E
Table 22: Manure Production and Characteristics (Indicative) Nutrient Content
(kg/day) Animal
Size (kg)
Manure Production
(kg/day)
Total Solids
(kg/day)
Volatile Solids
(kg/day)
BOD (Biochemical
Oxygen Demand) (kg/day)
N P K
220 13.2 1.54 1.32 0.35 0.075 0.024 0.052 230 14.0 1.60 1.40 0.36 0.080 0.025 0.054 300 18.0 2.08 1.06 0.48 0.104 0.034 0.076 340 20.0 2.40 2.00 0.54 0.120 0.038 0.086 450 27.0 3.10 2.70 0.72 0.153 0.050 0.108 570 34.0 4.00 3.40 0.91 0.200 0.064 0.140 600 36.0 4.18 3.56 0.96 0.206 0.068 0.149
Source: Adapted from Clarke (1991, p.56) and Redding, Foster (1998, p. 144)
Note: Manure is faeces plus urine Manure is approximately 88% water Density is approximately 960kg/m3
As mentioned above the age of the manure can affect the characteristics/composition of feedlot manure. The following table indicates the range of the nutrient contents in feedlot manure on a dry basis. The literature from where this table was derived does not indicate whether the manure was sampled from the pen or from stockpiles. It is the average results obtained from ninety-three (93) feedlots located in Southern Queensland.
Table 23: Feedlot Manure – Nutrient Content (Dry Matter Basis) (Indicative)
Nutrient Units Average Range Dry Matter % 70 50-90
Total Nitrogen % 2.18 1-3 Phosphorus % 0.80 0.4-1.3 Potassium % 2.32 1.5-4
Magnesium % 0.66 0.5-1.3 Sulphur % 0.46 0.2-0.7 Calcium % 1.60 0.73-2.1 Sodium % 0.61 0.3-1.3 Chloride % 1.35 0.7-2.3
Conductivity mS/cm 12.39 8-15 Zinc mg/kg 150 80-283
Boron mg/kg 57 26-135 Copper mg/kg 28 14-71
Manganese mg/kg 540 254-880 pH 6.85 5.5-8.6
Source: Powell (1998, p.2) Treatment Options Liquid effluents retained in the sedimentation pond and retention ponds are encouraged to be schedule irrigated on crops. Solid wastes such as pen scrapings and sludge can be treated with worms (vermiculture), composting, windrowing or stockpiled for later use or directly spread onto land. Feedlot manure is recognised for its fertiliser value by farmers and others. Application rates should be determined by soil analysis. The cost for manure, transport and spreading will be a determining factor for use by a farmer. Although raw application may be the most economic way to dispose of the solids, the loss of important nutrients via the atmosphere is inevitable. The recommended means of disposing feedlot solid wastes is via composting. For effective composting it is recommended that piles are turned on a regular basis, moisture is added and carbon source should be incorporated. More research is currently underway in the area of composting.
Page 52 of 52