Embed Size (px)
Citation preview

1. Corn
Corn is widely grown across southern Ontario. Over the years 2004–2015, grain corn acreage averaged 769,000 ha (1.9 million acres) with an average yield of 9.53 t/ha (152 bu/acre). An additional 118,000 ha (0.3 million acres) is grown as corn silage for livestock feed. Grain corn produced within the province is used for both feed (55%) and industrial (45%) uses.
Tillage To successfully produce corn in Ontario, it is important to consider factors such as soil texture and crop rotation. Factors that will influence tillage options include risk of erosion, availability of equipment and labour and impact on soil health. Soils in Ontario are usually saturated in early spring, and quick dry-down is necessary to ensure timely corn planting. Appropriate use of tillage can increase spring soil dry-down rates by loosening soil. This improves drainage and/or reduces residue cover, which increases rates of soil water evaporation.
The guiding principle behind conservation tillage and soil erosion reduction in corn production should be to maintain 30% of the soil surface covered with crop residue, or living cover, throughout the entire year.
Soil Texture and DrainageIn Ontario, coarse-textured soils (e.g., sand, loamy or sandy loams) that have good internal drainage characteristics show little yield response to tillage (drainage classification: rapid or well). Even for crops that leave large amounts of residue cover, such as grain corn or cereals, there is often little response to tillage. On heavy-textured soils with relatively slow internal drainage, tillage can significantly increase the rate of soil drying and warming. This increases the possibility for timely planting and rapid uniform emergence. Table 1–1, Comparison of two tillage systems on grain corn yield, provides a summary of Ontario tillage
research for corn, following either grain corn or cereals grouped according to soil texture. Tillage increased yield about 70% of the time following cereals, grain corn or soybeans on the medium- and fine-textured sites with an average 5%–7% yield increase.
Crop RotationA good crop rotation can replace a significant amount of tillage. Table 1–1 summarizes Ontario tillage research, conducted on medium- and fine-textured soils, grouped by previous crop. Generally, there is:
• Little corn yield response to tillage following forages. Including forages in crop rotations improves soil structure and may eliminate the need for tillage to improve seedbed tilth.
• Relatively low yield response to tillage following soybeans when compared to either cereals or grain corn, which is partially due to lower crop-residue levels following soybeans in no-till systems.
• High residue levels can reduce early-season soil temperature, resulting in delayed planting, slower corn growth and lower yield potential. Tillage increases corn yield about 75% of the time when following cereals or grain corn on medium- or fine-textured soils, with yield increases averaging 5%–9%.
Other Reasons for TillageThere are other reasons to perform tillage for corn production in addition to increasing soil dry-down rates:
• improved seedbed uniformity, resulting in more consistent planter performance and faster, more uniform corn emergence
• incorporation of surface-applied fertilizer or manure, resulting in increased nutrient availability and/or use efficiency
• termination and/or incorporation of weed or crop residue that can serve as hosts to increase populations of insect pests
• alleviation of soil compaction
1

Table 1–1. Comparison of two tillage systems on grain corn yield
Comparison Type # Sites No-Till MouldboardYield
ResponseMouldboard Win: Loss
Soil texture1 coarse 11 8.22 t/ha (131 bu/acre)
8.16 t/ha (130 bu/acre)
–0.9% 45:55
medium 79 8.66 t/ha (138 bu/acre)
9.16 t/ha (146 bu/acre)
5.6% 72:28
fine 42 8.60 t/ha (137 bu/acre)
9.16 t/ha (146 bu/acre)
6.5% 71:29
Previous crop2 forages 13 8.84 t/ha (141 bu/acre)
8.91 t/ha (142 bu/acre)
0.7% 54:46
soybeans 50 8.98 t/ha (143 bu/acre)
9.04 t/ha (144 bu/acre)
0.9% 56:44
cereals (straw-baled)
75 9.23 t/ha (147 bu/acre)
9.60 t/ha(153 bu/acre)
4.1% 71:29
grain corn 49 7.72 t/ha (123 bu/acre)
8.41 t/ha (134 bu/acre)
9.1% 76:24
Source: Tillage Ontario Database, 2008 (www.tillageontario.com).
1 Trials conducted following cereals (straw-baled) or grain corn (1982–2007).2 Trials conducted on medium- or fine-textured soils following various crops (1982–2007).
Conventional TillageConventional tillage for corn in Ontario consists of fall mouldboard plowing followed in spring by secondary tillage, usually with a field cultivator or tandem disc. Most mouldboard plowing is targeted to an operating depth of 15 cm (6 in.); plowing deeper often results in unwanted mixing of subsoil into the seedbed. The more uniform and level a field is left after fall plowing, the greater the opportunities to reduce secondary tillage costs and improve planter performance. The lack of surface residue in conventional tillage exposes fields to greater erosion risks from water and wind. On complex slopes, tillage can be responsible for causing large quantities of topsoil to move to lower slope positions.
Fall Mulch TillageThe chisel plow, disc-ripper and discs (either tandem or offset) have been the most widely adopted fall mulch tillage tools in Ontario. Tillage research trials conducted across Ontario over the past 20 years have generally shown that disking often resulted in more favourable soil conditions and higher corn yields than chisel plowing. Table 1–2, Impact of fall tillage systems on grain corn yield summarizes the corn yield data from these sites.
Chisel plowing with twisted shovel teeth may leave the soil quite ridged. This can lead to extra costs in secondary tillage (more passes), uneven seedbeds and occasionally excessive soil drying. Using sweep teeth on all or part of the chisel plow overcomes some of these problems. Adding a levelling bar or harrows to the rear of the chisel plow, or timely secondary tillage in the spring can also avoid this. The same approach should be considered with any fall mulch tillage operation. Leaving the soil surface level in the fall allows for single-pass corn planting (no secondary tillage) to become a viable option in the spring. This is a good technique for reducing tillage costs and improving soil structure. Soil surfaces are often left too rough in the fall so that multiple passes of spring tillage are required to make the field fit for planting.
2
Agronomy guide for field Crops

Fall mulch tillage systems should leave the soil surface smooth enough that spring secondary tillage can be minimized.
Vertical TillageVertical tillage is used to reduce any pushing or smearing action that may be caused by tillage tools that engage the ground in the horizontal plane. Many vertical tillage tools are designed to break apart residue into more manageable pieces and distribute crop residue, while causing some soil fracturing and mixing of soil with residue at the surface (Photo 1–1). Classic vertical tillage tools include a range of implements from shanks (parabolic or straight) that generally are without sweeps or wings, to straight or wavy coulters that run parallel to the direction of travel. In reality, quite a number of tillage tools embrace the concept of “vertical” tillage but have employed shallow concavity discs, low profile sweeps and extensive harrows to provide some additional soil disturbance, while attempting to remain true to the idea of tillage without significant inversion and soil smearing.
Photo 1–1. Vertical tillage tools are designed to manage and mix residue with light soil fractioning.
The most effective uses of vertical tillage tools for corn production fall into three categories:
1) Effective secondary tillage where mulch tillage has taken place the previous fall.
2) Single pass residue management and seedbed preparation for corn in lower residue situations (e.g., after soybeans or winter wheat where straw is removed).
3) Residue management and shallow tillage in corn-after-corn rotations where vertical tillage may occur both in the fall and then again in the spring.
Spring Mulch TillageThe best practice for reducing erosion and input costs is to eliminate fall tillage. Producers working on fine-textured soils where crop residues are high following corn, wheat or other crops may be apprehensive about leaving soils untouched in the fall. However, following soybeans, there is little justification for doing fall tillage on most fields in Ontario. Table 1–2, Impact of fall tillage on grain corn yield, illustrates that even on finely textured soils, spring tillage alone (two passes of a field cultivator) was generally sufficient when corn followed soybeans in the rotation. Other demonstration trials established on medium- and coarse-textured soils have shown the same results. Producer experience with spring mulch tillage systems has shown that working undisturbed soils in the spring obtained better results when using high-clearance tines, narrow teeth and/or when packers or rollers were used in conjunction with the field cultivator.
When corn follows soybeans, systems that involve more than spring cultivation do not produce enough extra corn to pay for the fall tillage operation.
3
1. corn

Table 1–2. Impact of fall tillage systems on grain corn yieldMouldboard and chisel plots received spring secondary tillage; fall tandem disc-only plots were planted directly in the spring without any secondary tillage.
Location County Soil Previous CropNo. of years
Tillage Systems
Mouldboard ChiselFall Tandem Disc Only
Alvinston Lambton clay soybeans 3 5.96 t/ha (95 bu/acre)
5.39 t/ha (86 bu/acre)
5.71 t/ha (91 bu/acre)
Fingal Elgin silty clay loam soybeans 3 9.97 t/ha (159 bu/acre)
9.66 t/ha (154 bu/acre)
9.66 t/ha (154 bu/acre)
Centralia Huron silt loam wheat, straw-baled 3 9.16 t/ha (146 bu/acre)
8.72 t/ha (139 bu/acre)
8.84 t/ha (141 bu/acre)
Wyoming Lambton silty clay loam wheat, straw-baled 3 9.97 t/ha (159 bu/acre)
9.72 t/ha (155 bu/acre)
9.85 t/ha (157 bu/acre)
Average 8.78 t/ha (140 bu/acre)
8.41 t/ha (134 bu/acre)
8.53 t/ha (136 bu/acre)
Source: T. Vyn, K. Janovicek, D. Hooker and G. Opuku, University of Guelph.
Fall Strip TillagePerforming fall tillage confined to narrow zones that correspond to next year’s corn rows has received considerable attention in the past few years. The strips of soil are loosened, generally off-set from the previous row, cleared of residue and often somewhat elevated, while leaving the rest of the field covered with protective crop residue. The next spring, the strips are drier, less dense and more suited to “no-till” planting.
Table 1–3, Fall strip-tillage for corn after winter wheat (straw removed), summarizes Ontario research comparing a trans-till zone tillage tool to conventional and no-till
Table 1–3. Fall strip-tillage for corn after winter wheat (straw removed)
Tillage System
Soil Moisture in Early
May
Yield
Fine- Textured Soil
Medium-Textured Soil
Fall mouldboard
23.3% 9.97 t/ha (159 bu/acre)
9.22 t/ha (147 bu/acre)
Fall zone-till 25.6% 9.97 t/ha (159 bu/acre)
8.72 t/ha (139 bu/acre)
No-till 29.8% 9.35 t/ha (149 bu/acre)
8.47 t/ha (135 bu/acre)
Source: T.J. Vyn, 1997, University of Guelph.
systems in winter wheat stubble. This data indicates that on fine-textured soils, strip-tillage in the fall generally produced higher yields than no-till systems. Only at the Wyoming, ON location did fall strip till yields equal those obtained with the conventional mouldboard system. Subsequent research has supported the observations shown in Table 1–3, that on fine-textured soils following wheat, fall strip-tillage generally resulted in higher corn yields than no-till and equal yields to those of conventional tillage systems. Research results have not consistently shown a yield advantage for fall strip-tillage systems over no-till on medium-textured soils or when following soybeans.
Early spring moisture measurements on the same tillage plots generally showed that fall strip-tilled zones were consistently drier in early May compared to the undisturbed no-till plots (Table 1–3). Yield responses in side-by-side trials have not always indicated a benefit to fall strip-tillage, but producers with large acreage, poorly draining soils or high surface residues may gain a consistent benefit from strip-tillage in terms of planting timeliness, emergence uniformity and early corn growth. Performing secondary spring strip-tillage in fall strip-tillage zones has increased yields in instances where fall strip-tillage yields are less than those in conventional tillage systems.
Strip-tillage systems also provide an opportunity to band fertilizers that in a no-till system must be broadcast. Applying fertilizer using the strip-tillage system may also replace the need to apply banded
4
Agronomy guide for field Crops
starter fertilizers through the planter. Fall banding of phosphorus and potassium in strip-tillage systems can produce higher yields than when similar rates of fertilizer were broadcast in no-till systems. However, corn yields from using strip-tillage systems to band-apply phosphorus (P) and/or potassium (K) in the fall have generally been lower than when P and K have been applied through the planter. This is especially evident when P and K soil fertility levels were medium or low.
Spring Strip Tillage Spring strip tillage offers an opportunity to prepare fine, residue free seedbeds in which the corn planter can operate. Most spring strip tillage operations are restricted to the lighter textured soils, though in some cases well drained, medium textured soils are suitable for this one pass tillage option. The spring strip tillage operation usually precedes the planter by no more than 6–12 hours in order to prevent the seed zone from excessively drying out. Spring strip tillage has also been used as a technique for applying all or part of the corn crop’s nitrogen (N), P and K requirements. To avoid seed or seedling burn from fertilizer placed in the seed zone three approaches can be taken:
1. Reduce the amount of fertilizer to rates that are similar to the planter banded safe rates, see Chapter 9, Table 9–22, Maximum safe rates of nutrients in fertilizer.
2. Disperse the fertilizer throughout the strip to avoid any concentrated zones.
3. Use fertilizer products that are less likely to cause salt or ammonia injury (i.e., coated urea). Spring strip tillage systems that include a fertilizer application option can reduce the cost and complexity of a typical conservation tillage corn planter (e.g., no coulters or row cleaners are required, reduced down pressure requirement and the elimination of dry fertilizer).
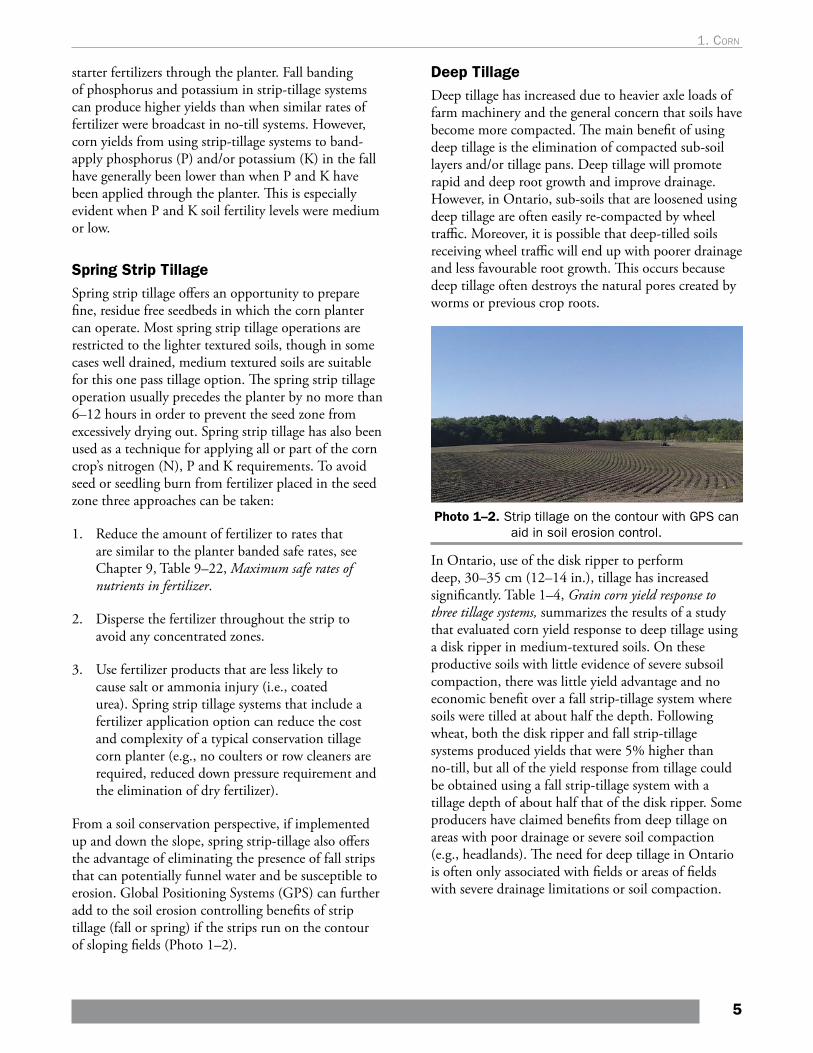
From a soil conservation perspective, if implemented up and down the slope, spring strip-tillage also offers the advantage of eliminating the presence of fall strips that can potentially funnel water and be susceptible to erosion. Global Positioning Systems (GPS) can further add to the soil erosion controlling benefits of strip tillage (fall or spring) if the strips run on the contour of sloping fields (Photo 1–2).
Deep Tillage Deep tillage has increased due to heavier axle loads of farm machinery and the general concern that soils have become more compacted. The main benefit of using deep tillage is the elimination of compacted sub-soil layers and/or tillage pans. Deep tillage will promote rapid and deep root growth and improve drainage. However, in Ontario, sub-soils that are loosened using deep tillage are often easily re-compacted by wheel traffic. Moreover, it is possible that deep-tilled soils receiving wheel traffic will end up with poorer drainage and less favourable root growth. This occurs because deep tillage often destroys the natural pores created by worms or previous crop roots.
Photo 1–2. Strip tillage on the contour with GPS can aid in soil erosion control.
In Ontario, use of the disk ripper to perform deep, 30–35 cm (12–14 in.), tillage has increased significantly. Table 1–4, Grain corn yield response to three tillage systems, summarizes the results of a study that evaluated corn yield response to deep tillage using a disk ripper in medium-textured soils. On these productive soils with little evidence of severe subsoil compaction, there was little yield advantage and no economic benefit over a fall strip-tillage system where soils were tilled at about half the depth. Following wheat, both the disk ripper and fall strip-tillage systems produced yields that were 5% higher than no-till, but all of the yield response from tillage could be obtained using a fall strip-tillage system with a tillage depth of about half that of the disk ripper. Some producers have claimed benefits from deep tillage on areas with poor drainage or severe soil compaction (e.g., headlands). The need for deep tillage in Ontario is often only associated with fields or areas of fields with severe drainage limitations or soil compaction.
5
1. corn

Table 1–4. Grain corn yield response to three tillage systems
Trials were conducted on medium- (loam or silt loam) textured soils following soybeans (4 sites) and winter wheat (8 sites) (2002–05).
Tillage Soybeans Wheat
Fall disk ripper 30–35 cm (12–14 in.)
9.73 t/ha (155 bu/acre)
9.73 t/ha (155 bu/acre)
Fall strip-tillage 15–20 cm (6–8 in.)
9.48 t/ha (151 bu/acre)
9.73 t/ha (155 bu/acre)
No-till 9.54 t/ha (152 bu/acre)
9.29 t/ha (148 bu/acre)
Source: Ontario Tillage Database, 2008 (www.tillageontario.com)
The strip-tillage system has also been presented as an opportunity for reducing compaction and/or improving drainage by conducting deep tillage. In some cases, it has been suggested to till as deep as 30–35 cm (12–14 in.). Researchers tested deep in-row ripping at sites near Granton and Ridgetown. Table 1–5, Effects of tillage systems on corn yields following winter wheat, illustrates that deep loosening either provided no yield benefit or not enough to pay for the cost of the deep tillage operation. The advantage of using a strip-tillage system to perform deep tillage is that wheel traffic does not occur on the deep tilled strips until the next harvest. This allows extra time for the soil to stabilize before it is exposed to wheel traffic again.
Table 1–5. Effects of tillage systems on corn yields following winter wheat
Tillage System
Granton (loam–clay loam
soil)
Ridgetown (clay loam
soil)
Fall mouldboard 11.35 t/ha (181 bu/acre)
7.78 t/ha (124 bu/acre)
Deep fall zone-till 30 cm (14 in.)
10.79 t/ha (172 bu/acre)
8.15 t/ha (130 bu/acre)
No-till (3-coulters) 10.73 t/ha (171 bu/acre)
7.65 t/ha (122 bu/acre)
No-till (row cleaners)
10.85 t/ha (173 bu/acre)
7.78 t/ha (124 bu/acre)
Source: T. Vyn, B. Deen, K. Janovicek, Univ. of Guelph, D. Young, Univ. of Guelph, Ridgetown Campus (1998–2000).
No-Till SystemsIn no-till systems, tillage is not used to prepare a seedbed. Minimal soil loosening in a narrow band immediately ahead of the seed opener is performed by planter-mounted coulters and/or residue clearing devices. Successful no-till corn production is partially dependent on effective use of field management strategies which may include alternative production practices that compensate for what tillage provides in other systems. For successful no-till corn production, the following issues must be carefully addressed:
• soil drainage• crop rotation• residue management• weed control• disease/insect management• fertilizer placement• soil compaction
Soil DrainageSoils experience slower spring drying rates in no-till systems due to the lack of soil loosening and residue incorporation associated with tillage. This can delay planting and possibly decrease the number of days available for timely planting. Effective tile drainage is necessary for many Ontario soils to ensure a reasonable opportunity for timely no-till corn planting. Good drainage also helps to provide a favourable seedbed environment for rapid, deep root growth. Producers on fine-textured soils often discover that successful no-till is very difficult in fields that are not systematically tile drained. These fine-textured fields with inadequate tile drainage will often require some type of fall tillage to maximize yield potential.
Crop RotationIn Ontario, no-till corn generally produces similar yields to tilled systems when following crops that produce low residues, such as soybeans, dry edible beans or forages harvested as hay or haylage. For soils with relatively slow internal drainage, increasing the amount of surface residue cover can slow soil drying, and delay the opportunity for timely planting and conditions that promote fast, deep, early-season root growth. Improved soil structure and higher earthworm activity associated with soils following forages may contribute to the success of no-till corn production following forages.
6
Agronomy guide for field Crops

No-till corn grown on medium- and fine-textured soils that follow crops producing high residue often struggle to achieve optimum yields, regardless of careful management for other parts of the production system.
If the choice is made to maintain residue cover following high residue crops such as grain corn or cereals, some tillage will likely be required. This will increase the chance of timely planting and maximum yield potential.
Residue ManagementReducing tillage costs, improving net profits and enhancing long-term soil health requires decisions about how best to handle crop residues, particularly wheat straw. Where no-till or reduced till corn is to follow wheat, remove the wheat straw from the field. Table 1–6, Effect of wheat straw levels on no-till corn yields, summarizes corn yields from tillage trials where three different levels of straw were left on the field and corn was no-till planted the following year. Removing straw from fields, especially in high-yielding wheat crops and on heavier-textured soils, increased the potential for no-till corn yields to equal those of mouldboard plowing.
Table 1–6. Effect of wheat straw levels on no-till corn yields
Tillage System/Straw Level1,2 Yield
No-till/ all straw and stubble remain
9.16 t/ha (146 bu/acre)
No-till/ straw baled but stubble remains
9.35 t/ha (149 bu/acre)
No-till/ straw baled and stubble cut and removed
9.91 t/ha (158 bu/acre)
Mouldboard/ straw baled but stubble remains
9.97 t/ha (159 bu/acre)
Source: T. Vyn, G. Opuku and C. Swanton, University of Guelph.1 Average 1994–96. Wyoming, Ontario. 2 Stubble heights were approximately 25–30 cm (10–12 in.)
except for plots where stubble was cut and removed.
Where straw removal is not an option, uniform spreading of the straw and chaff is critical for no-till or reduced tillage success in corn. Even where straw is to be left in the windrow, it is important to spread the chaff as widely and evenly as possible during combining. In cool, wet springs, the lower soil temperatures, poorer growth and potential slug damage brought on by mats of decaying wheat residue often result in yield losses that may have been avoided by uniform spreading of residue.
The benefits of incorporating all of the straw might outweigh the advantages of reducing tillage. For farms where erosion potential is higher, adopting a reduced tillage system is likely more sustainable, even with the need to remove some straw. Another option is using a system where wheat fields receive a small amount of tillage to partially incorporate straw while still leaving the soil surface largely protected.
Researchers examined the impact of adding nitrogen to assist in straw breakdown. Results indicate that straw did not decay more quickly where nitrogen was spread on wheat straw in the fall. In addition, the soil nitrogen levels the following spring were not higher compared to where no nitrogen was applied.
Weed ControlFor corn yield potential to be realized, optimum weed control is required. Additional management in no-till cropping systems may be needed to control perennial weeds and weed species that are new to the system due to a shift in weed populations. Spring pre-plant burndown treatments are critical in allowing the crop to develop without weed interference during critical early growth phases.
Disease and Insect ManagementTillage can play a role in preventing or suppressing certain pest and disease issues. Weeds, volunteer plants from the previous crop and certain cover crops left on the soil surface through the winter and early spring can increase the risk of some insect pests. Low lying weeds such as chickweed are ideal for egg laying by black cutworm moths that fly in from the southern United States (U.S.) in early spring. Cereal aphids can transmit vector viruses from volunteer wheat plants and infect the newly planted cereal crop. Corn planted into a rye cover crop increases the risk of
7
1. corn

armyworm infestations. Achieving good weed and cover crop management through herbicide applications in the fall and tillage in early spring at least 3 weeks prior to planting can avoid some of these pest risks. Tillage can be used in attempts to reduce populations of wireworms and grubs by bringing them up to the soil surface, exposing them to their natural enemies. However, caution is warranted as several passes are required and may not provide adequate control. Tillage can actually increase the risk of one particular pest, seedcorn maggot, if weeds, manure or cover crops are incorporated into the soil shortly before planting. Incorporation needs to occur at least 3 weeks prior to planting to ensure that the adults are no longer attracted to the decaying vegetation.
Some diseases are more prone to no-till systems as tillage can help in disease management. Tillage helps the soil to warm up and dry quickly, reducing the risk of seedling diseases. Some stalk rot diseases can also be managed through tillage though in some cases, crop rotation and hybrid selection play a larger role in disease management.
More details on insect pests and diseases of corn can be found in Chapter 15, Insects and pests of field crops and Chapter 16, Diseases of field crops.
Fertilizer PlacementNutrient stratification (nutrients concentrated near the soil surface) may occur in long-term, no-till fields. Without the option to incorporate or mix dry fertilizer material in the no-till system, fertilizer placement becomes increasingly important.
Studies done in Ontario and the U.S. cornbelt have shown that applying phosphorus and potassium in starter fertilizer bands resulted in yield response in no-till systems to be similar to fall mouldboard systems. This is especially evident in cases when soil tests indicated low to medium soil fertility levels of K. Planter-banded phosphorus and potassium were utilized more efficiently compared to fall surface broadcast in no-till systems. However, on sites with low fertility, a combination of broadcast and planter banding may be necessary to maximize no-till yields.
Cooler- and less-aerated soils in no-till systems often have a slower rate of nitrogen mineralization compared to conventional tillage systems. This is often overcome by applying 35 kg/ha (30 lb/acre) of nitrogen in the starter fertilizer.
Applying 35 kg/ha (30 lb/acre) of nitrogen in the starter on no-till corn planters has often overcome the slower nitrogen mineralization frequently present in no-till soils, where the balance of the nitrogen is applied in a side-dress application.
Soil CompactionThe best option for preventing soil compaction is to avoid field operations when soils are wet. Soil compaction is often cited as one of the reasons no-till corn may yield less than conventionally tilled corn. An option for enhancing corn yields in reduced tillage systems may include incorporating deep rooted crops into the rotation, and/or extensive loosening of soil deeper into the soil profile. This can be done without disrupting much of the crop residue on the soil surface and can be confined to zones where next year’s corn rows will be planted (e.g., strip-tillage).
Usually the most effective method to minimize the risk of deep compaction, 35–45 cm (15–18 in.) depth is to reduce the number of field operations and/or minimize use of equipment with heavy axles (e.g., grain buggies) wherever possible. Avoiding field traffic when soils are wet will also help minimize compaction.
Tire management can help reduce soil compaction in the root zone (top 20 cm (8 in.). Increasing floatation by minimizing inflation pressures can reduce the impacts of tires, especially in the surface soil layers. This requires three key steps:
1. Know the axle load that each tire is carrying.
2. Know the manufacturer's specifications for that tire.
3. Adjust inflation pressures down to the minimum acceptable pressure for soil conditions (speed, load type, duals, etc.). A good target for tire inflation pressures to reduce soil compaction is 1 Bar (14.5 PSI).
8
Agronomy guide for field Crops

Planter PerformanceOptimal planter performance is necessary to maximize corn yield potential in any tillage system. Planter performance and/or suitability are especially critical in no-till systems. Absence of tillage results in greater variability in near-surface soil properties and residue cover, therefore ensuring that planting equipment is properly maintained and adjusted for no-till planting conditions will lessen variability in corn plant stand and emergence, and increase yields in no-till systems.
Hybrid SelectionMaturity RatingsCorn development is driven primarily by temperature, especially during the planting-to-silking period. Unlike soybeans, day length has little effect on the rate at which corn develops. The Ontario crop heat unit system has been developed to calculate the impact of temperature on corn development. Ontario crop heat units (CHUs) are calculated based on daily maximum and minimum temperatures and allow for a numerical rating of growing seasons, geographical locations and corn hybrids. This system allows producers to select hybrids that have a high probability of reaching maturity before a killing frost occurs.
Ontario Crop Heat Units CHU calculations require a start date, a formula for calculating CHU based on daily temperatures and an end date. Starting in 2009, Ontario began recording CHU on May 1, regardless of location or temperatures experienced up to that date. The CHU system uses a calculation to arrive at a daily CHU total and employs the following trigger to mark the season end: when average temperature falls below 12°C or the first occurrence of -2°C. The current CHU system and map (sometimes referred to as CHU-M1 because of the May 1 start date) are based on data from the 1971–2000 time period. The CHU map for Ontario is found in Figure 1–1, Crop heat units (CHU-M1) available for corn production.
Other jurisdictions use different systems for quantifying the effect of temperature on corn development and for rating corn hybrid maturity. Unfortunately, these systems are unique, and true mathematical conversions from one to the other are not possible. Table 1–7, Approximate conversions between three systems of measuring heat accumulation in a growing season provides values to assist in making reasonable comparisons between the different systems.
Table 1–7. Approximate conversions between three systems of measuring heat accumulation
in a growing season
Location
Ontario Crop Heat
Units (CHU-M1)
Corn Relative Maturity (CRM)
Growing Degree Days (Base 10) (GDD or GDU)
Walkerton 2,759 84 2,000
Guelph 2,828 84 2,012
Ottawa 3,099 91 2,174
London 3,120 92 2,203
Simcoe 3,190 94 2,268
Belleville 3,369 98 2,353
Ridgetown 3,462 104 2,511
Harrow 3,702 111 2,673
It takes approximately 75–80 crop heat units to produce each corn leaf. Therefore, at temperatures of 30°C during the day and 20°C at night, there is one new leaf every 2–3 days. At 20°C during the day and 10°C at night, one new leaf appears every 5–6 days.
Producers who record daily high and low temperatures can use Table 10–4, Daily crop heat unit accumulations based on maximum and minimum temperatures to calculate CHU for their own farm.
9
1. corn

Figure 1–1. Crop heat units (CHU-M1) available for corn production.
This map is based on weather data from 1971–2000 with a common season start date across the province of May 1. Source: Weather Innovations Inc. (WIN)
Selecting the Most Profitable HybridsHybrid selection is probably the single most important management decision in determining cropping profitability. Corn hybrids with superior yield potential have been continuously introduced into the market place over the past 50 years. Yield increases of approximately 1.5% per year have been achieved. To remain competitive, producers must introduce new hybrids to their acreage on a regular basis. The following are a few key considerations intended as
general guidelines for selecting hybrids. Fine-tuning hybrid selection for an individual farm should be done in consultation with seed company representatives.
Maturity and CHU-M1Physiological maturity (black layer) is achieved when all the kernels have reached their maximum dry matter accumulation and there is no additional moisture or nutrient transport from the plant. Using crop heat unit ratings, hybrids can be selected to reach black
10
Agronomy guide for field Crops

layer before traditional season-ending frosts occurs. Figure 1–1, Crop heat units (CHU-M1) available for corn production, or farm records will provide the heat units normally accumulated in a given area.
Highest YieldIn any given hybrid performance trial, there may be a 1.9–2.5 t/ha (30–40 bu/acre) difference in yield between the highest- and lowest-yielding hybrids. This emphasizes the importance of obtaining reliable information on hybrid yield potential and adaptability. Producers must be able to sort through information from several key sources: public performance trial data, strip trial data (seed company or farm organization) and on-farm comparisons.
The Ontario Corn Committee (OCC) conducts corn hybrid performance trials each year across the province. These performance trials include the majority of available hybrids. Generally, these trials are set up so that a given set of hybrids, for a certain heat unit range, are tested at three to four locations. This data is available at www.gocorn.net and can be viewed in several formats to allow for stakeholders to carefully examine the results. These trials give a good indication of yield potential; however, they are limited to a few locations and therefore do not adequately evaluate hybrid adaptability over a wide range of conditions. For this information, producers need to turn to strip trials that are conducted on a larger number of sites across a wide range of environments. Seed companies summarize these strip trial results which are made available through their seed guides.
Many producers find it valuable to have corn hybrid strip trials or comparisons on their own farm. This allows new, high-yield potential hybrids to be tested against those proven performers in the farming practice. However, it is important to remember that reliable hybrid selections require more than one test site, even if that site is on the producer’s own farm. Producers should look for 2-year data that originates from many sites (preferably more than 30) before making decisions about hybrids that will be planted on a significant portion of their acreage.
One way to look at hybrid selection is to define two groups of hybrids for a farm operation. The first group is “New Hybrids” and is comprised of the most promising new hybrids in the market place. This group will represent hybrids that are grown on a
relatively small acreage and that are tracked carefully for their performance on a given farm, in strip trials and in public performance trials. The goal is to quickly identify the top hybrid in this group and move it into the second hybrid group which is called “Tested Hybrids”. The Tested Hybrids group represents hybrids that have proven their performance and are grown on a large percentage of a given operation’s corn acres. Producers who make the most accurate and quickest decisions to move new, higher performing hybrids into their operations will achieve maximum competitive advantage and yield increases.
Producers who make the most accurate and quickest decisions to move new, higher performing hybrids into their operations will achieve maximum competitive advantage.
Hybrid PositioningCorn hybrids have often been classified with various terms such as “workhorses” or “racehorses”, having offensive versus defensive natures. Hybrids that produce above-average yield under good conditions, but perform below average under poor conditions are considered racehorses (offensive). Hybrids that have relatively consistent yields in both low- and high-yielding conditions are considered workhorses (defensive). As site-specific management increases in popularity, many producers will choose racehorse varieties in the most productive areas of their field and workhorse varieties where soil or weather conditions are less favourable. Trends within the seed industry indicate that hybrids will be increasingly defined for their ability to fit into certain management strategies and/or environments. Precision agriculture technologies can better define the potential for hybrids to exploit site specific resources more effectively.
Producers should be aware of the possibility of selecting hybrids that will respond more effectively to higher or lower input strategies. Producers can avoid some of the risk associated with hybrid selection by taking time to investigate a hybrid’s past performance. Select hybrids that complement each other, because they have different weaknesses for specific characteristics. For example, when selecting two long-season hybrids with high yield potential for earliest planting, ensure that they do not both score relatively low for resistance to the leaf diseases.
11
1. corn

StandabilitySelect hybrids that have suitable maturity ratings and outstanding yield potential. Selecting for hybrid standability is also recommended. This trait is particularly important where significant field drying is expected. If drying facilities are available on the farm and harvesting at relatively high moisture levels (>26%) is an option, standability may be less critical. Traits associated with improved hybrid standability include resistance to stalk rot and leaf blights, genetic stalk strength (a thick stalk rind), short plant height, lower ear placement and above average late-season plant health. Plant intactness or late-season plant health ratings also indicate better harvestability ratings.
One of the most significant advancements in improved standability has been the introduction of Bt hybrids that are resistant to a range of corn feeding pests. All producers using Bt hybrids are required to plant a refuge which contains corn plants that are not genetically modified in order to prevent a build-up of resistant pest strains. Producers can now purchase refuge incorporated blends that contain both Bt and non-Bt seed in the same bag, eliminating some of the issues with having to plant separate refuge. For further information on Bt corn refer to Chapter 15, Insects and Pests of Field Crops as well as the Canadian Corn Pest Coalition website at www.cornpest.ca.
Harvest Moistures and Drying CostsHybrid selection may also be influenced by the producer’s target harvest moistures. In situations where corn is stored as high moisture grain (e.g., 28% moisture), producers have an opportunity to maximize returns by growing full-season, high-yielding hybrids. If corn is dried during storage, evaluate the impact that high harvest moistures may have on net returns. For example, any potential gains in net returns from a hybrid that yields 0.31 t/ha (5 bu/acre) greater than another should be balanced against increased drying charges. OCC performance trial data has shown that when corn is planted early, aggressive hybrid selection (i.e., full-season and beyond) often results in yield advantages over hybrids that mature in less days (shorter-season hybrids). The increased yield from full- or long-season hybrids more than compensates for the increased drying costs due to higher harvest moistures. Producers should evaluate net returns for hybrids after dryings costs. Depending on drying costs a 2–3 bushel per acre increase in yield often more than compensates for an additional 1% increase in harvest moistures.
Selecting Hybrids for SilageWhen choosing hybrids specifically for whole-plant silage, a yield advantage can usually be obtained by selecting hybrids rated 100–200 heat units higher than those selected for grain. Select hybrids for high silage yields with improved digestible energy. Silage-only and dual-purpose corn hybrids are available on the market. Dual-purpose hybrids offer grain harvest as an option, providing more flexibility when the silo is full. Without sufficient independent data, it is very difficult to compare and select corn silage hybrids between companies. Choose top hybrids that have strong ratings for silage yield and quality. Various models are used to compare the economic value of corn silage hybrids. The University of Wisconsin has developed “milk per acre” and “milk per ton” calculations using their Milk 2006 model to combine the traits of silage yield, digestibility, fibre, starch, crude protein and intake potential into single measures. Milk per ton measures quality, while milk per acre combines yield and quality.
Switching to Shorter-Season HybridsField conditions may delay planting and necessitate switching to less than full-season hybrids. Factors to consider in this decision include yield potential of shorter-season hybrids, test weight concerns, drying costs and late-season harvesting capabilities.
Grain corn obtains 90% of its total grain weight by the time it reaches one-half milk line, a maturity stage that even late-planted, full-season hybrids reach in most years. Switching to shorter-season hybrids may be a reasonable alternative from a grain yield perspective if earlier maturing hybrids can produce within 10% of the full-season hybrid’s yield. Generally, this is a more favourable proposition in longer-season areas.
Growing full season 3,000 CHU-M1 hybrids allows for switching to hybrids that are 100–150 heat units less without sacrificing excessive yield. If the full-season hybrids are in the 2,800 CHU-M1 range, the odds of dropping to a hybrid 100 heat units less without giving up more than 10% yield are low.
Extensive research across the northern cornbelt defines the optimal date when producers should switch away from full-season hybrids. Some of this data is summarized in Table 1–8, Recommended dates to switch from full-season hybrids across various heat unit zones.
12
Agronomy guide for field Crops
This collection of long-term data took into account yields for hybrids of various maturity ratings as well as deductions for test weight and drying. The switch date indicates the planting date when earlier-maturing hybrids surpass full-season hybrids in terms of net returns (gross returns less drying and test weight deductions).
Table 1–8. Recommended dates to switch from full-season hybrids across various heat unit zonesHeat Unit Zone (CHU-M1) Switch Date
>3,200+ May 30–early June
2,800–3,200 May 20–25
<2,800 May 15–20
Source: Adapted from R. Iragavarapu. Basing Hybrid Maturity Switches on Long-Term Data. Pioneer Hi-Bred Ltd.
Growing hybrids with a range in maturity provides some buffer against stresses at silking time and end-of-season risks. However, making significant adjustments to shorter season hybrids should not be considered until May 30–June 1 for areas in southwest (>3,200 CHU-M1); until May 20–25 for the mid-maturity corn growing areas (2,800–3,200 CHU-M1) and until May 15–20 in the shorter-season areas (<2,800 CHU-M1).
A general rule has been to reduce hybrid maturity by 100 CHU for every week that planting is delayed beyond the cut-off date for full-season hybrids.
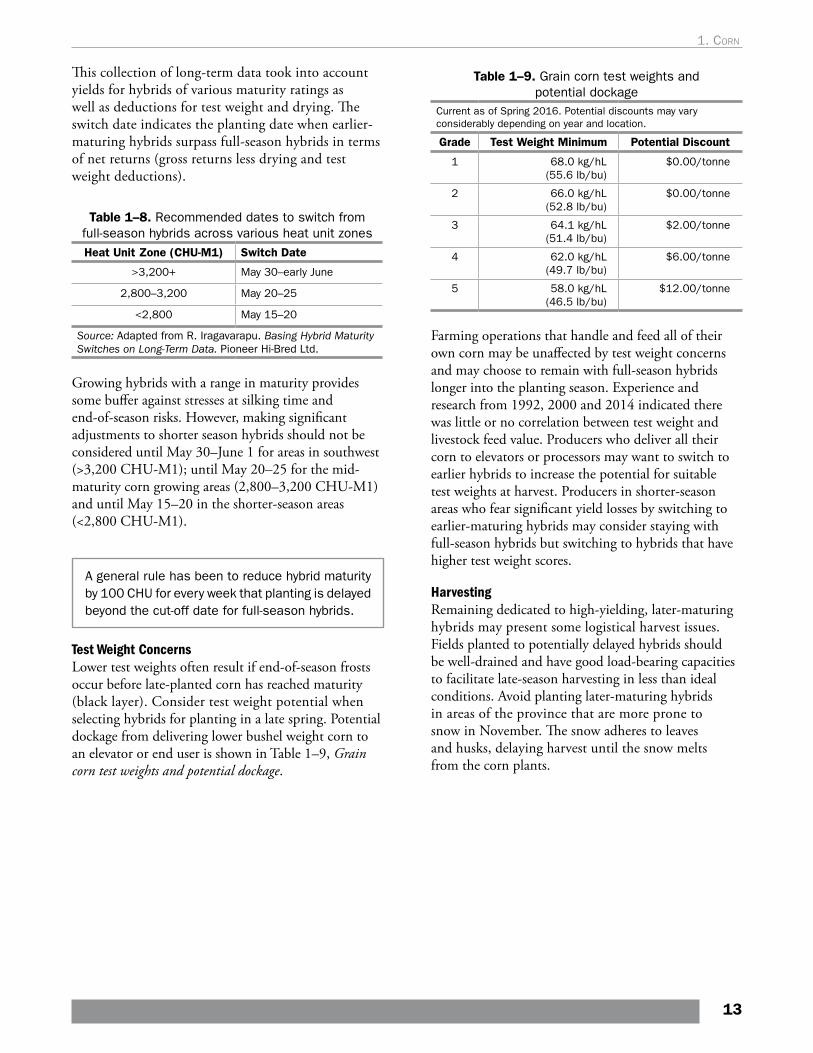
Test Weight ConcernsLower test weights often result if end-of-season frosts occur before late-planted corn has reached maturity (black layer). Consider test weight potential when selecting hybrids for planting in a late spring. Potential dockage from delivering lower bushel weight corn to an elevator or end user is shown in Table 1–9, Grain corn test weights and potential dockage.
Table 1–9. Grain corn test weights and potential dockage
Current as of Spring 2016. Potential discounts may vary considerably depending on year and location.
Grade Test Weight Minimum Potential Discount
1 68.0 kg/hL (55.6 lb/bu)
$0.00/tonne
2 66.0 kg/hL (52.8 lb/bu)
$0.00/tonne
3 64.1 kg/hL (51.4 lb/bu)
$2.00/tonne
4 62.0 kg/hL (49.7 lb/bu)
$6.00/tonne
5 58.0 kg/hL (46.5 lb/bu)
$12.00/tonne
Farming operations that handle and feed all of their own corn may be unaffected by test weight concerns and may choose to remain with full-season hybrids longer into the planting season. Experience and research from 1992, 2000 and 2014 indicated there was little or no correlation between test weight and livestock feed value. Producers who deliver all their corn to elevators or processors may want to switch to earlier hybrids to increase the potential for suitable test weights at harvest. Producers in shorter-season areas who fear significant yield losses by switching to earlier-maturing hybrids may consider staying with full-season hybrids but switching to hybrids that have higher test weight scores.
HarvestingRemaining dedicated to high-yielding, later-maturing hybrids may present some logistical harvest issues. Fields planted to potentially delayed hybrids should be well-drained and have good load-bearing capacities to facilitate late-season harvesting in less than ideal conditions. Avoid planting later-maturing hybrids in areas of the province that are more prone to snow in November. The snow adheres to leaves and husks, delaying harvest until the snow melts from the corn plants.
13
1. corn

PlantingSeeding DateThe best yields in Ontario are usually obtained from corn planted in late April and the first half of May, as the crop is able to use the full growing season. Early planting also results in earlier maturity in the fall, reducing the risk of damage from an early fall frost or adverse weather at harvest. The influence of planting date on corn yield is illustrated in Table 1–10, Expected grain yield due to various planting dates. Most noteworthy is the rapid decline in yield for the shorter season areas compared to longer season areas as planting dates are delayed.
Depending on the total number of days required to plant the farm’s entire corn acreage, it is generally necessary to start planting corn before the optimum date. Producers wanting to plant corn significantly earlier than optimum dates (i.e., April 15–25) should consider that soil temperatures need to reach 10°C before germination and emergence will occur. The average daily temperature is estimated by taking a temperature measurement close to 11:30 a.m. using a 10 cm (4 in.) soil thermometer. Early planting of a portion of the corn crop can be considered if average soil temperatures are at or above 10°C, the soil conditions are favourable and the weather forecast is predicting average to above-average temperatures. It is generally advised to pay less attention to soil temperature and to plant as soil moisture conditions permit after April 26 in areas receiving greater than 3,000 CHU-M1 or May 1 in areas <3,000 CHU-M1. In general, the loss of potential yield associated with planting 2–3 weeks before optimum planting date is less than the loss associated with planting 2–3 weeks after the optimum planting date.
PopulationPlant populations referred to in this section are the suggested final plant stands, see Table 1–11, Seed spacing to achieve various populations. Since not all seeds emerge, it is necessary to seed at slightly higher rates. When planting early in the season or when the soil is cold, a seeding rate 10% higher than the desired final stand is suggested. When soils are warmer, an adjustment of 5% is sufficient.
Table 1–10. Expected grain yield due to various planting datesTrials conducted by the Ontario Corn Committee at the indicated location in 2006–2010. All data is derived from corn that had a population of 74,000 plants/ha (30,000 plants/acre). Yields are indexed relative to a planting date prior to May 10.
Location Jun 10 Jun 05 May 30 May 25 May 20 May 15Prior to May 10
Elora (<2,800 CHUs) 65 75 85 92 96 99 100
Exeter (2,800–3,200 CHUs) 84 89 93 96 98 100 100
Ridgetown (>3,200 CHUs) 87 91 94 97 99 100 100
Table 1–11. Seed spacing to achieve various populations
Final population
Distance between in-row corn plants
Row width: 51 cm (20 in.)
Row width: 76 cm (30 in.)
Row width: 91 cm (36 in.)
54,300 plants/ha (22,000 plants/acre)
36 cm (14.3 in.)
24 cm (9.5 in.)
20 cm (7.9 in.)
59,300 plants/ha (24,000 plants/acre)
33 cm (13.1 in.)
22 cm (8.7 in.)
18 cm (7.2 in.)
64,200 plants/ha (26,000 plants/acre)
31 cm (12.1 in.)
20 cm (8.1 in.)
17 cm (6.7 in.)
69,200 plants/ha (28,000 plants/acre)
29 cm (11.2 in.)
19 cm (7.5 in.)
16 cm (6.2 in.)
74,100 plants/ha (30,000 plants/acre)
27 cm (10.5 in.)
18 cm (7.0 in.)
15 cm (5.8 in.)
79,000 plants/ha (32,000 plants/acre)
25 cm (9.8 in.)
17 cm (6.6 in.)
14 cm (5.4 in.)
84,000 plants/ha (34,000 plants/acre)
23 cm (9.2 in.)
16 cm (6.1 in.)
13 cm (5.1 in.)
88,900 plants/ha (36,000 plants/acre)
22 cm (8.7 in.)
15 cm (5.8 in.)
12 cm (4.8 in.)
93,800 plants/ha (38,000 plants/acre)
21 cm (8.3 in.)
14 cm (5.5 in.)
12 cm (4.6 in.)
98,800 plants/ha (40,000 plants/acre)
20 cm (7.8 in.)
13 cm (5.2 in.)
11 cm (4.4 in.)
Row Length for 1/1,000 of an acre
7.9 m (26.1 ft)
5.3 m (17.4 ft)
4.4 m (14.5 ft)
1 ha = 2.47 acre; 1 cm = 0.39 in.
14
Agronomy guide for field Crops

In Ontario, corn is commonly grown at plant populations of 69,200–88,900 plants/ha (28,000–36,000 plants/acre). These populations maximize light interception and can produce good yields over a wide range of growing conditions without excessive lodging. In recent years, hybrids have been developed that tolerate higher plant densities without excessive lodging or barrenness. When old and new hybrids are grown side by side under very low plant populations, their yields are almost identical. Higher yield responses are obtained when newer hybrids are grown at higher densities. Much of the historical yield improvement has resulted from developing hybrids that excel under higher densities. Some of the most recent hybrids have economically optimum populations of 79,000–98,800 plants/ha (32,000–40,000 plants/acre). Refer to seed company data to fine-tune hybrid management and planting density decisions.
On drought-susceptible fields where water availability is the yield-limiting factor, the yield potential may not cover the cost of higher seeding rates. In these situations, adjusting populations downward can achieve some savings. Higher populations are warranted as yield potential increases. One study indicated that for every 0.94 t/ha (15 bu/acre) increase in a field’s (or portion of a field’s) yield potential, economically optimal populations increased by 1,112 plants/ha (450 plants/acre).
In Ontario, it is common to aim for higher average final plant stands than that of the U.S. midwest. The most productive fields should be near the upper end of the plant population range for the hybrids being planted. In shorter-season areas of the province, where smaller-stature hybrids are grown, producers should consider even higher populations to maximize light interception and optimize yields. Yield increases from increased plant densities have generally been lowest in the longer-season regions of Ontario (over 3,200 CHU-M1 heat units).
Corn silage plant populations are often promoted as needing to be higher (10%) than grain corn. Research from Cornell University disputes this, showing no advantage to having plant stands of more than 86,500 plants/ha (35,000 plants/acre) for any of the hybrids tested. The research predicted that as hybrid populations increased, silage digestibility declined. Optimum plant populations may be very hybrid specific due to the genetic diversity among silage hybrids.
Planting DepthThe first rule of corn planting is to plant into moisture (25%–50% or near field capacity). However, a few other considerations allow for some fine-tuning of planting depth. Shallow planting of corn (less than 3 cm (1.2 in.) deep), even into moisture, may lead to less favourable positioning of the growing point and first nodal roots (Photo 1–3). This may lead to rootless corn syndrome in some cases and predisposes the seed to greater injury from herbicides. Coarse-textured soils that dry rapidly at the surface will also be more prone to poor root establishment with shallow plantings.
Optimum corn planting depth means always placing the seed in moisture. Be sure to check that even if the corn planter is set at a target depth of 4–5 cm (1.6–2.0 in.), that no seed in the field is less than 3.8 cm (1.5 in.) deep.
In contrast, planting deeper at 5.7–8.2 cm (2.25–3.25 in.), especially when soils are cold early in the planting season, can delay emergence compared to planting at depths of 4–5 cm (1.6–2.0 in.). Delayed emergence can lead to increased risk of insect feeding or seedling diseases. As the planting season progresses and as soils warm and dry, ensure that the corn seed is placed firmly into moisture and planted at a target depth of 5 cm (2 in.). When planting is extended and soils warm, planting at depths of 7.5 cm (3 in.) in order to find moisture is often less risky than planting shallower and hoping for rain.
Photo 1–3. Uneven planting depth. Uniform seeding depth is critical to achieving uniform emergence.
15
1. corn
Physiologically speaking, a corn seed that is placed into moisture at 3.8 cm (1.5 in.) deep will have excellent performance. The challenge comes when a corn planter is set to deliver seeds at 3.8 cm deep and due to planter row-unit bounce or some areas of the field with a seedbed that is rough, uneven or compacted will have some seed planted too shallow for good emergence. Therefore, it is often advisable to set the planter slightly deeper to avoid having any seeds that are less than 3.8 cm (1.5 in.) deep.
Planting depth can be evaluated well into the growing season by carefully excavating the plant, removing the nodal roots, and identifying the mesocotyl. The mesocotyl is generally a white, mostly hairless structure that runs from the seed to the crown. Measuring the length of the mesocotyl and adding 1.9 cm (0.75 in.) results in an accurate assessment of planting depth.
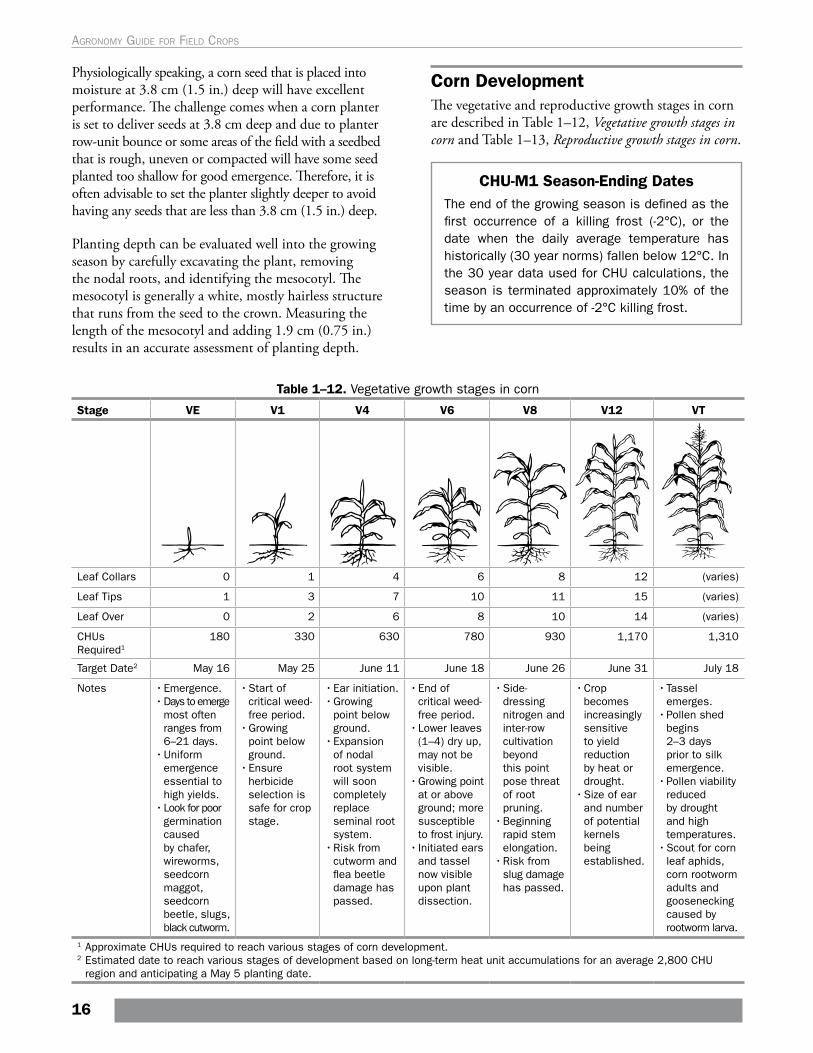
Corn DevelopmentThe vegetative and reproductive growth stages in corn are described in Table 1–12, Vegetative growth stages in corn and Table 1–13, Reproductive growth stages in corn.
CHU-M1 Season-Ending DatesThe end of the growing season is defined as the first occurrence of a killing frost (-2°C), or the date when the daily average temperature has historically (30 year norms) fallen below 12°C. In the 30 year data used for CHU calculations, the season is terminated approximately 10% of the time by an occurrence of -2°C killing frost.
Table 1–12. Vegetative growth stages in corn
Stage VE V1 V4 V6 V8 V12 VT
Leaf Collars 0 1 4 6 8 12 (varies)
Leaf Tips 1 3 7 10 11 15 (varies)
Leaf Over 0 2 6 8 10 14 (varies)
CHUs Required1
180 330 630 780 930 1,170 1,310
Target Date2 May 16 May 25 June 11 June 18 June 26 June 31 July 18
Notes • Emergence.• Days to emerge
most often ranges from 6–21 days.
• Uniform emergence essential to high yields.
• Look for poor germination caused by chafer, wireworms, seedcorn maggot, seedcorn beetle, slugs, black cutworm.
• Start of critical weed-free period.
• Growing point below ground.
• Ensure herbicide selection is safe for crop stage.
• Ear initiation.• Growing
point below ground.
• Expansion of nodal root system will soon completely replace seminal root system.
• Risk from cutworm and flea beetle damage has passed.
• End of critical weed-free period.
• Lower leaves (1–4) dry up, may not be visible.
• Growing point at or above ground; more susceptible to frost injury.
• Initiated ears and tassel now visible upon plant dissection.
• Side-dressing nitrogen and inter-row cultivation beyond this point pose threat of root pruning.
• Beginning rapid stem elongation.
• Risk from slug damage has passed.
• Crop becomes increasingly sensitive to yield reduction by heat or drought.
• Size of ear and number of potential kernels being established.
• Tassel emerges.
• Pollen shed begins 2–3 days prior to silk emergence.
• Pollen viability reduced by drought and high temperatures.
• Scout for corn leaf aphids, corn rootworm adults and goosenecking caused by rootworm larva.
1 Approximate CHUs required to reach various stages of corn development.2 Estimated date to reach various stages of development based on long-term heat unit accumulations for an average 2,800 CHU
region and anticipating a May 5 planting date.
16
Agronomy guide for field Crops

Table 1–13. Reproductive growth stages in cornLEGEND: NA = no data available, kernels not formed until after pollination.
R Stage R1 – Silking R2 – Blister R3 – Milk R4 – Dough R5 – Dent R6 – Maturity
Description Silks emerge from husks at tip of ear.
Kernels are white, filled with clear fluid and distinct from surrounding cob material.
Kernels begin to have yellow colour. Inner fluid is milky white.
Milky inner fluid becomes thicker and pasty. Outer edges of kernels become firmer. Some dents appear.
Majority of kernels are dented. Hard white layer of starch evident at top of kernel (milk line).
Hard starch layer evident from top to bottom of kernel. Black layer forms at base of kernel.
CHU Required1 1,480 1,825 2,000 2,165 2,475 2,800
Target Date2 July 20 Aug. 3 Aug. 11 Aug. 18 Sept. 1 Sept. 18
Kernel Moisture NA 85% 80% 70% 55% 30%–35%
Notes • Pollination requires 3–7 days.
• Silks continue to elongate until fertilized.
• Environmental stresses very detrimental to yield.
• Begin scouting for ear insect pests (corn earworm, fall armyworm).
• Kernels beginning dry matter accumulation.
• Relocation of nutrients from the leaves and stem to the ear begins.
• Firing of lower leaves may become evident.
• Rapid grain filling period.
• Good plant health, clear skies and active photosynthesis add to kernel size and test weight.
• Top of kernel begins to firm up.
• Killing frost may cause yield losses of 25%–40%.
• Begin to assess ear rot incidence.
• Milk line advances toward tip as crop matures.
• Whole plant moistures suitable for silage harvest.
• 90% of grain yield reached by one-half milk line.
• Examine fields for lodging, ear drop and stalk rots. If high, consider harvesting early.
• Physiological maturity.
• Kernels have achieved maximum dry weight.
• Moisture loss from kernels still required for suitable threshing.
1 Approximate CHU required to reach various stages of corn development.2 Estimated date to reach various stages of development based on long-term heat unit accumulations for an average 2,800 CHU
region, and anticipating a May 5 planting date.
Corn Leaf StagesCounting the leaves on a corn plant sounds like an easy task, but there are a few complications that can cause mistakes. It is important to know which leaf-counting method is being referred to on pesticide labels or in other production information.
Table 1–14, Comparative growth stages shows comparative growth stages using different methods of counting leaves.
Table 1–14. Comparative growth stagesLeaf Tip
Leaf Over
Leaf Collar
Standing Height
Leaf Extended
3 2 1 5–6 cm 5–11 cm
5–6 4 3 9–17 cm 16–25 cm
7–8 6 4–5 18–33 cm 29–46 cm
9–10 8 5–6 36–54 cm 54–77 cm
12 10 8 58–85 cm 86–112 cm
14–15 12 10 99–114 cm 121–149 cm
Source: OMAFRA Publication 75, Guide to Weed Control.
There are several methods used to count corn leaves:
• The leaf-tip method counts all leaves, including any leaf tip that has emerged from the whorl at the top of the plant.
• The leaf-over method only counts those leaves that are fully emerged and are arched over with the next leaf visible in the whorl but standing straight up.
• The leaf-collar method, used extensively in the U.S., refers to the leaf collar being visible. The leaf collar is the light green-to-whitish band that separates the leaf blade from the leaf sheath, which wraps around the stem. The stages for corn are referred to as V1, V2, V3, etc., where the V3 stage is a plant with three collars visible.
17
1. corn

Uniformity of EmergenceUniform seeding depth is a critical factor in achieving uniform emergence. Uneven emergence affects crop performance, because competition from larger, early-emerging plants reduces the yield potential of smaller, later-emerging plants. Yields can be reduced by 5% when half the stand suffers from a 7-day delay in emergence and by 12% when half the population experiences a 2-week delay. Table 1–15, Corn yield response to plant spacing and emergence variability, shows the relative impact of emergence and in-row spacing variability on corn yield. In summary:
• If one of six plants (17%) had an emergence delay equal to two leaf stages (about 12 days), then overall yield reduction was 4%–5%.
• If one of six plants had emergence delays equal to four leaf stages (about 21 days), then overall yield was reduced by 8%.
• The sizes of yield reductions associated with delayed emergence were not significantly affected by the spacing variability of the stand (doubles and misses) within the corn row.
This study emphasized the fact that plants that are neighbouring a plant that is delayed in emergence do not compensate for the lower yield of the plant that is developmentally behind.
Table 1–15. Corn yield response to plant spacing and emergence variability
Yield expressed as a percent of the uniform spacing and emergence treatment.
Research was conducted at Elora and Woodstock, 2000–01.
Plant Spacing
Emergence Delay
Uniform2-leaves (1 in 6)
4-leaves (1 in 6)
Uniform 100% 95% 91%
Double (33% of plants) 99% 95% 90%
Triple (50% of plants) 98% 94% 90%
Source: Liu, Tollenaar, Stewart, Deen, University of Guelph.
Uniformity of SpacingIt is widely believed that uniform in-row plant spacing is necessary to achieve high corn yields. However, a considerable number of studies challenge the notion that increased variability of in-row plant spacing results in large yield losses.
The relative yields shown in Table 1–15 indicate that when plants are less than perfectly spaced, those plants that have more space compensate for those that are given less space. Doubles are defined as two plants spaced about 3 cm (1.33 in.) apart situated next to a gap of about 38 cm (15 in.). Triples are defined as three plants spaced 3 cm from each other next to a gap of 58 cm (23 in.). A collection of research has further shown:
• Yield losses are about 1% if the stand contains two out of six plants (33%) that are clustered as doubles.
• 2% if three out of six plants (50%) are clustered as triples.
• 2.5 cm (1 in.) increase in plant stand standard deviation decreased yield by less than 0.08 t/ha (1.3 bu/acre), assuming equal plant populations. These results were consistent with earlier research conducted in Ontario during the late 1970s and in Wisconsin from 1999–2001.
• Dr. Bob Nielsen (Purdue University, Indiana) reported that every additional 2.5 cm (1 in.) of standard deviation over 5 cm (2 in.) decreases yields by 160 kg/ha (2.5 bu/acre). This suggests that significant yield losses are associated with plant stand variability.
• Results of a survey of 127 Wisconsin commercial corn fields with an average plant population of 73,500 plants/ha (29,750 plants/acre) suggested that plant spacing standard deviation averaged 8.4 cm (3.33 in.) with 95% of fields having standard deviations that were less than 11.7 cm (4.66 in.).
• Results of 24 research trials conducted along with the Wisconsin plant variability survey concluded that significant yield reductions begin to occur only when corn plant standard deviations exceed 12 cm (4.75 in.).
18
Agronomy guide for field Crops

These results from other jurisdictions support Ontario research findings shown in Table 1–15. They suggest minimal yield impact of uneven plant spacing. Generally, within the range of plant spacing variability typically found in most Ontario corn fields that are at the target population, the reduction in yield potential due to plant stand variability is likely small.
Poor planter maintenance or high planting speeds are often identified as contributing to poor within-row spacing uniformity. Research conducted in Illinois and shown in Table 1–16, Effect of planting speed on spacing standard deviation, population and corn yield illustrated that with properly maintained planters, high planting speeds and slight variations in spacing uniformity had no impact on yield.
When evaluating corn plant stands, uniformity of emergence and early growth is more important than uniformity of spacing.
Table 1–16. Effect of planting speed on spacing standard deviation, population and corn yield
(Average of 11 Illinois trials, 1994–96)
Planting Speed
Standard Deviation1 Population Yield
5 km/h
7.3 cm (2.9 in.)
67,290 plants/ha (27,231 plants/
acre)
9.57 t/ha (152.5 bu/acre)
8 km/h
7.6 cm (3.0 in.)
67,640 plants/ha (27,373 plants/
acre)
9.55 t/ha (152.2 bu/acre)
11.3 km/h
8.2 cm (3.2 in.)
66,700 plants/ha (26,996 plants/
acre)
9.61 t/ha (153.1 bu/acre)
Source: E. Nafziger, University of Illinois and H. Brown.1 An absolutely perfect stand, where every plant is exactly
18 cm (7.25 in.) from its neighbour, would have a standard deviation of zero. If plants on average varied ± 5 cm (2 in.) from the desired 18 cm (7.25 in.), the standard deviation would be 5 cm (2 in.).
Uniformity and timing of emergence, along with achieving target populations, generally have a greater impact on corn yield than uniformity of corn plant spacing. Planter maintenance and choice of attachments (i.e., coulters and residue row cleaners) should focus on achieving consistent seed placement and the creation of
in-row seedbed conditions that ensure rapid uniform emergence. It is important to ensure that the planter is operating level and that all discs, depth-gauging wheels and seed-firming devices are up to specifications, aligned and operating at the correct depth or pressure.
Pre-planting management may also play a critical role in emergence uniformity. If the field is left too uneven, if residue is bunched, or if surface compaction has not been uniformly alleviated, even the most carefully prepared corn planter may not be able to consistently place seed and create in-row seedbed conditions that ensure rapid uniform emergence.
• Plants that emerge late, so that they are one or two leaves behind neighbouring plants, are likely to achieve a lower yield relative to uniformly emerged stands and may even yield less than later-planted but uniformly emerged corn.
• Relatively small investments in time and/or money for planter adjustments, such as installing new opener discs, levelling the planter, properly adjusting seed-firming wheels and proper seed depth placement, can significantly increase yield and returns.
Row Widths
Narrow RowsPast research indicated that more northerly latitudes benefited the most from narrowing corn rows from the traditional 76–96 cm (30–38 in.) widths to 38–60 cm (15–24 in.) compared to mid-to-southern portions of the cornbelt. Most Ontario producers who converted to narrow-row production systems targeted 50 cm (20 in.) row spacing anticipating that the expected yield boost of 3%–8%, would cover the costs of converting planter and corn header. However, more recent studies conducted in Ontario by the University of Guelph and Pioneer Hi-Bred Ltd. have shown minimal yield advantage with 38 cm (15 in.) or 50 cm (20 in.) rows compared to 76 cm (30 in.) rows. The fundamental reason for moving to narrower rows is to enhance light interception. It appears that the total light interception once the canopy has fully developed is no greater in narrow rows than in wide rows. Any yield advantage experienced with narrow rows must come from earlier canopy closure and greater light interception in the late-June to early-July period.
19
1. corn

Research has yet to find hybrids particularly suited for narrow rows. Increasing plant populations often resulted in comparable yield increases to traditional row widths. Yield improvements may be sporadic and the justification of equipment costs may depend on other factors such as use of the narrow row planter for other crops (e.g., dry edible beans), numbers of acres to be planted and costs of equipment conversions. There is also the increased risk for stalk rots in narrow row systems.
Replant DecisionsThere is no simple formula to aid in replant decisions, so each case must be dealt with individually. When contemplating a replant decision, consider the following:
• original planting date • target plant population • actual population • uniformity of plant size • uniformity of existing plant distribution • possible replanting date • cost of replanting (seed, fungicides/insecticides,
fuel, etc.)
The plant population in a reduced stand can be estimated by counting the number of plants in a length of row that is equal to 1/1000 of an acre, see Table 1–11, Seed spacing to achieve various populations. This should be replicated at least five times in different areas of the field for every 10 ha (25 acre). Determine the average of these samples and then multiply the average by 1,000 to calculate the number of plants per acre. For the number of plants per ha, multiply it again by 2.47.
It is important when taking stand counts to observe the uniformity, plant size and distribution of the plants in the rows. How do the stand, plant size and distribution vary? Yields can be reduced by 2% if the stand has several 30–90 cm (12–36 in.) gaps. If the gaps are larger — 1.25–2 m (4–6 ft) — expect a 5%–6% reduction in yield when compared to a uniform stand. Yield reductions will be greater with more numerous and longer gaps between plants within the row.
Table 1–17, Expected grain yield due to various plant populations, shows the effect of reduced plant population on final grain yield. Yields are based on stands that are normal in terms of uniformity of plant size and distribution. Grain yields for varying populations are expressed as a percentage of the yield obtained at a final plant population of 74,000 plants/ha (30,000 plants/acre) with a planting date prior to May 10.
The availability of early-maturing hybrids with good yield potential and the cost of replanting are important factors in the replant decision. Consider whether the herbicide program allows for a switch to soybeans. If not, is a reapplication of corn herbicides required? What is the condition and health of the remaining crop? Before replanting, determine whether the conditions that caused the problem in the first place still exist (soil conditions, disease, insects, herbicide injury). If an insect or disease problem was the culprit, factor in the cost of an insecticide and/or fungicide treatment.
Table 1–17. Expected grain yield due to various plant populations
Yields are indexed; where 30,000 plants/acre = 100
All data is derived from corn that was planted on or before May 10.
Trials were conducted by Ontario Corn Committee, 2006–2010.
Plant population
Elora (<2,800 CHUs)
Exeter (2,800–3,200 CHUs)
Ridgetown (>3,200 CHUs)
29,600 plants/ha (12,000
plants/acre)
78 91 97
44,400 plants/ha (18,000
plants/acre)
89 93 91
59,300 plants/ha (24,000
plants/acre)
96 97 97
74,100 plants/ha (30,000
plants/acre)
100 100 100
88,900 plants/ha (36,000
plants/acre)
103 102 101
20
Agronomy guide for field Crops

Ontario research data conducted and compiled by the Ontario Corn Committee was used to develop a Replant Decision Aid for producers to use when determining if replant is warranted based on their field situation and costs associated with replanting. This tool can be found at www.gocorn.net.
Fertility Management
Nitrogen (N)Corn responds well to nitrogen, so adequate availability of nitrogen is critical to profitable corn production. Excess nitrogen adds unnecessary expenses and increases the risk of nitrate movement to ground water, poorer quality of surface water and production of greenhouse gases through nitrous oxide emissions. Insufficient nitrogen leads to nitrogen deficiency.
Nitrogen deficiency first appears on the lower leaves, manifested as yellowing, beginning at the tip of the leaf and proceeding down the midrib (Photo 1–4). Eventually, the yellow areas of the leaf will turn brown and die.
Photo 1–4. Nitrogen deficiency shows up on lower leaves first. Yellowing begins at the leaf tip and
proceeds down the midrib.
In young plants, potential yield loss will occur long before nitrogen deficiency symptoms appear, so yellowing is not a reliable indicator of the need for nitrogen fertilizers.
Two methods can be used to determine optimum nitrogen rates:
1. Nitrate-nitrogen (NO3-N) soil test.
2. General recommendations based on: expected yield, soil type, previous crop, CHU rating for location, N fertilizer cost, corn price and application timing.
It is common to see symptoms of nitrogen deficiency in the lower leaves as the plants near maturity, even when there is adequate nitrogen for optimum yield.
Nitrate-Nitrogen (NO3-N) Soil TestSoils can vary greatly in their ability to supply nitrogen. The amount of nitrate-nitrogen present in the soil at planting time, or just before side-dress, can be a useful indicator of a soil’s capacity to supply nitrogen. Use of the soil test for nitrate-nitrogen should result in a more efficient and profitable use of nitrogen as well as a reduction in the risk of nitrate movement into groundwater.
Many of the factors included in the general guidelines will influence the soil nitrate levels, so the strategies for the nitrate-nitrogen soil test should be viewed as separate from the general nitrogen guidelines. Research is ongoing to fine-tune methods to incorporate the soil test results as an adjustment into the general guidelines.
21
1. corn
Time of SamplingThe nitrogen recommendations based on the soil test for nitrate-nitrogen were developed using samples that were taken within 5 days of planting (before or after). However, this is often an inconvenient time for sampling. Seasonal differences in weather can dramatically change the soil tests at this time of year (see Where caution is required). Alternatively, sampling when the corn is 15–30 cm (6–12 in.) tall, before the application of side-dress nitrogen, has increased in popularity. This is referred to as the pre-side-dress nitrogen test (PSNT).
By delaying sampling past the busy planting season, the PSNT allows more time for sampling and receiving results from the laboratory. More importantly, considerable evidence indicates that nitrogen recommendations based on this later sampling time are superior to those based on a planting time sample. This is particularly true when there are organic sources of nitrogen, such as manure or legumes, in the cropping system. PSNT samples taken in June detect nitrate that has mineralized from these organic sources and will more accurately reflect total available nitrogen and fertilizer nitrogen requirements.
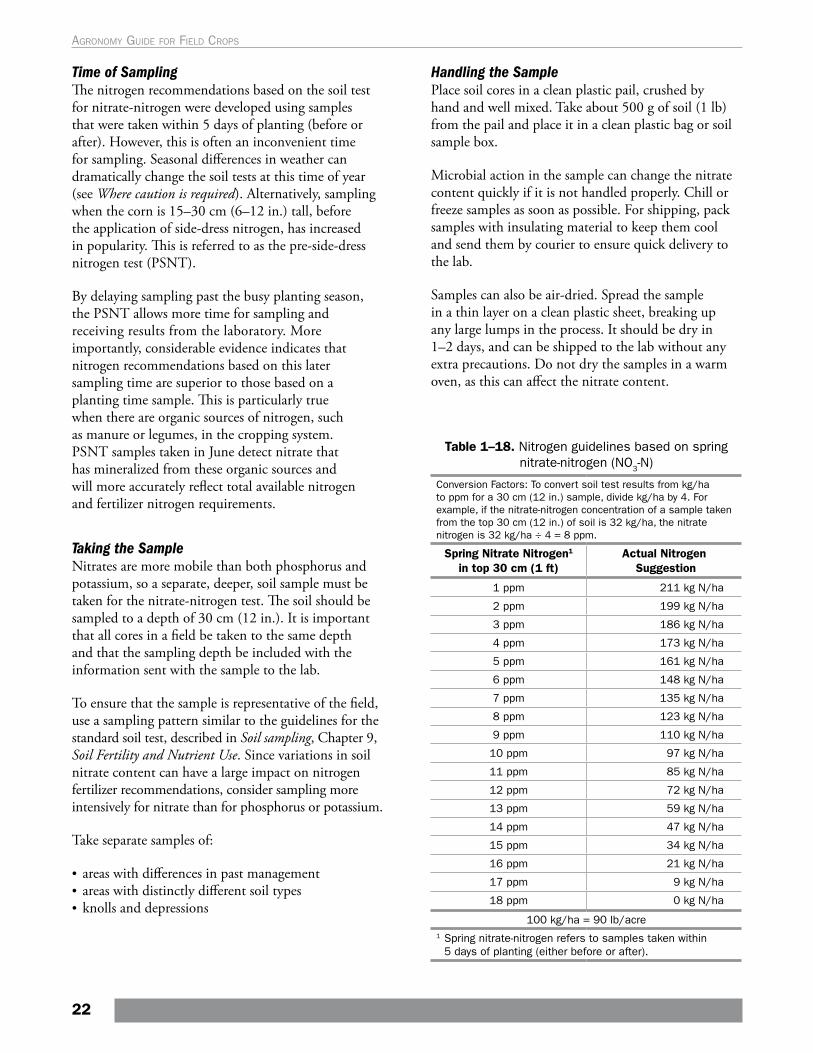
Taking the SampleNitrates are more mobile than both phosphorus and potassium, so a separate, deeper, soil sample must be taken for the nitrate-nitrogen test. The soil should be sampled to a depth of 30 cm (12 in.). It is important that all cores in a field be taken to the same depth and that the sampling depth be included with the information sent with the sample to the lab.
To ensure that the sample is representative of the field, use a sampling pattern similar to the guidelines for the standard soil test, described in Soil sampling, Chapter 9, Soil Fertility and Nutrient Use. Since variations in soil nitrate content can have a large impact on nitrogen fertilizer recommendations, consider sampling more intensively for nitrate than for phosphorus or potassium.
Take separate samples of:
• areas with differences in past management• areas with distinctly different soil types• knolls and depressions
Handling the SamplePlace soil cores in a clean plastic pail, crushed by hand and well mixed. Take about 500 g of soil (1 lb) from the pail and place it in a clean plastic bag or soil sample box.
Microbial action in the sample can change the nitrate content quickly if it is not handled properly. Chill or freeze samples as soon as possible. For shipping, pack samples with insulating material to keep them cool and send them by courier to ensure quick delivery to the lab.
Samples can also be air-dried. Spread the sample in a thin layer on a clean plastic sheet, breaking up any large lumps in the process. It should be dry in 1–2 days, and can be shipped to the lab without any extra precautions. Do not dry the samples in a warm oven, as this can affect the nitrate content.
Table 1–18. Nitrogen guidelines based on spring nitrate-nitrogen (NO3-N)
Conversion Factors: To convert soil test results from kg/ha to ppm for a 30 cm (12 in.) sample, divide kg/ha by 4. For example, if the nitrate-nitrogen concentration of a sample taken from the top 30 cm (12 in.) of soil is 32 kg/ha, the nitrate nitrogen is 32 kg/ha ÷ 4 = 8 ppm.
Spring Nitrate Nitrogen1 in top 30 cm (1 ft)
Actual Nitrogen Suggestion
1 ppm 211 kg N/ha
2 ppm 199 kg N/ha
3 ppm 186 kg N/ha
4 ppm 173 kg N/ha
5 ppm 161 kg N/ha
6 ppm 148 kg N/ha
7 ppm 135 kg N/ha
8 ppm 123 kg N/ha
9 ppm 110 kg N/ha
10 ppm 97 kg N/ha
11 ppm 85 kg N/ha
12 ppm 72 kg N/ha
13 ppm 59 kg N/ha
14 ppm 47 kg N/ha
15 ppm 34 kg N/ha
16 ppm 21 kg N/ha
17 ppm 9 kg N/ha
18 ppm 0 kg N/ha
100 kg/ha = 90 lb/acre1 Spring nitrate-nitrogen refers to samples taken within
5 days of planting (either before or after).
22
Agronomy guide for field Crops

Where Caution Is RequiredSometimes the fertilizer recommendations based on the nitrate-nitrogen soil test need to be modified. The nitrogen in manure or legumes applied or plowed down just before sampling will not have converted into nitrates and will not be detected by the soil test. Information will be provided with the test results on how to make appropriate adjustments.
The nitrate-nitrogen soil test has not been adequately evaluated for:
• legumes or manure plowed down in the late summer or fall
• areas with distinctly different soil types• legumes in a no-till system• soil samples taken prior to planting before the soil
has warmed up significantly (i.e., in mid to late April)
In these circumstances, use the nitrate-nitrogen soil test with caution.
Table 1–18, Nitrogen guidelines based on spring nitrate-nitrogen and Table 1–19, Nitrogen guidelines based on pre-side-dress nitrate-nitrogen show the suggested application rates of nitrogen for different levels of soil nitrate-nitrogen for 30 cm (12 in.) deep samples when the nitrogen/corn price ratio is five. If the price ratio is increased to seven (i.e., the price of nitrogen fertilizer has increased or the price of corn has decreased), reduce the suggested rates by 20 kg/ha (18 lb/acre) from the rates in these tables. For more information, see Price ratio adjustment, in Appendix B.
Table 1–19. Nitrogen guidelines based on pre-side-dress nitrate nitrogen (NO3-N)
Samples taken when the corn is 15–30 cm (6–12 in.) tall (usually within the first 2 weeks of June).
Conversion Factors: To convert soil test results from kg/ha to ppm for a 30 cm (12 in.) sample, divide kg/ha by 4. For example, if the nitrate-nitrogen concentration of a sample taken from the top 30 cm (12 in.) of soil is 32 kg/ha, the nitrate nitrogen is 32 kg/ha ÷ 4 = 8 ppm.
Pre-Side-dress Nitrate
Nitrogen in top 30 cm
(1 ft)
Expected Yield
7.5 t/ha (120 bu/acre)
9.0 t/ha (143 bu/acre)
10.5 t/ha (167 bu/acre)
12.0 t/ha (191 bu/acre)
13.5 t/ha (215 bu/acre)
15.0 t/ha (239 bu/acre)
0 ppm 197 kg N/ha 221 kg N/ha 244 kg N/ha 269 kg N/ha 293 kg N/ha 316 kg N/ha
2.5 ppm 183 kg N/ha 206 kg N/ha 230 kg N/ha 252 kg N/ha 276 kg N/ha 299 kg N/ha
5 ppm 169 kg N/ha 192 kg N/ha 214 kg N/ha 236 kg N/ha 259 kg N/ha 282 kg N/ha
7.5 ppm 155 kg N/ha 177 kg N/ha 198 kg N/ha 221 kg N/ha 242 kg N/ha 265 kg N/ha
10 ppm 141 kg N/ha 161 kg N/ha 183 kg N/ha 204 kg N/ha 225 kg N/ha 248 kg N/ha
12.5 ppm 127 kg N/ha 147 kg N/ha 167 kg N/ha 188 kg N/ha 210 kg N/ha 231 kg N/ha
15 ppm 111 kg N/ha 131 kg N/ha 151 kg N/ha 171 kg N/ha 193 kg N/ha 213 kg N/ha
17.5 ppm 93 kg N/ha 114 kg N/ha 134 kg N/ha 155 kg N/ha 175 kg N/ha 196 kg N/ha
20 ppm 64 kg N/ha 96 kg N/ha 118 kg N/ha 138 kg N/ha 158 kg N/ha 178 kg N/ha
22.5 ppm 0 67 kg N/ha 99 kg N/ha 120 kg N/ha 141 kg N/ha 161 kg N/ha
25 ppm 0 0 71 kg N/ha 101 kg N/ha 123 kg N/ha 143 kg N/ha
27.5 ppm 0 0 0 74 kg N/ha 103 kg N/ha 124 kg N/ha
30 ppm 0 0 0 0 76 kg N/ha 104 kg N/ha
32.5 ppm 0 0 0 0 0 77 kg N/ha
35 ppm 0 0 0 0 0 0
100 kg/ha = 90 lb/acre
LaboratoriesSee Appendix C, Accredited soil-testing laboratories in Ontario, for a list of laboratories that are accredited to analyze soil samples for nitrate-nitrogen.
23
1. corn

General Nitrogen Rate Guidelines for Corn (Metric)The figures in this worksheet are based on a review of N response trials from 1961–2004 and make up the Nitrogen Calculator, which is simple to use and can be found online at www.gocorn.net. The fertilizer rates calculated here are designed to produce the highest economic yield when accompanied by good or above-average management. Research shows that higher rates will occasionally produce higher yields, but usually not enough to pay for the additional fertilizer.
A version of the worksheet using Imperial measure, as well as notes that explain each section can be found in Appendix B, Corn nitrogen rate worksheet (imperial) with detailed explanation.
Replace worksheet with one from the table list.
_________
+ _______
+ _______
– _______
– _______
= _______
– _______
– _______
= _______
_________
A. Base N Requirement(choose from Table A)
B. Yield Adjustment(Yield (T/ha) _____ x 13.6) =
C. Heat Unit AdjustmentYour CHU-M1s = ___________Less – 2,800Total = ___________ x 0.041 =
D. Previous Crop Adjustment(Choose from Table D)
E. Price Ratio (PR) Adjustment for NitrogenRelative to Corn Price(Choose from Table E)
F. Suggested Total N (A+B+C–D–E)
G. Deduct Starter N
H. Deduct Manure N Credits1
I. Preplant Additional N (F–G–H)
OR
J. Sidedress Additional N(If additional N is applied side-dress, multiply value I by the appropriate value in Table J.)
1 Manure N Credits can be found in Chapter 9, Soil Fertility and Nutrient Use.
Table J. Additional N at sidedress — timing adjustment (southwestern and central Ontario only)
Soil Texture Adjustment (kg/ha)
Clay, clay loam, loam, silt loam, silty clay, silty clay loam
0.8
Sandy clay, sandy clay loam, sandy loam 0.9
Sand, loamy sand 1.0
Table A. Base N requirement (kg/ha)
Soil Texture Base N Requirement
Southwestern and Central Ontario
Eastern Ontario*
Clay, heavy clay 53 1
Clay loam 40 1
Loam 32 1
Loamy sand 46 19
Sandy loam 38 19
Sand 52 19
Sandy clay, sandy clay loam
43 19
Silt loam 20 1
Silty clay loam 36 1
Silty clay 49 1
* Eastern Ontario includes Frontenac, Renfrew and counties to the east of them.
Table D. Previous crop adjustments
Previous Crop Adjustment (kg/ha)
Grain Corn 0
Silage Corn 14
Cereals 12
Soybeans 30
Dry edible beans 30
Clover cover crop (plowed) 82
Clover cover crop (no-till) 67
Perennial Forages
Less than one-third legume 0
One-third-to-half legume 55
Over half legume 110
Table E. Price ratio (PR) adjustment for nitrogen relative to corn price
Corn Price
Nitrogen Price ($/kg N)
$1.00 $1.25 $1.50 $1.75 $2.00 $2.25
$120/t 22 36 50 64 78 *
$130/t 18 31 44 57 70 82
$140/t 14 26 38 50 62 74
$150/t 11 22 34 45 56 67
$160/t 8 19 29 40 50 61
$170/t 6 16 26 35 45 55
$180/t 4 13 22 32 41 50
$190/t 2 11 19 28 37 46
$200/t 0 8 17 25 34 42
$210/t * 6 14 22 30 38
$220/t * 5 12 20 27 35
$230/t * 3 10 17 25 32
* Adjustments for these price ratios have not been assessed.
24
Agronomy guide for field Crops

Nitrogen ApplicationThe major portion of the nitrogen should be applied in the spring as pre-plant, pre-emergence or side-dressed before the corn is 30 cm (12 in.) high. Fall application is not advised due to the potential for high losses (e.g., leaching, volatilization, runoff, nitrous oxide).
A portion of the nitrogen may be applied in a band at planting. Ensure that safe rates of fertilizer near the seed are not exceeded, see Chapter 9, Table 9–22, Maximum safe rates of nutrients in fertilizer. Where it is desirable to apply high rates of nitrogen at planting, it should be placed in a separate band greater than 10 cm (4 in.) from the seed row.
Anhydrous ammonia, applied with conventional equipment, should be placed a minimum of 15 cm (6 in.) deep in the soil. For pre-plant applications, applicator outlets should be no more than 50 cm (20 in.) apart. For wider spacing, a 4 day waiting period before planting is recommended to avoid damage to seedlings.
When appropriate equipment is used, ammonia may be applied with a cultivator or disc, a minimum of 10 cm (4 in.) deep with the ammonia outlets spaced no more than 50 cm (20 in.) apart.
Protecting Nitrogen from LossThere are three key factors that contribute to losses of N when applied as fertilizer:
1. Volatilization from surface applied urea.
2. Early season leaching or denitrification of N when it is in the nitrate (NO3) form.
3. Late season N losses from residual N when supply exceeds crop demand.
To reduce urea volatilization, the most common approach is to incorporate or inject the fertilizer so that soil particles trap the ammonia that might volatilize. Generally, thorough field cultivation or discing (1 pass) is enough to virtually eliminate volatilization from surface applied granular urea. If the urea source is UAN (28% or 32% solutions) the risk of volatilization is less than granular urea and in most cases a shallow tillage practice such as a vertical tillage pass can eliminate most of the volatilization risk.
Additives (e.g., active ingredient NBPT) to urea that block the urease enzyme can also protect urea from volatilization losses for a significant period of time.
Risk from early season leaching or denitrification is generally caused by wet soils; either sandy soils that leach N or saturated conditions that cause denitrification in heavy soils. The key strategy to reduce these two forms of loss is to reduce the size of the nitrate pool in the soil prior to any significant crop uptake. This can be done by delaying application of the N, or by using an N fertilizer product that has a slower release profile, such as coated products that physically delay the release of N or fertilizer additives that slow the conversion to nitrate.
Reducing late season N losses hinges on applying fertilizer N at rates very close to the total crop demand so that post-harvest residual nitrate concentration in the soil is low.
Nitrogen Strategies Successful nitrogen application strategies hinge on applying a rate of fertilizer N that closely matches the net difference between the N supply (soil organic matter, previous crop residues, manure, etc.) and the N demand by the crop. The OMAFRA general guidelines (see Corn nitrogen rate worksheet (imperial) in Appendix B) for N use a significant number of factors to predict, on average, the net N requirement for a given field.
Some other factors that can contribute to an improved understanding of seasonal supply and demand are:
1. total rainfall in the April 10 to June 10 period
2. CHU accumulation
3. yield potential based on plant stand and early growth
4. crop imagery (i.e., Normalized Difference Vegetative Index (NDVI) which attempts to define the colour and size of the crop and potential N status)
25
1. corn

Producers must move away from a system where the entire N is applied in the planting window, in order to integrate seasonal inputs and general recommendations into an enhanced nitrogen strategy. An enhanced N strategy demands that planting time N applications are reduced such that there is an opportunity to make improved decisions on what rate is best for the remainder of the N supply.
Split applications, where some of the N is applied at planting and the rest is applied at side-dress (V5 or later) will often reduce the total N required and improve profitability. However, the real advantage to a split application strategy does not come from simply splitting the total N rate into two unique application windows, but from splitting and making more informed rate decisions in the second application window. For example, research from the University of Guelph and OMAFRA demonstrated that in three rather unique growing seasons a strategy of 111 kg/ha (100 lb/acre) at planting followed by 56 kg/ha (50 lb/acre) at side-dress (V6) was modestly superior to a plan of applying 168 kg/ha (150 lb/acre) all at planting. Significantly better results were obtained, however, if following the 111 kg/ha (100 lb/acre) rate at planting, the side-dressed rates could be adjusted from 0–90 kg/ha (0–80 lb/acre) depending on the seasonal cues of rainfall, soil nitrates, etc.
High clearance application equipment that is now more prominent in Ontario allows for applications of N to take place right up to tassel stage. This widens the window for gathering seasonal cues to determine N rates and reduces the risk of the corn getting too tall for conventional tractor drawn side-dress equipment. Research in the U.S. cornbelt has redefined the amount of N that is taken up by the plant after VT, as illustrated in Figure 1–2, Nitrogen uptake at various stages of corn development. The need for nitrogen to be taken up by the corn plant in the post-silking window is evident. However, producers should be reminded of several key issues that relate to late season applications:
• If nitrogen was applied earlier and has not been lost from the soil matrix from leaching or denitrification, it will be available to feed the crop post-silking.
• So far, there is limited research that suggests any positive yield response to “newly applied N” in the late side-dress window (V10 to tassel).
• Late applications of N that are applied to the soil surface or banded at very shallow depths (<5 cm) may not receive sufficient rainfall to be carried into the soil matrix and be taken up by corn roots.
• If applications are targeted to this late window, adequate N must be applied at planting to carry the crop until the later N is applied; this might range from 67–112 kg/ha (60–100 lb/acre).
Figure 1–2. Nitrogen uptake at various stages of corn development. (Courtesy DuPont Pioneer)
26
Agronomy guide for field Crops

Phosphate and PotashThere are two distinct approaches to managing phosphorous (P) and potassium (K); one is referred to as the “Sufficiency Approach” and the other is the “Build (or Target) and Maintain Approach”. OMAFRA P and K guidelines for corn as outlined in this section adhere to the Sufficiency Approach, for a more detailed explanation of the two approaches and how they influence P and K decisions, see Chapter 9, Soil fertility and nutrient use.
Adequate phosphorus and potassium are necessary for optimum corn growth and yield, although the response to these nutrients is not as evident as with nitrogen. Phosphorus deficiency does not show any unique symptoms; phosphorus-deficient plants will be stunted and may have a darker green or purplish colour. Purple leaves may also be an indication of cool weather stress or root injury (Photo 1–5). Potassium deficiency symptoms appear on the lower leaves of the plant first, showing as yellowing and browning beginning at the tip and proceeding back along the outside margin of the leaf (Photo 1–6). Both of these nutrients will exhibit “hidden hunger,” where yields are reduced by a deficiency of one or both of these nutrients, even though no deficiency symptoms are visible.
Photo 1–5. Purple corn. Purple leaves on corn is most often caused by cool weather stress or root injury.
Occasionally, it is an indication of phosphorus deficiency.
Phosphate and potash guidelines for corn are presented in Table 1–20, Phosphate (P2O5 ) guidelines for corn and Table 1–21, Potash (K2O) guidelines for corn.
Table 1–20. Phosphate (P2O5) guidelines for corn
Based on OMAFRA-accredited soil tests.
Profitable response to applied nutrients occurs when the increase in crop value, from increased yield or quality, is greater than the cost of the applied nutrient.
Where manure is applied, reduce the fertilizer application according to the amount and quality of manure (Chapter 9, Manure section).
LEGEND: HR = high response MR = medium response LR = low response RR = rare response NR = no response
Sodium Bicarbonate Phosphorus Soil
Test (ppm) Phosphate Required
0–3 ppm 110 kg/ha (HR)
4–5 ppm 100 kg/ha (HR)
6–7 ppm 90 kg/ha (HR)
8–9 ppm 70 kg/ha (HR)
10–12 ppm 50 kg/ha (MR)
13–15 ppm 20 kg/ha (MR)
16–20 ppm 20 kg/ha (MR)
21–30 ppm 20 kg/ha (LR)
31–60 ppm 0 (RR)
61 ppm + 0 (NR)1
100 kg/ha = 90 lb/acre1 When the response rating for a nutrient is “NR,”
application of phosphorus in fertilizer or manure may reduce crop yield or quality. For example, phosphate applications may induce zinc deficiency on soils low in zinc and may increase the risk of water pollution.
Photo 1–6. Potassium deficiency shows up on lower leaves first, as yellow and browning at the leaf tip and
proceeds along the margin of the leaf.
27
1. corn

Table 1–21. Potash (K2O) guidelines for corn
Based on OMAFRA-accredited soil tests.
Profitable response to applied nutrients occurs when the increase in crop value, from increased yield or quality, is greater than the cost of the applied nutrient.
Where manure is applied, reduce the fertilizer application according to the amount and quality of manure (Chapter 9, Manure section).
LEGEND: HR = high response MR = medium response LR = low response RR = rare response NR = no response
Ammonium Acetate Potassium Soil Test (ppm) Potash Required
0–15 ppm 170 kg/ha (HR)
16–30 ppm 160 kg/ha (HR)
31–45 ppm 140 kg/ha (HR)
46–60 ppm 110 kg/ha (HR)
61–80 ppm 80 kg/ha (MR)
81–100 ppm 50 kg/ha (MR)
101–120 ppm 30 kg/ha (MR)
121–150 ppm 0 (LR)
151–250 ppm 0 (RR)
251 ppm + 0 (NR)1
100 kg/ha = 90 lb/acre1 When the response rating for a nutrient is “NR,”
application of potash in fertilizer or manure may reduce crop yield or quality. For example, potash application on soils low in magnesium may induce magnesium deficiency.
For information on the how to use these tables or if an OMAFRA-accredited soil test is not available, See Fertilizer Guidelines in Chapter 9, Soil Fertility and Nutrient Use.
Where soil tests indicate that large amounts of phosphorus and potassium are required, the major portion may be broadcast and incorporated in the fall or spring. Where soil tests show a moderate or small requirement for these nutrients, apply a fertilizer containing nitrogen (preferably in the ammonium form) and phosphorus, or nitrogen, phosphorus and potassium as a starter at planting. All of the phosphorus and some of the potassium may be applied in a band 5 cm (2 in.) to the side and 5 cm (2 in.) below the seed (refer to Table 9–22, Maximum safe rates of nutrients in fertilizer, in Chapter 9, Soil fertility and nutrient use).
Seed-Placed FertilizerField trials over several years have shown that an application of 10–15 kg/ha (9–13 lb/acre) P2O5 directly with the seed will give greater yield increases than 20 kg/ha (18 lb/acre) P2O5 in a side band application. At phosphorus soil tests of 13–45 ppm, this “with-seed” application is more likely to give a profitable response than a side-band application. At soil tests below 13 ppm, application of 10–15 kg P2O5/ha (9–13 lb P2O5/acre) with the seed may also be profitable, but cannot replace the requirement for additional phosphorus in the side band or broadcast application.
Fertilizers applied with the seed that contain nitrogen in the ammonium form must be low in salt and must not contain either urea or diammonium phosphate. They must also be distributed uniformly to avoid toxicity to the germinating seed. Application of more than 15 kg/ha (13 lb/acre) P2O5 with the seed in 75 cm (30 in.) wide rows is not advised.
Maximum Safe Rates of FertilizerApplying too much fertilizer to corn may result in crop injury, either from excessive salts or ammonia (Photo 1–7). The more concentrated the fertilizer and the closer it is to the seed, the greater the risk of crop injury and the lower the safe rate. Maximum safe rates are given in Table 9–22. Note that slight reductions in crop growth and yield are possible with these application rates under adverse weather conditions.
Photo 1–7. Fertilizer injury burns the primary root, delaying growth until secondary roots develop.
Plant emergence will be uneven.
28
Agronomy guide for field Crops

Phosphorus (P): Band vs. BroadcastBand applying phosphorus (P) is more likely to result in profitable corn yield increases when compared to the same amount applied broadcast. A review of Ontario research trials indicated that applying 50–70 kg-P2O5/ha (45-62 lb-P2O5/acre) in a 5 cm x 5 cm (2 in. x 2 in.) band, had average yield increases that were three times higher when compared to broadcast applied P. Only banded P when applied at rates between 50 –70 kg-P2O5/ha resulted in yield increases that on average were profitable.
Table 1–22, Average grain corn yield and profit response from broadcast and banded phosphate, shows the average grain corn yield and profit response to broadcast and 2 x 2 band applied P.
Table 1–22. Average grain corn yield and profit response to broadcast and banded phosphate
Average P205 application rate of 60 kg/ha (range 50–70 kg/ha)
Return calculations are based on corn price of $177/tonne ($4.50/bu) and MAP cost of $1.43/kg P2O5 (0.65/lb P2O5).
Application Method Yield Increase Profit Increase
Broadcast 0.22 t/ha (3.5 bu/acre)
– $47/ha (– $19/acre)
Banded 0.61 t/ha (9.7 bu/acre)
$22/ha ($9/acre)
Source: OMAFRA Research Trials (2012–2014).
Potassium (K): Band vs. BroadcastPotassium (K) included in starter fertilizers can result in profitable corn yield increases, especially when soil test K levels are less than 90 ppm. Table 1–23, Corn yield response to broadcast potassium (K) applications with various starter fertilizer options, contains results from Ontario research trials, which evaluated corn yield response to various starter fertilizers. When soil-test K levels were less than 90 ppm, and no broadcast K was applied, applying a MAP/Potash blend in a 5 cm x 5 cm (2 in. x 2 in.) starter band increased corn yields significantly. In these same circumstances, seed placed liquid fertilizers that also contain a small amount of K, produced higher corn yields than where no starter fertilizer was used or where starter fertilizers contained only P. On these lower testing soils when K was broadcast prior to planting (fall or spring), yields were improved significantly by the broadcast K and the magnitude of the yield response due to the starters was reduced.
These data generally indicate that broadcasting K on the lower testing soils is advised. However, in situations where land tenure is in question and broadcasting a significant amount of K to build soil tests is risky, a producer with the capability to band dry fertilizer P and K blends can generate yields equivalent to other options.
On higher testing soils, the amount of yield response to any applied K is much lower. Some K in a starter band can improve yields, but generally speaking the advantage to higher K rates in dry 5 cm x 5 cm (2 in. x 2 in.) bands compared to lower in-furrow rates is marginal.
If broadcast K is to be applied either in the fall or spring prior to corn planting, the need for K in the starter is significantly reduced unless soils are low testing (HR) (i.e., less than 61 PPM). In these low K fertility situations, broadcasting to build soil fertility levels and banding to help meet the crops immediate requirements are likely both profitable.
Table 1–23. Corn yield response to broadcast potash (K) applications with various starter
fertilizer options6-24-6 applied at 47 L/ha (5 gal/acre); P and K applied at rates of 35–62 kg/ha (31–55 lb/acre) of P2O5 and K2O each in a blend.
Soil test averages for sites in the <90 group averaged 71 PPM K and 21 PPM P.
Soil test averages for sites in the >90 group averaged 122 PPM K and 27 PPM P.
Soil Test K
Starter Fertilizer
No Broadcast K
Broadcast K
<90 none 7.6 t/ha (120 bu/acre)
9.8 t/ha (156 bu/acre)
6-24-6 (liquid in furrow)
8.7 t/ha (139 bu/acre)
9.9 t/ha (158 bu/acre)
P and K (dry in 2x2 band)
10.4 t/ha (168 bu/acre)
10.5 t/ha (166 bu/acre)
>90 none 11.0 t/ha (176 bu/acre)
11.7 t/ha (186 bu/acre)
6-24-6 (liquid in furrow)
11.7 t/ha (186 bu/acre)
12.0 t/ha (192 bu/acre)
P and K (dry in 2x2 band)
10.9 t/ha (190 bu/acre)
12.2 t/ha (195 bu/acre)
Source: OMAFRA Research Trials (2012–2014).
29
1. corn
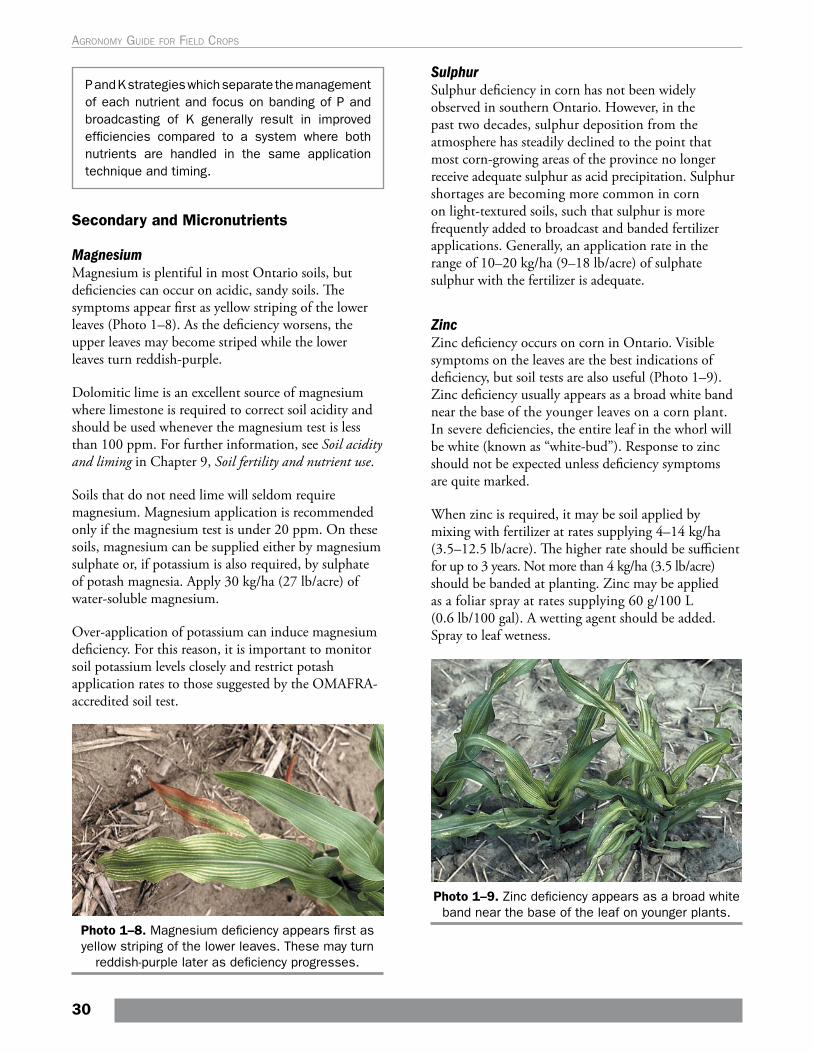
P and K strategies which separate the management of each nutrient and focus on banding of P and broadcasting of K generally result in improved efficiencies compared to a system where both nutrients are handled in the same application technique and timing.
Secondary and Micronutrients
MagnesiumMagnesium is plentiful in most Ontario soils, but deficiencies can occur on acidic, sandy soils. The symptoms appear first as yellow striping of the lower leaves (Photo 1–8). As the deficiency worsens, the upper leaves may become striped while the lower leaves turn reddish-purple.
Dolomitic lime is an excellent source of magnesium where limestone is required to correct soil acidity and should be used whenever the magnesium test is less than 100 ppm. For further information, see Soil acidity and liming in Chapter 9, Soil fertility and nutrient use.
Soils that do not need lime will seldom require magnesium. Magnesium application is recommended only if the magnesium test is under 20 ppm. On these soils, magnesium can be supplied either by magnesium sulphate or, if potassium is also required, by sulphate of potash magnesia. Apply 30 kg/ha (27 lb/acre) of water-soluble magnesium.
Over-application of potassium can induce magnesium deficiency. For this reason, it is important to monitor soil potassium levels closely and restrict potash application rates to those suggested by the OMAFRA-accredited soil test.
Photo 1–8. Magnesium deficiency appears first as yellow striping of the lower leaves. These may turn
reddish-purple later as deficiency progresses.
SulphurSulphur deficiency in corn has not been widely observed in southern Ontario. However, in the past two decades, sulphur deposition from the atmosphere has steadily declined to the point that most corn-growing areas of the province no longer receive adequate sulphur as acid precipitation. Sulphur shortages are becoming more common in corn on light-textured soils, such that sulphur is more frequently added to broadcast and banded fertilizer applications. Generally, an application rate in the range of 10–20 kg/ha (9–18 lb/acre) of sulphate sulphur with the fertilizer is adequate.
ZincZinc deficiency occurs on corn in Ontario. Visible symptoms on the leaves are the best indications of deficiency, but soil tests are also useful (Photo 1–9). Zinc deficiency usually appears as a broad white band near the base of the younger leaves on a corn plant. In severe deficiencies, the entire leaf in the whorl will be white (known as “white-bud”). Response to zinc should not be expected unless deficiency symptoms are quite marked.
When zinc is required, it may be soil applied by mixing with fertilizer at rates supplying 4–14 kg/ha (3.5–12.5 lb/acre). The higher rate should be sufficient for up to 3 years. Not more than 4 kg/ha (3.5 lb/acre) should be banded at planting. Zinc may be applied as a foliar spray at rates supplying 60 g/100 L (0.6 lb/100 gal). A wetting agent should be added. Spray to leaf wetness.
Photo 1–9. Zinc deficiency appears as a broad white band near the base of the leaf on younger plants.
30
Agronomy guide for field Crops

ManganeseManganese deficiency in corn is rare, although there have been a few occurrences reported on muck soils with high pH in southwestern Ontario. Corn is much more tolerant of low soil manganese levels than soybeans or cereals. Manganese deficiency in corn appears as an olive-green discolouration of the leaves, occasionally with faint striping. Foliar application of manganese is the most effective way to correct a deficiency.
Correct the deficiency as soon as detected by spraying the foliage with 2 kg/ha (1.8 lb/acre) of actual manganese from manganese sulphate (8 kg/ha (7 lb/acre)) in 200 L of water. A “spreader-sticker” in the spray is suggested. If the deficiency is severe, a second application may be beneficial. Prior to applying micronutrients, take care to properly clean out the spray tank of a sprayer that has been used to apply herbicides.
Other MicronutrientsOther micronutrients are not likely to be deficient in corn in Ontario. Some micronutrients, such as boron, can be toxic if applied to corn, particularly if applied in a band or in the starter/pop-up fertilizer.
Plant AnalysisThe most appropriate growth stage for sampling corn for plant analysis depends on which nutrient is being tested for. For most nutrients, sampling the mid-third of the ear leaf at silking is most appropriate. For phosphorus and zinc, sampling the whole plant when five to six leaves are visible is more appropriate. See Table 1–24, Interpretation of plant analysis for corn for normal concentrations of nutrients.
For sampling at times other than those indicated above, take plant samples from both deficient and healthy areas of the field for comparative purposes. For plants with six leaves or less, sample the total above-ground plant. From V7 to silking, sample the youngest fully developed leaf. Take a soil sample from the same areas and at the same time as the plant samples.
Table 1–24. Interpretation of plant analysis for cornLEGEND: — = no data available
NutrientCritical Concentration1
Maximum Normal Concentration2
Seedling Corn (five to six leaves)
Phosphorus 0.35% 0.70%
Zinc 20.0 ppm 70.0 ppm
Silking (mid-third of leaf opposite ear)
Nitrogen (N) 2.5% 3.5%
Phosphorus (P) 0.28% 0.50%
Potassium (K) 1.2% 2.5%
Calcium (Ca) — 1.5%
Magnesium (Mg) 0.10% 0.60%
Sulphur (S) 0.14% —
Boron (B) 2.0 ppm 25.0 ppm
Copper (Cu) 2.0 ppm 20.0 ppm
Manganese (Mn) 15.0 ppm 150.0 ppm
Zinc (Zn) 20.0 ppm 70.0 ppm1 Yield loss due to nutrient deficiency is expected with
nutrient concentrations at or below the “critical” concentration.
2 Maximum normal concentrations are more than adequate but do not necessarily cause toxicities.
Foliar FertilizationThe foliar application of nutrients to corn has not proven effective in most instances. The rates of nutrients required cannot be applied as a foliar spray without causing damage to the leaf, unless numerous small applications are made. Correction of some of the micronutrient deficiencies are the exception, but even in these cases, it is often more economical to apply the nutrient to the soil.
Harvesting and Storage
Corn HarvestPhysiological maturity (black layering) occurs when the grain moisture content reaches 31%–33% moisture. After this stage, there is no dry matter added to the corn kernel. Harvesting grain corn at moisture contents above 28% often results in significant damage to the grain and makes it more difficult to market commercially. High quality food grade markets may require harvest moistures to be as low as 20%–22%.
31
1. corn
Weigh the benefits of delaying harvests (e.g., lower drying costs and improved sample quality) against the increased risks (e.g., higher levels of stalk lodging, ear drop and wet weather). Scout fields and check for stalk quality to determine the need to adjust harvesting dates forward to prevent harvest losses. When stalk quality is poor, the next significant wind or rainstorm may increase harvest losses dramatically. Efficient header performance is also important when harvesting corn with poor stalk strength. Keep header speed in step with ground speed to improve stalk flow down through the stripper plates and snapping rolls. If necessary, adjust them closer together.
Damage by the combine to grain quality can result from any of the following:
• cylinder speed too high• concave clearance too narrow• too many concave filler bars• concave and cylinder not parallel
When harvesting corn that has been frozen prior to maturity, experience indicates that running the cylinder speed as slow as possible is the key to maintaining quality.
Use these guidelines to assess combine harvest losses:
• 22 kernels/m2 (2 kernels/ft2) represents approximately 0.06 t/ha (1 bu/acre) loss
• one average-sized ear in 1/100 acre (6.4 m2 or 21 ft2) represents 0.06 t/ha (1 bu/acre) in lost yield
If combine losses exceed 0.16 t/ha (2.5 bu/acre), make adjustments.
Harvesting and Storing Corn Silage See Haylage and Corn Silage in the Harvest and Storage section of Chapter 3, Forages.
Corn Storage
Drying and Storing Corn The three general types of grain dryers used on the farm are:
• in-bin• batch • continuous flow
No single drying system is superior. Grain dryer selection is dependent on desired features, including drying capacity, grain quality, fuel/drying efficiency (BTUs per volume of water removed), convenience, manpower required to run the dryer, ability to dry a variety of crops, maintenance required and capital cost.
All dryers move “dry” air past the grain to evaporate moisture within the kernel and carry the water vapour away. Heat is added to this drying air to reduce its relative humidity, thereby increasing its ability to pick up moisture. Wet grain can be dried at higher temperatures, without damaging the corn, because the corn is cooled as the moisture evaporates from the kernels. As the grain dries, it will approach the temperature of the drying air. The longer grain kernels are in contact with this heated air, the drier and hotter the kernels will get.
Corn dries as the moisture from the inside of the kernels is evaporated from the kernel surface. Most of the moisture inside the kernel exits through the tip end of the kernels. The first few points of moisture can be easily removed using relatively little energy. Further moisture must be removed from deep within the corn kernels. As the outside layers of the kernel dry, the moisture must migrate out from the moist centre. This moisture does not move to the surface as quickly as it is being evaporated from the surface of the kernel by the drying air. This results in higher energy requirements to remove the last few percentage points of moisture.
Drying TemperaturesA range of drying temperatures can be used to dry corn, but should not exceed the maximum suggested air temperatures in Table 1–25, Maximum suggested air temperatures for drying corn of various end uses. The maximum recommended drying temperature depends on several factors, including final end use of the grain, initial moisture content of the grain, type of grain and type of dryer.
32
Agronomy guide for field Crops

Table 1–25. Maximum suggested air temperatures for drying corn of various end uses
End Use
Maximum Drying
Temperature (°C)
Seed corn 45
Starch milling 70
Industrial uses, non-ruminant feed 90
Cattle feed 120
Viability is destroyed when the actual grain temperature exceeds approximately 50°C. Reduction in nutritional value occurs when grain temperature reaches 90°C–100°C.
Kernel QualityStress cracking can be reduced by taking corn hot out of the dryer, allowing it to steep and then aerating the corn with a minimum of 6.5 L/sec/m3 (0.5 CFM/bu) airflow. Both stress cracking and physical kernel damage are influenced by the speed of moisture removal and maximum kernel temperature, coupled with the rate of cooling after drying.
In addition to maintaining grain quality, using this system of dry-aeration or cool-aeration can increase the throughput of the drying system. Many farmers in Ontario practice “cool-aeration,” where corn is removed hot from the drier, transferred to a storage bin and cooled slowly. In this way, hot corn is continuously being added to the top of the final storage bin and slowly cooled.
Natural-Air DryingNatural-air drying of corn is possible in most parts of southern Ontario. This method of drying corn is well suited for livestock operations to produce high-quality corn that is free of stress cracks. Good management of a natural-air drying system is critical to success.
Minimum Requirements for Natural-Air Drying • full aeration floor in the bin• level grain surface across the whole bin • minimum airflow of 26 L/sec/m3 (2 CFM/bu),
preferably more
• corn 25% moisture content or less• clean corn with no cob pieces or fines • accurate moisture reading of the corn in the bin• accurate outside air temperature and relative
humidity measurement• an understanding of corn equilibrium moisture content• coring the bin (auger out some grain) after filling
(The best way is to remove a couple of loads from the bin. This establishes the flow funnel and removes the highest concentration of fines from the centre of the bin. Clean these loads before placing them back into the bin. Even if the loads are put right back in the bin without cleaning, the resistance to airflow will be less than if the bin had not been cored.)
• an on/off switch for the fan
When to Run the FanFan operation in a natural-air corn-drying bin is slightly different than for other air-dried crops.
• Once there is sufficient corn in the bin to hold the perforated floor down, the fan can be turned on.
• Run the fan continuously for the first 3 weeks after the bin has been filled or until the first drying front has come through the top of the bin.
• The first drying front emergence will be evident when there is a noticeable drop in the moisture content of the corn at the top of the bin.
• Before this drying front passes through, the corn at the top of the bin will remain at harvest moisture levels and may even increase slightly compared with the corn drying further down.
• If the fan is shut off for an extended period of time at the start of the drying process, there is a risk that the drying front may stall and will not move upwards once the fan is turned on again. This will result in spoilage occurring above the drying front.
• Once the first drying front passes through the top of the bin, begin to manage the fan operation, using the equilibrium moisture chart for corn, see Table 1–26, Equilibrium moisture content for corn exposed to air.
• Run the fan any time the outside conditions will still allow the wettest corn in the bin to dry. At times, this procedure may add some moisture to the corn at the bottom of the bin. This temporary rewetting of the bottom corn will actually dehumidify the air so it can do more drying up higher in the bin.
33
1. corn

Rain or shine, the fan should not be turned off until the first drying front has passed through the whole bin.
The corn may not reach the desired moisture content before freezing weather arrives. Trying to accomplish natural-air drying in below-freezing temperatures is very slow and inefficient.
The last few points of moisture may have to be taken out in early spring. Some livestock producers never finish drying the corn any further after winter, as it processes and stores well as feed at the higher moisture levels.
Table 1–26. Equilibrium moisture content for corn exposed to air
Temperature °C
Relative Humidity (% Wet Basis)
50% 60% 70% 80% 90%
0 13.7 15.1 16.6 18.4 21.3
5 13.1 14.4 15.9 17.8 20.7
10 12.5 13.8 15.4 17.3 20.2
15 11.9 13.3 14.9 16.8 19.8
20 11.5 12.8 14.4 16.4 19.4
25 11.0 12.4 14.0 16.0 19.0
Humidistats are available that will activate the fan at preset humidity levels. The operator can adjust and set the relative humidity level at which the fan is activated. Bins with stirrators will have fairly uniform moisture levels throughout the whole bin as a result of the mixing that has occurred.
Corn at moisture levels greater than 25% can also be dried in a natural-air bin. This is accomplished by only partially filling the natural-air bin, resulting in an airflow of 52–78 L/sec/m3 (4–6 CFM/bu). Producers who need corn for feed in late September can harvest headlands and put this in the bin. The warm temperatures in late September, combined with higher CFM/bu airflow enable this corn to be dried in a couple of weeks.
Equilibrium Moisture ContentResearchers have developed equilibrium moisture content tables that predict the final moisture content of corn when exposed to air at a certain temperature
and relative humidity, see Table 1–26, Equilibrium moisture content for corn exposed to air. For example, to determine the equilibrium moisture content of corn exposed to outside air at 10°C and 70% relative humidity, find the point at which the 10°C line and the 70% relative humidity line intersect. This point (15.4%) will be the equilibrium moisture content.
Other Crop Problems
Insects and DiseasesFigure 1–3, Corn scouting calendar, shows insects and diseases that could be causing the symptoms in the field. Individual descriptions of insects, pests and diseases, scouting and management strategies can be found in Chapter 15, Insects and pests of field crops, or Chapter 16, Diseases of field crops.
Fungicide Applications and TimingFungicide use in corn has increased significantly over the last decade. Most application timings focus on the VT (tassel emergence or early silk emergence stages). Earlier applications (e.g., 8 to 10 leaf corn) have generally been less profitable. Fungicide application for disease control should be based on scouting and presence of disease. Producers need to ensure that their fungicide application timing and product selection are correct for their target disease. For example, certain fungicides and timings are suited for ear mould control and potential mycotoxin reduction, while others are prescribed for foliar diseases.
The price of fungicide application (product and application cost) and price of corn are generally the biggest factors in predicting the profitability of a fungicide application. Other factors that need to be considered include:
• disease pressure• previous crop • rainfall status• hybrid susceptibility to diseases, etc.
For a more detailed discussion of fungicide use refer to Fungicide Use in the Chapter 16.
34
Agronomy guide for field Crops

Figure 1–3. Corn scouting calendar.
35
1. corn

Cold Weather
Early-Season ColdFrost damage in May or June will generally have little impact on the crop, provided the growing point of the corn plant is still below the soil surface. This is the case until the young plant reaches roughly the sixth-leaf stage (V6). On more advanced plants and/or where damage is more severe, split the stalks to see if the growing point has been damaged. This procedure will require some time to make the correct recommendation. It takes about 3–5 days following a frost to accurately determine the degree of damage to verify the presence of healthy growing points (yellowish-white and firm) or to see new leaf growth.
Frozen leaf tissue bleaches to a straw colour several days after freezing. In some cases, it also develops a “knot,” which may restrict expansion of the undamaged tissue lower in the whorl (Photo 1–10). Producers have attempted to mow frost injured fields to clip these knots and help the plant recover though research has shown plants can recover as quickly and yield just as much if they are left alone.
If the forecast calls for a risk of frost, consider delaying inter-row cultivation, nitrogen side-dressing or herbicide applications until warmer temperatures return. Soil disturbance at the surface introduces more air into the soil and insulates the corn plants from the heat of the soil mass, thus increasing the risk of frost damage. Similarly, crop residues and weeds act as a barrier for heat transfer from the soil to the corn plant. Dry soils are more prone to frost damage due to their lower capacity to store heat during the day and thus less heat to transfer and protect the corn plant overnight.
Photo 1–10. Frost injury on corn in mid-June. Smaller plants can recover, but growth in larger plants may be
restricted by frost-injured dead tissue.
Late-Season ColdCold temperatures during the grain-filling period in August and September may cause yield and quality losses. The extent of these losses depends on the developmental stage of the corn and the temperatures recorded.
As temperatures drop to 0°C, frost damage first occurs to the leaves of the corn plants. This damage will eliminate any further photosynthesis, reduce grain filling and will often have a negative effect on stalk strength. However, as long as air temperatures do not fall below -2°C, stalk tissues will remain viable and stalk constituents will be mobilized to fill the ear as much as possible. If temperatures fall below -2°C, both leaves and stalks may be damaged and no further photosynthesis or remobilization can occur. This will terminate grain filling, and kernel black layer will develop. Table 1–27, Estimated risks to grain corn yield and quality from late-season frost damage outlines the potential risks to yield and quality for grain corn experiencing different levels of frost damage.
Table 1–27. Estimated risks to grain corn yield and quality from late-season frost damage
This table is meant as a guide. Differences among hybrids, overall plant vigour at time of frost and subsequent temperatures will all affect final grain yield and quality.
Crop Growth Stage
Frost Damage
Estimated Grain Yield Loss
Grain Quality Concerns
Mid-dough complete plant
40% severe
Mid-dough leaves only 25% severe
Early dent complete plant
25% moderate
Early dent leaves only 15% moderate
Half milk line complete plant
10% minor
Half milk line leaves only 0%–5% none
Generally, the early dent stage is the cut-off point where corn can withstand frost damage to the leaves and still produce a reasonable grain yield. This stage is characterized by having kernels showing small indentations in the crown of the kernel, at least in the lower half of the cob.
36
Agronomy guide for field Crops

The other question regarding cold nights revolves around the corn crop’s ability to continue grain filling after experiencing several cold nights without frost damage. Dr. Thys Tollenaar formerly of the University of Guelph conducted research that measured 50% reductions in photosynthesis and rate of grain filling due to cold nights of 2°C. When these plants were restored to higher temperature conditions, they resumed plant activities at rates similar to those plants that had never experienced the low temperatures. If cornfields can escape any serious frost damage during cold nights, grain filling should resume once normal temperatures return.
In some situations, frost damage will preclude harvesting the crop as grain and will force the producer to consider harvesting it as silage. There are important concerns involving frost damage in silage corn as well. Following a frost, silage corn frozen before reaching the half milk line on the kernel may be too high in moisture to properly ensile. Ideally, in cases of frost, delay corn harvest until the entire plant reaches the desired moisture content for ensiling.
Heat StressHeat stress is different from drought stress (Photo 1–13). Corn can usually tolerate temperatures as high as 38°C before injury occurs, as long as drought conditions are not present as well. Temperature and drought sensitivity varies by hybrid. Drought-tolerant hybrids may result in yield drag and are not good hybrids to use in a normal growing season.
HailCorn plants damaged by hail may experience a reduction in leaf surface area, bruising of the stalk and ear, and in serious incidences, stalk breakage (Photo 1–11). Hail damage may also provide an entry point for diseases such as smut. Yield loss due to hail is dependent on the stage of the crop at the time of the hail event and the level of defoliation. Yield loss is greatest when the corn is defoliated during tasselling. Younger plants may experience a delay in growth and development due to hail, but yield loss is usually minimal. Yield loss is minimal when defoliation of plants occurs near maturity. See Table 1–28, Estimated percentage corn grain yield loss due to defoliation at various growth stages when making yield loss estimates due to hail damage.
Photo 1–11. Hail damage is most harmful if defoliation occurs during tasseling.
FloodingFlooding stresses the plant by cutting off the supply of oxygen to the root system. Younger corn plants die if submerged in water for more than 5 days, especially in warmer weather conditions. If air temperatures are high, death may occur in only a few days, as plant processes are sped up and the need for a supply of oxygen to the roots is high. In cooler weather, submerged plants may live for up to a week. After the 8-leaf stage of corn, plants can tolerate being submerged in water for more than 8 days but may be more susceptible to disease (i.e., crazy top) and may experience limited root development while under water (Photo 1–12). Yield loss due to flooding is most substantial for plants submerged immediately before and during tasselling and silking. Plants in the later vegetative growth stages (10–16 leaves) and/or during the grain filling period, suffer little yield loss to flooding.
Photo 1–12. Crazy top is a disease that results from corn being flooded after 8-leaf stage.
37
1. corn

Growth Stage1 1
0%
15%
20%
25%
30%
35%
40%
45%
50%
55%
60%
65%
70%
75%
80%
85%
90%
95%
100
%
Table 1–28. Estimated percentage corn grain yield loss due to defoliation at various growth stages
Leaf Defoliation
7 leaf 0 0 0 0 0 0 1 1 2 3 4 4 5 5 6 7 8 9 9
9 leaf 0 0 0 1 1 2 2 3 4 5 6 6 7 7 9 10 11 12 13
11 leaf 0 0 1 1 2 3 5 6 7 8 9 10 11 12 14 16 18 20 22
13 leaf 0 1 1 2 3 4 6 8 10 11 13 15 17 19 22 25 28 31 34
15 leaf 1 1 2 3 5 7 9 12 15 17 20 23 26 30 34 38 42 46 51
17 leaf 2 3 4 5 7 9 13 17 21 24 28 32 37 43 48 53 59 65 72
18 leaf 2 3 5 7 9 11 15 19 24 28 33 38 44 50 56 62 69 76 84
19–21 leaf
3 4 6 8 11 14 18 22 27 32 38 43 51 57 64 71 79 87 96
Tassel 3 5 7 9 13 17 21 26 31 36 42 48 55 62 68 75 83 91 100
Silked 3 5 7 9 12 16 20 24 29 34 39 45 51 58 65 72 80 88 97
Silks brown
2 4 6 8 11 15 18 22 27 31 36 41 47 54 60 66 74 81 90
Pre-blister
2 3 5 7 10 13 16 20 24 28 32 37 43 49 54 60 66 73 81
Blister 2 3 5 7 10 13 16 19 22 26 30 34 39 45 50 55 60 66 73
Early milk 2 3 4 6 8 11 14 17 20 24 28 32 36 41 45 50 55 60 66
Milk 1 2 3 5 7 9 12 15 18 21 24 28 32 37 41 45 49 54 59
Late milk 1 2 3 4 6 8 10 12 15 18 21 24 28 32 35 38 42 46 50
Soft dough
1 1 2 2 4 6 8 10 12 14 17 20 23 26 29 32 35 38 41
Early dent 0 0 1 1 2 3 5 7 9 11 13 15 18 21 23 25 27 29 32
Late dent 0 0 0 0 1 2 3 4 5 6 7 8 9 10 11 12 13 14 15
Mature 0 0 0 0 0 0 0 0 0 0 0 0 0 0 0 0 0 0 0
Adapted from the National Crop Insurance Services Corn Loss Instruction (Rev. 1994). Used with permission.
1 As determined by counting leaves using the leaf-over method (i.e., those with 40%–50% of leaf exposed from whorl and whose tip points below the horizontal).
38
Agronomy guide for field Crops

DroughtThe corn crop requires approximately 50 cm (20 in.) of water to produce high yields. This can be supplied over the growing season from a combination of stored water in the soil, rainfall or irrigation.
Lack of water causes the leaves to wilt and turn a greyish colour (Photo 1–13). Corn is most susceptible to dry conditions during the tasselling-to-silking stage and may experience yield loss if under stress at this time. During the later vegetative stages of growth (V8–V14), the plant may benefit from dry conditions, as it forces the more rapid downward growth of the roots. Drought conditions during silking can reduce pollination and a lack of silk emergence, while drought after silking may cause a reduction in grain fill.
Photo 1–13. Moisture deficiency or drought stress is most critical during tasseling-to-silking stages.
Bird DamageBirds can damage emerging seedlings. However, the more serious bird damage occurs to grain in August and September (Photo 1–14). Birds eat the kernels off the cob causing direct yield loss. Kernel damage may result in mould growth. Birds can also damage the ear while searching for ear feeding insects like western bean cutworm. Bird damage can be easily confused with seedling damage caused by black cutworms or ear damage caused by grasshoppers. Noisemakers, propane cannons, exploding shotgun shells, the Phoenix Wailer and recordings of bird distress calls may be successful deterrents if more than one technique is used and their pattern is changed frequently. If crop damage due to birds or wildlife is substantial, contact your local Ministry of Natural Resources and Forestry (MNRF) office for control options.
Photo 1–14. Bird damage on corn ears.
39
1. corn