Embed Size (px)
Citation preview

Agronomic Innovations for Sustainable High Row Crop
Productivity
Kendall R. LamkeyDepartment of Agronomy
Iowa State University

The Five Factors
1. Energy2. Erosion3. Nutrient Management (Water Quality)4. Carbon (Organic Matter)5. Climate Change
THE PROBLEMSCorn-Corn and Corn-Soybean Rotations
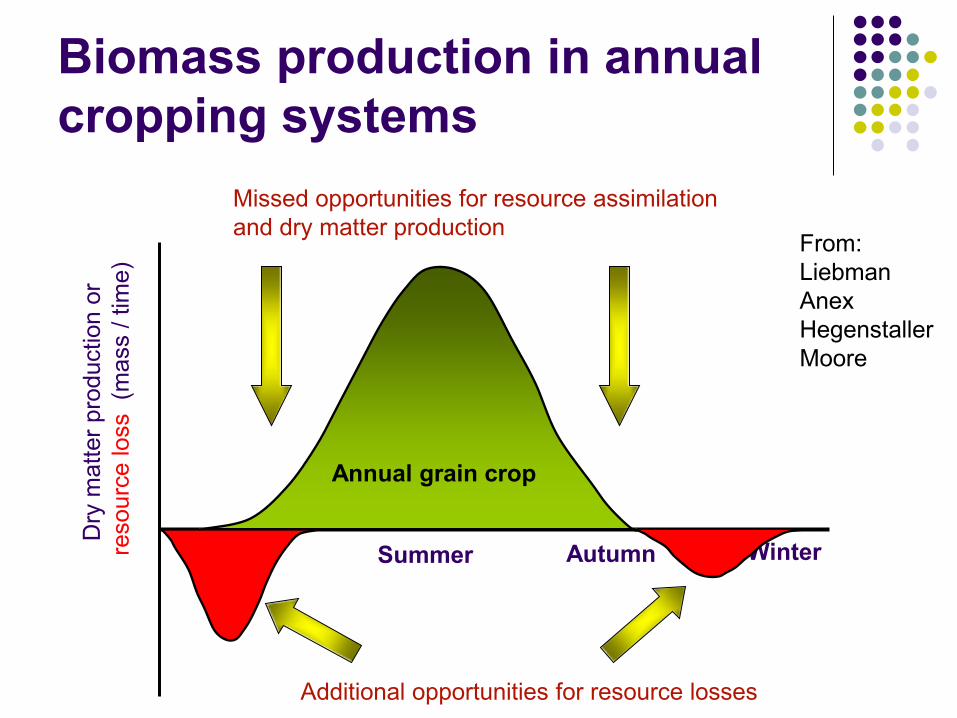
Biomass production in annual cropping systems
Summer Autumn
Dry
mat
ter p
rodu
ctio
n (m
ass
/ tim
e)
Annual grain crop
Spring Winter
Missed opportunities for resource assimilation and dry matter production
Additional opportunities for resource losses
Dry
mat
ter p
rodu
ctio
n or
re
sour
ce lo
ss(m
ass
/ tim
e)
From:LiebmanAnexHegenstallerMoore
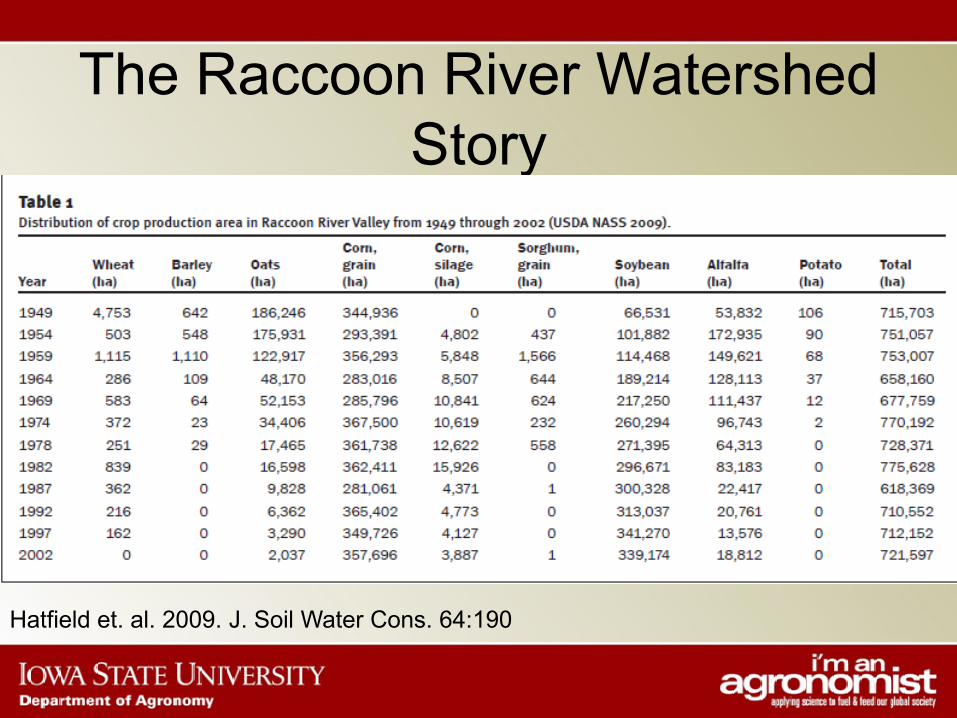
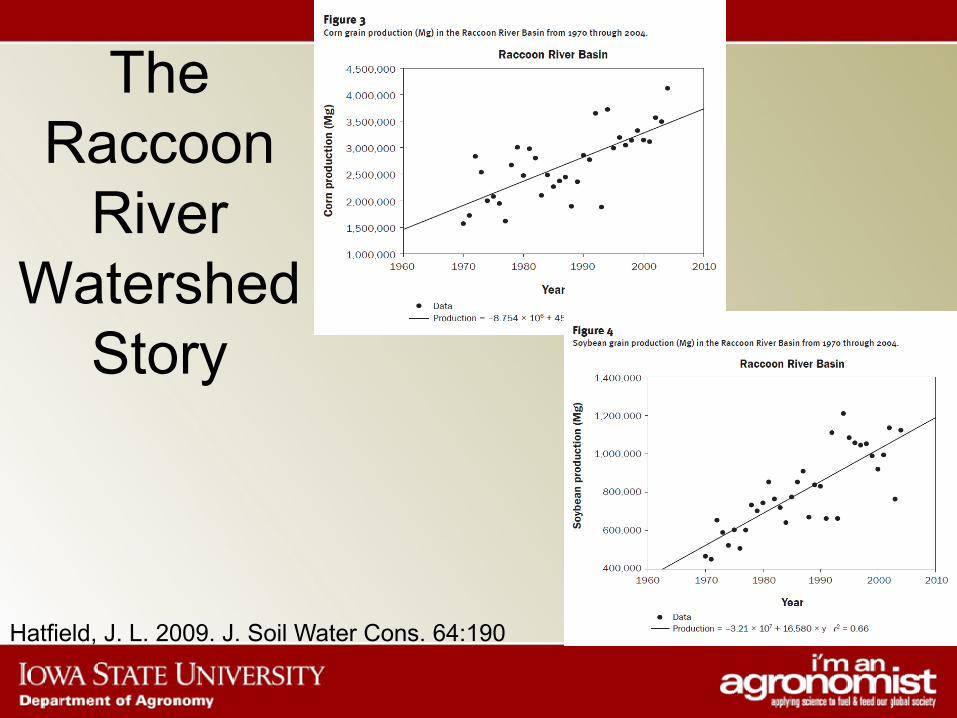
The Raccoon River Watershed Story
Hatfield et. al. 2009. J. Soil Water Cons. 64:190
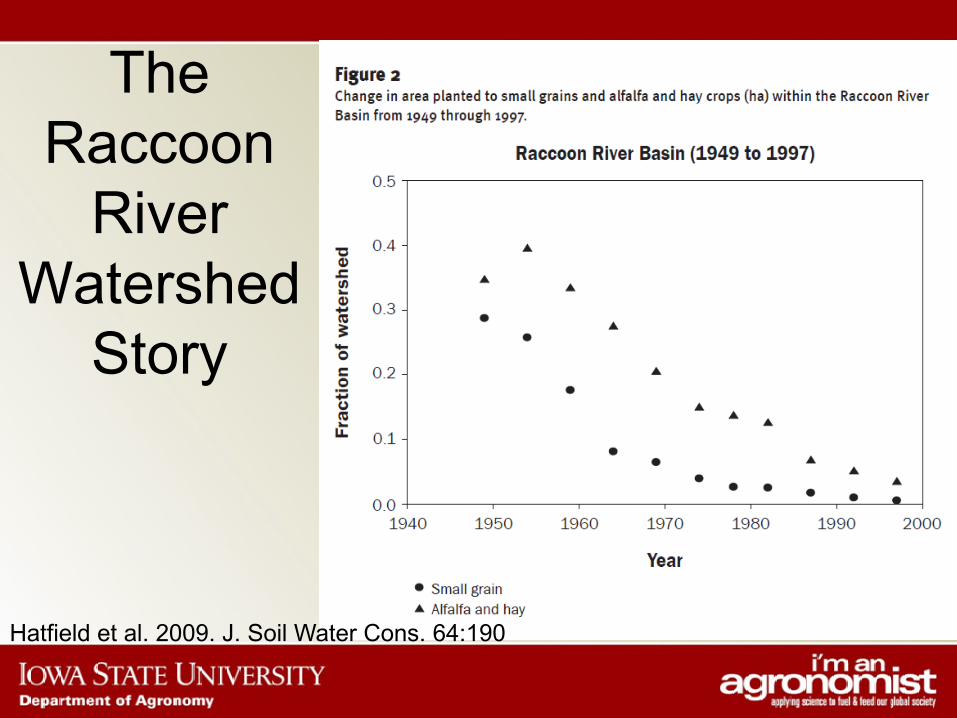
The Raccoon
River Watershed
Story
Hatfield et al. 2009. J. Soil Water Cons. 64:190
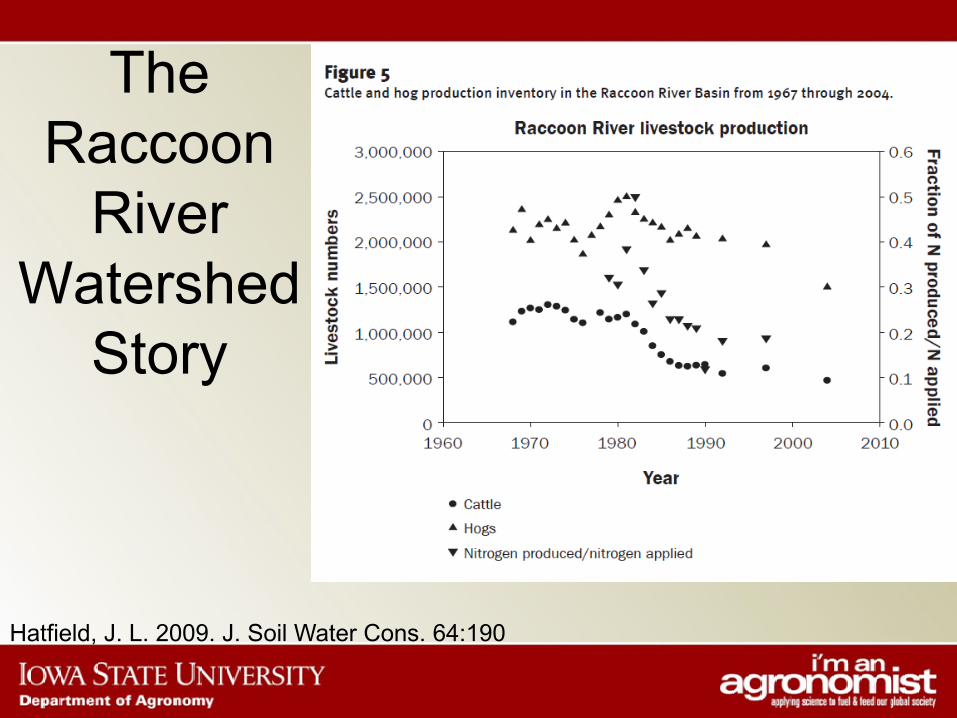
The Raccoon
River Watershed
Story
Hatfield, J. L. 2009. J. Soil Water Cons. 64:190
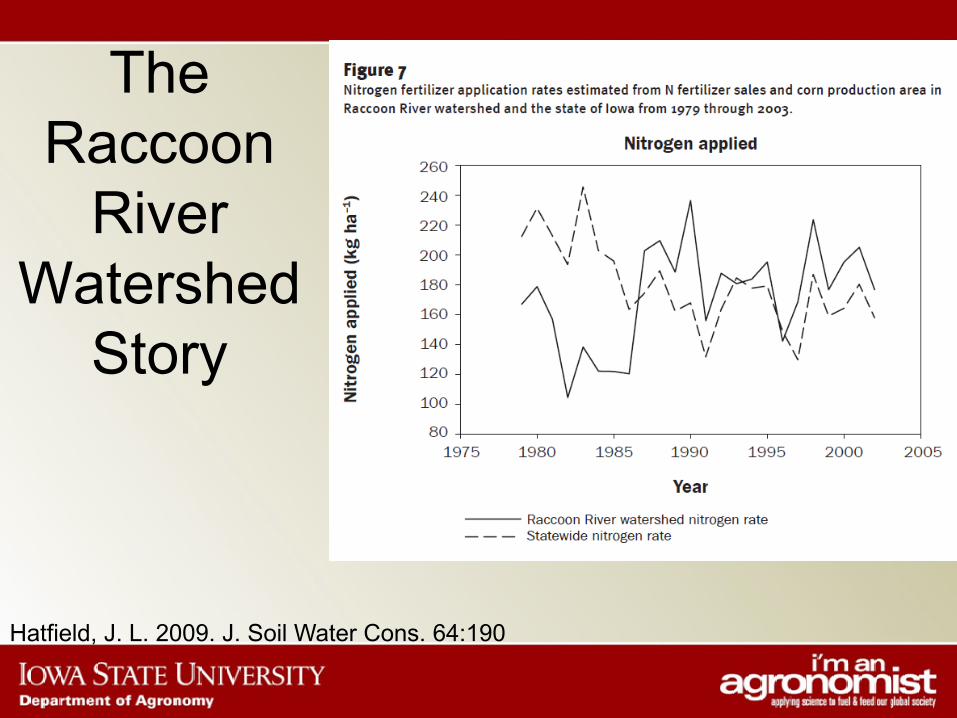
The Raccoon
River Watershed
Story
Hatfield, J. L. 2009. J. Soil Water Cons. 64:190
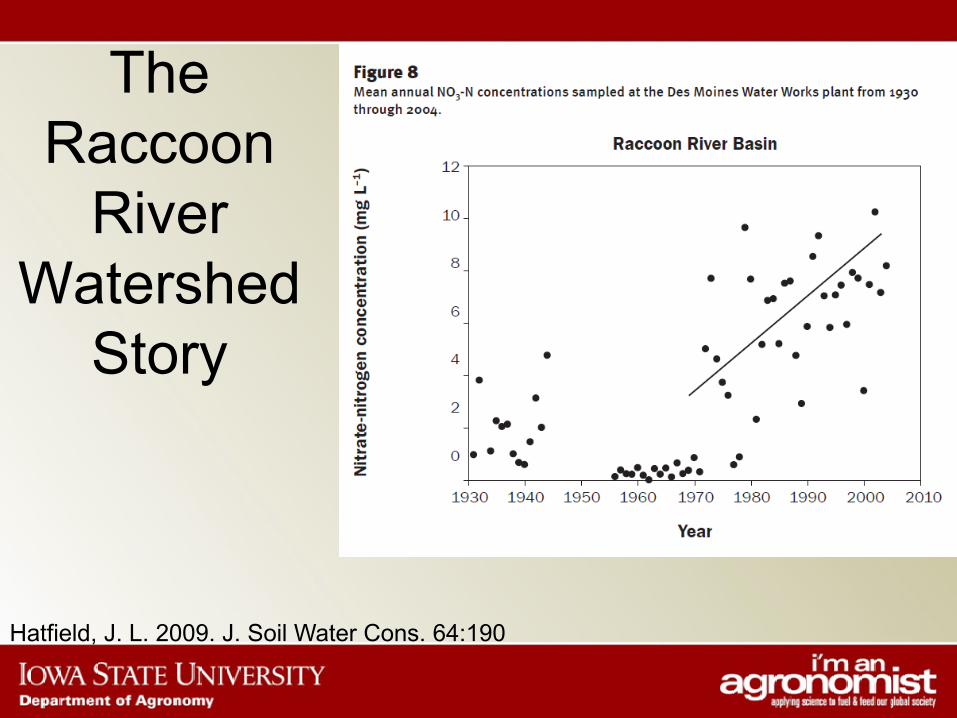
The Raccoon
River Watershed
Story
Hatfield, J. L. 2009. J. Soil Water Cons. 64:190
The Raccoon
River Watershed
Story
Hatfield, J. L. 2009. J. Soil Water Cons. 64:190
0
5
10
15
20
Nitra
te-N
(m
g/l)
1/4/
005/
30/0
07/
21/0
012
/4/0
02/
8/01
4/6/
015/
10/0
16/
5/01
7/2/
018/
21/0
112
/12/
011/
15/0
22/
25/0
24/
10/0
25/
14/0
26/
6/02
6/26
/02
8/27
/02
10/2
9/02
12/1
1/02
1/15
/03
2/20
/03
4/16
/03
5/14
/03
6/9/
03
6/30
/03
7/20
/03
8/22
/03
10/1
0/03
12/1
/03
1/23
/04
3/9/
044/
6/04
5/4/
046/
2/04
6/30
/04
7/29
/04
12/1
3/04
3/4/
054/
19/0
55/
17/0
56/
15/0
57/
15/0
58/
26/0
510
/14/
0512
/2/0
51/
25/0
63/
3/06
3/31
/06
5/2/
06
Date
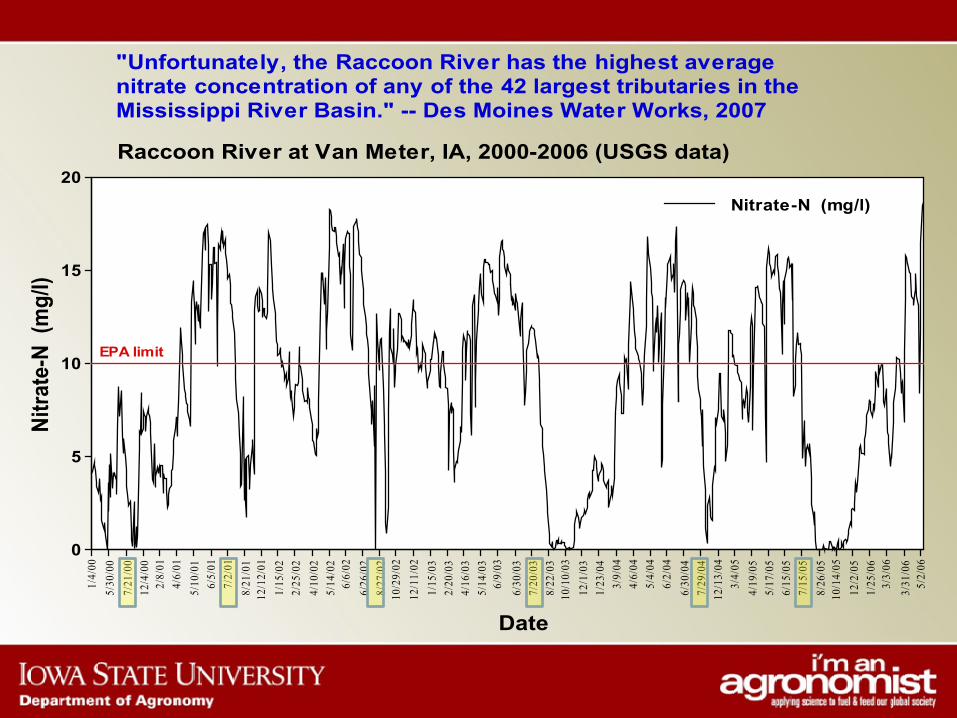
Raccoon River at Van Meter, IA, 2000-2006 (USGS data)
Nitrate-N (mg/l)
"Unfortunately, the Raccoon River has the highest averagenitrate concentration of any of the 42 largest tributaries in theMississippi River Basin." -- Des Moines Water Works, 2007
EPA limit
Why is this important?
In, 1991 the Des Moines Water Works (DMWW) constructed the world’s largest ion exchange nitrate removal facility
Hatfield, J. L. 2009. J. Soil Water Cons. 64:190

THE PROBLEMSNutrient Management
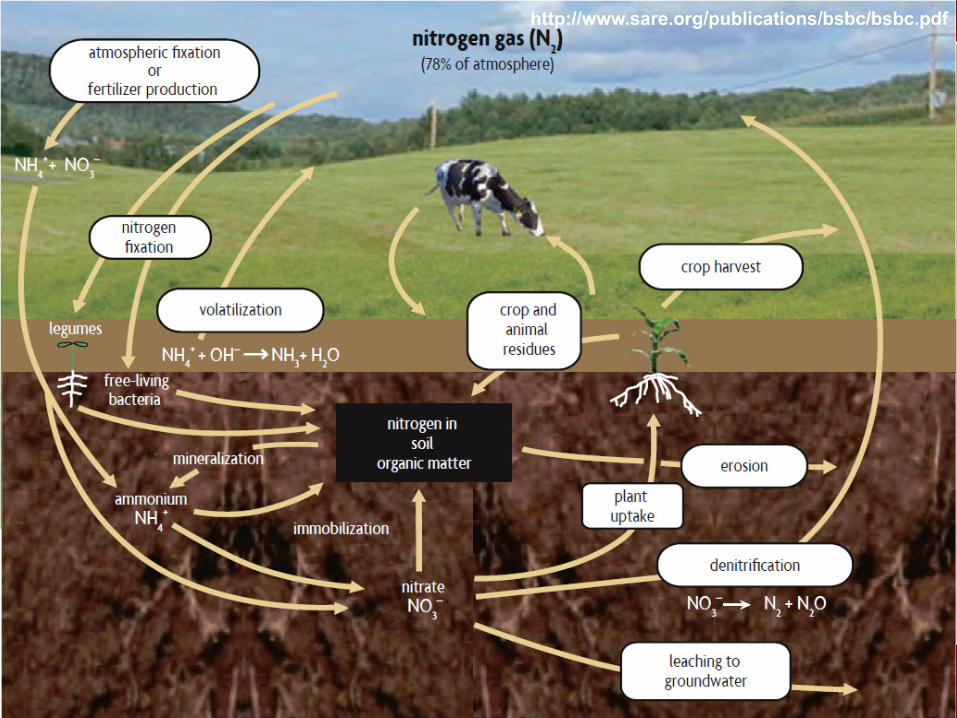
http://www.sare.org/publications/bsbc/bsbc.pdf
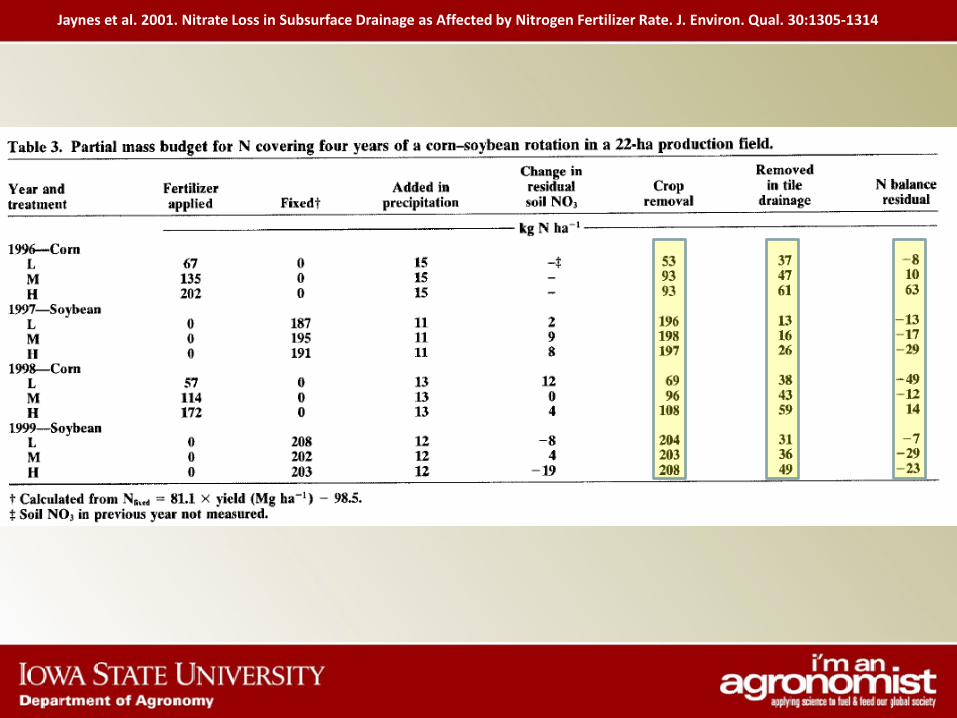
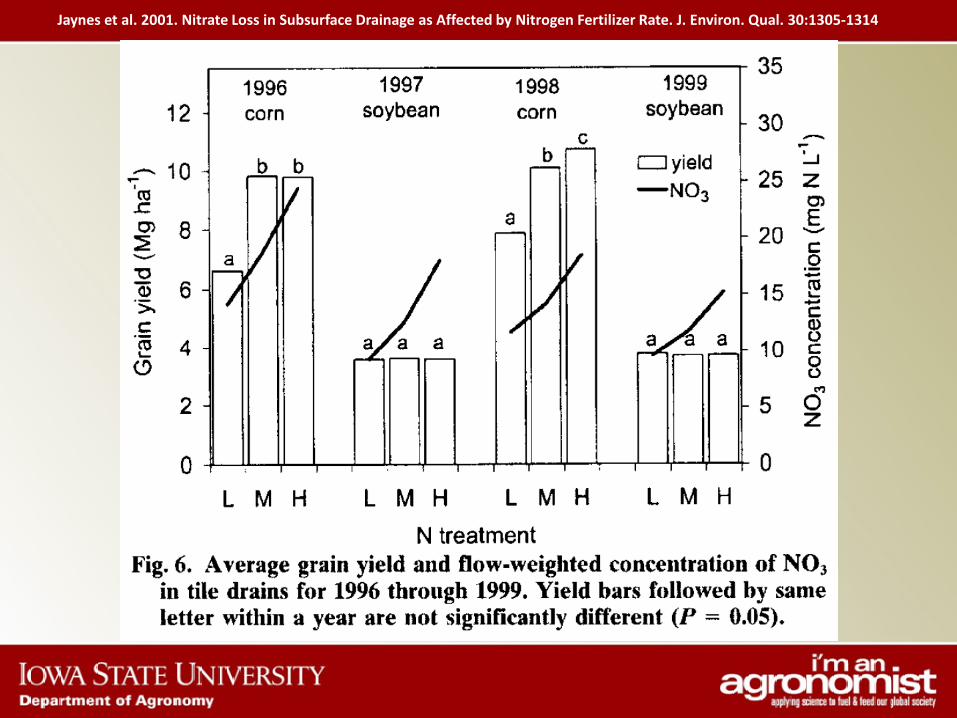
Jaynes et al. 2001. Nitrate Loss in Subsurface Drainage as Affected by Nitrogen Fertilizer Rate. J. Environ. Qual. 30:1305-1314
Jaynes et al. 2001. Nitrate Loss in Subsurface Drainage as Affected by Nitrogen Fertilizer Rate. J. Environ. Qual. 30:1305-1314
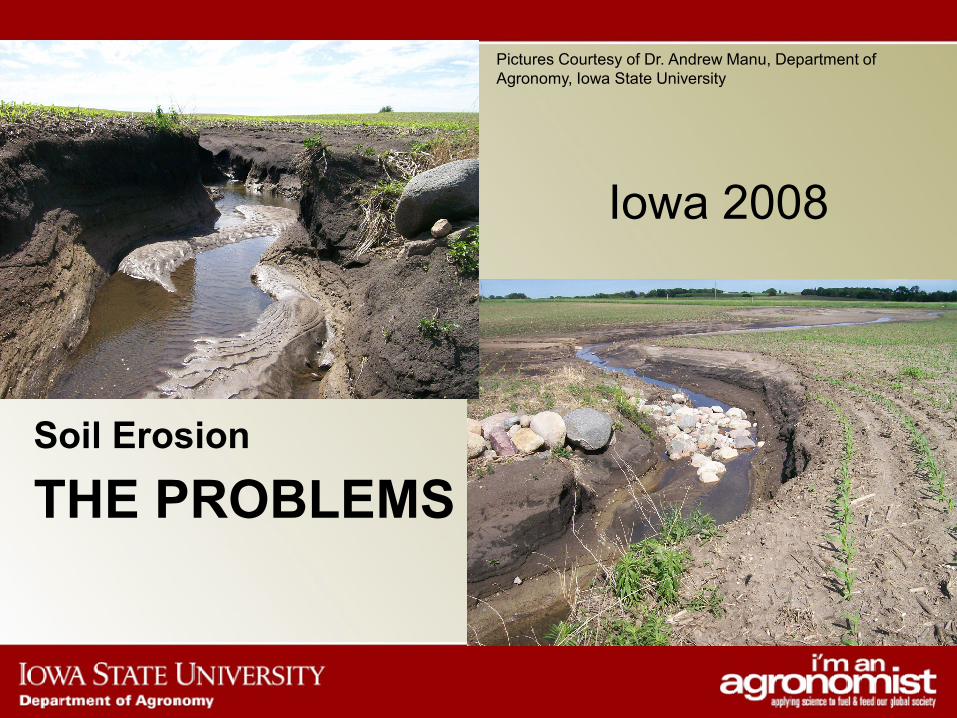
THE PROBLEMSSoil Erosion
Pictures Courtesy of Dr. Andrew Manu, Department of Agronomy, Iowa State University
Iowa 2008
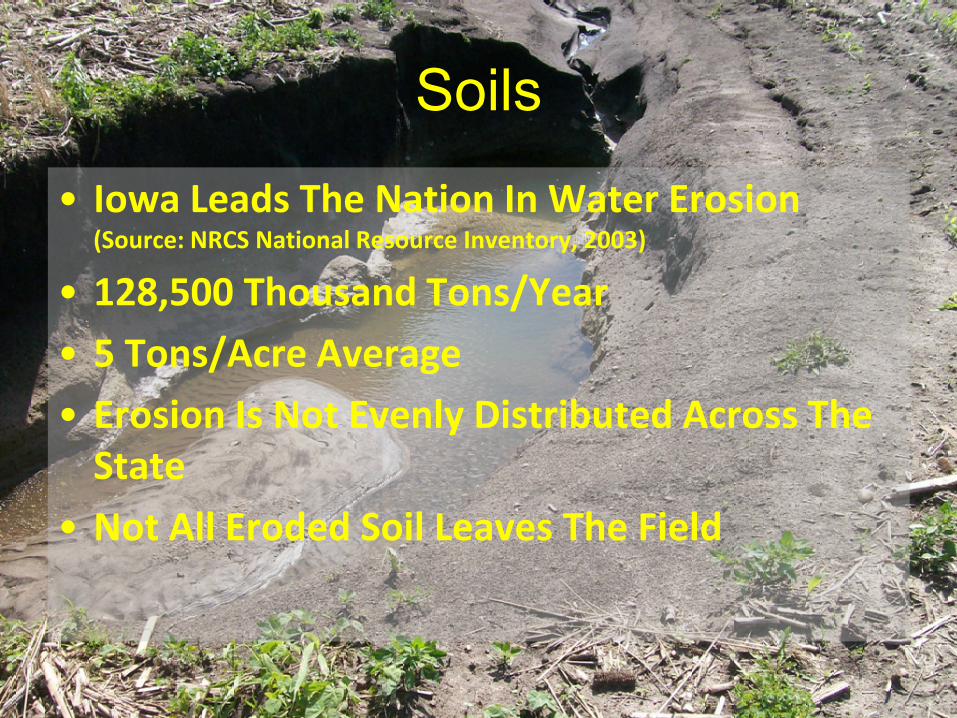
Soils
• Iowa Leads The Nation In Water Erosion (Source: NRCS National Resource Inventory, 2003)
• 128,500 Thousand Tons/Year• 5 Tons/Acre Average• Erosion Is Not Evenly Distributed Across The
State• Not All Eroded Soil Leaves The Field
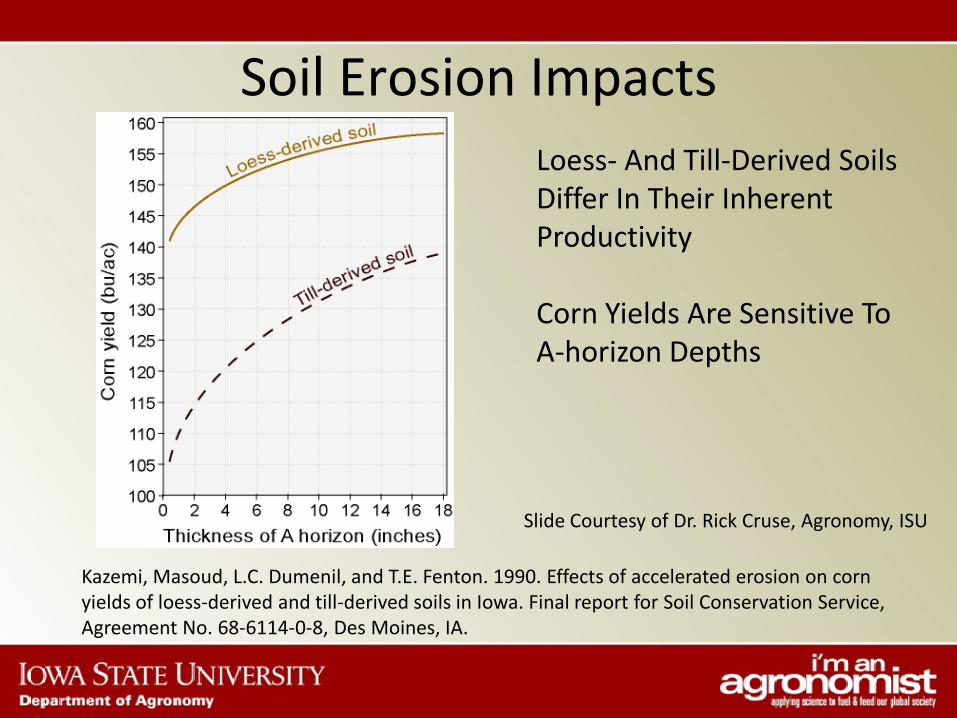
Soil Erosion Impacts
Kazemi, Masoud, L.C. Dumenil, and T.E. Fenton. 1990. Effects of accelerated erosion on corn yields of loess-derived and till-derived soils in Iowa. Final report for Soil Conservation Service, Agreement No. 68-6114-0-8, Des Moines, IA.
Loess- And Till-Derived Soils Differ In Their Inherent Productivity
Corn Yields Are Sensitive To A-horizon Depths
Slide Courtesy of Dr. Rick Cruse, Agronomy, ISU
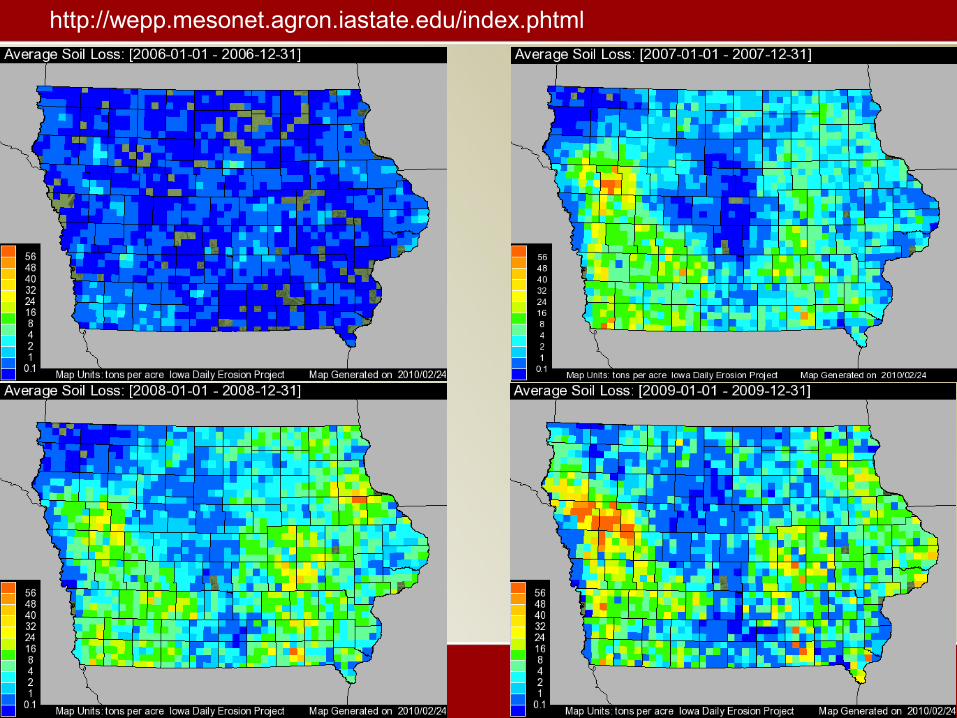
Iowa Daily Erosion Project
http://wepp.mesonet.agron.iastate.edu/index.phtml

THE PROBLEMSClimate Change
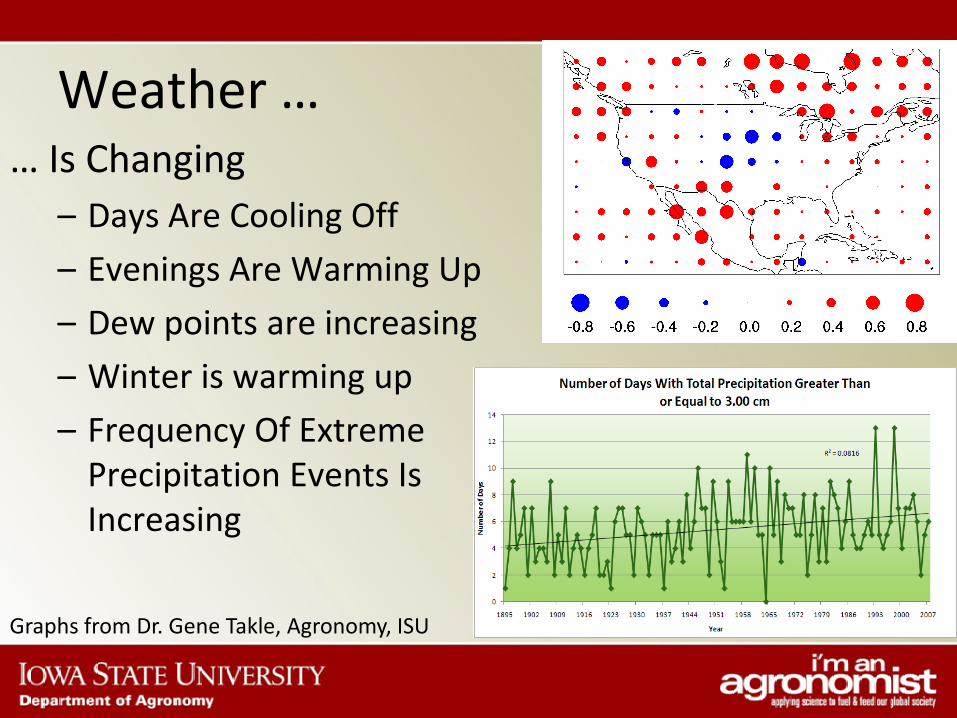
Weather …… Is Changing
– Days Are Cooling Off– Evenings Are Warming Up– Dew points are increasing– Winter is warming up– Frequency Of Extreme
Precipitation Events Is Increasing
Graphs from Dr. Gene Takle, Agronomy, ISU

The Good News Is …
There are solutions …
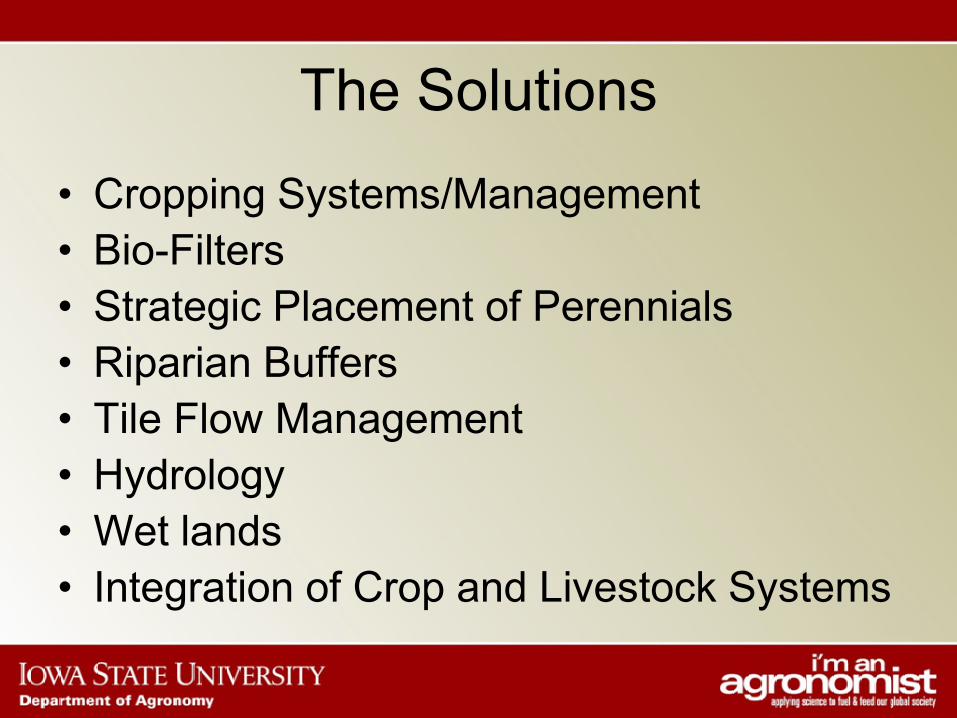
The Solutions
• Cropping Systems/Management• Bio-Filters• Strategic Placement of Perennials• Riparian Buffers• Tile Flow Management• Hydrology• Wet lands• Integration of Crop and Livestock Systems

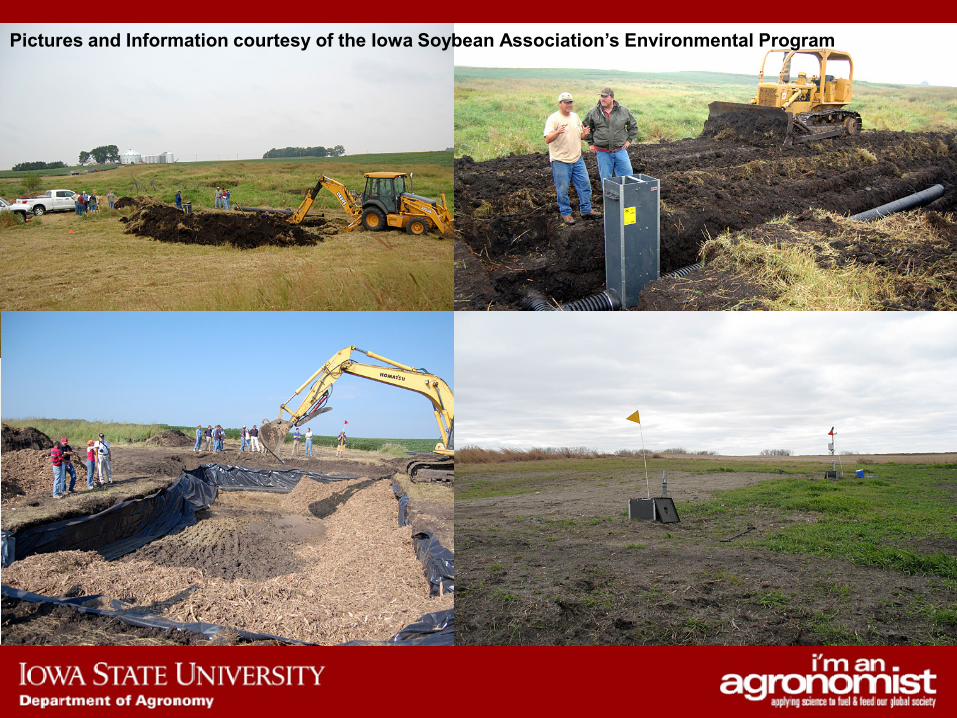
THE SOLUTIONSBio-Reactors
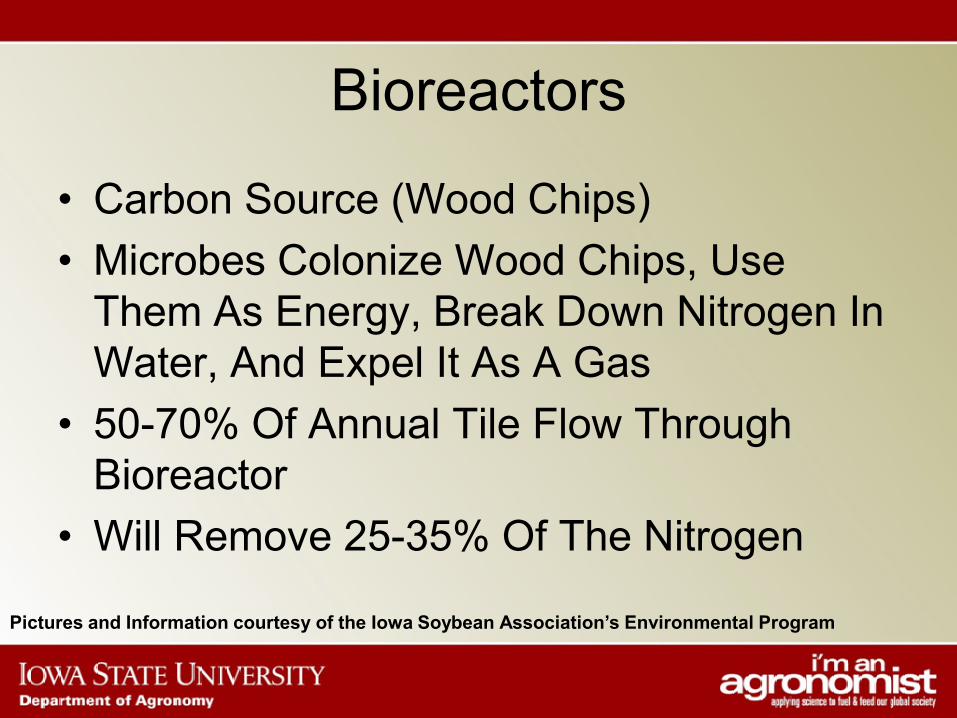
Bioreactors
• Carbon Source (Wood Chips)• Microbes Colonize Wood Chips, Use
Them As Energy, Break Down Nitrogen In Water, And Expel It As A Gas
• 50-70% Of Annual Tile Flow Through Bioreactor
• Will Remove 25-35% Of The Nitrogen
Pictures and Information courtesy of the Iowa Soybean Association’s Environmental Program
Pictures and Information courtesy of the Iowa Soybean Association’s Environmental Program

THE SOLUTIONSStrategic Placement of Perennials
Biocomplexity of Integrated Perennial-Annual Agroecosystems
Dr. Heidi Asbjornsen (ISU-NREM)
Dr. Matt Helmers (ISU-ABE)
Dr. Matt Liebman (ISU-Agronomy)
Dr. Matt O’Neal (ISU-Entomology)
Dr. Lisa Schulte (ISU-NREM)
Dr. Nancy Grudens-Schuck (ISU-Agricultural Education)
Dr. Rick Cruse (ISU-Agronomy and Director of the Iowa Water Center)
Pauline Drobney (Land Management and Research Demonstration Biologist, Neal Smith National Wildlife Refuge)
Dr. Randy Kolka (U.S. Forest Service)
Dr. Mark Tomer (USDA-ARS)
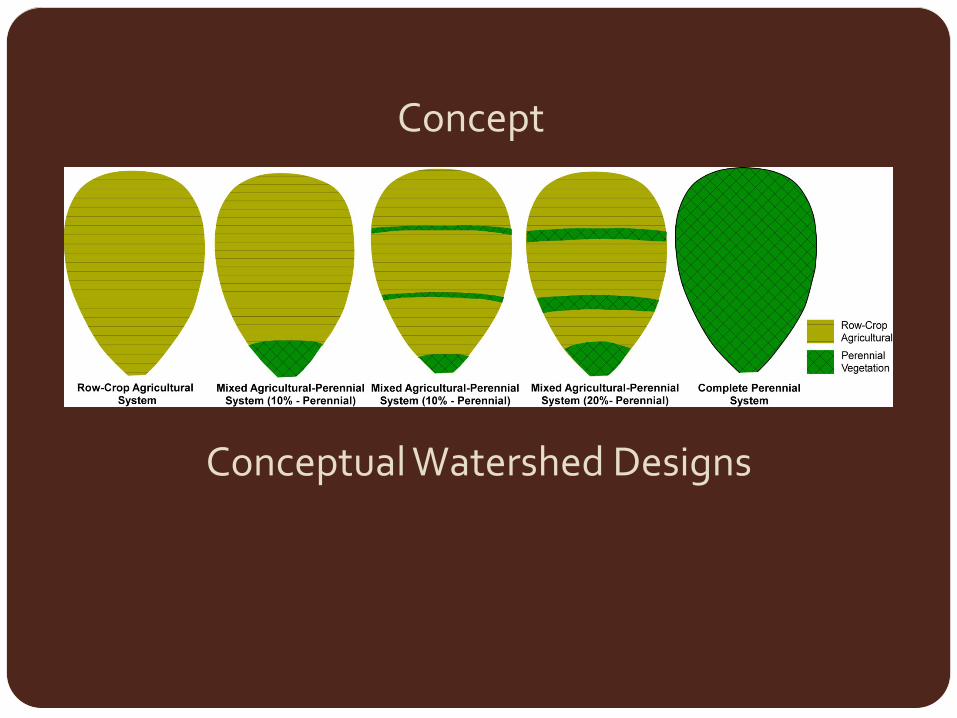
Concept
Conceptual Watershed Designs
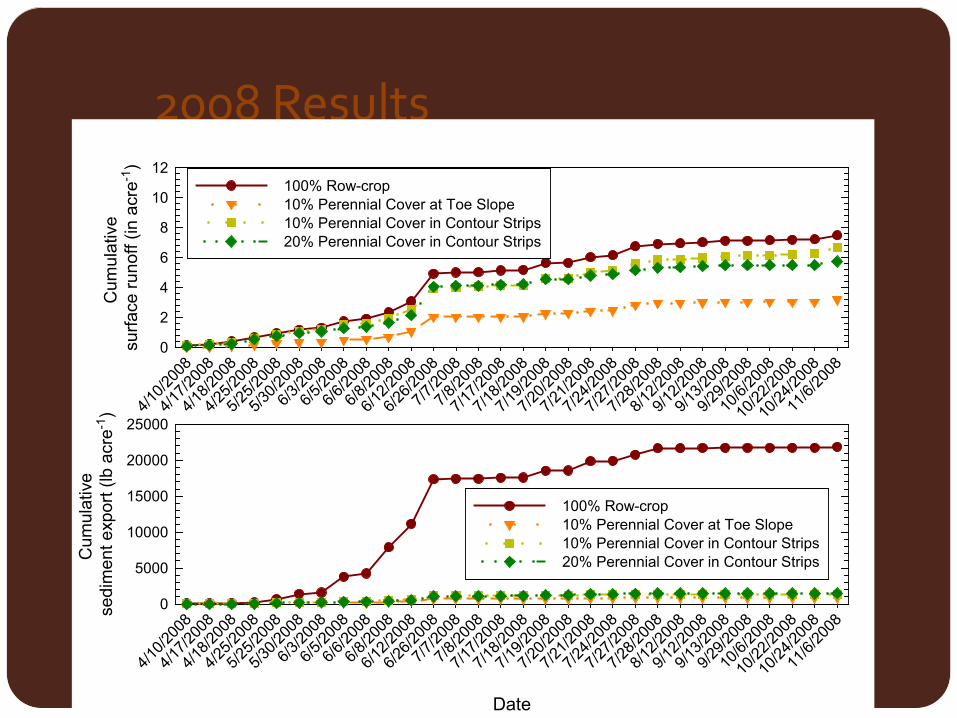
2008 Results
4/10/2
008
4/17/2
008
4/18/2
008
4/25/2
008
5/25/2
008
5/30/2
008
6/3/20
08
6/5/20
08
6/6/20
08
6/8/20
08
6/12/2
008
6/26/2
008
7/7/20
08
7/8/20
08
7/17/2
008
7/18/2
008
7/19/2
008
7/20/2
008
7/21/2
008
7/24/2
008
7/27/2
008
7/28/2
008
8/12/2
008
9/12/2
008
9/13/2
008
9/29/2
008
10/6/
2008
10/22
/2008
10/24
/2008
11/6/
2008
Cum
ulat
ive
surfa
ce ru
noff
(in a
cre-1
)
0
2
4
6
8
10
12100% Row-crop10% Perennial Cover at Toe Slope10% Perennial Cover in Contour Strips20% Perennial Cover in Contour Strips
Date
4/10/2
008
4/17/2
008
4/18/2
008
4/25/2
008
5/25/2
008
5/30/2
008
6/3/20
08
6/5/20
08
6/6/20
08
6/8/20
08
6/12/2
008
6/26/2
008
7/7/20
08
7/8/20
08
7/17/2
008
7/18/2
008
7/19/2
008
7/20/2
008
7/21/2
008
7/24/2
008
7/27/2
008
7/28/2
008
8/12/2
008
9/12/2
008
9/13/2
008
9/29/2
008
10/6/
2008
10/22
/2008
10/24
/2008
11/6/
2008
Cum
ulat
ive
sedi
men
t exp
ort (
lb a
cre-1
)
0
5000
10000
15000
20000
25000
100% Row-crop10% Perennial Cover at Toe Slope10% Perennial Cover in Contour Strips20% Perennial Cover in Contour Strips
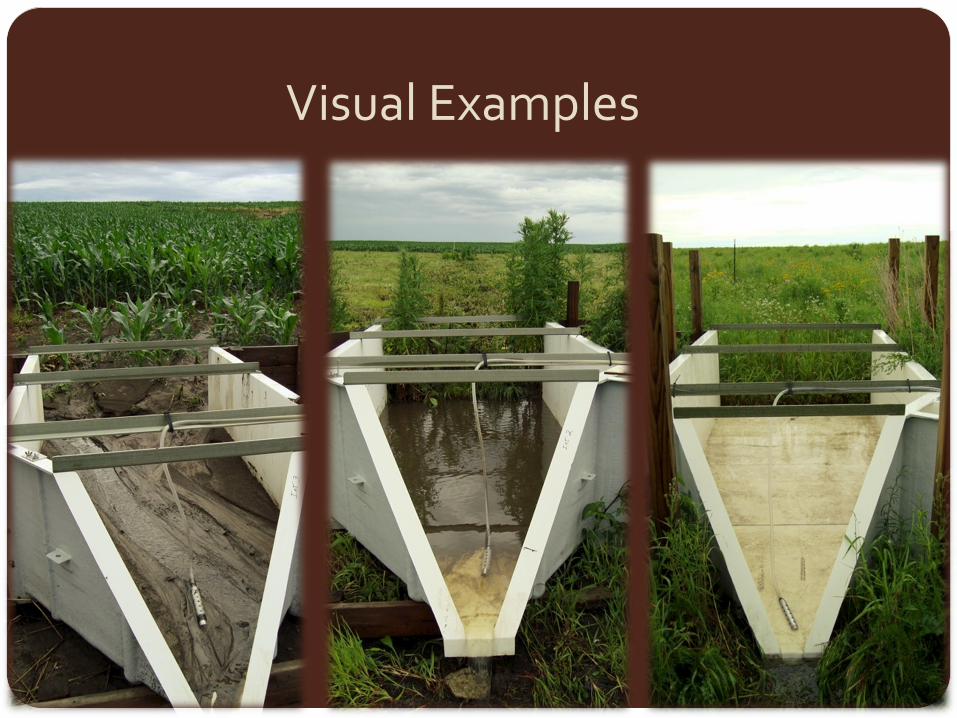
Visual Examples

THE SOLUTIONSCropping Systems
Team Members: Ken Moore, Professor, ISU Agronomy Kendall Lamkey, Professor, ISU Agronomy Jeremy Singer, Research Agronomist, USDA-ARS NSTL Roger Hintz, Assistant Scientist, ISU Agronomy Keith Kohler, Research Technician, USDA-ARS NSTL Scott Flynn, Graduate Research Assistant, ISU Agronomy
Collaborators: Darren D. Goebel, John Deere & Company Mike Edgerton, Monsanto
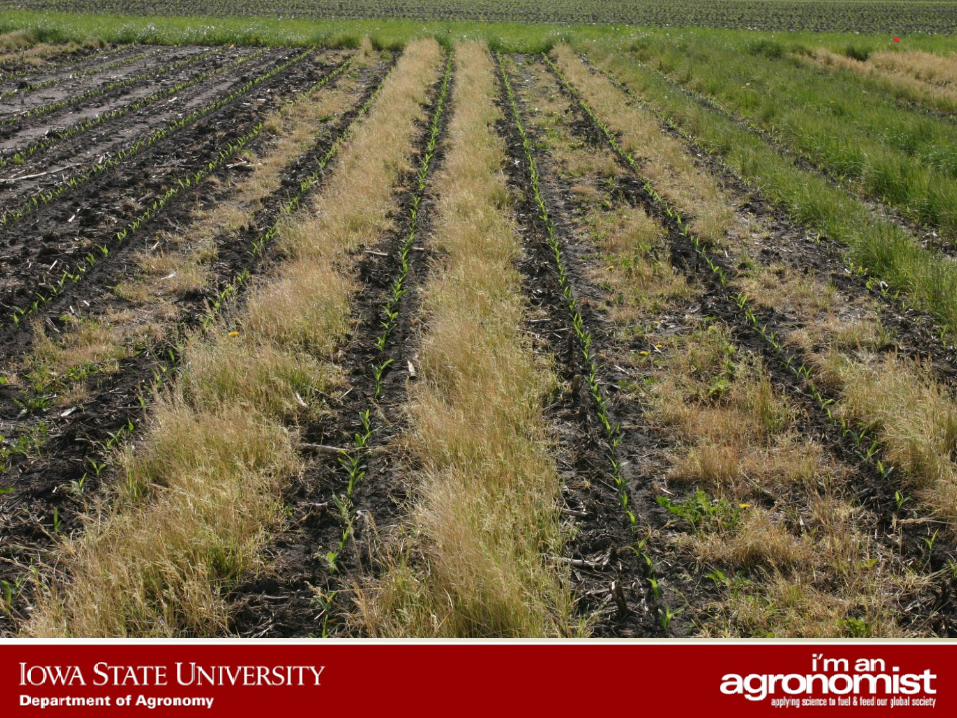
Perennial Cover Crops Sustainable Cropping Systems for Harvesting Corn Stover for Biomass
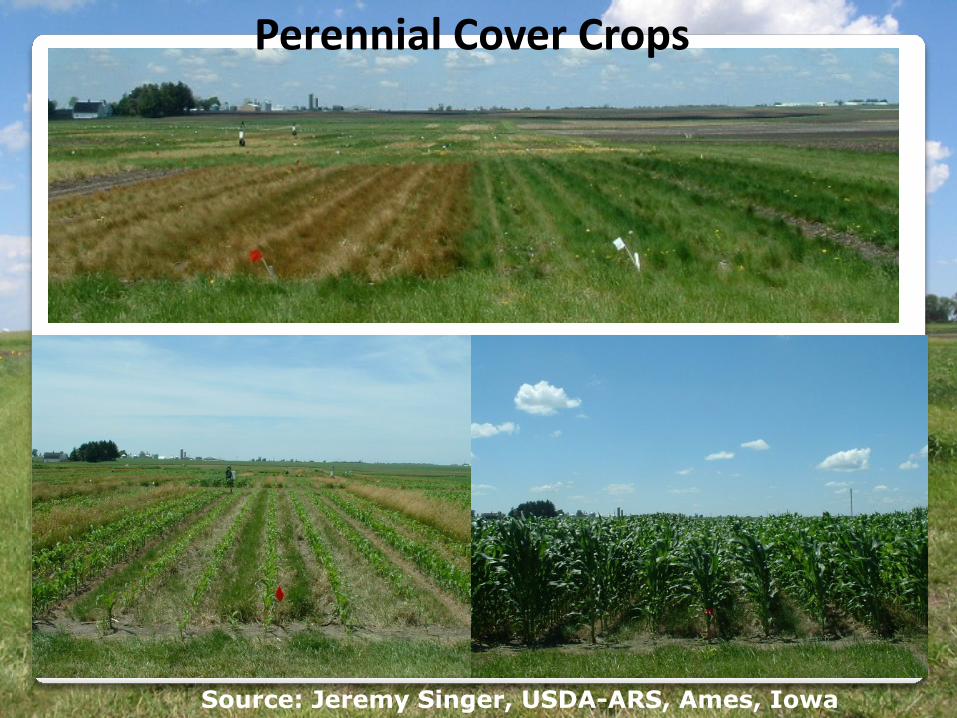
Source: Jeremy Singer, USDA-ARS, Ames, Iowa
Perennial Cover Crops
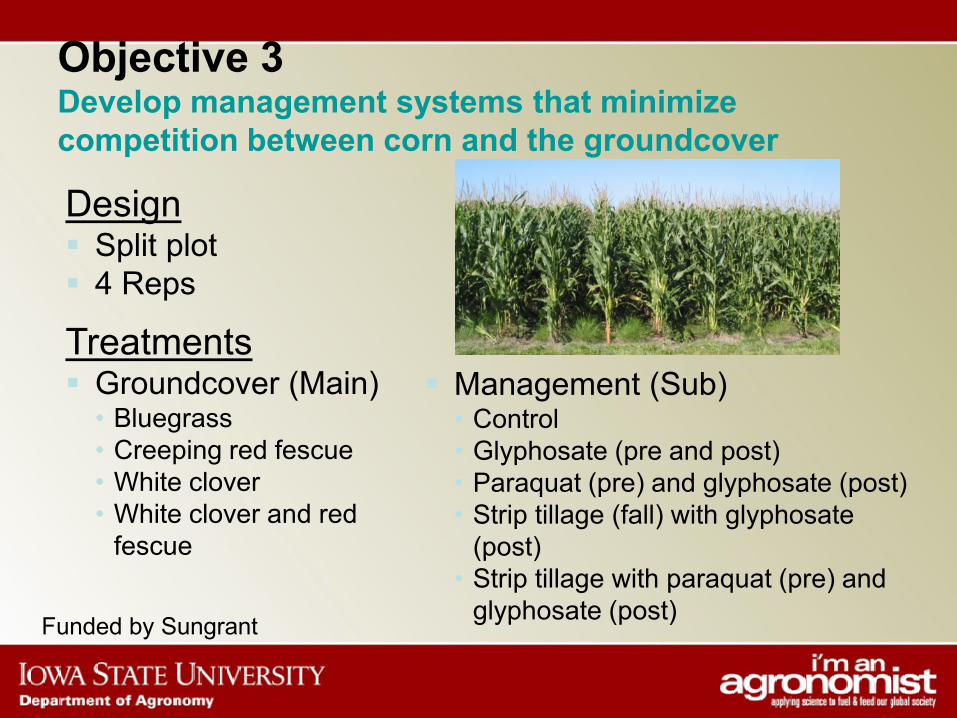
Design Split plot 4 Reps
Treatments Groundcover (Main)
• Bluegrass• Creeping red fescue• White clover• White clover and red
fescue
Objective 3 Develop management systems that minimize competition between corn and the groundcover
Management (Sub)• Control• Glyphosate (pre and post)• Paraquat (pre) and glyphosate (post)• Strip tillage (fall) with glyphosate
(post)• Strip tillage with paraquat (pre) and
glyphosate (post)Funded by Sungrant
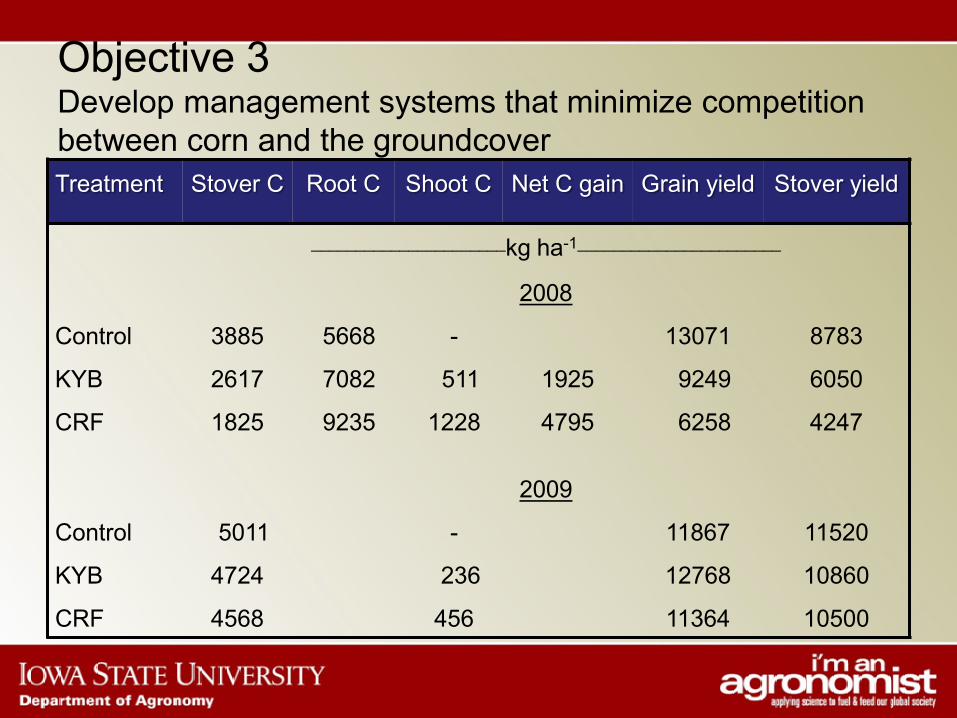
Treatment Stover C Root C Shoot C Net C gain Grain yield Stover yield
______________________kg ha-1_______________________
2008
Control 3885 5668 - 13071 8783
KYB 2617 7082 511 1925 9249 6050
CRF 1825 9235 1228 4795 6258 4247
2009
Control 5011 - 11867 11520
KYB 4724 236 12768 10860
CRF 4568 456 11364 10500
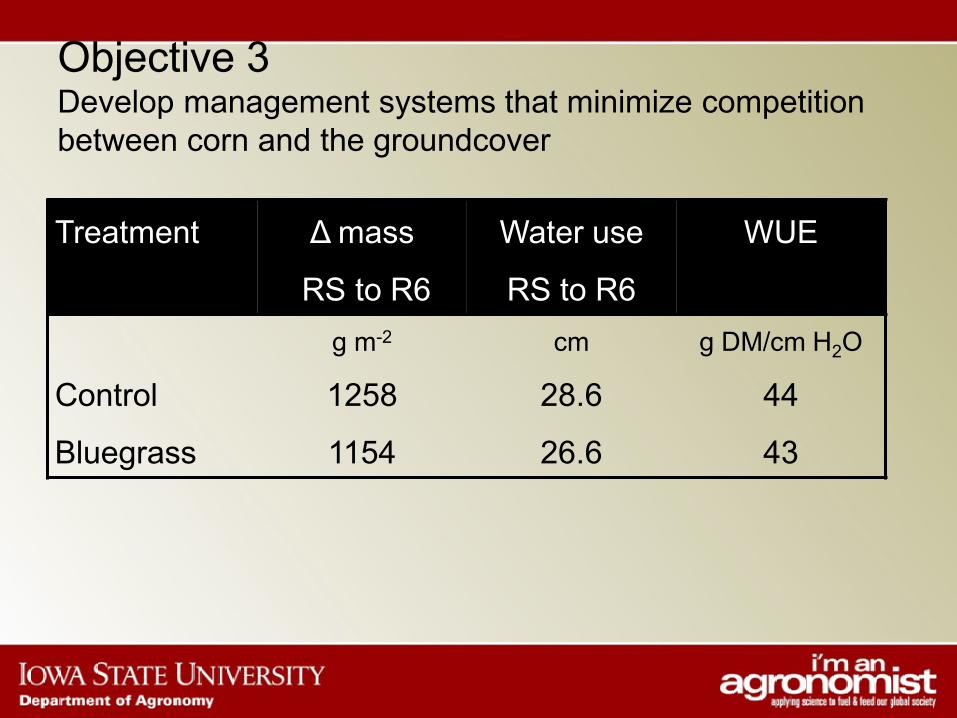
Objective 3 Develop management systems that minimize competition between corn and the groundcover
Objective 3 Develop management systems that minimize competition between corn and the groundcover
Treatment Δ mass
RS to R6
Water use
RS to R6
WUE
g m-2 cm g DM/cm H2O
Control 1258 28.6 44
Bluegrass 1154 26.6 43

THE SOLUTIONSWetlands

http://www.conservationinformation.org/pdf/CTIC_wetlands_02.pdf
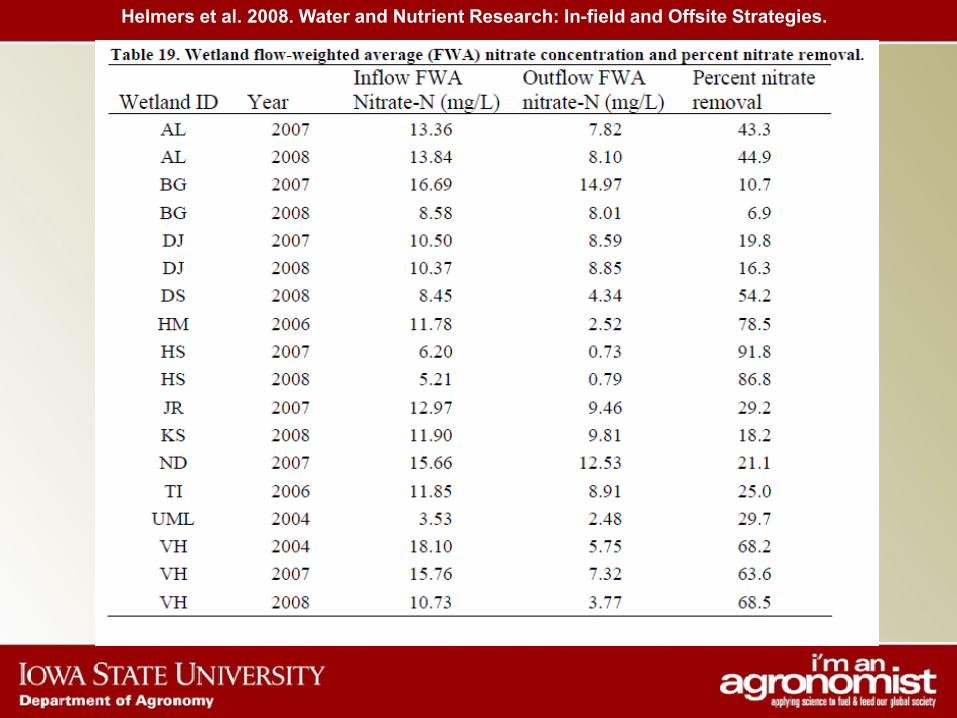
Helmers et al. 2008. Water and Nutrient Research: In-field and Offsite Strategies.

THE SOLUTIONSRiparian Buffers

Photo Courtesy ofDepartment of Natural Resource Ecology and ManagementIowa State UniversityPhoto by Tom Schultz
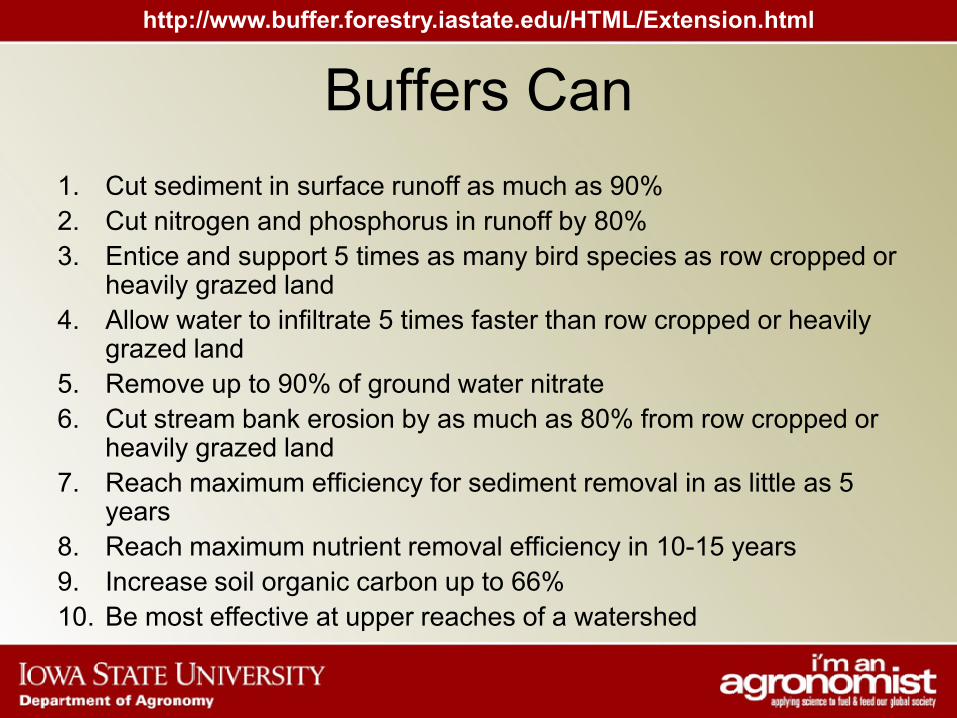
Buffers Can1. Cut sediment in surface runoff as much as 90%2. Cut nitrogen and phosphorus in runoff by 80%3. Entice and support 5 times as many bird species as row cropped or
heavily grazed land4. Allow water to infiltrate 5 times faster than row cropped or heavily
grazed land5. Remove up to 90% of ground water nitrate6. Cut stream bank erosion by as much as 80% from row cropped or
heavily grazed land7. Reach maximum efficiency for sediment removal in as little as 5
years8. Reach maximum nutrient removal efficiency in 10-15 years9. Increase soil organic carbon up to 66%10. Be most effective at upper reaches of a watershed
http://www.buffer.forestry.iastate.edu/HTML/Extension.html

Photo Courtesy ofDepartment of Natural Resource Ecology and ManagementIowa State UniversityPhoto by Tom Schultz

THE SOLUTIONSCrop – Livestock Integration
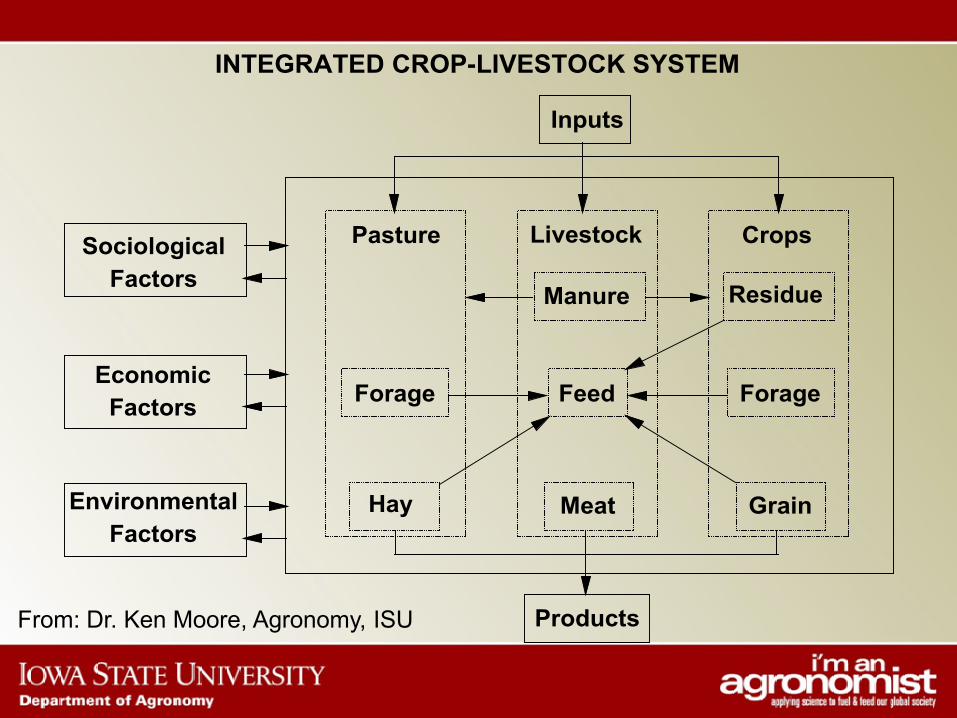
From: Dr. Ken Moore, Agronomy, ISU
Pasture
Feed
CropsLivestock
ForageForage
Grain
ResidueManure
Meat
Inputs
Products
EconomicFactors
SociologicalFactors
EnvironmentalFactors
INTEGRATED CROP-LIVESTOCK SYSTEM
Hay
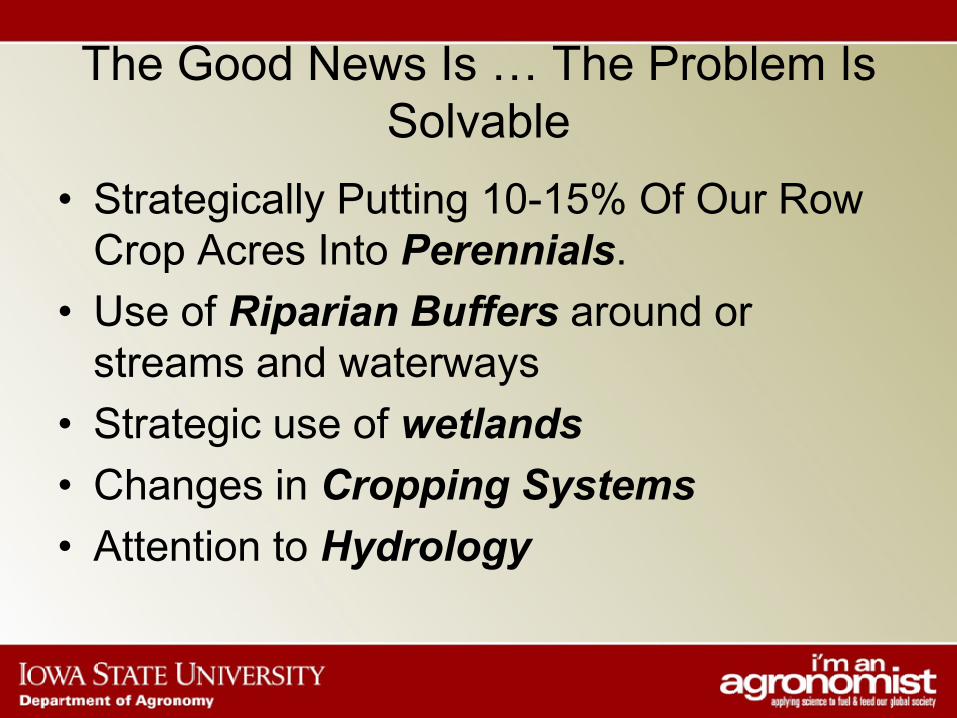
The Good News Is … The Problem Is Solvable
• Strategically Putting 10-15% Of Our Row Crop Acres Into Perennials.
• Use of Riparian Buffers around or streams and waterways
• Strategic use of wetlands• Changes in Cropping Systems• Attention to Hydrology
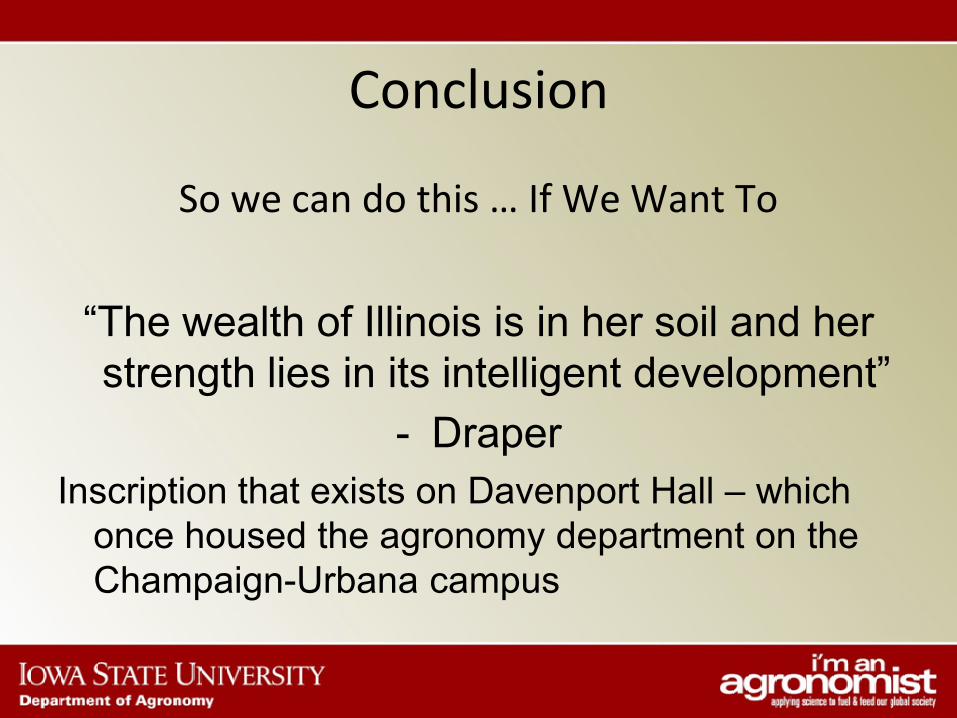
Conclusion
So we can do this … If We Want To
“The wealth of Illinois is in her soil and her strength lies in its intelligent development”
- DraperInscription that exists on Davenport Hall – which
once housed the agronomy department on the Champaign-Urbana campus


![Heterosis, genetic effects and value of F2s and doubled ... · related traits, in single-row micro-plots could be biased by effects of inter-row competition [15]; an acceptable agronomic](https://img.pdfslide.us/doc/110x75/6068a7d70f7f134f163a2583/heterosis-genetic-effects-and-value-of-f2s-and-doubled-related-traits-in-single-row.jpg)