Embed Size (px)
Citation preview

Agronomic & economic results of improved cassava management
(2017-18 & 2018-19)
Laothao Youbee1, Phanthasin Khanthavong2, Saythong Oudthachit2,
Siviengkhek Phommalath2, Jonathan Newby1, Imran Malik1

Introduction
Present the results of trials in 2017-19 and also 2018-19 Varieties
Fertiliser application
Intercropping
Agronomic results
Economic analysis
Observations and future plans
Implications of results will be presented tomorrow.

Varieties assessments

Variety assessment (2017-18)Fresh root yield (t ha-1) of 7 Cassava varieties in 3 Districts
Fresh Root yield
Starch content Starch yield
(t ha-1) (% fresh root weight) (t ha-1)
Rayong 11 25.91a 30.67a 7.9a
KM140 23.59 ab 23.54bcd 5.5b
Rayong 72 23.19 ab 23.60bcd 5.6ab
Local 22.58 ab 25.57bc 5.7ab
Rayong 9 22.19 ab 26.70b 6.3ab
KU50 20.12 ab 21.65d 4.7b
KM21-12 19.16 b 22.76cd 4.7b
Variety Kenethao Paklai ViengthongKM140 28.3 22.7 19.8KM21-12 21.5 25.3 10.7KU50 24.7 23.8 11.8Local 23.9 28.8 15.1Rayong 11 28.3 28.2 21.3Rayong 72 22.3 30.1 17.1Rayong 9 27 25.1 14.5
Rayong 11
Rayong 72
Farm gate prices do not consider starch content
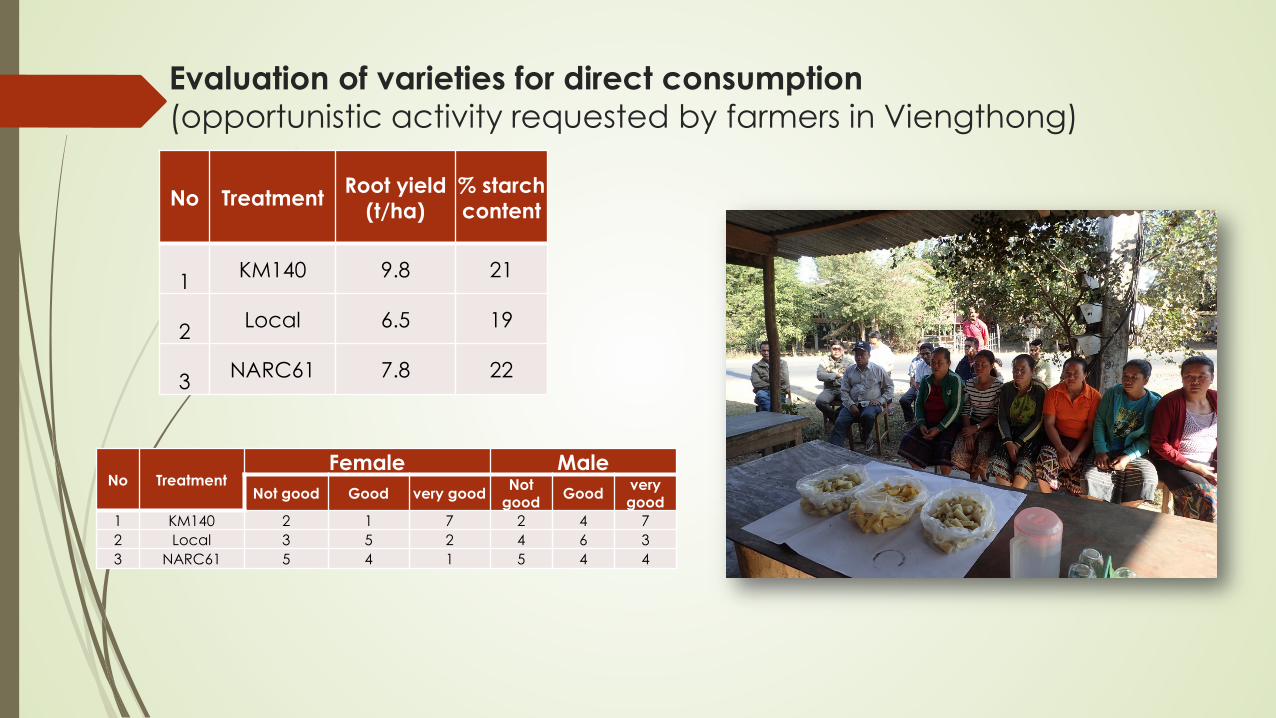
Evaluation of varieties for direct consumption(opportunistic activity requested by farmers in Viengthong)
No Treatment Root yield(t/ha)
% starchcontent
1 KM140 9.8 21
2 Local 6.5 19
3 NARC61 7.8 22
No TreatmentFemale Male
Not good Good very good Not good Good very
good1 KM140 2 1 7 2 4 72 Local 3 5 2 4 6 33 NARC61 5 4 1 5 4 4
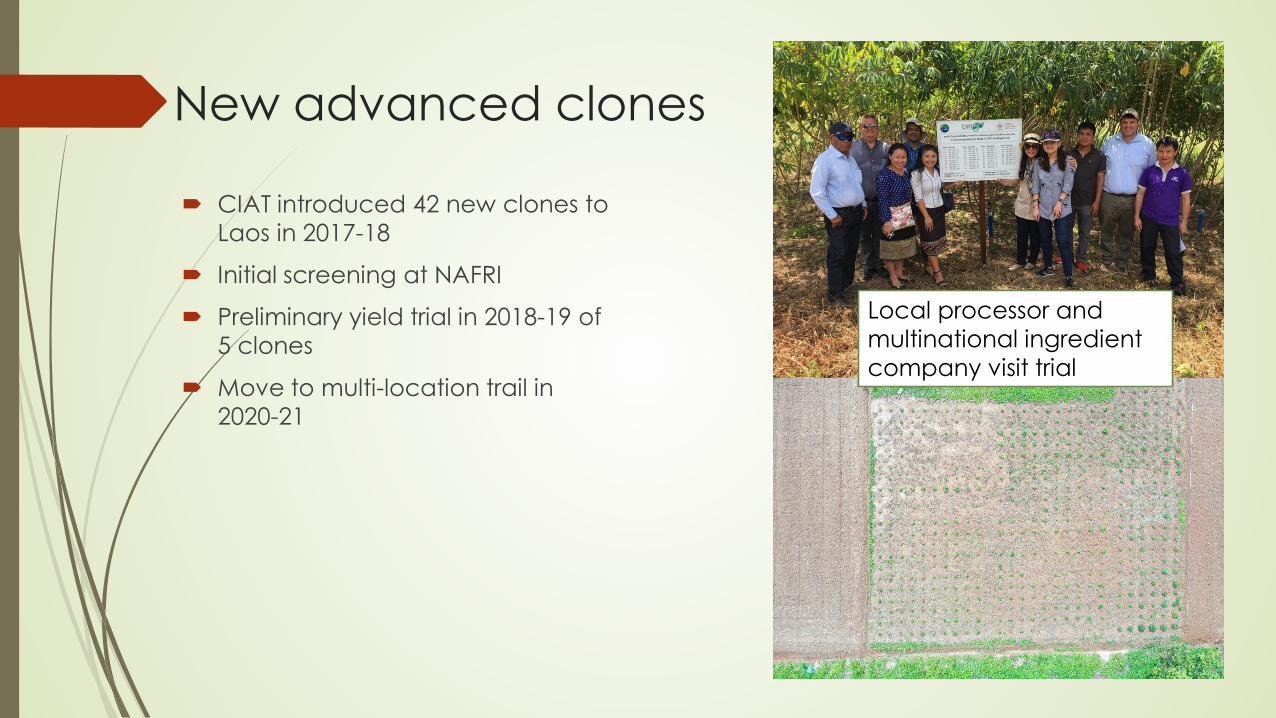
New advanced clones
CIAT introduced 42 new clones to Laos in 2017-18
Initial screening at NAFRI
Preliminary yield trial in 2018-19 of 5 clones
Move to multi-location trail in 2020-21
Local processor and multinational ingredient company visit trial

Improving the utilisation of fertiliser

Almost zero adoption of fertiliser in sites in Lao PDR
Bolikhan Kenthao Paklai Viengthong Total
Do you apply organic fertiliser to your cassava? 1.1% 0.0% 0.0% 0.0% 0.3%
Do you apply inorganic fertiliser to your cassava? 1.1% 0.0% 0.0% 0.0% 0.3%
Do you understand what the NPK values mean on the fertiliser you apply? 1.1% 1.1% 1.1% 0.0% 0.8%
Have you ever seen a fertiliser trial on cassava? 6.7% 4.4% 3.3% 3.3% 4.4%
Are you interested in visiting a fertiliser demonstration trial to see the result on production and returns?
53.3% 41.1% 52.2% 56.7% 50.8%
Are you interested in conducting a trial on your own land? 47.8% 44.4% 48.9% 53.3% 48.6%

Fertiliser treatments x 2 varieties (2017-18)
Compound
Urea TSP KCL
Difficult to obtain in local markets
Commonly used on rice and available in markets
Treatment Actual fertilizer application (kg ha-1)Urea (46-0-0) TSP (00-42-00) KCL Manure
Control (00N-00P-00K) - - - -NP low rate without K (40N-10P-0K) 87.00 54.60 - -Balanced NPK low rate (40N-10P-40K) 87.00 54.60 80.30 -Balanced NPK low rate (40N-10P-40K)+Manure (5 t/ha) 87.00 54.60 80.30 5,000Available fertilizer in local market (15-15-15) at 40N-40P2O5-40K2O
266.65 -
Balanced NPK high rate (80 N-20P-80K) 173.90 109.10 160.60 -

Differential impact of CWBD by variety
Rayong 11KU50

CWBD symptoms worse in zero treatment
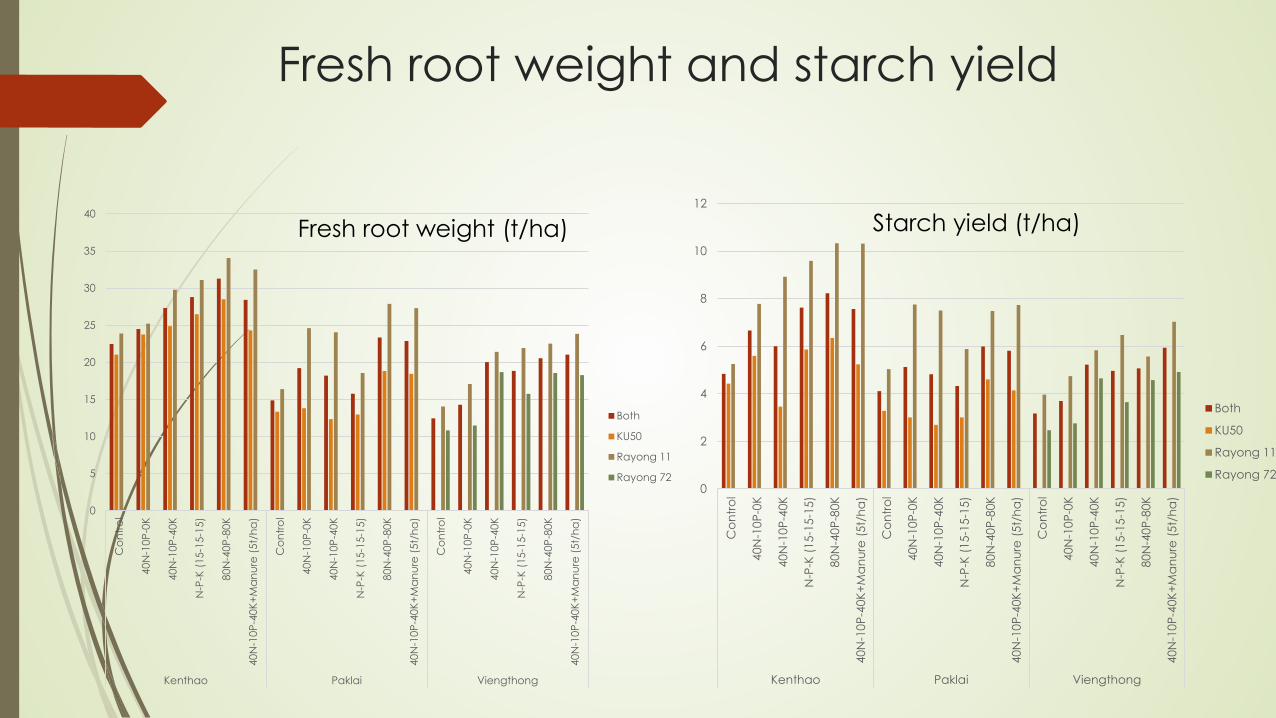
Fresh root weight and starch yield
0
5
10
15
20
25
30
35
40
Con
trol
40N
-10P
-0K
40N
-10P
-40K
N-P
-K (1
5-15
-15)
80N
-40P
-80K
40N
-10P
-40K
+Man
ure
(5t/
ha)
Con
trol
40N
-10P
-0K
40N
-10P
-40K
N-P
-K (1
5-15
-15)
80N
-40P
-80K
40N
-10P
-40K
+Man
ure
(5t/
ha)
Con
trol
40N
-10P
-0K
40N
-10P
-40K
N-P
-K (1
5-15
-15)
80N
-40P
-80K
40N
-10P
-40K
+Man
ure
(5t/
ha)
Kenthao Paklai Viengthong
Both
KU50
Rayong 11
Rayong 720
2
4
6
8
10
12
Con
trol
40N
-10P
-0K
40N
-10P
-40K
N-P
-K (1
5-15
-15)
80N
-40P
-80K
40N
-10P
-40K
+Man
ure
(5t/
ha)
Con
trol
40N
-10P
-0K
40N
-10P
-40K
N-P
-K (1
5-15
-15)
80N
-40P
-80K
40N
-10P
-40K
+Man
ure
(5t/
ha)
Con
trol
40N
-10P
-0K
40N
-10P
-40K
N-P
-K (1
5-15
-15)
80N
-40P
-80K
40N
-10P
-40K
+Man
ure
(5t/
ha)
Kenthao Paklai Viengthong
Both
KU50
Rayong 11
Rayong 72
Fresh root weight (t/ha) Starch yield (t/ha)

Economic analysis (Net benefits)District/Treatment Both KU50 Rayong 11 Rayong 72
KenthaoControl 11,234,722 10,522,222 11,947,22240N-10P-0K 11,601,324 11,233,963 11,968,68540N-10P-40K 12,686,026 11,462,415 13,909,637N-P-K (15-15-15) 13,142,578 11,995,356 14,289,80180N-40P-80K 13,686,220 12,296,637 15,075,80340N-10P-40K+Manure (5t/ha) 11,229,081 9,181,859 13,276,304
PaklaiControl 7,432,639 6,668,056 8,197,22240N-10P-0K 8,963,824 6,261,740 11,665,90740N-10P-40K 8,124,915 5,197,137 11,052,692N-P-K (15-15-15) 6,632,856 5,234,245 8,031,46780N-40P-80K 9,718,859 7,454,970 11,982,74840N-10P-40K+Manure (5t/ha) 8,456,165 6,237,415 10,674,915
ViengthongControl 3,732,500 4,215,000 3,250,00040N-10P-0K 3,642,713 4,478,963 2,806,46340N-10P-40K 5,032,415 5,441,581 4,623,248N-P-K (15-15-15) 4,399,245 5,327,578 3,470,91280N-40P-80K 4,208,720 4,800,803 3,616,63740N-10P-40K+Manure (5t/ha) 3,334,915 4,169,915 2,499,915
~50% MRR
Note: Net Benefits do not equal profit. Only costs that vary are considered (fertiliser)
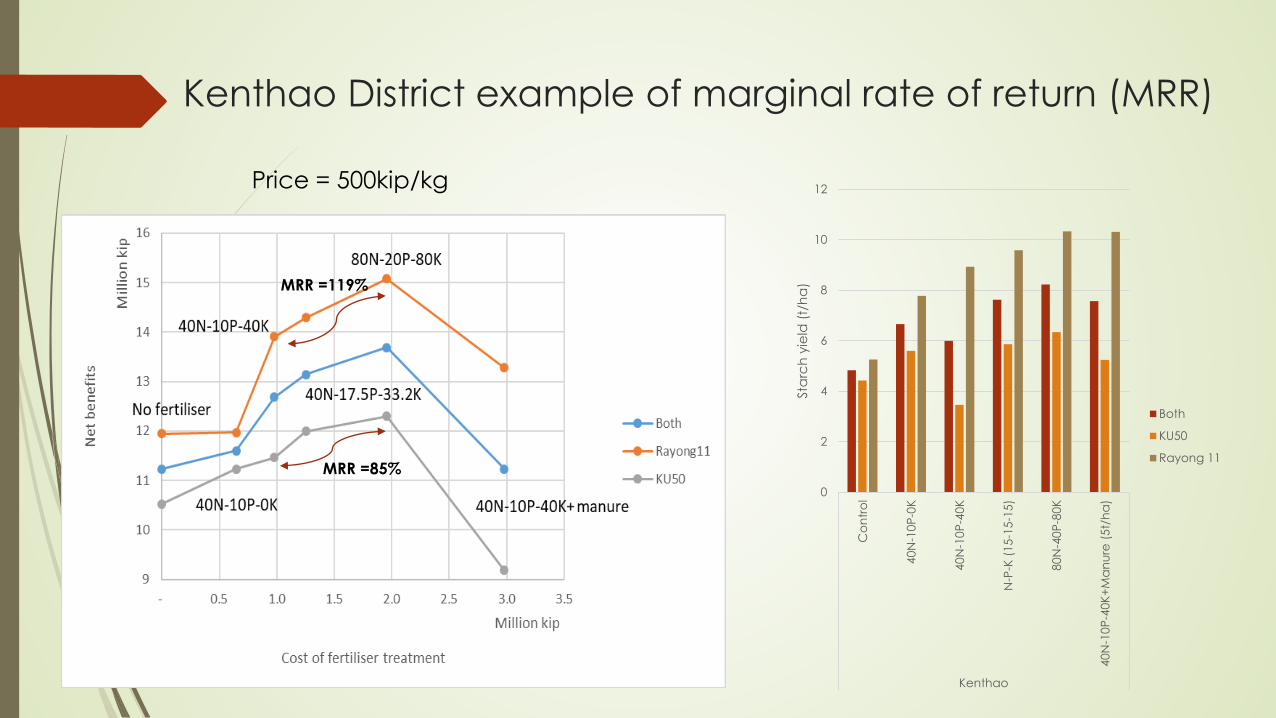
Kenthao District example of marginal rate of return (MRR)
0
2
4
6
8
10
12
Con
trol
40N
-10P
-0K
40N
-10P
-40K
N-P
-K (1
5-15
-15)
80N
-40P
-80K
40N
-10P
-40K
+Man
ure
(5t/
ha)
Kenthao
Sta
rch
yiel
d (t
/ha
)
Both
KU50
Rayong 11MRR =85%
MRR =119%
Price = 500kip/kg

Fertiliser trial 2018-19
Continue fertiliser trial in one location in each Province (ordered by cost) P1 - Control (No fertiliser)
P3 - N:P2O5:K2O (40-20-40)
P2 - N:P2O5:K2O (15-5-30): 300 Kg/ha)
P4 - N:P2O5:K2O (80-20-80)
Have a number of demonstration of ‘with and without’ fertiliser of a simple recommendation. No calculation of NPK required - N:P2O5:K2O (15-5-30): 300 Kg/ha)

Results of 2018-19
Fertilizer Fresh root yield (t ha-1) Starch content (%)
Xayaboury Bolikhamxay Xayaboury Bolikhamxay
P1 20.3 ± 5.3 7.3 ± 1.4 30.4 27.7
P3 34.2 ± 1.5 12.4 ± 0.1 29.2 29.7
P2 36.5 ± 2.3 9.1 ± 0.7 30.7 28.4
P4 32.2 ± 5.2 10.3 ± 1.2 30.1 28.3
Location P<0.001Treatment P=0.005Location X Treatment P=0.064

Economic analysis of 2018-19 trialXayabouli Bolikhamxai
Treatment Cost NetBenefits
MRR NetBenefits
MRR
P1 Control (No fertiliser) 0 10,156,944 3,662,500 0
P3 N:P2O5:K2O (40-20-40) 814,157 16,287,232 753% 5,401,120 214%
P2 N:P2O5:K2O (15-5-30): 300 Kg/ha)
1,320,000 16,950,833 131% 3,216,806 D
P4 N:P2O5:K2O (80-20-80) 1,401,172 14,709,939 D 3,761,328 D Root rot cause low yields and a reduction in net benefits

Fertiliser demonstration
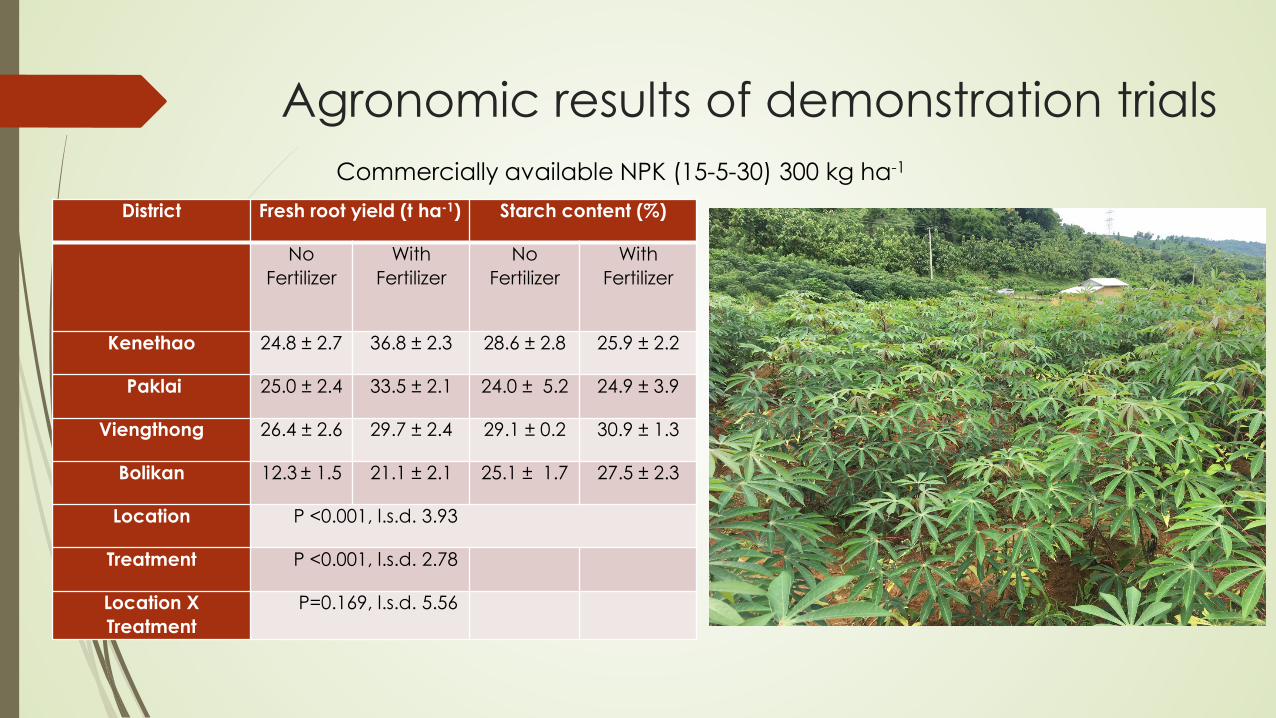
Agronomic results of demonstration trials
District Fresh root yield (t ha-1) Starch content (%)
No Fertilizer
With Fertilizer
No Fertilizer
With Fertilizer
Kenethao 24.8 ± 2.7 36.8 ± 2.3 28.6 ± 2.8 25.9 ± 2.2
Paklai 25.0 ± 2.4 33.5 ± 2.1 24.0 ± 5.2 24.9 ± 3.9
Viengthong 26.4 ± 2.6 29.7 ± 2.4 29.1 ± 0.2 30.9 ± 1.3
Bolikan 12.3 ± 1.5 21.1 ± 2.1 25.1 ± 1.7 27.5 ± 2.3
Location P <0.001, l.s.d. 3.93
Treatment P <0.001, l.s.d. 2.78
Location X Treatment
P=0.169, l.s.d. 5.56
Commercially available NPK (15-5-30) 300 kg ha-1

Economic results of demonstrationsDistrict Paklai Kenthao Bolikan Viengthong
Yield without fertiliser (t/ha) 27.8 24.8 12.3 26.4Yield with fertiliser (t/ha) 37.2 36.8 21.1 29.7Difference (t/ha) 9.5 12.0 8.8 3.3Current price (kip/kg) 540 540 540 500Cost fertiliser (kip/ha) 1,320,000 1,320,000 1,320,000 1,320,000
Current cassava root price
Marginal Net Benefits (kip/ha) 3,785,333 5,140,667 3,428,240 313,796 MRR (%) 286.8% 389.4% 259.7% 23.8%
Low cassava root price: 300 kip per ton
Marginal Net Benefits (kip/ha) 1,516,296 2,269,259 1,317,911 - 339,722 MRR (%) 114.9% 171.9% 99.8% -25.7%

Addressing weeds remains and important issues Rice remains the priority for labour
utilisation (establishment and harvest)
Weeding often did not occur or too late impacting the response to fertiliser.
Herbicide widely used in some districts, but not others. New regulations will impact there use.
Khanthavong et.al. 2016
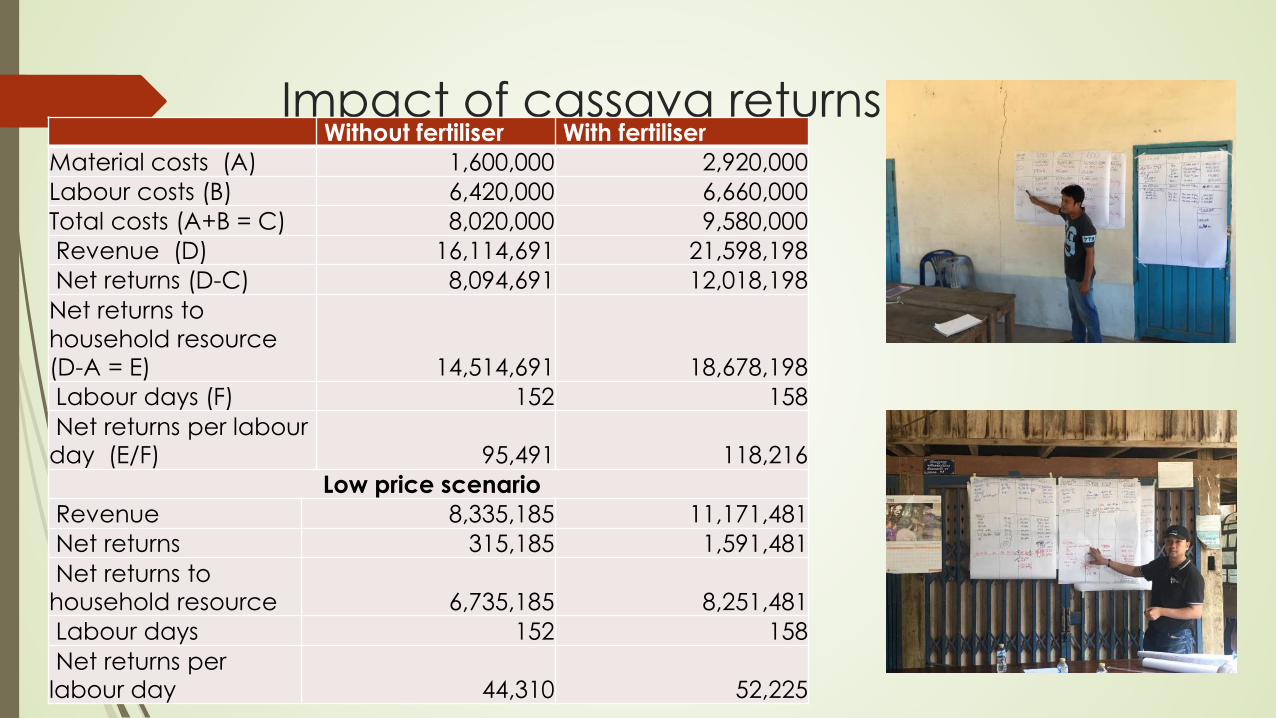
Impact of cassava returnsWithout fertiliser With fertiliser
Material costs (A) 1,600,000 2,920,000Labour costs (B) 6,420,000 6,660,000Total costs (A+B = C) 8,020,000 9,580,000Revenue (D) 16,114,691 21,598,198Net returns (D-C) 8,094,691 12,018,198
Net returns to household resource (D-A = E) 14,514,691 18,678,198Labour days (F) 152 158Net returns per labour
day (E/F) 95,491 118,216Low price scenario
Revenue 8,335,185 11,171,481Net returns 315,185 1,591,481Net returns to
household resource 6,735,185 8,251,481Labour days 152 158Net returns per
labour day 44,310 52,225
Farmer responses Variety
Farmer adopted Rayong 11 and expand on bigger area in Paklai
Farmer still eating cassava during rice deficient in Viengthong
Limited access to planting material (especially free from CWBD) limiting rate of expansion of new varieties.
Fertiliser
Farmer recognised fertilizer application increasing cassava root yield and root weight in Kenethao and Bolikhan
Farmer asked buying fertilizer in Bolikhan
Disease and seed system
advice on recognising CWBD and positive selection has reduced level of CWBD in Paklai
Farmer recommended control CWBD to other farmer in nearby village in Kenethao

Activities in 2019-2020 Expand the number of demonstrations
Activities in 20 villages across the 4 Districts Involving 40 households Variety the farmers own existing variety or Rayong 11 supplied by the project
Large plots (un-replicated) Two treatments or two kind of fertilizer: 14-7-35 and 15-7-18 (300 kg/ha)
Continue fertiliser trial (1 location per Province) No fertiliser Thai fertiliser blended for cassava*(15-5-30 commercially available) 6 bag/ha
NPK 40-20-40 NPK 80-20-80 Vietnamese fertilizer