Embed Size (px)
Citation preview
Agriculture’s Impact on Aquaculture:Hypoxia and Eutrophication in Marine Waters
ORGANISATION FOR ECONOMIC CO-OPERATION AND DEVELOPMENT
Directorate for Trade and Agriculture
This report, which has been prepared by outside consultants, is available only in its original language. It has been declassified by the Joint Working Party on Agriculture and the Environment of the OECD’s Committee for Agriculture and the Environment Policy Committee, under the code COM/TAD/CA/ENV/EPOC(2010)16/FINAL.
This document and any map included herein are without prejudice to the status of or sovereignty over any territory, to the delimitation of international frontiers and boundaries and to the name of any territory, city or area.
© OECD 2012
Applications for permission to reproduce or translate all or part of this material should be made to: OECD Publishing, [email protected], or by fax: +33 1 45 24 99 30.
Agriculture’s Impact on Aquaculture:
Hypoxia and Eutrophication in Marine Waters
Robert Díaz
Institute of Marine Sciences
Nancy N. Rabalais Louisiana Universities Marine Consortium
Denise L. Breitburg Smithsonian Environmental Research Center
United States
Note
This document, Agriculture’s Impact on Aquaculture: Hypoxia and Eutrophication in Marine Waters,
by the consultants Robert Díaz, Institute of Marine Sciences; Nancy N. Rabalais, Louisiana Universities
Marine Consortium and Denise L. Breitburg, Smithsonian Environmental Research Center, United States,
is one of the background reports supporting the OECD study (2012) Water Quality and Agriculture:
Meeting the Policy Challenge, which is available at www.oecd.org/agriculture/water.
The report was carried out under the auspices of the OECD Joint Working Party on Agriculture and the
Environment of the Committee for Agriculture and the Environment Policy Committee.
The report is published on the responsibility of the authors and does not necessarily reflect the
views of the OECD or its member countries.
The other background reports (also available at www.oecd.org/agriculture/water) are:
Agriculture and Water Quality: Monetary Costs and Benefits across OECD Countries
Andrew Moxey, Pareto Consulting, Edinburgh, Scotland, United Kingdom, assisted by
Eva Panagiotopoulou, Department of Agricultural Economics and Rural Development, Agricultural
University of Athens, Greece;
New and Emerging Water Pollution arising from Agriculture
Alistair Boxall, Environment Department, University of York, United Kingdom;
Water Quality Trading in Agriculture
James Shortle, Environmental and Natural Resources Institute, Penn State University, United States.
5
TABLE OF CONTENTS
EXECUTIVE SUMMARY ............................................................................................................................. 7
AGRICULTURE‟S IMPACT ON AQUACULTURE: HYPOXIA AND EUTROPHICATION
IN MARINE WATERS ............................................................................................................................... 9
1. Introduction: Background, scope objectives ......................................................................................... 9 2. Key environmental issues ................................................................................................................... 10
2.1 What is Eutrophication? ............................................................................................................ 11 2.2 What is Hypoxia? ...................................................................................................................... 13 2.3 Increase in Eutrophication and Hypoxia.................................................................................... 14
3. Importance of integrating impacts from multiple drivers ................................................................... 17 4. Trends in aquaculture to mitigate effects of agricultural pollution ..................................................... 17
4.1 Multiculture ............................................................................................................................... 17 4.2 Movement into offshore waters ................................................................................................. 18
5. Principle externalities ......................................................................................................................... 18 5.1 Damage to aquaculture and coastal ocean fisheries .................................................................. 18 5.2 Water and sediment quality ....................................................................................................... 20
6. Ecosystem impacts from eutrophication ............................................................................................. 23 6.1 Habitat ....................................................................................................................................... 23 6.2 Function ..................................................................................................................................... 24
7. Economic consequences for fisheries and ecosystem services ........................................................... 26 7.1 Cost of lost ecosystem services ................................................................................................. 30
8. Future issues and projected trends for agriculture and aquaculture .................................................... 31 8.1 Projected impact of climate change ........................................................................................... 32
9. Current management and policy practices .......................................................................................... 33
REFERENCES .............................................................................................................................................. 36
Tables
Table 1. Global status of provisioning, regulating, and cultural ecosystem services ................................ 10 Table 2. Sources and pathways of nutrients entering coastal systems ....................................................... 12 Table 3. Examples of multiculture or polyculture that have improved production
and environmental quality ........................................................................................................... 23 Table 4. Examples of fisheries mortality or losses related to eutrophication driven hypoxia ................... 27 Table 5. Valuation of ecosystem services lost to hypoxia ......................................................................... 31
6
Figures
Figure 1. Comparison of the relative contribution of major sources of nitrogen pollution
in three US coastal ecosystems experiencing hypoxia ............................................................... 12 Figure 2. Cone of faunal response to declining oxygen concentration ...................................................... 14 Figure 3. Global distribution of documented case of hypoxia related to human activities ........................ 16 Figure 4. Model stages of Baltic Sea benthos along a south/north transect
(Danish straits to Bothnian Sea).................................................................................................. 22 Figure 5. Conceptual view of how hypoxia alters ecosystem energy flow ................................................ 25 Figure 6. Potential physical and hydrological changes resulting from climate change
and their interaction with current and future human activities................................................... 33 Figure 7. Relative contribution of global climate change and land use to future hypoxia ......................... 35
7
EXECUTIVE SUMMARY
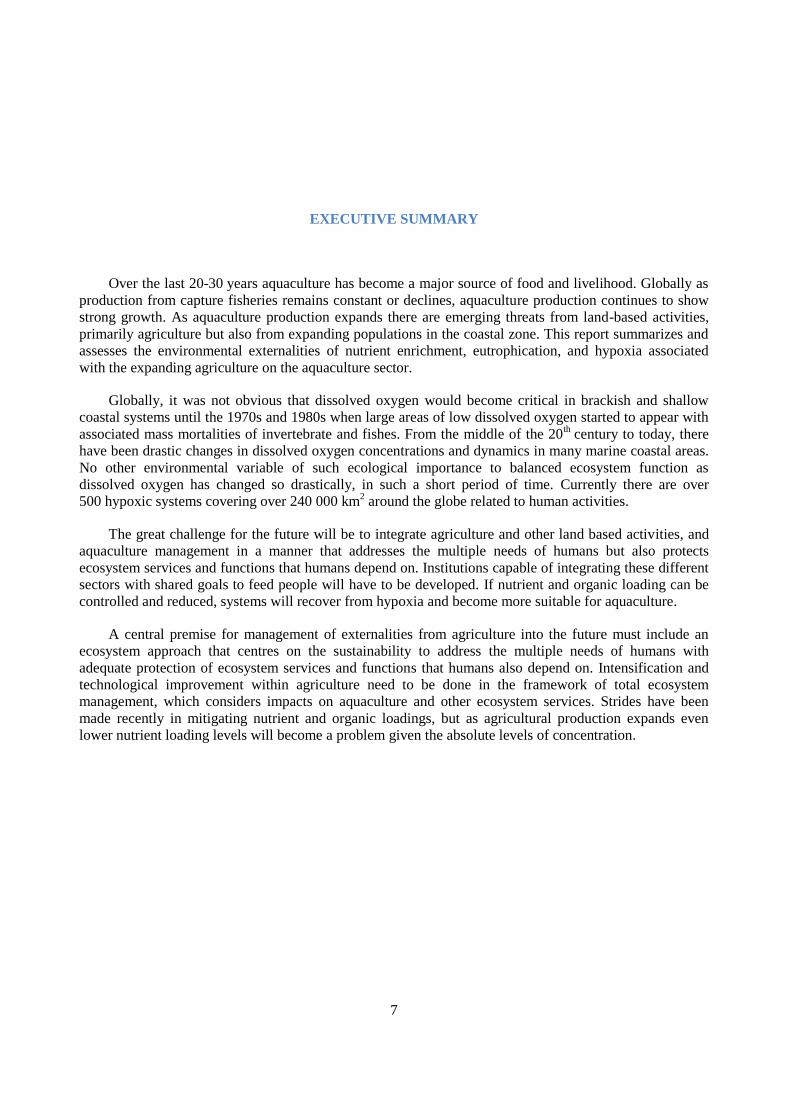
Over the last 20-30 years aquaculture has become a major source of food and livelihood. Globally as
production from capture fisheries remains constant or declines, aquaculture production continues to show
strong growth. As aquaculture production expands there are emerging threats from land-based activities,
primarily agriculture but also from expanding populations in the coastal zone. This report summarizes and
assesses the environmental externalities of nutrient enrichment, eutrophication, and hypoxia associated
with the expanding agriculture on the aquaculture sector.
Globally, it was not obvious that dissolved oxygen would become critical in brackish and shallow
coastal systems until the 1970s and 1980s when large areas of low dissolved oxygen started to appear with
associated mass mortalities of invertebrate and fishes. From the middle of the 20th century to today, there
have been drastic changes in dissolved oxygen concentrations and dynamics in many marine coastal areas.
No other environmental variable of such ecological importance to balanced ecosystem function as
dissolved oxygen has changed so drastically, in such a short period of time. Currently there are over
500 hypoxic systems covering over 240 000 km2 around the globe related to human activities.
The great challenge for the future will be to integrate agriculture and other land based activities, and
aquaculture management in a manner that addresses the multiple needs of humans but also protects
ecosystem services and functions that humans depend on. Institutions capable of integrating these different
sectors with shared goals to feed people will have to be developed. If nutrient and organic loading can be
controlled and reduced, systems will recover from hypoxia and become more suitable for aquaculture.
A central premise for management of externalities from agriculture into the future must include an
ecosystem approach that centres on the sustainability to address the multiple needs of humans with
adequate protection of ecosystem services and functions that humans also depend on. Intensification and
technological improvement within agriculture need to be done in the framework of total ecosystem
management, which considers impacts on aquaculture and other ecosystem services. Strides have been
made recently in mitigating nutrient and organic loadings, but as agricultural production expands even
lower nutrient loading levels will become a problem given the absolute levels of concentration.

9
AGRICULTURE’S IMPACT ON AQUACULTURE:
HYPOXIA AND EUTROPHICATION IN MARINE WATERS
by
Robert J. Díaz1, Nancy N. Rabalais,
2 Denise L. Breitburg
3
1. Introduction: Background, scope objectives
While aquaculture has ancient roots in Asia, it was in the 1970s that aquaculture started to increase
the ecosystem service4 of food provisioning worldwide. This growth has led aquaculture to become a
significant source of food and income to much of the world population. By 2050 the world will need 70 to
100% more food (Godfray et al., 2010) and aquaculture in coastal waters will be an important component
of this expansion. Total global capture production averaged about 90.5 million tonnes per year from 1997
to 2007 and many stocks are currently over exploited. In contrast, aquaculture production has continued to
show strong growth, increasing from about 37 million tonnes in 2002 to 50 million tonnes in 2007.
Aquaculture systems now account for roughly 35% of total fish production (FAO, 2009). Finfishes account
for about half of aquaculture production followed by mollusks and plants each 20% to 23%.
As aquaculture production expands there are emerging threats from land-based activities, primarily
agriculture but also from industrial activities and expanding populations in the coastal zone. Human
population expansion has lead to an exponential modification of landscapes and seascapes at the expense
of ecosystem function and services including pervasive effects from fueling coastal primary production
with excess nutrients to fishing down the food web (Foley et al., 2005; Lotze et al., 2006; MA, 2005,
Vitousek et al., 1997; Pauly et al., 1998, Jackson et al., 2001). Crop and rangelands now cover over 25%
of the Earth's land area, and are currently expanding (Swinton et al. 2007). Long-term records of nutrient
discharges provide compelling evidence of a rapid increase in the fertility of many temperate coastal
ecosystems starting about 50 years ago (Galloway et al., 2004). On a global basis, by 2050, coastal marine
systems are expected to experience, from today's levels, a 2.4-fold increase in nitrogen and 2.7-fold
increase in phosphorus loading from this population expansion (Tilman et al., 2001), with serious
consequences to ecosystem structure and function.
1. Virginia Institute of Marine Science, Gloucester Pt., Virginia, United States.
2. Louisiana Universities Marine Consortium, Chauvin, Louisiana, United States.
3. Smithsonian Environmental Research Center, Edgewater, Maryland, United States.
4. Ecosystem services are simply defined as „„the benefits people obtain from ecosystems‟‟ (MA, 2005) and
are summarized in Table 1.
10
To ignore environmental degradation of water quality will jeopardize future production of both
aquaculture and capture fisheries. Land-based activities are recognized as a major problem to the
sustainability of coastal ecosystems. Also, as aquaculture expands, care must be taken to keep aquaculture
from degrading the water quality it depends on (Dasgupta, 2010). This report summarizes and assesses the
environmental externalities associated with the expanding agriculture pollution on aquaculture and marine
ecosystems.
2. Key environmental issues
Along with the large increase in food provisioning service that agriculture provides come a series of
negative environmental issues. The primary externalities and issues discussed in this report will be those
that affect regulating services of water quality and trophic structure, and the supporting services of nutrient
cycling, biodiversity, and habitat. The Millennium Ecosystem Assessment (MA, 2005) provides a
framework for describing the key environmental issues in terms of ecosystem services (Table 1). One of
the most difficult areas in the ecosystem service chain relates to trade-offs among services. Often,
optimizing delivery of a given service may reduce or impair another (Mooney, 2010). Agriculture provides
a primary example. The enhanced provisioning of food can result in loss of clean water and stress to
biodiversity that supports other services (MA, 2005).
Globally, human activities have lead to large-scale modification of landscapes and seascapes at the
expense of ecosystem function and services (Foley et al., 2005, Lotze et al. 2006, Halpern et al., 2008).
Alterations to nutrient cycles, primarily nitrogen and phosphorus used in agricultural industries, have
fueled primary production and caused widespread eutrophication of inland and coastal waters. This
eutrophication has driven changes in trophic structure and formation of low dissolved oxygen or hypoxia in
bottom waters at global scales (Díaz and Rosenberg, 2008). But these are only part of a complex of
multiple stressors that interact to shape and direct ecosystem level processes (Cloern, 2001; Breitburg and
Riedel, 2005).
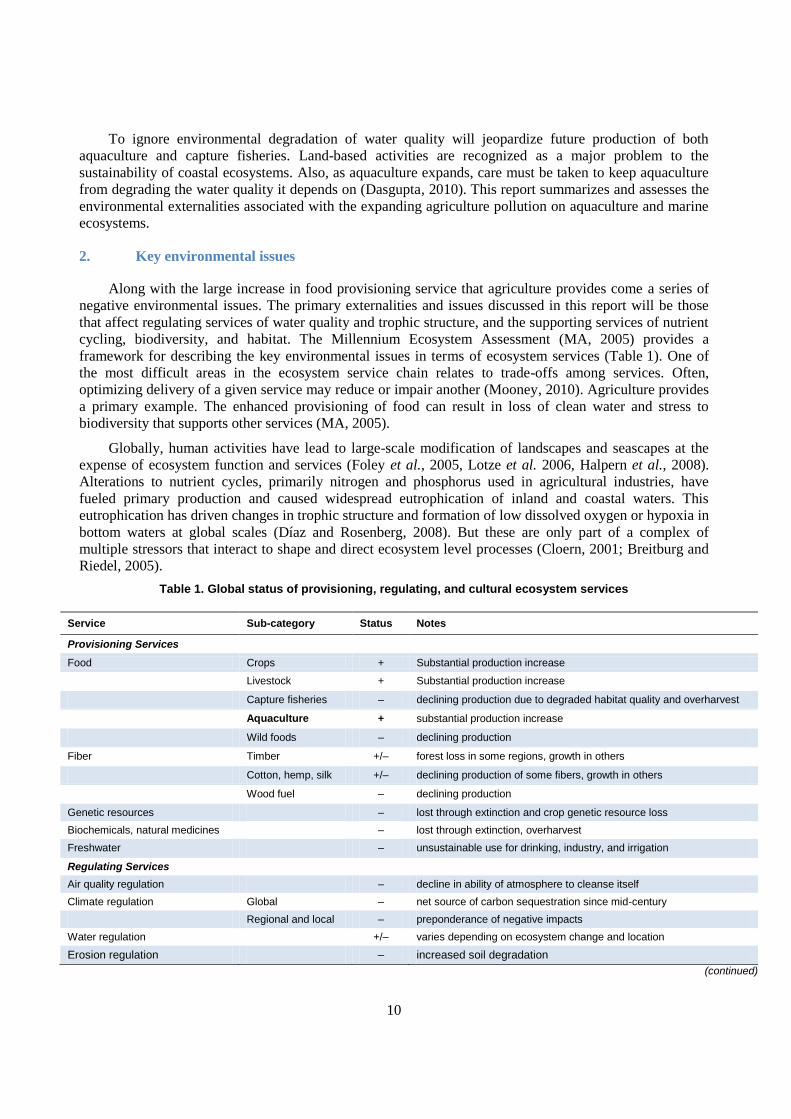
Table 1. Global status of provisioning, regulating, and cultural ecosystem services
Service Sub-category Status Notes
Provisioning Services
Food Crops + Substantial production increase
Livestock + Substantial production increase
Capture fisheries – declining production due to degraded habitat quality and overharvest
Aquaculture + substantial production increase
Wild foods – declining production
Fiber Timber +/– forest loss in some regions, growth in others
Cotton, hemp, silk +/– declining production of some fibers, growth in others
Wood fuel – declining production
Genetic resources – lost through extinction and crop genetic resource loss
Biochemicals, natural medicines – lost through extinction, overharvest
Freshwater – unsustainable use for drinking, industry, and irrigation
Regulating Services
Air quality regulation – decline in ability of atmosphere to cleanse itself
Climate regulation Global – net source of carbon sequestration since mid-century
Regional and local – preponderance of negative impacts
Water regulation +/– varies depending on ecosystem change and location
Erosion regulation – increased soil degradation
(continued)
11
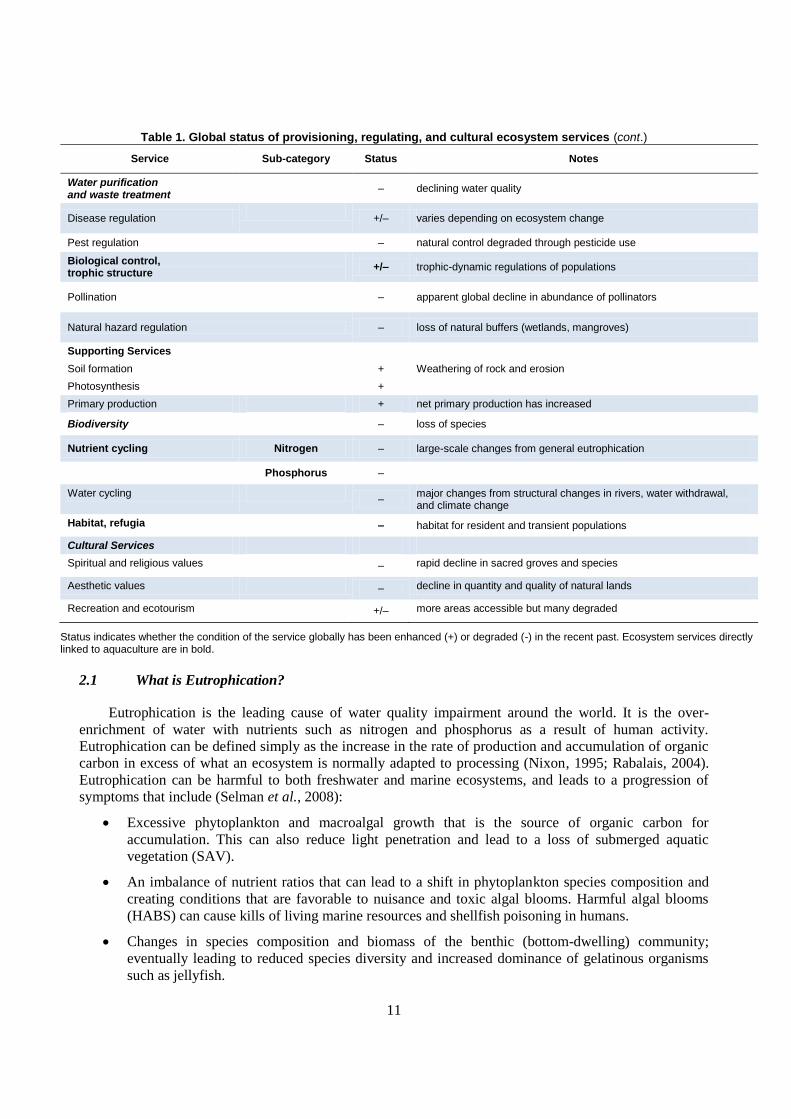
Table 1. Global status of provisioning, regulating, and cultural ecosystem services (cont.)
Service Sub-category Status Notes
Water purification and waste treatment
– declining water quality
Disease regulation
+/– varies depending on ecosystem change
Pest regulation – natural control degraded through pesticide use
Biological control, trophic structure
+/– trophic-dynamic regulations of populations
Pollination
– apparent global decline in abundance of pollinators
Natural hazard regulation – loss of natural buffers (wetlands, mangroves)
Supporting Services
Soil formation + Weathering of rock and erosion
Photosynthesis +
Primary production + net primary production has increased
Biodiversity – loss of species
Nutrient cycling Nitrogen – large-scale changes from general eutrophication
Phosphorus –
Water cycling –
major changes from structural changes in rivers, water withdrawal, and climate change
Habitat, refugia – habitat for resident and transient populations
Cultural Services
Spiritual and religious values – rapid decline in sacred groves and species
Aesthetic values – decline in quantity and quality of natural lands
Recreation and ecotourism +/– more areas accessible but many degraded
Status indicates whether the condition of the service globally has been enhanced (+) or degraded (-) in the recent past. Ecosystem services directly linked to aquaculture are in bold.
2.1 What is Eutrophication?
Eutrophication is the leading cause of water quality impairment around the world. It is the over-
enrichment of water with nutrients such as nitrogen and phosphorus as a result of human activity.
Eutrophication can be defined simply as the increase in the rate of production and accumulation of organic
carbon in excess of what an ecosystem is normally adapted to processing (Nixon, 1995; Rabalais, 2004).
Eutrophication can be harmful to both freshwater and marine ecosystems, and leads to a progression of
symptoms that include (Selman et al., 2008):
Excessive phytoplankton and macroalgal growth that is the source of organic carbon for
accumulation. This can also reduce light penetration and lead to a loss of submerged aquatic
vegetation (SAV).
An imbalance of nutrient ratios that can lead to a shift in phytoplankton species composition and
creating conditions that are favorable to nuisance and toxic algal blooms. Harmful algal blooms
(HABS) can cause kills of living marine resources and shellfish poisoning in humans.
Changes in species composition and biomass of the benthic (bottom-dwelling) community;
eventually leading to reduced species diversity and increased dominance of gelatinous organisms
such as jellyfish.
12
Low dissolved oxygen and formation of hypoxic or dead zones (oxygen-depleted waters). These
oxygen-starved areas stress aquatic ecosystems, often leading to kills of living marine resources,
altered ecosystem energy flows, and in severe cases ecosystem collapse.
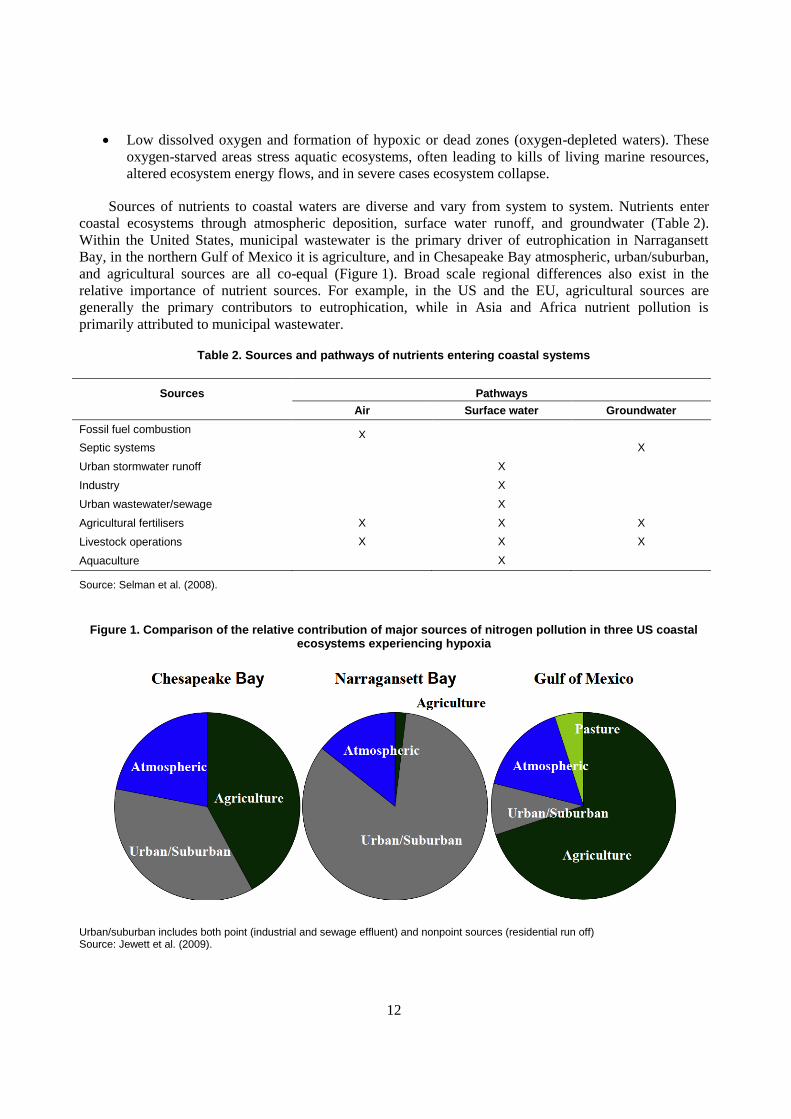
Sources of nutrients to coastal waters are diverse and vary from system to system. Nutrients enter
coastal ecosystems through atmospheric deposition, surface water runoff, and groundwater (Table 2).
Within the United States, municipal wastewater is the primary driver of eutrophication in Narragansett
Bay, in the northern Gulf of Mexico it is agriculture, and in Chesapeake Bay atmospheric, urban/suburban,
and agricultural sources are all co-equal (Figure 1). Broad scale regional differences also exist in the
relative importance of nutrient sources. For example, in the US and the EU, agricultural sources are
generally the primary contributors to eutrophication, while in Asia and Africa nutrient pollution is
primarily attributed to municipal wastewater.
Table 2. Sources and pathways of nutrients entering coastal systems
Sources Pathways
Air Surface water Groundwater
Fossil fuel combustion X
Septic systems X
Urban stormwater runoff X
Industry X
Urban wastewater/sewage X
Agricultural fertilisers X X X
Livestock operations X X X
Aquaculture X
Source: Selman et al. (2008).
Figure 1. Comparison of the relative contribution of major sources of nitrogen pollution in three US coastal ecosystems experiencing hypoxia
Urban/suburban includes both point (industrial and sewage effluent) and nonpoint sources (residential run off) Source: Jewett et al. (2009).
13
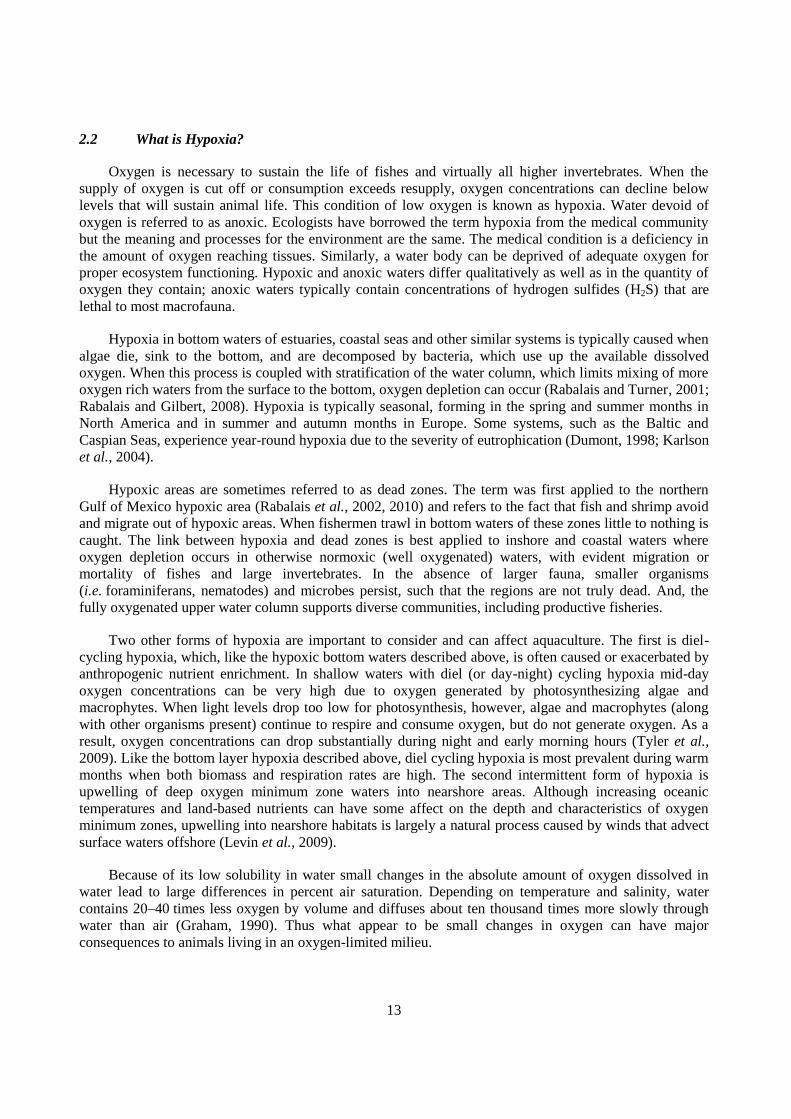
2.2 What is Hypoxia?
Oxygen is necessary to sustain the life of fishes and virtually all higher invertebrates. When the
supply of oxygen is cut off or consumption exceeds resupply, oxygen concentrations can decline below
levels that will sustain animal life. This condition of low oxygen is known as hypoxia. Water devoid of
oxygen is referred to as anoxic. Ecologists have borrowed the term hypoxia from the medical community
but the meaning and processes for the environment are the same. The medical condition is a deficiency in
the amount of oxygen reaching tissues. Similarly, a water body can be deprived of adequate oxygen for
proper ecosystem functioning. Hypoxic and anoxic waters differ qualitatively as well as in the quantity of
oxygen they contain; anoxic waters typically contain concentrations of hydrogen sulfides (H2S) that are
lethal to most macrofauna.
Hypoxia in bottom waters of estuaries, coastal seas and other similar systems is typically caused when
algae die, sink to the bottom, and are decomposed by bacteria, which use up the available dissolved
oxygen. When this process is coupled with stratification of the water column, which limits mixing of more
oxygen rich waters from the surface to the bottom, oxygen depletion can occur (Rabalais and Turner, 2001;
Rabalais and Gilbert, 2008). Hypoxia is typically seasonal, forming in the spring and summer months in
North America and in summer and autumn months in Europe. Some systems, such as the Baltic and
Caspian Seas, experience year-round hypoxia due to the severity of eutrophication (Dumont, 1998; Karlson
et al., 2004).
Hypoxic areas are sometimes referred to as dead zones. The term was first applied to the northern
Gulf of Mexico hypoxic area (Rabalais et al., 2002, 2010) and refers to the fact that fish and shrimp avoid
and migrate out of hypoxic areas. When fishermen trawl in bottom waters of these zones little to nothing is
caught. The link between hypoxia and dead zones is best applied to inshore and coastal waters where
oxygen depletion occurs in otherwise normoxic (well oxygenated) waters, with evident migration or
mortality of fishes and large invertebrates. In the absence of larger fauna, smaller organisms
(i.e. foraminiferans, nematodes) and microbes persist, such that the regions are not truly dead. And, the
fully oxygenated upper water column supports diverse communities, including productive fisheries.
Two other forms of hypoxia are important to consider and can affect aquaculture. The first is diel-
cycling hypoxia, which, like the hypoxic bottom waters described above, is often caused or exacerbated by
anthropogenic nutrient enrichment. In shallow waters with diel (or day-night) cycling hypoxia mid-day
oxygen concentrations can be very high due to oxygen generated by photosynthesizing algae and
macrophytes. When light levels drop too low for photosynthesis, however, algae and macrophytes (along
with other organisms present) continue to respire and consume oxygen, but do not generate oxygen. As a
result, oxygen concentrations can drop substantially during night and early morning hours (Tyler et al.,
2009). Like the bottom layer hypoxia described above, diel cycling hypoxia is most prevalent during warm
months when both biomass and respiration rates are high. The second intermittent form of hypoxia is
upwelling of deep oxygen minimum zone waters into nearshore areas. Although increasing oceanic
temperatures and land-based nutrients can have some affect on the depth and characteristics of oxygen
minimum zones, upwelling into nearshore habitats is largely a natural process caused by winds that advect
surface waters offshore (Levin et al., 2009).
Because of its low solubility in water small changes in the absolute amount of oxygen dissolved in
water lead to large differences in percent air saturation. Depending on temperature and salinity, water
contains 20–40 times less oxygen by volume and diffuses about ten thousand times more slowly through
water than air (Graham, 1990). Thus what appear to be small changes in oxygen can have major
consequences to animals living in an oxygen-limited milieu.
14
While many authors and water quality regulations focus on concentrations of dissolved oxygen below
2–3 mg O2/L as a threshold value for hypoxia in marine and brackish water environments, such arbitrary
limits may be unsuitable when examining potential impacts of hypoxia on any one given species (Vaquer-
Sonyer and Duarte, 2008). Hypoxia becomes detrimental when behavioral and physiological responses
result in altered behavior or negative impacts, such as reduced growth, loss of reproductive capacity,
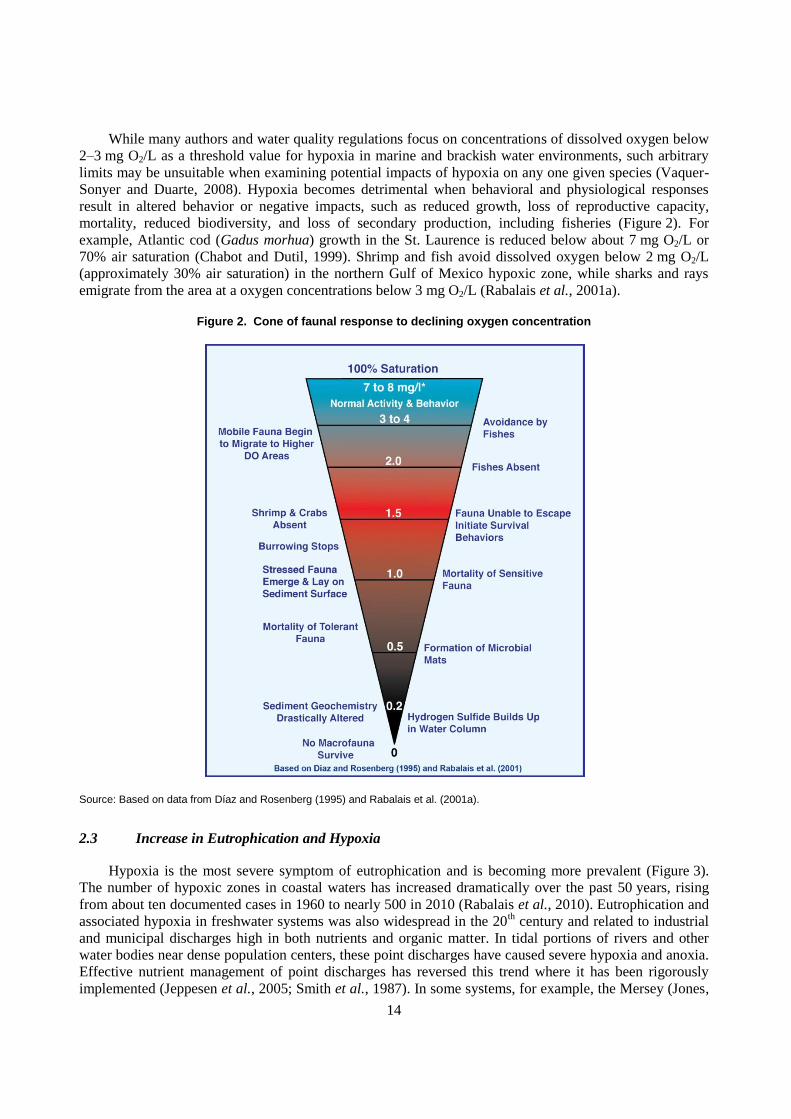
mortality, reduced biodiversity, and loss of secondary production, including fisheries (Figure 2). For
example, Atlantic cod (Gadus morhua) growth in the St. Laurence is reduced below about 7 mg O2/L or
70% air saturation (Chabot and Dutil, 1999). Shrimp and fish avoid dissolved oxygen below 2 mg O2/L
(approximately 30% air saturation) in the northern Gulf of Mexico hypoxic zone, while sharks and rays
emigrate from the area at a oxygen concentrations below 3 mg O2/L (Rabalais et al., 2001a).
Figure 2. Cone of faunal response to declining oxygen concentration
Source: Based on data from Díaz and Rosenberg (1995) and Rabalais et al. (2001a).
2.3 Increase in Eutrophication and Hypoxia
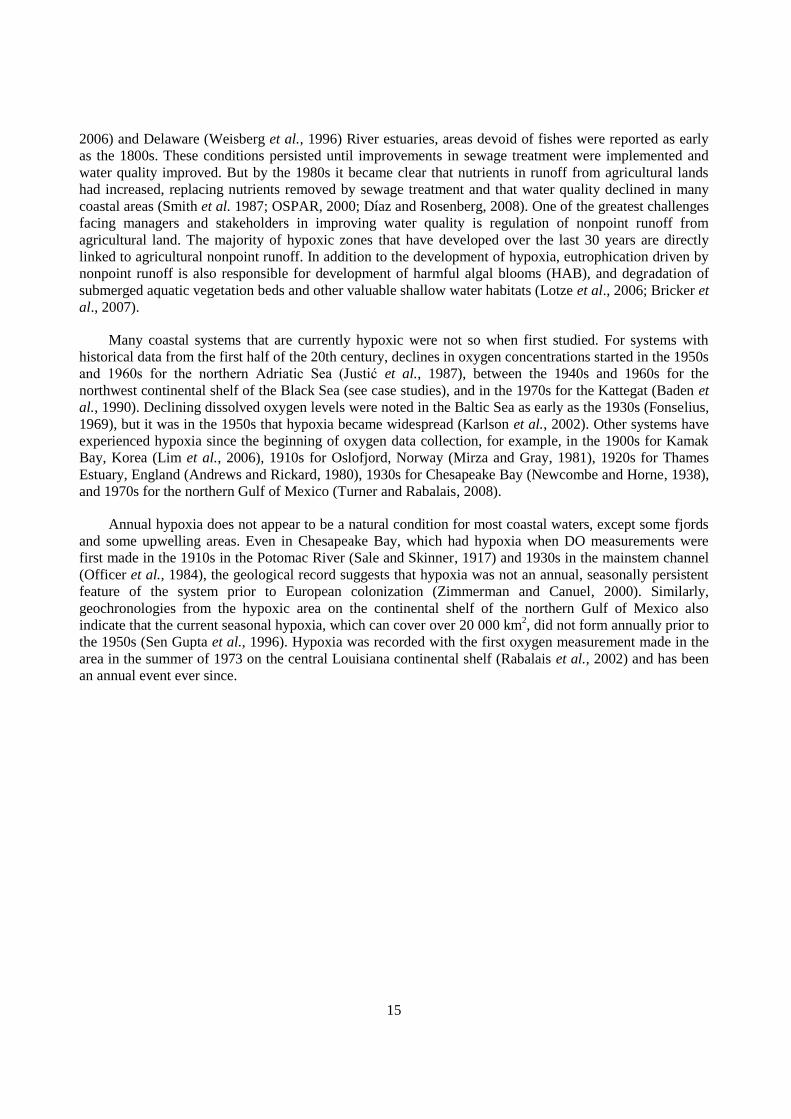
Hypoxia is the most severe symptom of eutrophication and is becoming more prevalent (Figure 3).
The number of hypoxic zones in coastal waters has increased dramatically over the past 50 years, rising
from about ten documented cases in 1960 to nearly 500 in 2010 (Rabalais et al., 2010). Eutrophication and
associated hypoxia in freshwater systems was also widespread in the 20th century and related to industrial
and municipal discharges high in both nutrients and organic matter. In tidal portions of rivers and other
water bodies near dense population centers, these point discharges have caused severe hypoxia and anoxia.
Effective nutrient management of point discharges has reversed this trend where it has been rigorously
implemented (Jeppesen et al., 2005; Smith et al., 1987). In some systems, for example, the Mersey (Jones,
15
2006) and Delaware (Weisberg et al., 1996) River estuaries, areas devoid of fishes were reported as early
as the 1800s. These conditions persisted until improvements in sewage treatment were implemented and
water quality improved. But by the 1980s it became clear that nutrients in runoff from agricultural lands
had increased, replacing nutrients removed by sewage treatment and that water quality declined in many
coastal areas (Smith et al. 1987; OSPAR, 2000; Díaz and Rosenberg, 2008). One of the greatest challenges
facing managers and stakeholders in improving water quality is regulation of nonpoint runoff from
agricultural land. The majority of hypoxic zones that have developed over the last 30 years are directly
linked to agricultural nonpoint runoff. In addition to the development of hypoxia, eutrophication driven by
nonpoint runoff is also responsible for development of harmful algal blooms (HAB), and degradation of
submerged aquatic vegetation beds and other valuable shallow water habitats (Lotze et al., 2006; Bricker et
al., 2007).
Many coastal systems that are currently hypoxic were not so when first studied. For systems with
historical data from the first half of the 20th century, declines in oxygen concentrations started in the 1950s
and 1960s for the northern Adriatic Sea (Justić et al., 1987), between the 1940s and 1960s for the
northwest continental shelf of the Black Sea (see case studies), and in the 1970s for the Kattegat (Baden et
al., 1990). Declining dissolved oxygen levels were noted in the Baltic Sea as early as the 1930s (Fonselius,
1969), but it was in the 1950s that hypoxia became widespread (Karlson et al., 2002). Other systems have
experienced hypoxia since the beginning of oxygen data collection, for example, in the 1900s for Kamak
Bay, Korea (Lim et al., 2006), 1910s for Oslofjord, Norway (Mirza and Gray, 1981), 1920s for Thames
Estuary, England (Andrews and Rickard, 1980), 1930s for Chesapeake Bay (Newcombe and Horne, 1938),
and 1970s for the northern Gulf of Mexico (Turner and Rabalais, 2008).
Annual hypoxia does not appear to be a natural condition for most coastal waters, except some fjords
and some upwelling areas. Even in Chesapeake Bay, which had hypoxia when DO measurements were
first made in the 1910s in the Potomac River (Sale and Skinner, 1917) and 1930s in the mainstem channel
(Officer et al., 1984), the geological record suggests that hypoxia was not an annual, seasonally persistent
feature of the system prior to European colonization (Zimmerman and Canuel, 2000). Similarly,
geochronologies from the hypoxic area on the continental shelf of the northern Gulf of Mexico also
indicate that the current seasonal hypoxia, which can cover over 20 000 km2, did not form annually prior to
the 1950s (Sen Gupta et al., 1996). Hypoxia was recorded with the first oxygen measurement made in the
area in the summer of 1973 on the central Louisiana continental shelf (Rabalais et al., 2002) and has been
an annual event ever since.
16
Figure 3. Global distribution of documented case of hypoxia related to human activities*
* Each hypoxia case related to a human activity is represented by a dot. The number of hypoxic areas is cumulative for the successive time periods.
Source: Rabalais et al. (2010).
17
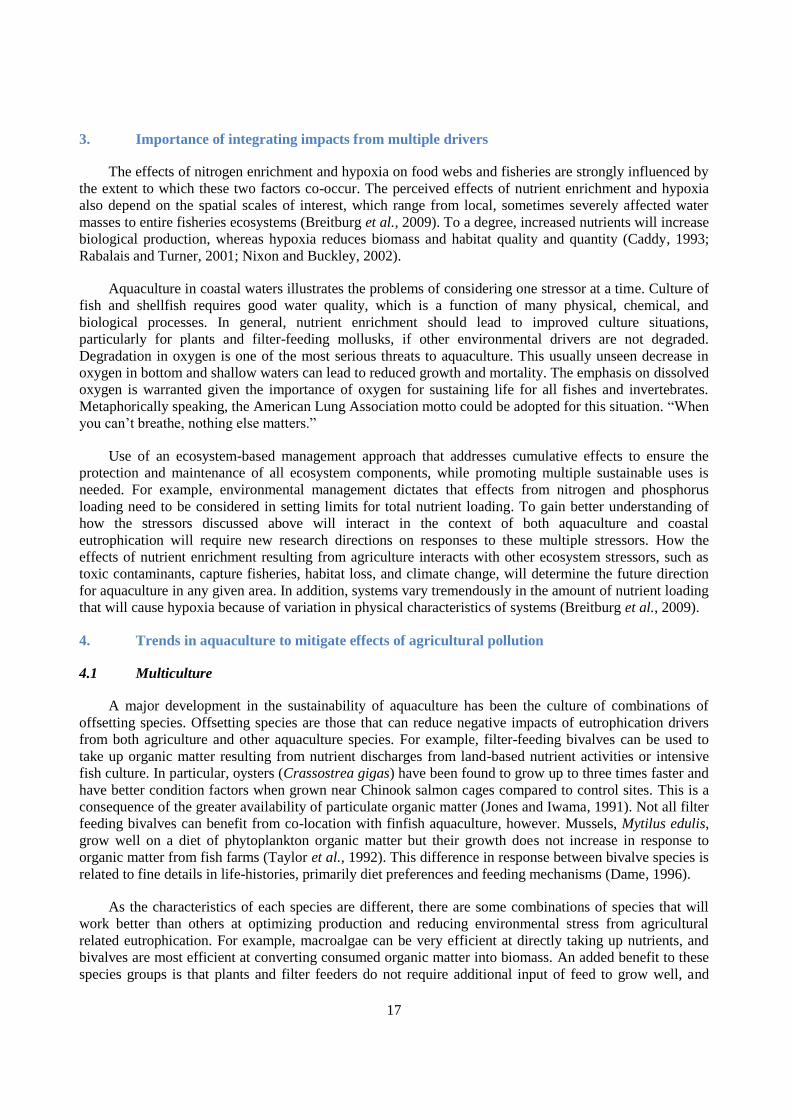
3. Importance of integrating impacts from multiple drivers
The effects of nitrogen enrichment and hypoxia on food webs and fisheries are strongly influenced by
the extent to which these two factors co-occur. The perceived effects of nutrient enrichment and hypoxia
also depend on the spatial scales of interest, which range from local, sometimes severely affected water
masses to entire fisheries ecosystems (Breitburg et al., 2009). To a degree, increased nutrients will increase
biological production, whereas hypoxia reduces biomass and habitat quality and quantity (Caddy, 1993;
Rabalais and Turner, 2001; Nixon and Buckley, 2002).
Aquaculture in coastal waters illustrates the problems of considering one stressor at a time. Culture of
fish and shellfish requires good water quality, which is a function of many physical, chemical, and
biological processes. In general, nutrient enrichment should lead to improved culture situations,
particularly for plants and filter-feeding mollusks, if other environmental drivers are not degraded.
Degradation in oxygen is one of the most serious threats to aquaculture. This usually unseen decrease in
oxygen in bottom and shallow waters can lead to reduced growth and mortality. The emphasis on dissolved
oxygen is warranted given the importance of oxygen for sustaining life for all fishes and invertebrates.
Metaphorically speaking, the American Lung Association motto could be adopted for this situation. “When
you can‟t breathe, nothing else matters.”
Use of an ecosystem-based management approach that addresses cumulative effects to ensure the
protection and maintenance of all ecosystem components, while promoting multiple sustainable uses is
needed. For example, environmental management dictates that effects from nitrogen and phosphorus
loading need to be considered in setting limits for total nutrient loading. To gain better understanding of
how the stressors discussed above will interact in the context of both aquaculture and coastal
eutrophication will require new research directions on responses to these multiple stressors. How the
effects of nutrient enrichment resulting from agriculture interacts with other ecosystem stressors, such as
toxic contaminants, capture fisheries, habitat loss, and climate change, will determine the future direction
for aquaculture in any given area. In addition, systems vary tremendously in the amount of nutrient loading
that will cause hypoxia because of variation in physical characteristics of systems (Breitburg et al., 2009).
4. Trends in aquaculture to mitigate effects of agricultural pollution
4.1 Multiculture
A major development in the sustainability of aquaculture has been the culture of combinations of
offsetting species. Offsetting species are those that can reduce negative impacts of eutrophication drivers
from both agriculture and other aquaculture species. For example, filter-feeding bivalves can be used to
take up organic matter resulting from nutrient discharges from land-based nutrient activities or intensive
fish culture. In particular, oysters (Crassostrea gigas) have been found to grow up to three times faster and
have better condition factors when grown near Chinook salmon cages compared to control sites. This is a
consequence of the greater availability of particulate organic matter (Jones and Iwama, 1991). Not all filter
feeding bivalves can benefit from co-location with finfish aquaculture, however. Mussels, Mytilus edulis,
grow well on a diet of phytoplankton organic matter but their growth does not increase in response to
organic matter from fish farms (Taylor et al., 1992). This difference in response between bivalve species is
related to fine details in life-histories, primarily diet preferences and feeding mechanisms (Dame, 1996).
As the characteristics of each species are different, there are some combinations of species that will
work better than others at optimizing production and reducing environmental stress from agricultural
related eutrophication. For example, macroalgae can be very efficient at directly taking up nutrients, and
bivalves are most efficient at converting consumed organic matter into biomass. An added benefit to these
species groups is that plants and filter feeders do not require additional input of feed to grow well, and
18
therefore do not contribute to water quality problems. In contrast, most fishes and crustaceans are higher
up the food chain and require higher protein content food to sustain higher growth rates, which can add to
agricultural eutrophication stresses. Costa-Pierce (2008) in a review of ecosystem approaches to
aquaculture in marine water found that combinations of species could lessen environmental impacts and at
the same time maximize economic and social profit.
It has even been proposed that in systems that have lost historic populations of filter-feeding bivalves,
restoration of these populations would reduce hypoxia by sequestering nutrients and organic matter in
bivalve biomass (Newell et al., 2005). For example, in Chesapeake Bay intense mortality associated with
fisheries and disease caused a dramatic decline in eastern oyster stocks and associated Bay water filtration,
which may have exacerbated the effects of eutrophication driven by excess nutrient loading (Kemp et al.,
2005).
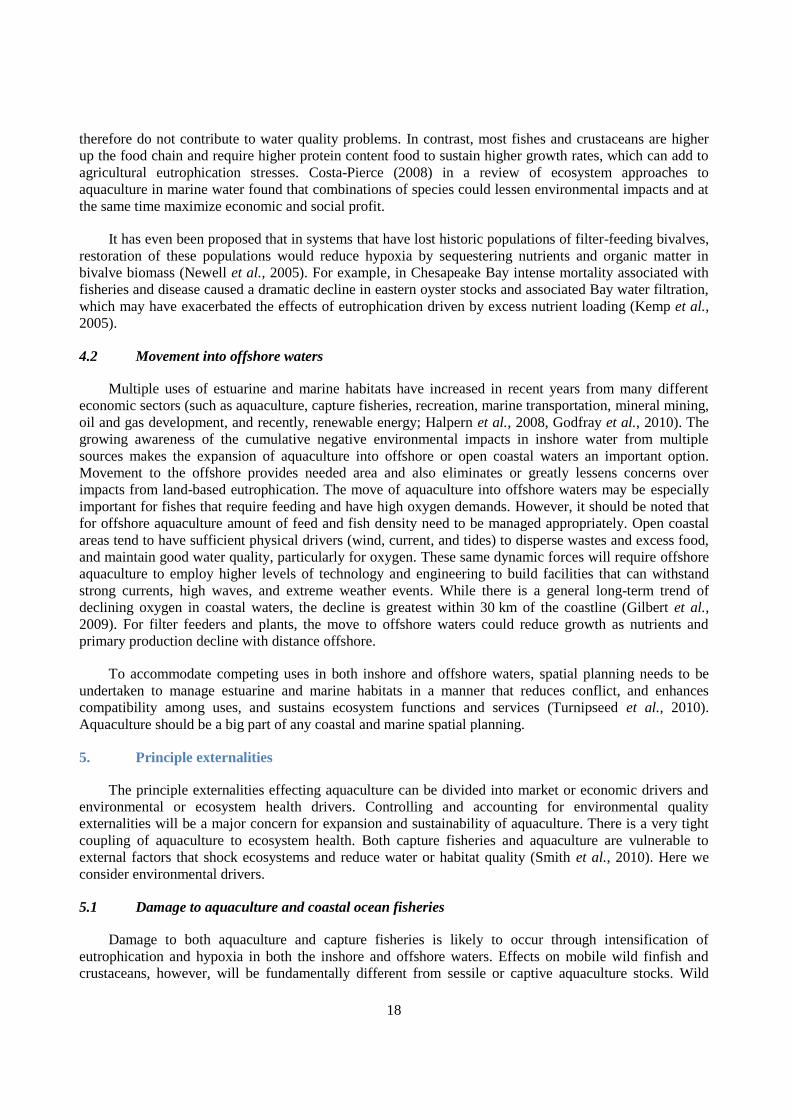
4.2 Movement into offshore waters
Multiple uses of estuarine and marine habitats have increased in recent years from many different
economic sectors (such as aquaculture, capture fisheries, recreation, marine transportation, mineral mining,
oil and gas development, and recently, renewable energy; Halpern et al., 2008, Godfray et al., 2010). The
growing awareness of the cumulative negative environmental impacts in inshore water from multiple
sources makes the expansion of aquaculture into offshore or open coastal waters an important option.
Movement to the offshore provides needed area and also eliminates or greatly lessens concerns over
impacts from land-based eutrophication. The move of aquaculture into offshore waters may be especially
important for fishes that require feeding and have high oxygen demands. However, it should be noted that
for offshore aquaculture amount of feed and fish density need to be managed appropriately. Open coastal
areas tend to have sufficient physical drivers (wind, current, and tides) to disperse wastes and excess food,
and maintain good water quality, particularly for oxygen. These same dynamic forces will require offshore
aquaculture to employ higher levels of technology and engineering to build facilities that can withstand
strong currents, high waves, and extreme weather events. While there is a general long-term trend of
declining oxygen in coastal waters, the decline is greatest within 30 km of the coastline (Gilbert et al.,
2009). For filter feeders and plants, the move to offshore waters could reduce growth as nutrients and
primary production decline with distance offshore.
To accommodate competing uses in both inshore and offshore waters, spatial planning needs to be
undertaken to manage estuarine and marine habitats in a manner that reduces conflict, and enhances
compatibility among uses, and sustains ecosystem functions and services (Turnipseed et al., 2010).
Aquaculture should be a big part of any coastal and marine spatial planning.
5. Principle externalities
The principle externalities effecting aquaculture can be divided into market or economic drivers and
environmental or ecosystem health drivers. Controlling and accounting for environmental quality
externalities will be a major concern for expansion and sustainability of aquaculture. There is a very tight
coupling of aquaculture to ecosystem health. Both capture fisheries and aquaculture are vulnerable to
external factors that shock ecosystems and reduce water or habitat quality (Smith et al., 2010). Here we
consider environmental drivers.
5.1 Damage to aquaculture and coastal ocean fisheries
Damage to both aquaculture and capture fisheries is likely to occur through intensification of
eutrophication and hypoxia in both the inshore and offshore waters. Effects on mobile wild finfish and
crustaceans, however, will be fundamentally different from sessile or captive aquaculture stocks. Wild
19
stocks of many mobile species at least have some ability to behaviorally avoid habitats negatively impacted
by eutrophication (Breitburg et al., 2009). In contrast, mobility is constrained by aquaculture making
organisms particularly susceptible to mortality resulting from negative effects of eutrophication as
behavioral avoidance will be limited. Both hypoxia and HABS are of particular concern. For example,
mass mortality of cultured fish (yellowtail Seriola quinqueradiata and red sea bream Pagrus major) in the
eastern Seto Island Sea due to HABs is a frequent occurrence (Bruslé, 1995). In the eutrophic Prevost
Lagoon hypoxia and H2S can result in reduced bivalve production (Guyoneaud et al., 1998).
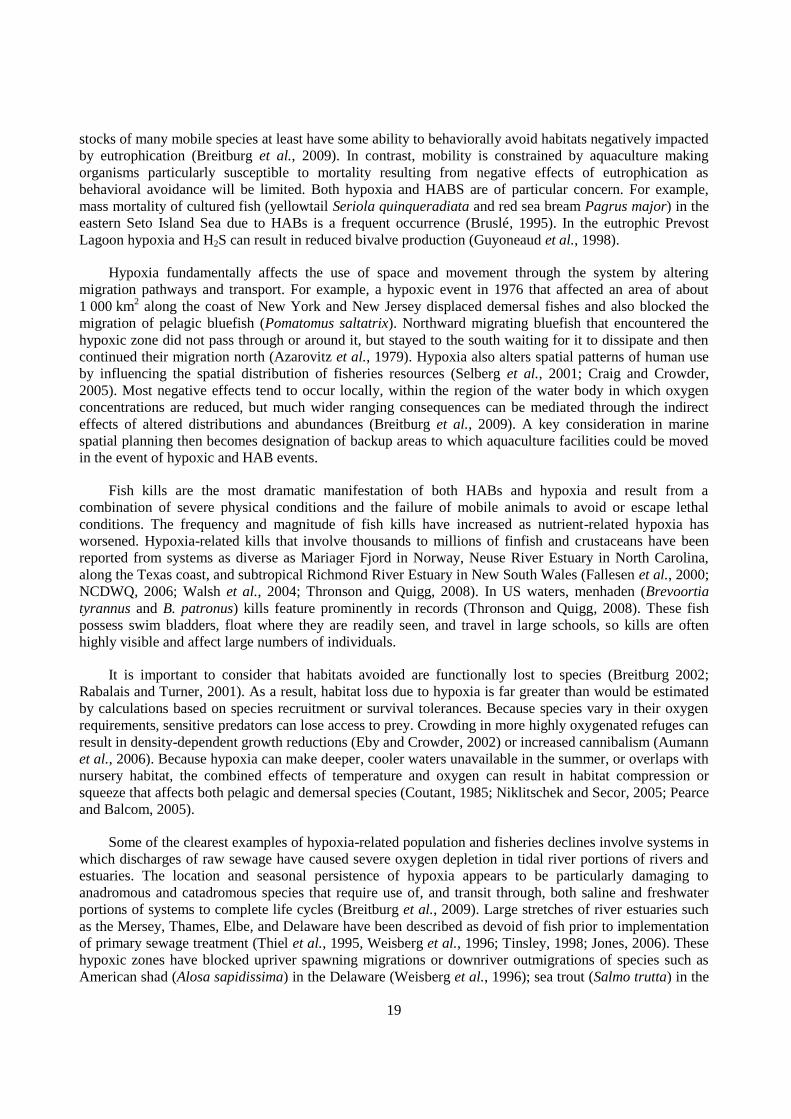
Hypoxia fundamentally affects the use of space and movement through the system by altering
migration pathways and transport. For example, a hypoxic event in 1976 that affected an area of about
1 000 km2 along the coast of New York and New Jersey displaced demersal fishes and also blocked the
migration of pelagic bluefish (Pomatomus saltatrix). Northward migrating bluefish that encountered the
hypoxic zone did not pass through or around it, but stayed to the south waiting for it to dissipate and then
continued their migration north (Azarovitz et al., 1979). Hypoxia also alters spatial patterns of human use
by influencing the spatial distribution of fisheries resources (Selberg et al., 2001; Craig and Crowder,
2005). Most negative effects tend to occur locally, within the region of the water body in which oxygen
concentrations are reduced, but much wider ranging consequences can be mediated through the indirect
effects of altered distributions and abundances (Breitburg et al., 2009). A key consideration in marine
spatial planning then becomes designation of backup areas to which aquaculture facilities could be moved
in the event of hypoxic and HAB events.
Fish kills are the most dramatic manifestation of both HABs and hypoxia and result from a
combination of severe physical conditions and the failure of mobile animals to avoid or escape lethal
conditions. The frequency and magnitude of fish kills have increased as nutrient-related hypoxia has
worsened. Hypoxia-related kills that involve thousands to millions of finfish and crustaceans have been
reported from systems as diverse as Mariager Fjord in Norway, Neuse River Estuary in North Carolina,
along the Texas coast, and subtropical Richmond River Estuary in New South Wales (Fallesen et al., 2000;
NCDWQ, 2006; Walsh et al., 2004; Thronson and Quigg, 2008). In US waters, menhaden (Brevoortia
tyrannus and B. patronus) kills feature prominently in records (Thronson and Quigg, 2008). These fish
possess swim bladders, float where they are readily seen, and travel in large schools, so kills are often
highly visible and affect large numbers of individuals.
It is important to consider that habitats avoided are functionally lost to species (Breitburg 2002;
Rabalais and Turner, 2001). As a result, habitat loss due to hypoxia is far greater than would be estimated
by calculations based on species recruitment or survival tolerances. Because species vary in their oxygen
requirements, sensitive predators can lose access to prey. Crowding in more highly oxygenated refuges can
result in density-dependent growth reductions (Eby and Crowder, 2002) or increased cannibalism (Aumann
et al., 2006). Because hypoxia can make deeper, cooler waters unavailable in the summer, or overlaps with
nursery habitat, the combined effects of temperature and oxygen can result in habitat compression or
squeeze that affects both pelagic and demersal species (Coutant, 1985; Niklitschek and Secor, 2005; Pearce
and Balcom, 2005).
Some of the clearest examples of hypoxia-related population and fisheries declines involve systems in
which discharges of raw sewage have caused severe oxygen depletion in tidal river portions of rivers and
estuaries. The location and seasonal persistence of hypoxia appears to be particularly damaging to
anadromous and catadromous species that require use of, and transit through, both saline and freshwater
portions of systems to complete life cycles (Breitburg et al., 2009). Large stretches of river estuaries such
as the Mersey, Thames, Elbe, and Delaware have been described as devoid of fish prior to implementation
of primary sewage treatment (Thiel et al., 1995, Weisberg et al., 1996; Tinsley, 1998; Jones, 2006). These
hypoxic zones have blocked upriver spawning migrations or downriver outmigrations of species such as
American shad (Alosa sapidissima) in the Delaware (Weisberg et al., 1996); sea trout (Salmo trutta) in the
20
Mersey (Jones, 2006); and sturgeon (Acipenser sturio), Atlantic salmon (Salmo salar), allis shad (Alsoa
alosa), twait shad (Alosa fallaxx fallax) sea lamprey (Petromyzon marinus), and European eel (Anguilla
anguilla) in the Scheldt (Maes et al., 2007), resulting in population declines or local extirpations.
There is also persuasive evidence of system-wide declines in fisheries landings and abundances of
sensitive species in systems with very high percentages of bottom hypoxia (Breitburg et al., 2009). For
example, abundances of demersal fish and crustaceans, including mantis shrimp (Oratosquilla oratoria),
have declined in Tokyo Bay, where up to two-thirds of the bottom becomes hypoxic during summer
(Kodama et al., 2002, 2006). Hypoxia also appears to contribute to system-wide fisheries declines in
combination with pathogens (e.g., American lobster, Homarus americanus, in Long Island Sound; Pearce
and Balcom, 2005) and other effects of eutrophication (e.g., reduced plaice recruitment in the Kattegat;
Pihl et al., 2005), particularly where the co-occurring or interacting stressors affect organisms in highly
oxygenated areas that would otherwise serve as refuges from hypoxia.
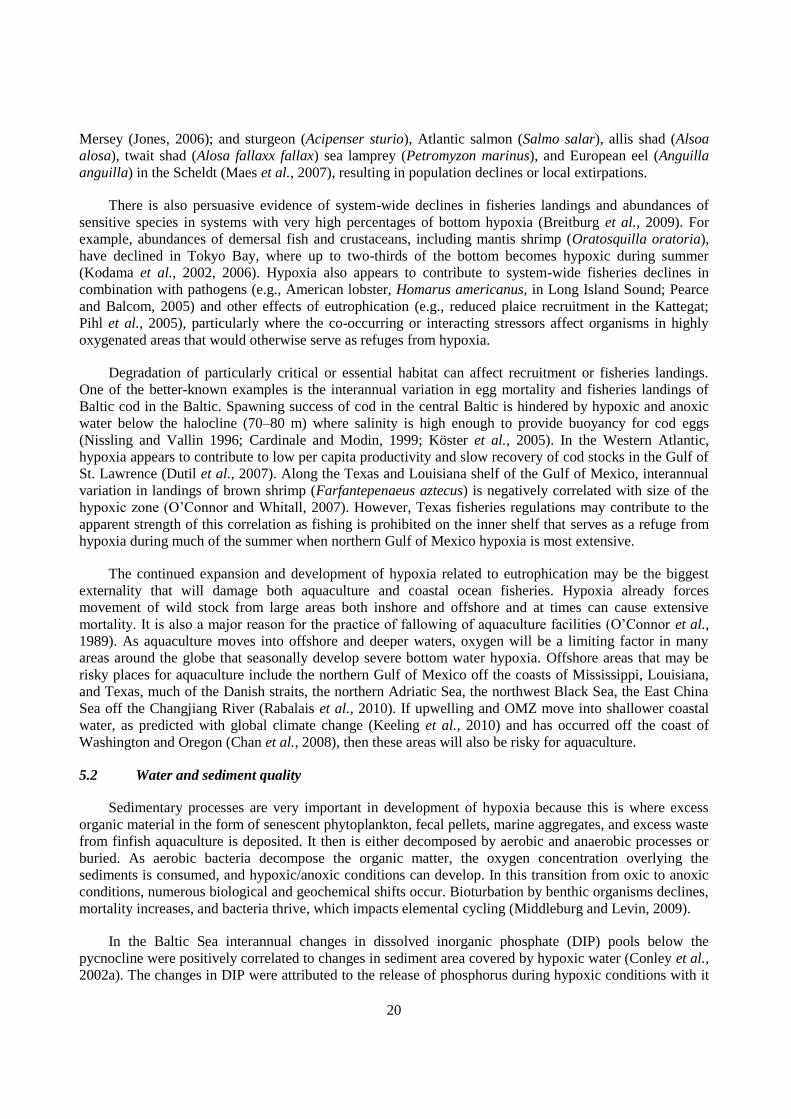
Degradation of particularly critical or essential habitat can affect recruitment or fisheries landings.
One of the better-known examples is the interannual variation in egg mortality and fisheries landings of
Baltic cod in the Baltic. Spawning success of cod in the central Baltic is hindered by hypoxic and anoxic
water below the halocline (70–80 m) where salinity is high enough to provide buoyancy for cod eggs
(Nissling and Vallin 1996; Cardinale and Modin, 1999; Köster et al., 2005). In the Western Atlantic,
hypoxia appears to contribute to low per capita productivity and slow recovery of cod stocks in the Gulf of
St. Lawrence (Dutil et al., 2007). Along the Texas and Louisiana shelf of the Gulf of Mexico, interannual
variation in landings of brown shrimp (Farfantepenaeus aztecus) is negatively correlated with size of the
hypoxic zone (O‟Connor and Whitall, 2007). However, Texas fisheries regulations may contribute to the
apparent strength of this correlation as fishing is prohibited on the inner shelf that serves as a refuge from
hypoxia during much of the summer when northern Gulf of Mexico hypoxia is most extensive.
The continued expansion and development of hypoxia related to eutrophication may be the biggest
externality that will damage both aquaculture and coastal ocean fisheries. Hypoxia already forces
movement of wild stock from large areas both inshore and offshore and at times can cause extensive
mortality. It is also a major reason for the practice of fallowing of aquaculture facilities (O‟Connor et al.,
1989). As aquaculture moves into offshore and deeper waters, oxygen will be a limiting factor in many
areas around the globe that seasonally develop severe bottom water hypoxia. Offshore areas that may be
risky places for aquaculture include the northern Gulf of Mexico off the coasts of Mississippi, Louisiana,
and Texas, much of the Danish straits, the northern Adriatic Sea, the northwest Black Sea, the East China
Sea off the Changjiang River (Rabalais et al., 2010). If upwelling and OMZ move into shallower coastal
water, as predicted with global climate change (Keeling et al., 2010) and has occurred off the coast of
Washington and Oregon (Chan et al., 2008), then these areas will also be risky for aquaculture.
5.2 Water and sediment quality
Sedimentary processes are very important in development of hypoxia because this is where excess
organic material in the form of senescent phytoplankton, fecal pellets, marine aggregates, and excess waste
from finfish aquaculture is deposited. It then is either decomposed by aerobic and anaerobic processes or
buried. As aerobic bacteria decompose the organic matter, the oxygen concentration overlying the
sediments is consumed, and hypoxic/anoxic conditions can develop. In this transition from oxic to anoxic
conditions, numerous biological and geochemical shifts occur. Bioturbation by benthic organisms declines,
mortality increases, and bacteria thrive, which impacts elemental cycling (Middleburg and Levin, 2009).
In the Baltic Sea interannual changes in dissolved inorganic phosphate (DIP) pools below the
pycnocline were positively correlated to changes in sediment area covered by hypoxic water (Conley et al.,
2002a). The changes in DIP were attributed to the release of phosphorus during hypoxic conditions with it
21
returning to the sediments during non-hypoxic periods. Similarly, the flux of nitrogen in the form of
ammonium from microbial respiration increases. The nitrification/denitrification cycle within sediments,
which returns N2 to the atmosphere, is the main mechanism for removal of reactive nitrogen. This cycle is
disrupted by the limited availability of oxygen in sediments during hypoxia and the greenhouse gas N2O is
produced (Paulmier and Ruiz-Pino, 2009).
With continued accumulation of organic carbon at the seabed, microbial decomposition and oxygen
consumption increase, but not in simple linear relationships (Meyer-Reil and Köster, 2000). The redox
potential discontinuity layer migrates upward to the sediment-water interface, sulfate respiration replaces
oxygen respiration, H2S is generated from the sediments and oxygen penetrates less deeply into the
sediments as the bioturbation potential of the infauna decreases during their demise due to sulfide toxicity
or lack of sufficient oxygen (Figure 4) (Rumohr et al., 1996, Gutiérrez et al., 2000). Some shifts in the
benthic microbial community are visible at the sediment-water interface in the form of bacterial mats
(Jørgensen, 1980; Rosenberg and Díaz, 1993). These bacterial mats are indicators of near anoxic
conditions and are commonly observed in both eutrophication driven hypoxia and where naturally
occurring oxygen minimum zones intersect the seabed (Graco et al., 2001; Levin et al., 2009). When
oxygen is severely depleted, or anoxic, H2S builds up in the bottom waters as anaerobic bacteria
metabolism reduces sulfate to H2S (Jørgensen, 1980), the sediment becomes almost uniformly black, and
there are no signs of aerobic life. Hydrogen sulfide is toxic to most metazoans and contributes to the
overall mortality of benthic organisms.
Water quality can be either degraded or improved by aquaculture depending on the species and
environmental conditions. Certain groups of species, primarily mollusks and plants, can reduce organic and
nutrient loading to the water column (Table 3). But physical drivers play a large role in determining the
degree of impact to the water column. Suspension-feeders serve to couple pelagic and benthic processes
because they filter suspended particles from the water column and the undigested remains, ejected as
mucus-bound feces and pseudofeces, sink to the sediment surface. This biodeposition can be extremely
important in regulating water column processes (Newell, 2004). Nitrogen excreted by the bivalves and
regenerated from their biodeposits is recycled back to the water column to support further phytoplankton
production. Where biodeposits are incorporated into surficial aerobic sediments that overlay deeper
anaerobic sediments, microbially mediated, coupled nitrification-denitrification can permanently remove
nitrogen from the system as N2 gas. Consequently, aquaculture of bivalves may provide a supplement to
water quality management and offset negative effects of agricultural nutrient loading. For example,
modeled effect of mussel culture on nitrogen cycling at the mouth of the Gullmar Fjord, Swedish west
coast, was to reduce the net transport of nitrogen by 20% (Lindahl et al., 2005).
Currents may be the most significant driver of water quality around aquaculture facilities.
Development of hypoxia and anoxia under aquaculture facilities, for example, is directly correlated to
currents. Aquaculture sites well flushed by tidal currents, as in the Rias Baixas, northwest Spain, do not
allow accumulation of organic matter (Tenore et al., 1982). High flow rate bring a continuous supply of
oxygen to the sediment water interface, which permits the survival of modified benthic communities even
when sedimentary processes become anaerobic (Godbold and Solan, 2009). Low rates of water renewal
can lead to deoxygenation in the overlying water column as sedimentary BOD increases (Pearson and
Black, 2001). For example, fish culture in enclosed brackish waters of the Finnish archipelago, in the
northern Baltic Sea, increased the level of eutrophication and enhanced algal mat growth, which at times
has lead to anoxia and reductions in local fish and benthic populations (Bonsdorff et al., 1997). When
currents can keep surface sediments from becoming anaerobic impacts tend to be localized and not extend
far from the culture facility.
22
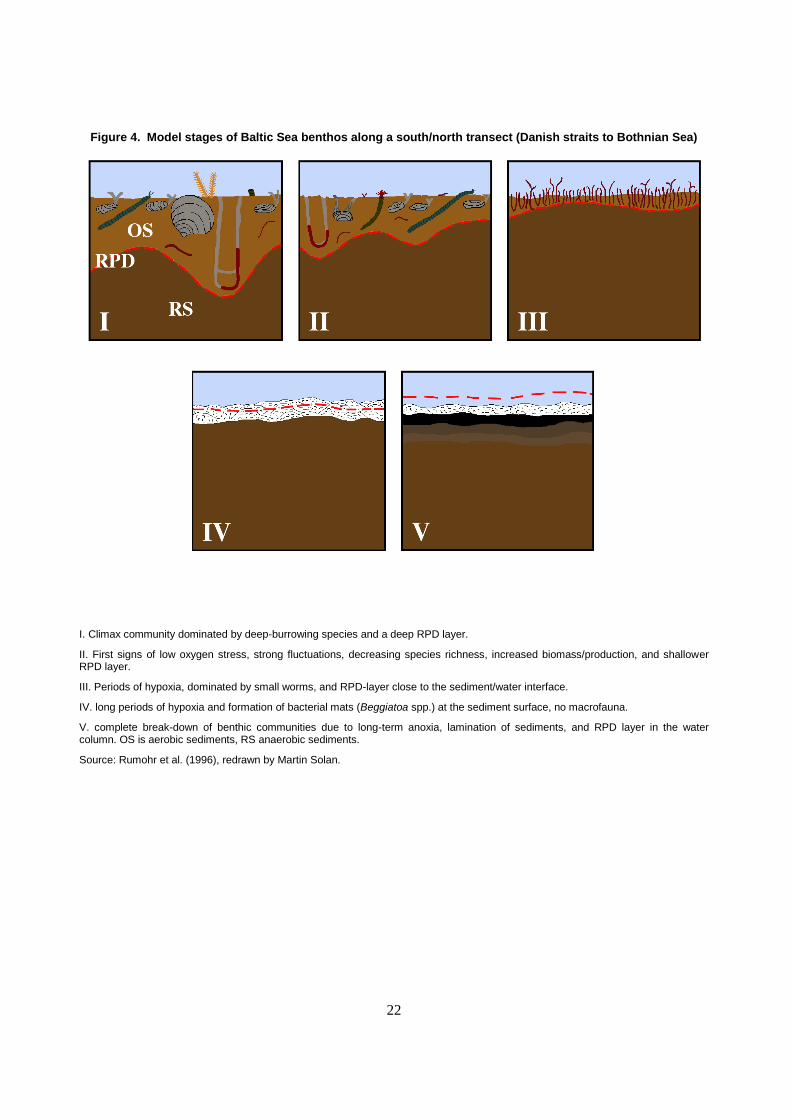
Figure 4. Model stages of Baltic Sea benthos along a south/north transect (Danish straits to Bothnian Sea)
I. Climax community dominated by deep-burrowing species and a deep RPD layer.
II. First signs of low oxygen stress, strong fluctuations, decreasing species richness, increased biomass/production, and shallower RPD layer.
III. Periods of hypoxia, dominated by small worms, and RPD-layer close to the sediment/water interface.
IV. long periods of hypoxia and formation of bacterial mats (Beggiatoa spp.) at the sediment surface, no macrofauna.
V. complete break-down of benthic communities due to long-term anoxia, lamination of sediments, and RPD layer in the water column. OS is aerobic sediments, RS anaerobic sediments.
Source: Rumohr et al. (1996), redrawn by Martin Solan.
23
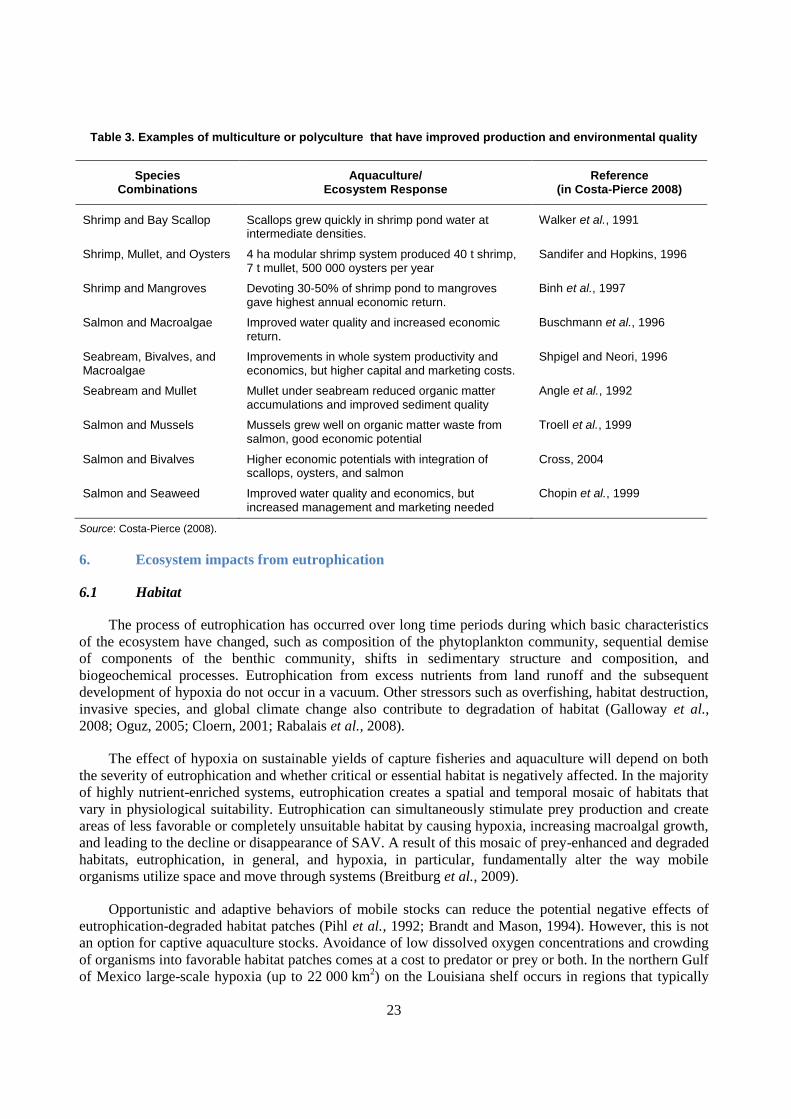
Table 3. Examples of multiculture or polyculture that have improved production and environmental quality
Species Combinations
Aquaculture/ Ecosystem Response
Reference (in Costa-Pierce 2008)
Shrimp and Bay Scallop Scallops grew quickly in shrimp pond water at intermediate densities.
Walker et al., 1991
Shrimp, Mullet, and Oysters 4 ha modular shrimp system produced 40 t shrimp, 7 t mullet, 500 000 oysters per year
Sandifer and Hopkins, 1996
Shrimp and Mangroves Devoting 30-50% of shrimp pond to mangroves gave highest annual economic return.
Binh et al., 1997
Salmon and Macroalgae Improved water quality and increased economic return.
Buschmann et al., 1996
Seabream, Bivalves, and Macroalgae
Improvements in whole system productivity and economics, but higher capital and marketing costs.
Shpigel and Neori, 1996
Seabream and Mullet Mullet under seabream reduced organic matter accumulations and improved sediment quality
Angle et al., 1992
Salmon and Mussels Mussels grew well on organic matter waste from salmon, good economic potential
Troell et al., 1999
Salmon and Bivalves Higher economic potentials with integration of scallops, oysters, and salmon
Cross, 2004
Salmon and Seaweed Improved water quality and economics, but increased management and marketing needed
Chopin et al., 1999
Source: Costa-Pierce (2008).
6. Ecosystem impacts from eutrophication
6.1 Habitat
The process of eutrophication has occurred over long time periods during which basic characteristics
of the ecosystem have changed, such as composition of the phytoplankton community, sequential demise
of components of the benthic community, shifts in sedimentary structure and composition, and
biogeochemical processes. Eutrophication from excess nutrients from land runoff and the subsequent
development of hypoxia do not occur in a vacuum. Other stressors such as overfishing, habitat destruction,
invasive species, and global climate change also contribute to degradation of habitat (Galloway et al.,
2008; Oguz, 2005; Cloern, 2001; Rabalais et al., 2008).
The effect of hypoxia on sustainable yields of capture fisheries and aquaculture will depend on both
the severity of eutrophication and whether critical or essential habitat is negatively affected. In the majority
of highly nutrient-enriched systems, eutrophication creates a spatial and temporal mosaic of habitats that
vary in physiological suitability. Eutrophication can simultaneously stimulate prey production and create
areas of less favorable or completely unsuitable habitat by causing hypoxia, increasing macroalgal growth,
and leading to the decline or disappearance of SAV. A result of this mosaic of prey-enhanced and degraded
habitats, eutrophication, in general, and hypoxia, in particular, fundamentally alter the way mobile
organisms utilize space and move through systems (Breitburg et al., 2009).
Opportunistic and adaptive behaviors of mobile stocks can reduce the potential negative effects of
eutrophication-degraded habitat patches (Pihl et al., 1992; Brandt and Mason, 1994). However, this is not
an option for captive aquaculture stocks. Avoidance of low dissolved oxygen concentrations and crowding
of organisms into favorable habitat patches comes at a cost to predator or prey or both. In the northern Gulf
of Mexico large-scale hypoxia (up to 22 000 km2) on the Louisiana shelf occurs in regions that typically
24
support high-density brown shrimp and results in substantial habitat loss (up to ~25% of the Louisiana
shelf from May to September), with shifts in distribution and associated high densities both inshore and
offshore of the hypoxic region. These shifts in spatial distribution during hypoxia have implications for
organism energy budgets, trophic interactions, and fishery pressure (Craig and Crowder, 2005; Craig et al.,
2005).
Effects of fisheries on eutrophication, and of eutrophication on fish yields, may be strongest in
systems with extensive aquaculture production. Excess feed and feces associated with intensive cage
culture of fish can cause localized hypoxia and HABs, resulting in losses of both cultured and wild fish
production (Rosenthal, 1985; Naylor et al., 2000). Bivalve aquaculture, in contrast, removes phytoplankton
and can sometimes reduce negative effects of nutrient enrichment. Removal of farmed suspension-feeder
biomass may have a greater potential than fisheries exploitation of wild populations to reduce
eutrophication because of high rates of aquaculture removals. Aquaculture may, however, be particularly
susceptible to mortality resulting from negative effects of eutrophication.
6.2 Function
In marine ecosystems, oxygen depletion has become a major structuring force for communities and
energy flows. The elimination of fauna and compression of habitat by hypoxia not only alters population
dynamics but also have profound effects of ecosystem energetics and functions. If oxygen concentrations
decline below tolerance levels, organisms die and are decomposed by microbes. Ecosystem models for the
Neuse River estuary (Baird et al., 2004), Chesapeake Bay (Baird and Ulanowicz, 1989), and Kattegat
(Pearson and Rosenberg, 1992) all show a hypoxia-enhanced diversion of energy flows into microbial
pathways to the detriment of higher trophic levels.
Specific ecological effects will depend on the duration and severity of hypoxia. Short-lived and mild
hypoxia may not have severe costs to energy flows as communities have been pre-conditioned to other
eutrophication stresses and have developed resilience to hypoxia. Within a narrow range of conditions
hypoxia facilitates upward trophic transfer as physiologically stressed fauna being forced to the sediment
surface during hypoxia may be exploited by epibenthic predators (Pihl et al., 1992). Under mild hypoxia,
prey may also experience a relief from predation, as hypoxia is typically more stressful to the predators
than the prey. In the Kattegat, for example, seasonal hypoxia led to an estimated 23% reduction in
predation by crabs (Pearson and Rosenberg, 1992). Upward energy transfer is not enabled in areas where
hypoxia is severe as either the benthos is killed directly and/or predators would be too stressed to enter the
area. In all cases, the increase in the proportion of production transferred to predators is temporary and as
mortality occurs, microbial pathways quickly dominate energy flows (Figure 5).
This energy diversion tends to occur in ecologically important places (nursery and recruitment areas)
and at the most inopportune time (summer) for predator energy demands, and causes an overall reduction
in an ecosystem‟s functional ability to transfer energy to higher trophic levels and renders the ecosystem
potentially less resilient to other stressors. Reduction of the primary prey base for demersal predators from
dead zones has consequences for ecosystem functioning and services other than biomass production for
food webs. Key geochemical cycles are controlled by a complex interaction of oxygen, bioturbation, and
sediment properties, for example, the balance between nitrification and denitrification.
Systems exposed to extensive periods of hypoxia and anoxia have low annual benthic secondary
production with the amount of productivity a function of how quickly benthos can recruit and grow during
periods of normoxia. Marine benthic systems suffering from hypoxia and anoxia at present once had
benthic life. In some systems it is possible to make crude estimates of the biomass from prehypoxic times,
e.g. estimate the “missing biomass” of today. For areas of the Baltic that are now persistently hypoxic and
anoxic (70 000 km2, Karlson et al., 2002) missing biomass amounts to about 1.7 million metric tonnes wet
25
weight, which represents about 30% of total Baltic secondary production (Elmgren, 1989). Similarly,
estimates for Chesapeake Bay indicate that about 67 000 million tonnes wet weight is lost because of
hypoxia each year, about 5% of total Bay secondary production (Díaz and Schaffner, 1990). If we assume
about 40% of the benthic biomass is passed up the food chain in the Baltic (Möller et al., 1985) and 60% in
Chesapeake Bay (Díaz and Schaffner, 1990), then a total of 700 000 million tonnes wet weight of potential
fish food energy is lost in the Baltic and 27 000 million tonnes wet weight in Chesapeake Bay. In the
northern Gulf of Mexico that experience severe seasonal hypoxia, benthic biomass is reduced by as much
as 9.3 million tonnes wet weight/km2 (Rabalais et al., 2001b), which is approximately a 113 000 million
tonnes wet weight lost from the fisheries forage base when the size of the dead zone is 20 000 km2,
assuming a 60% transfer efficiency.
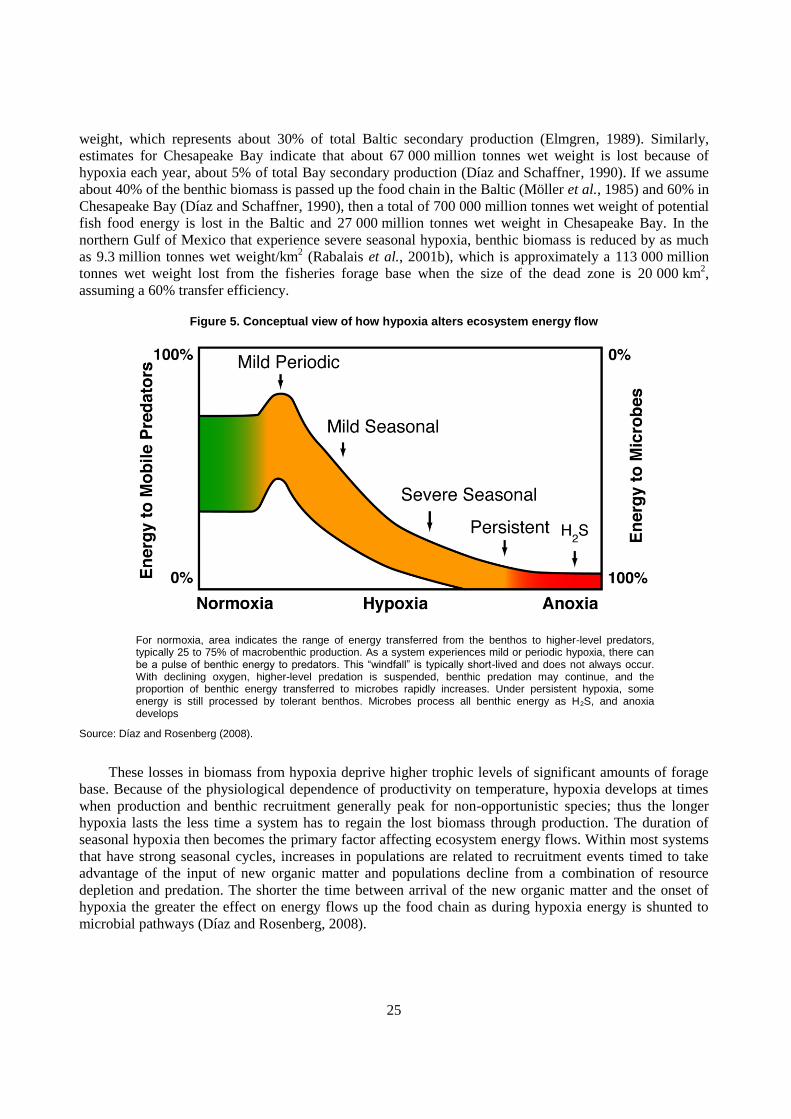
Figure 5. Conceptual view of how hypoxia alters ecosystem energy flow
For normoxia, area indicates the range of energy transferred from the benthos to higher-level predators, typically 25 to 75% of macrobenthic production. As a system experiences mild or periodic hypoxia, there can be a pulse of benthic energy to predators. This “windfall” is typically short-lived and does not always occur. With declining oxygen, higher-level predation is suspended, benthic predation may continue, and the proportion of benthic energy transferred to microbes rapidly increases. Under persistent hypoxia, some energy is still processed by tolerant benthos. Microbes process all benthic energy as H2S, and anoxia develops
Source: Díaz and Rosenberg (2008).
These losses in biomass from hypoxia deprive higher trophic levels of significant amounts of forage
base. Because of the physiological dependence of productivity on temperature, hypoxia develops at times
when production and benthic recruitment generally peak for non-opportunistic species; thus the longer
hypoxia lasts the less time a system has to regain the lost biomass through production. The duration of
seasonal hypoxia then becomes the primary factor affecting ecosystem energy flows. Within most systems
that have strong seasonal cycles, increases in populations are related to recruitment events timed to take
advantage of the input of new organic matter and populations decline from a combination of resource
depletion and predation. The shorter the time between arrival of the new organic matter and the onset of
hypoxia the greater the effect on energy flows up the food chain as during hypoxia energy is shunted to
microbial pathways (Díaz and Rosenberg, 2008).
26
7. Economic consequences for fisheries and ecosystem services
Some aspects of agriculture can contribute to enhanced ecosystem services in terrestrial ecosystems
(Swinton et al., 2007), but in marine ecosystems agriculture impacts are usually negative and rarely
positive (Tilman et al., 2001; Galloway et al., 2008). This is due to the transformative nature of excess
nutrients in fueling eutrophication, altering productivity pathways and species composition. For example,
the primary negative drivers on biodiversity appear to be displacement of long-lived sensitive species by
short-lived opportunistic spices adapted to rapidly respond to the influx of organic matter and alteration or
loss of habitat quality.
The growing demand for the ecosystem service of food provisioning has resulted in stress and change
to regulating and supporting ecosystem services (Table 1). This expanding need for food provisioning has
lead to over half of all ecosystem services being degraded or used unsustainably (MA, 2005). The
increasing production of food services, such as crops, livestock, and aquaculture, has led to a consumption
of an increasing fraction of other service (for example, diverting more water for irrigation or capturing
more fish from the sea) and has put downward pressure on others (for example, habitat quality and
biodiversity). Much of this downward pressure can be traced to agricultural waste products (nutrient, toxic
chemical, organic runoff). There are many examples of mortality and stress on fisheries species from
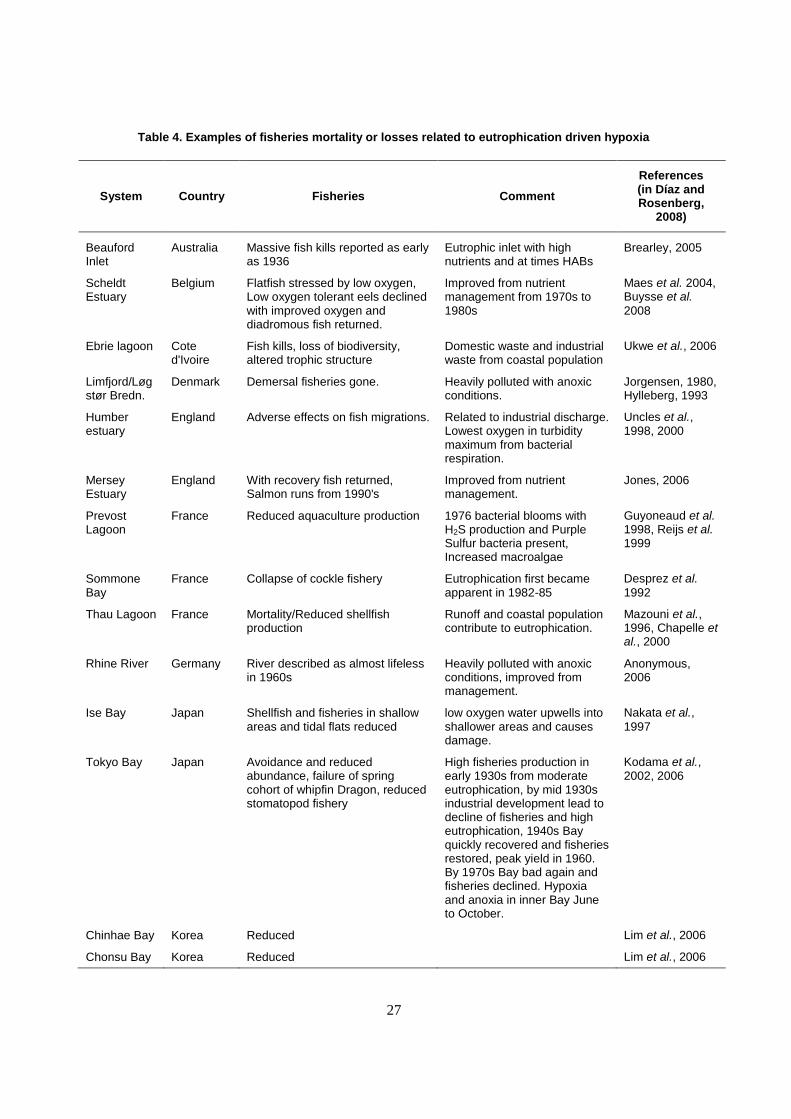
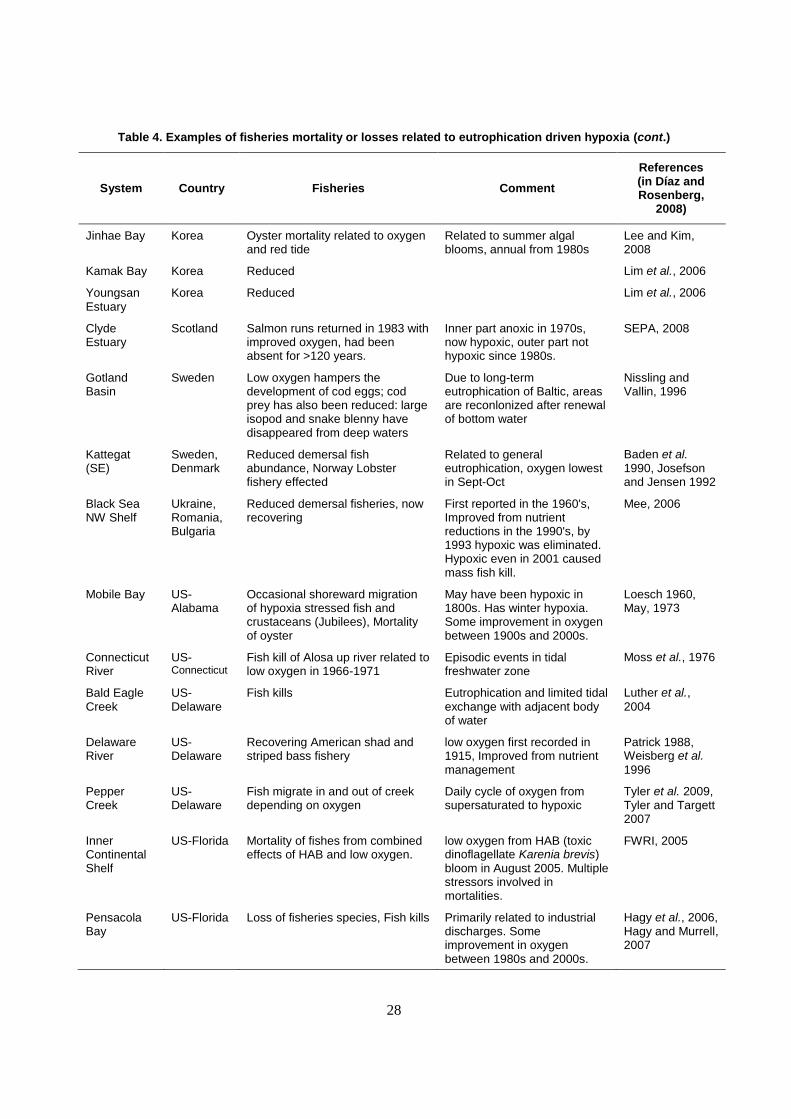
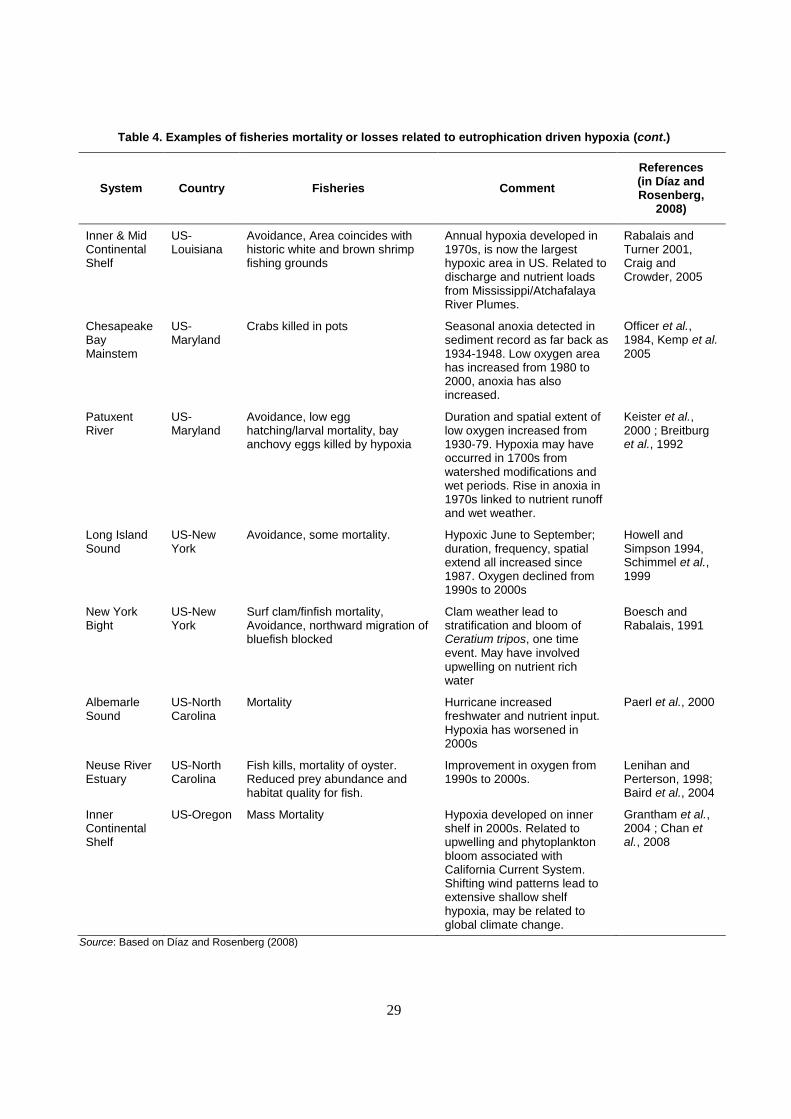
eutrophication driven hypoxia (Table 4).
Unless stress on nonprovisioning ecosystem services can be lessened, for example through ecosystem
based management, there will likely be declines in food provisioning services from aquaculture with
negative economic consequences. The effects of eutrophication vary from system to system, and there are
accounts of loss of aquaculture production, and presumably loss of economic value, related to failure of
supporting ecosystem services. For example, general eutrophication of coastal lagoons on the French
Mediterranean coast has deteriorated water quality and at times led to the develop hypoxia. This in turn has
reduced the lagoon systems supporting ecosystem services and lowered the production potential for
aquaculture, in, for example, Thau Lagoon (Mazouni et al., 1996). Combinations of stressors from
agriculture, and municipal and industrial wastewater put greater pressure on ecosystem services but
provisioning by aquaculture may not be negatively affected, as in Lake Saroma, Japan and Saldanha Bay,
South Africa, where there are accounts of ecosystem degeneration but aquaculture production does not
appear affected (Table 4). Even at sub-optimal levels of dissolved oxygen that are not near hypoxic, there
can be reductions in growth of cultured salmon (Page et al., 2005). From the beginning of fish aquaculture
dissolved oxygen was recognized as a limiting factor and many cultured species were selected because of
their tolerance to low dissolved oxygen. For example, carp (Carassius spp.) can survive months of hypoxia
and is possibly the most anoxia-tolerant vertebrate (Nilson and Renshaw, 2004).
27
Table 4. Examples of fisheries mortality or losses related to eutrophication driven hypoxia
System Country Fisheries Comment
References (in Díaz and Rosenberg,
2008)
Beauford Inlet
Australia Massive fish kills reported as early as 1936
Eutrophic inlet with high nutrients and at times HABs
Brearley, 2005
Scheldt Estuary
Belgium Flatfish stressed by low oxygen, Low oxygen tolerant eels declined with improved oxygen and diadromous fish returned.
Improved from nutrient management from 1970s to 1980s
Maes et al. 2004, Buysse et al.
2008
Ebrie lagoon Cote d'Ivoire
Fish kills, loss of biodiversity, altered trophic structure
Domestic waste and industrial waste from coastal population
Ukwe et al., 2006
Limfjord/Løgstør Bredn.
Denmark Demersal fisheries gone. Heavily polluted with anoxic conditions.
Jorgensen, 1980, Hylleberg, 1993
Humber estuary
England Adverse effects on fish migrations. Related to industrial discharge. Lowest oxygen in turbidity maximum from bacterial respiration.
Uncles et al., 1998, 2000
Mersey Estuary
England With recovery fish returned, Salmon runs from 1990's
Improved from nutrient management.
Jones, 2006
Prevost Lagoon
France Reduced aquaculture production 1976 bacterial blooms with H2S production and Purple Sulfur bacteria present, Increased macroalgae
Guyoneaud et al. 1998, Reijs et al. 1999
Sommone Bay
France Collapse of cockle fishery Eutrophication first became apparent in 1982-85
Desprez et al.
1992
Thau Lagoon France Mortality/Reduced shellfish production
Runoff and coastal population contribute to eutrophication.
Mazouni et al., 1996, Chapelle et al., 2000
Rhine River Germany River described as almost lifeless in 1960s
Heavily polluted with anoxic conditions, improved from management.
Anonymous, 2006
Ise Bay Japan Shellfish and fisheries in shallow areas and tidal flats reduced
low oxygen water upwells into shallower areas and causes damage.
Nakata et al.,
1997
Tokyo Bay Japan Avoidance and reduced abundance, failure of spring cohort of whipfin Dragon, reduced stomatopod fishery
High fisheries production in early 1930s from moderate eutrophication, by mid 1930s industrial development lead to decline of fisheries and high eutrophication, 1940s Bay quickly recovered and fisheries restored, peak yield in 1960. By 1970s Bay bad again and fisheries declined. Hypoxia and anoxia in inner Bay June to October.
Kodama et al., 2002, 2006
Chinhae Bay Korea Reduced Lim et al., 2006
Chonsu Bay Korea Reduced Lim et al., 2006
28
Table 4. Examples of fisheries mortality or losses related to eutrophication driven hypoxia (cont.)
System Country Fisheries Comment
References (in Díaz and Rosenberg,
2008)
Jinhae Bay Korea Oyster mortality related to oxygen and red tide
Related to summer algal blooms, annual from 1980s
Lee and Kim, 2008
Kamak Bay Korea Reduced Lim et al., 2006
Youngsan Estuary
Korea Reduced Lim et al., 2006
Clyde Estuary
Scotland Salmon runs returned in 1983 with improved oxygen, had been absent for >120 years.
Inner part anoxic in 1970s, now hypoxic, outer part not hypoxic since 1980s.
SEPA, 2008
Gotland Basin
Sweden Low oxygen hampers the development of cod eggs; cod prey has also been reduced: large isopod and snake blenny have disappeared from deep waters
Due to long-term eutrophication of Baltic, areas are reconlonized after renewal of bottom water
Nissling and Vallin, 1996
Kattegat (SE)
Sweden, Denmark
Reduced demersal fish abundance, Norway Lobster fishery effected
Related to general eutrophication, oxygen lowest in Sept-Oct
Baden et al. 1990, Josefson and Jensen 1992
Black Sea NW Shelf
Ukraine, Romania, Bulgaria
Reduced demersal fisheries, now recovering
First reported in the 1960's, Improved from nutrient reductions in the 1990's, by 1993 hypoxic was eliminated. Hypoxic even in 2001 caused mass fish kill.
Mee, 2006
Mobile Bay US-Alabama
Occasional shoreward migration of hypoxia stressed fish and crustaceans (Jubilees), Mortality of oyster
May have been hypoxic in 1800s. Has winter hypoxia. Some improvement in oxygen between 1900s and 2000s.
Loesch 1960, May, 1973
Connecticut River
US-Connecticut
Fish kill of Alosa up river related to low oxygen in 1966-1971
Episodic events in tidal freshwater zone
Moss et al., 1976
Bald Eagle Creek
US-Delaware
Fish kills Eutrophication and limited tidal exchange with adjacent body of water
Luther et al.,
2004
Delaware River
US-Delaware
Recovering American shad and striped bass fishery
low oxygen first recorded in 1915, Improved from nutrient management
Patrick 1988, Weisberg et al.
1996
Pepper Creek
US-Delaware
Fish migrate in and out of creek depending on oxygen
Daily cycle of oxygen from supersaturated to hypoxic
Tyler et al. 2009, Tyler and Targett 2007
Inner Continental Shelf
US-Florida Mortality of fishes from combined effects of HAB and low oxygen.
low oxygen from HAB (toxic dinoflagellate Karenia brevis) bloom in August 2005. Multiple stressors involved in mortalities.
FWRI, 2005
Pensacola Bay
US-Florida Loss of fisheries species, Fish kills Primarily related to industrial discharges. Some improvement in oxygen between 1980s and 2000s.
Hagy et al., 2006, Hagy and Murrell, 2007
29
Table 4. Examples of fisheries mortality or losses related to eutrophication driven hypoxia (cont.)
System Country Fisheries Comment
References (in Díaz and Rosenberg,
2008)
Inner & Mid Continental Shelf
US-Louisiana
Avoidance, Area coincides with historic white and brown shrimp fishing grounds
Annual hypoxia developed in 1970s, is now the largest hypoxic area in US. Related to discharge and nutrient loads from Mississippi/Atchafalaya River Plumes.
Rabalais and Turner 2001, Craig and Crowder, 2005
Chesapeake Bay Mainstem
US-Maryland
Crabs killed in pots Seasonal anoxia detected in sediment record as far back as 1934-1948. Low oxygen area has increased from 1980 to 2000, anoxia has also increased.
Officer et al., 1984, Kemp et al.
2005
Patuxent River
US-Maryland
Avoidance, low egg hatching/larval mortality, bay anchovy eggs killed by hypoxia
Duration and spatial extent of low oxygen increased from 1930-79. Hypoxia may have occurred in 1700s from watershed modifications and wet periods. Rise in anoxia in 1970s linked to nutrient runoff and wet weather.
Keister et al., 2000 ; Breitburg et al., 1992
Long Island Sound
US-New York
Avoidance, some mortality. Hypoxic June to September; duration, frequency, spatial extend all increased since 1987. Oxygen declined from 1990s to 2000s
Howell and Simpson 1994, Schimmel et al., 1999
New York Bight
US-New York
Surf clam/finfish mortality, Avoidance, northward migration of bluefish blocked
Clam weather lead to stratification and bloom of Ceratium tripos, one time event. May have involved upwelling on nutrient rich water
Boesch and Rabalais, 1991
Albemarle Sound
US-North Carolina
Mortality Hurricane increased freshwater and nutrient input. Hypoxia has worsened in 2000s
Paerl et al., 2000
Neuse River Estuary
US-North Carolina
Fish kills, mortality of oyster. Reduced prey abundance and habitat quality for fish.
Improvement in oxygen from 1990s to 2000s.
Lenihan and Perterson, 1998; Baird et al., 2004
Inner Continental Shelf
US-Oregon Mass Mortality Hypoxia developed on inner shelf in 2000s. Related to upwelling and phytoplankton bloom associated with California Current System. Shifting wind patterns lead to extensive shallow shelf hypoxia, may be related to global climate change.
Grantham et al., 2004 ; Chan et al., 2008
Source: Based on Díaz and Rosenberg (2008)
30
7.1 Cost of lost ecosystem services
The Millennium Ecosystem Assessment (MA, 2005) documented the importance of ecosystem
services to humans and how losses and degradation of these services was occurring, primarily through
unsustainable human activity. The valuation of these services is difficult in terms of either monetary costs
or nonmarket ecological costs. Costanza et al. (1997) estimated ecosystems to provide at least USD 33
trillion (in 1994 USD) worth of provisioning and supporting services annually. The majority of this value
is outside the market system, in services such as gas regulation (USD 1.3 trillion/yr), disturbance
regulation (USD 1.8 trillion/yr), waste treatment (USD 2.3 trillion/yr) and nutrient cycling
(USD 17 trillion/yr). About 63% of the estimated value is contributed by marine systems (USD 20.9
trillion/yr). Most of this comes from coastal systems (USD 10.6 trillion/yr). About 38% of the estimated
value comes from terrestrial systems, mainly from forests (USD 4.7 trillion/yr) and wetlands
(USD 4.9 trillion/yr) (Costanza et al., 1997). Sustainability of food provisioning services require that
supporting services be maintained as a sort of natural capital. In this sense ecosystem services are
complementary rather than substitutable (Costanza and Daly, 1992).
Aquaculture production will be particularly sensitive to loss of ecosystem services from
eutrophication. The primary ecosystem services needed by aquaculture are:
Regulating Services:
Water purification and waste treatment
Biological control, trophic structure
Supporting Services:
Nutrient cycling
Habitat
These are also the ecosystem services most affected by eutrophication and the development of
hypoxia. Significant reductions in any of these four services will reduce or eliminate aquaculture
productivity, and other ecosystem services and functions. To investigate the cost of lost ecosystem services
to aquaculture productivity will require data on the number, size, and area of aquaculture facilities. The
area of ecosystems affected by other stressors that reduce services will also need to be accounted for. The
values assigned to ecosystem services by Costanza et al. (1997) are a first approximation of their relative
magnitude (Table 5). As such, the valuation should be interpreted with caution, but these estimates do
show that there are significant externalities associated with environmental stressors.
Current estimates are that hypoxia related to eutrophication annually affects at least 240 000 km2
globally (Díaz and Rosenberg, 2008). About 70 000 km2 are inshore (estuarine/brackish waters and
embayments), and about 170 000 km2 are coastal offshore waters. There is also another 1.1 million km
2 of
outer continental shelf bottom area affected by natural oxygen minimum zones (Helly and Levin, 2004). In
total, about 4% of estuarine/brackish water and about 5% of shelf area are affected globally by hypoxia of
some type. This translates to losses in ecosystem services in the billions of USD (Table 5).
The value lost highlights the importance of developing sustainability in agriculture through an
ecosystem-based management approach that considers land-sea interactions. Integration of aquaculture into
management plans, especially multiculture of species that can lessen impacts of land based activities offers
the possibility of offsetting declines or even increasing the value of nutrient cycling services by removal of
nutrients and organic matter as cultured species biomass.
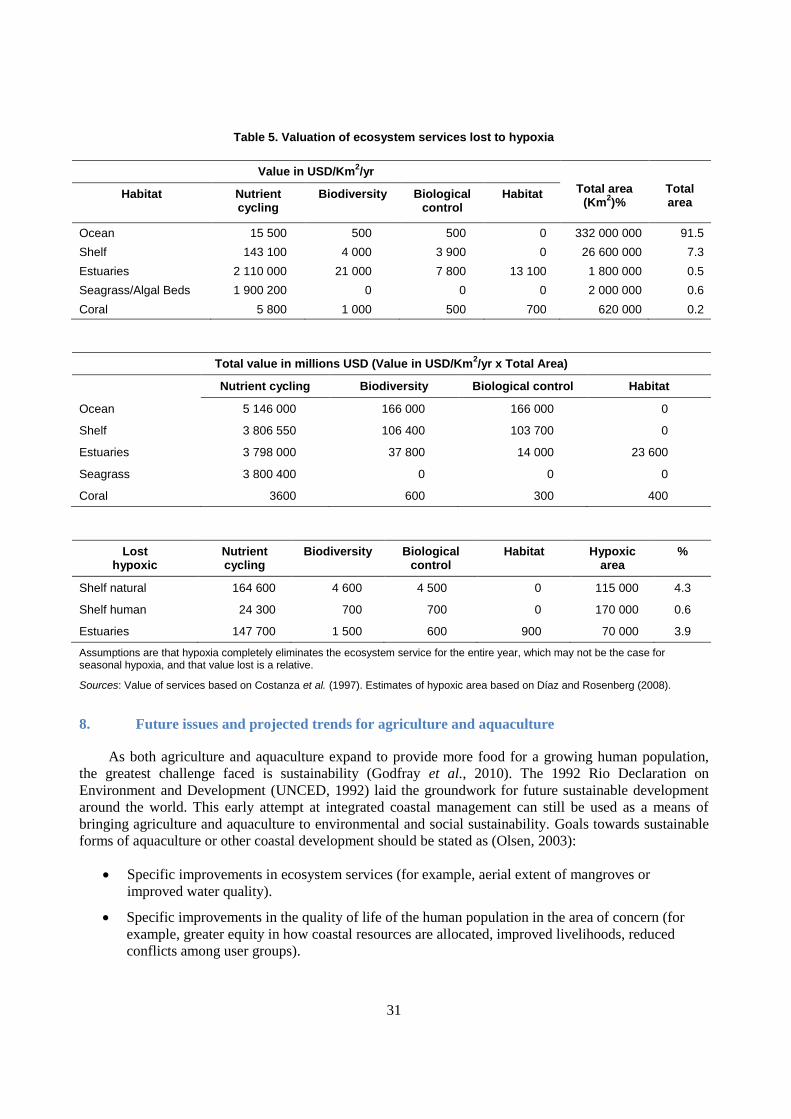
31
Table 5. Valuation of ecosystem services lost to hypoxia
Value in USD/Km2/yr
Total area (Km
2)%
Total area
Habitat Nutrient cycling
Biodiversity Biological control
Habitat
Ocean 15 500 500 500 0 332 000 000 91.5
Shelf 143 100 4 000 3 900 0 26 600 000 7.3
Estuaries 2 110 000 21 000 7 800 13 100 1 800 000 0.5
Seagrass/Algal Beds 1 900 200 0 0 0 2 000 000 0.6
Coral 5 800 1 000 500 700 620 000 0.2
Total value in millions USD (Value in USD/Km2/yr x Total Area)
Nutrient cycling Biodiversity Biological control Habitat
Ocean 5 146 000 166 000 166 000 0
Shelf 3 806 550 106 400 103 700 0
Estuaries 3 798 000 37 800 14 000 23 600
Seagrass 3 800 400 0 0 0
Coral 3600 600 300 400
Lost hypoxic
Nutrient cycling
Biodiversity Biological control
Habitat Hypoxic area
%
Shelf natural 164 600 4 600 4 500 0 115 000 4.3
Shelf human 24 300 700 700 0 170 000 0.6
Estuaries 147 700 1 500 600 900 70 000 3.9
Assumptions are that hypoxia completely eliminates the ecosystem service for the entire year, which may not be the case for seasonal hypoxia, and that value lost is a relative.
Sources: Value of services based on Costanza et al. (1997). Estimates of hypoxic area based on Díaz and Rosenberg (2008).
8. Future issues and projected trends for agriculture and aquaculture
As both agriculture and aquaculture expand to provide more food for a growing human population,
the greatest challenge faced is sustainability (Godfray et al., 2010). The 1992 Rio Declaration on
Environment and Development (UNCED, 1992) laid the groundwork for future sustainable development
around the world. This early attempt at integrated coastal management can still be used as a means of
bringing agriculture and aquaculture to environmental and social sustainability. Goals towards sustainable
forms of aquaculture or other coastal development should be stated as (Olsen, 2003):
Specific improvements in ecosystem services (for example, aerial extent of mangroves or
improved water quality).
Specific improvements in the quality of life of the human population in the area of concern (for
example, greater equity in how coastal resources are allocated, improved livelihoods, reduced
conflicts among user groups).
32
Olsen (2003) proposed four orders of outcomes that group sequences of institutional, behavioral and
social/environmental changes that can lead to more sustainable forms of coastal development.
One problem with making adjustments to optimize sustainability is that generally, the institutions that
should be involved in discussions are often separate entities with separate mandates, such as ministries of
agriculture and the environment. This is a central impediment to rational decision-making in the ecosystem
service context that must be overcome (Mooney, 2010). A much tighter coupling of science, policy, and
management will be required to control and reverse the negative effects of agriculture on ecosystem
services.
Lack of management of nonpoint nutrient loadings is the main factor fueling the expanding number of
dead zones. The challenge will be to reduce nutrient loads reaching our coastal systems by increasing the
efficiency of agriculture and restoring landscapes. As with climate change and increasing atmospheric
CO2, the time to act to reduce excess nitrogen and phosphorus is now. More people require more
provisioning services of food, fuel, and fiber. So problems with oxygen in our coastal seas will not solve
themselves. There is growing evidence that delays in reducing nutrient loads to marine systems will be
increasingly costly to both humans and ecosystems. Over the years, the accumulation of organic matter and
nutrients within ecosystems has set the stage for shifts that led to more hypoxia for a given input of
additional nutrients. Once past this tipping point, greater reductions in nutrients will be required to control
dead zone formation and reduce their size (Turner et al., 2008). In addition, systems may not recover along
the same trajectory as they degrade and may take many years to recover altered ecosystem services and
functions (Duarte and Conley 2009, Kemp et al., 2010).
8.1 Projected impact of climate change
Superimposed on the immediate environmental issues related to eutrophication from export of
agricultural nutrients to coastal waters is global climate change. The world‟s climate has changed and
human activities will continue to contribute to the acceleration of greenhouse gases and temperature rise.
The regional outcomes of the various global climate change scenarios (IPCC, 2007) will be manifested in
many different and synergistic effects on various components of ecosystems. Policy decisions, such as
incentives to use food crops for production of biofuels, will contribute to the expansion of agriculture and
eutrophication of marine waters (Costello et al., 2009; UNEP, 2009). Climate change effects will be
difficult to detect in the near-term because they currently exist within the „background‟ variability inherent
in estuarine and marine systems as a result of both natural and anthropogenic forces (Díaz and Breitburg,
2009; Rabalais et al., 2009, 2010).
Generally perceived as having mostly negative impacts, climate change provides an additional reason
for agriculture and aquaculture to move towards sustainability. The positive side of climate change appears
to be limited to expanding suitable habitat area for tropical and temperate species as temperatures increase,
and possibly higher metabolism and growth. But for cold-water boreal species, higher temperatures will
lead to habitat squeeze and contraction of range to higher and higher latitudes.
The primary negative impacts for aquaculture will be from the combined effects of climate change
and expanding agriculture (Figure 6) because increased temperatures increase both hypoxia and oxygen
requirements of many organisms. Increased water temperatures decrease oxygen solubility and increase
microbial respiration that consumes dissolved oxygen. Oxygen concentrations in the Danish straits
declined 0.238 (±0.084) mg O2/l/oC from 1965 to 2003 as temperatures rose (about 2
oC rise over the
period) (Conley et al. 2007). This decline in oxygen was very close to the predicted effect of temperature
on the solubility of oxygen (approximately -0.26 mg O2/l/oC). By the end of this century, a 4
oC rise in
temperature would reduce oxygen by another 0.952 mg O2/l (Conley et al., 2009) and would severely
impact aquaculture and capture fisheries in the Danish straits. In addition to lower concentrations of
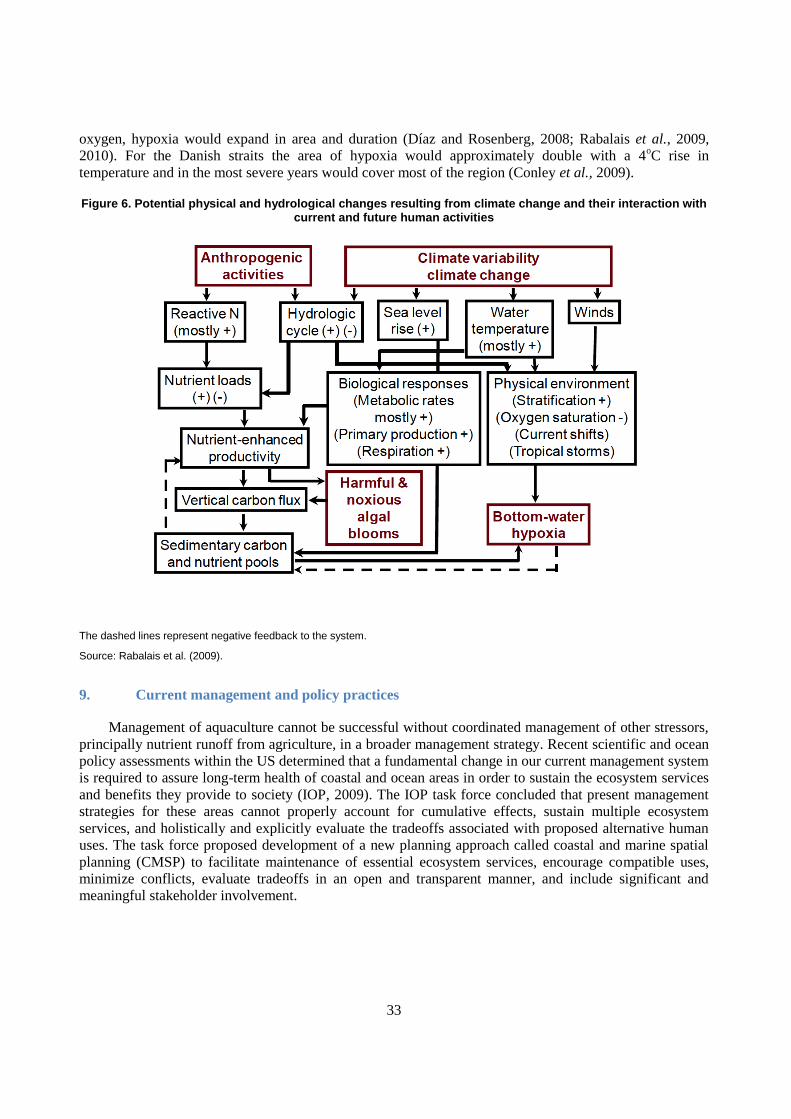
33
oxygen, hypoxia would expand in area and duration (Díaz and Rosenberg, 2008; Rabalais et al., 2009,
2010). For the Danish straits the area of hypoxia would approximately double with a 4oC rise in
temperature and in the most severe years would cover most of the region (Conley et al., 2009).
Figure 6. Potential physical and hydrological changes resulting from climate change and their interaction with current and future human activities
The dashed lines represent negative feedback to the system.
Source: Rabalais et al. (2009).
9. Current management and policy practices
Management of aquaculture cannot be successful without coordinated management of other stressors,
principally nutrient runoff from agriculture, in a broader management strategy. Recent scientific and ocean
policy assessments within the US determined that a fundamental change in our current management system
is required to assure long-term health of coastal and ocean areas in order to sustain the ecosystem services
and benefits they provide to society (IOP, 2009). The IOP task force concluded that present management
strategies for these areas cannot properly account for cumulative effects, sustain multiple ecosystem
services, and holistically and explicitly evaluate the tradeoffs associated with proposed alternative human
uses. The task force proposed development of a new planning approach called coastal and marine spatial
planning (CMSP) to facilitate maintenance of essential ecosystem services, encourage compatible uses,
minimize conflicts, evaluate tradeoffs in an open and transparent manner, and include significant and
meaningful stakeholder involvement.
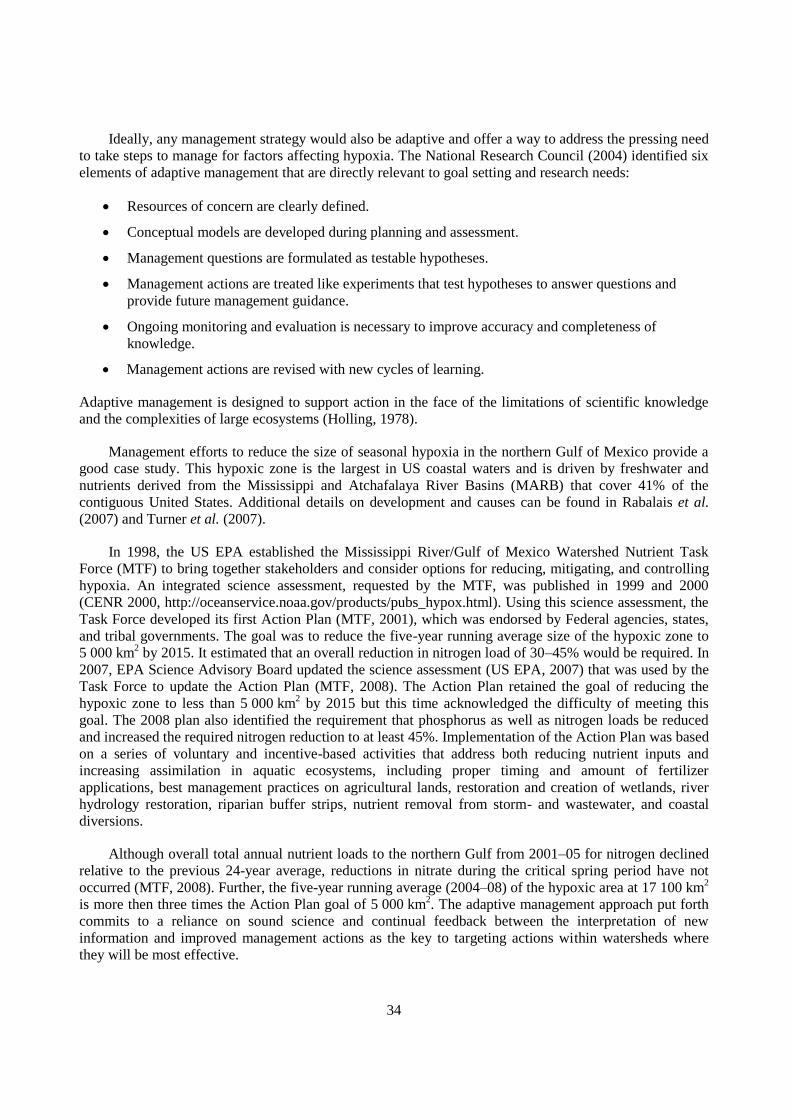
34
Ideally, any management strategy would also be adaptive and offer a way to address the pressing need
to take steps to manage for factors affecting hypoxia. The National Research Council (2004) identified six
elements of adaptive management that are directly relevant to goal setting and research needs:
Resources of concern are clearly defined.
Conceptual models are developed during planning and assessment.
Management questions are formulated as testable hypotheses.
Management actions are treated like experiments that test hypotheses to answer questions and
provide future management guidance.
Ongoing monitoring and evaluation is necessary to improve accuracy and completeness of
knowledge.
Management actions are revised with new cycles of learning.
Adaptive management is designed to support action in the face of the limitations of scientific knowledge
and the complexities of large ecosystems (Holling, 1978).
Management efforts to reduce the size of seasonal hypoxia in the northern Gulf of Mexico provide a
good case study. This hypoxic zone is the largest in US coastal waters and is driven by freshwater and
nutrients derived from the Mississippi and Atchafalaya River Basins (MARB) that cover 41% of the
contiguous United States. Additional details on development and causes can be found in Rabalais et al.
(2007) and Turner et al. (2007).
In 1998, the US EPA established the Mississippi River/Gulf of Mexico Watershed Nutrient Task
Force (MTF) to bring together stakeholders and consider options for reducing, mitigating, and controlling
hypoxia. An integrated science assessment, requested by the MTF, was published in 1999 and 2000
(CENR 2000, http://oceanservice.noaa.gov/products/pubs_hypox.html). Using this science assessment, the
Task Force developed its first Action Plan (MTF, 2001), which was endorsed by Federal agencies, states,
and tribal governments. The goal was to reduce the five-year running average size of the hypoxic zone to
5 000 km2 by 2015. It estimated that an overall reduction in nitrogen load of 30–45% would be required. In
2007, EPA Science Advisory Board updated the science assessment (US EPA, 2007) that was used by the
Task Force to update the Action Plan (MTF, 2008). The Action Plan retained the goal of reducing the
hypoxic zone to less than 5 000 km2 by 2015 but this time acknowledged the difficulty of meeting this
goal. The 2008 plan also identified the requirement that phosphorus as well as nitrogen loads be reduced
and increased the required nitrogen reduction to at least 45%. Implementation of the Action Plan was based
on a series of voluntary and incentive-based activities that address both reducing nutrient inputs and
increasing assimilation in aquatic ecosystems, including proper timing and amount of fertilizer
applications, best management practices on agricultural lands, restoration and creation of wetlands, river
hydrology restoration, riparian buffer strips, nutrient removal from storm- and wastewater, and coastal
diversions.
Although overall total annual nutrient loads to the northern Gulf from 2001–05 for nitrogen declined
relative to the previous 24-year average, reductions in nitrate during the critical spring period have not
occurred (MTF, 2008). Further, the five-year running average (2004–08) of the hypoxic area at 17 100 km2
is more then three times the Action Plan goal of 5 000 km2. The adaptive management approach put forth
commits to a reliance on sound science and continual feedback between the interpretation of new
information and improved management actions as the key to targeting actions within watersheds where
they will be most effective.
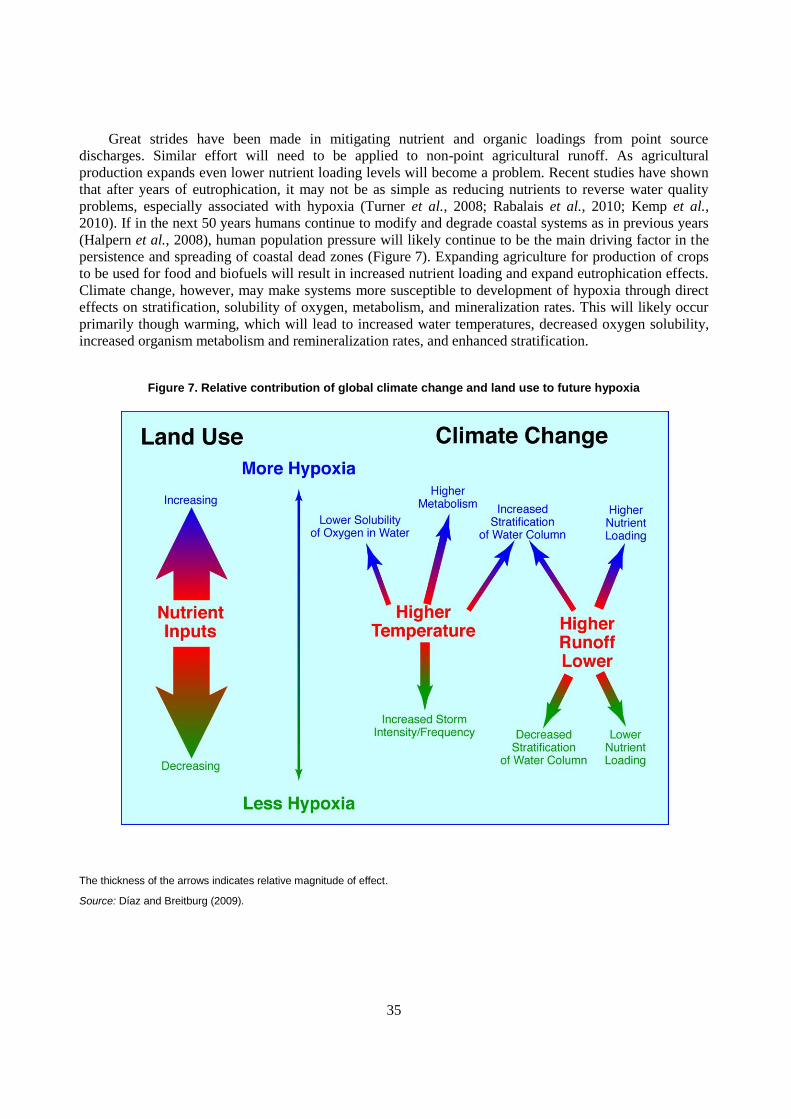
35
Great strides have been made in mitigating nutrient and organic loadings from point source
discharges. Similar effort will need to be applied to non-point agricultural runoff. As agricultural
production expands even lower nutrient loading levels will become a problem. Recent studies have shown
that after years of eutrophication, it may not be as simple as reducing nutrients to reverse water quality
problems, especially associated with hypoxia (Turner et al., 2008; Rabalais et al., 2010; Kemp et al.,
2010). If in the next 50 years humans continue to modify and degrade coastal systems as in previous years
(Halpern et al., 2008), human population pressure will likely continue to be the main driving factor in the
persistence and spreading of coastal dead zones (Figure 7). Expanding agriculture for production of crops
to be used for food and biofuels will result in increased nutrient loading and expand eutrophication effects.
Climate change, however, may make systems more susceptible to development of hypoxia through direct
effects on stratification, solubility of oxygen, metabolism, and mineralization rates. This will likely occur
primarily though warming, which will lead to increased water temperatures, decreased oxygen solubility,
increased organism metabolism and remineralization rates, and enhanced stratification.
Figure 7. Relative contribution of global climate change and land use to future hypoxia
The thickness of the arrows indicates relative magnitude of effect.
Source: Díaz and Breitburg (2009).
36
REFERENCES
Andrews, M.J., D.G. Rickard (1980), Rehabilitation of the inner Thames estuary. Marine Pollution
Bulletin 11: 327–332.
Aumann, C.A., L.A. Eby and W.F. Fagan (2006), How transient patches affect population dynamics: the
case of hypoxia and blue crabs. Ecological Monographs 76: 415–38.
Azarovitz, T.R., C.J. Byrne, M.J. Silverman, B.L. Freeman, W.G. Smith, S.C. Turner, B.A. Halgren and
P.J. Festa (1979), Effects on finfish and lobster. In: Oxygen depletion and associated benthic
moralities in New York Bight, 1976. R.L. Swanson and C.J. Sindermann (eds.). NOAA Professional
Paper 11, pp. 295-314.
Baird, D. and R. E. Ulanowicz (1989), The seasonal dynamics of the Chesapeake Bay ecosystem.
Ecological Monographs 59: 329-364.
Baird, D., R.R. Christian, C.H. Peterson and G.A. Johnson (2004), Consequences of hypoxia on estuarine
ecosystem function: Energy diversion from consumers to microbes. Ecological Applications 14:
805-822.
Bonsdorff, E., Blomqvist, E.M., Mattila, J. and Norkko, A. (1997), Coastal eutrophication: causes,
consequences and perspectives in the archipelago areas of the northern Baltic Sea. Estuarine,
Coastal and Shelf Science 44: 63-72.
Brandt, S.B. and D.M. Mason (1994), Landscape approaches for assessing spatial patterns in fish foraging
and growth. In: Stouder, D. J., K. L. Fresh and R. J. Feller (eds), Theory and Application of Fish
Feeding Ecology. University of South Carolina Press, Columbia, SC. pp. 211–240.
Breitburg, D.L. (2002), Effects of hypoxia, and the balance between hypoxia and enrichment, on coastal
fishes and fisheries. Estuaries 25: 767-781.
Breitburg, D.L. and G.F. Riedel (2005), Multiple stressors in marine systems. In: Norse, E.A. and L.B.
Crowder (eds), Marine Conservation Biology: The Science of Maintaining the Sea‟s Biodiversity.
Island Press, Washington, DC. pp. 167–182.
Breitburg, D. L., D.W. Hondorp, L.W. Davias and R.J. Díaz (2009), Hypoxia, nitrogen and fisheries
Integrating effects across local and global landscapes. Annual Review Marine Science 1: 329–350.
Bricker, S., B. Longstaff, W. Dennison, A. Jones, K. Boicourt, C. Wicks, J. Woerner. (2007) Effects of
Nutrient Enrichment In the Nation‟s Estuaries: A Decade of Change. NOAA Coastal Ocean Program
Decision Analysis Series No. 26. National Centers for Coastal Ocean Science, Silver Spring,
Maryland. 328 p.
Bruslé, J. (1995), The impact of harmful algal blooms on finfish. Mortality, pathology and toxicology. 6th
Conférence Internationale Sur Le Phytoplancton Marin, Nantes, 18-22 Octobre 1993. IFREMER,
Plouzane. The impact of harmful algal blooms on finfish: occurrence of fish kills, pathology,
toxicological mechanisms, ecological and economic impacts. A review. 75 p.
Caddy, J. F. (1993), Towards a comparative evaluation of human impacts on fishery ecosystems of
enclosed and semi-enclosed seas. Review of Fisheries Science 1: 57–95.
37
Cardinale M. and J. Modin (1999), Changes in size-at-maturity of Baltic cod (Gadus morhua) during a
period of large variations in stock size and environmental conditions. Fisheries Research 41: 285–
95.
CENR (Committee on Environment and Natural Resources) (2000), Integrated Assessment of Hypoxia in
the Northern Gulf of Mexico. National Science and Technology Council Committee on Environment
and Natural Resources, Washington, D.C.
Chabot, D. and J.-D. Dutil (1999), Reduced growth of Atlantic cod in non-lethal hypoxic conditions.
Journal Fish Biology 55: 472–491.
Cloern, J.E. (2001), Our evolving conceptual model of the coastal eutrophication problem. Marine
Ecology-Progress Series 210: 223-253.
Conley, D. J.; C. Humborg; L. Rahm; O.P. Savchuk and F. Wulff (2002), Hypoxia in the Baltic Sea and
basin-scale changes in phosphorus biogeochemistry. Environmental Science and Technology 36:
5315–5320.
Conley, D.J.; J. Carstensen; G. Ærtebjerg; P.B. Christensen; T. Dalsgaard; J.L.S. Hansen and A.B.
Josefson (2007), Long-term changes and impacts of hypoxia in Danish coastal waters. Ecological
Applications 17: S165–S184.
Conley, D.J.; J. Carstensen; R. Vaquer-Sunyer and C.M. Duarte (2009), Ecosystem thresholds with
hypoxia. Hydrobiologia 629: 21-29.
Costa-Pierce, B. (2008), An ecosystem approach to marine aquaculture: A global review. In: D. Soto, J.
Aquilar-Manjarrez and N. Hishamunda (eds.). Building an ecosystem approach to aquaculture. FAO,
Universitat de les Illes Balears Experts Workshop. 7-11 May 2007, Palma de Mallorca Spain. FAO
Fisheries and Aquaculture Proceedings. No. 14, Rome. pp. 81-115.
Costanza, R. and H. Daly (1992), Natural capital and sustainable development. Conservation Biology 6:
37–46.
Costanza, R.; R. d‟Arge; R. de Groot; S. Farber; M. Grasso; B. Hannon; S. Naeem; K. Limburg; J. Paruelo;
R.V. O‟Neill; R. Raskin; P. Sutton and M. van den Belt (1997), The value of the world‟s ecosystem
services and natural capital. Nature 387: 253–260.
Costello, C., W.M. Griffin, A.E. Landis and Matthews, H.S. (2009), Impact of biofuel crop production on
the formation of hypoxia in the Gulf of Mexico. Environmental Science and Technology 43: 7985–
7991.
Coutant, C.C. (1985), Striped bass, temperature, and dissolved oxygen: a speculative hypothesis for
environmental risk. Transactions of the American Fisheries Society 114: 31–61.
Craig, J.K. and L.B. Crowder (2005), Hypoxia-induced habitat shifts and energetic consequences in
Atlantic croaker and brown shrimp on the Gulf of Mexico shelf. Marine Ecology Progress Series
294: 79-94.
Craig, J.K., L.B. Crowder and T.A. Henwood (2005), Spatial distribution of brown shrimp
(Farfantepanaeus aztecus) on the northwestern Gulf of Mexico shelf: effects of abundance and
hypoxia. Canadian Journal of Fisheries and Aquatic Science 62: 1295-1308.
Crawford, C.M., C.K. Macleod and I.M. Mitchell (2003), Effects of shellfish farming on the benthic
environment. Aquaculture 224: 117-140.
Dame, R.F. (1996), Ecology of marine bivalves: an ecosystem approach. CRC Press, Boca Raton, Florida.
254 p.
38
Dasgupta, P. (2010), Nature‟s role in sustaining economic development. Philosophical Transactions of the
Royal Society B 365: 5-11.
Díaz, R. J. and Breitburg, D. L. (2009), The hypoxic environment, in: Fish Physiology, Richards, J.G.,
Farrell, A.P. and Brauner, C.J. (eds). Vol. 27, Academic Press, Burlington, pp. 1–23.
Díaz, R.J. and R. Rosenberg (1995), Marine benthic hypoxia: A review of its ecological effects and the
behavioural responses of benthic macrofauna. Oceanography and Marine Biology, an Annual
Review 33: 245-303.
Díaz, R.J. and R. Rosenberg (2008), Spreading dead zones and consequences for marine ecosystems.
Science 321: 926-928.
Díaz, R.J. and L.C. Schaffner (1990), The functional role of estuarine benthos. p. 25-56. In: M. Haire and
E.C. Krome (eds.). Perspectives on the Chesapeake Bay, 1990. Advances in estuarine sciences. Rpt.
No. CBP/TRS41/90. Chesapeake Research Consortium, Gloucester Pt., Virginia.
Duarte, C.M. and Conley, D.J. (2009), Return to neverland: shifting baselines affect eutrophication
restoration targets. Estuaries and Coasts 32: 29-36.
Dutil, J.-D., E.-L. Sylvestre, L. Gamache, R. Larocque and H. Guderley (2007), Burst and coast use,
swimming performance and metabolism of Atlantic cod Gadus morhua in sublethal hypoxic
conditions. Journal of Fish Biology 71: 363–75.
Eby, L.A. and L.B. Crowder (2004), Effects of hypoxic disturbances on an estuarine nekton assemblage
across multiple scales. Estuaries 27: 342-351.
Elmgren, R. (1989), Man's impact on the ecosystem of the Baltic Sea: Energy flows today and at the turn
of the century, Ambio 18: 326-332.
Fallesen, G., F. Andersen and B. Larsen (2000), Life, death and revival of the hypertrophic Mariager Fjord,
Denmark. Journal of Marine Systems 25: 313-321.
FAO (Food and Agriculture Organization of the United Nations) (2009), The state of world fisheries and
aquaculture 2008. ISSN 1020-5489, Rome, Italy. 196 p.
Foley, J.A., R. DeFrie, G.P. Asner, C. Barford, G. Bonan, S.R. Carpenter, F.S. Chapin, M.T. Coe, G.C.
Daily, H.K. Gibbs, J.H. Helkowski, T. Holloway, T., Howard, E.A., Kucharik, C.J., Monfreda, C.,
Patz, J.A., Prentice, I.C., Ramankutty, N. and Snyder, P.K. (2005), Global consequences of land use.
Science 309: 570-574.
Graham, J.B. (1990), Ecological, evolutionary, and physical factors influencing aquatic animal respiration.
American Zoologist 30: 137–146.
Galloway, J.N., Dentener, F.J., Capone, D.G., Boyer, E.W., Howarth, R.W., Seitzinger, S.P., Asner, G.P.,
Cleveland, C.C., Green, P.A., Holland, E.A., Karl, D.M., Michaels, A.F., Porter, J.H., Townsend,
A.R., and VöRöSmarty, C.J. (2004), Nitrogen cycles: past, present, and future. Biogeochemistry 70:
153-226.
Galloway, J. N., Townsend, A. R., Erisman, J. W., Bekunda, M., Cai, Z., Freney, J. R., Martinelli, L. A.,
Seitzinger, S. P., and Sutton, M. A. (2008), Transformation of the nitrogen cycle Recent trends,
questions, and potential solutions. Science 320: 889–892.
Gilbert, D., Rabalais, N. N., Díaz, R. J. and Zhang, J. (2009), Evidence for greater oxygen decline rates in
the coastal ocean than in the open ocean. Biogeosciences Discussion 6: 9127–9160.
Godbold, J.A. and Solan, M. (2009), Relative importance of biodiversity and the abiotic environment in
mediating an ecosystem process. Marine Ecology Progress Series 396: 281-290.
39
H.C.J. Godfray, J.R. Beddington, I.R. Crute, L. Haddad, D. Lawrence, J.F. Muir, J. Pretty, S. Robinson,
S.M. Thomas, and C. Toulmin (2010), Food Security: The Challenge of Feeding 9 Billion People.
Science 327: 812-818.
Graco, M., Farías, L., Molina, V., Gutiérrez, D., and Nielsen, L. P. (2001), Massive developments of
microbial mats following phytoplankton blooms in a eutrophic bay II Implications for nitrogen
cycling, Limnol. Oceanogr., 46, 821–832.
Gutiérrez, D., Gallardo, V. A., Mayor, S., Neira, C., V´asquez, C., Sellanes, J., Rivas, M., Soto, A.,
Carrasco, F., and Baltazar, M. (2000), Effects of dissolved oxygen and fresh organic matter on the
bioturbation potential of macrofauna in sublittoral sediments off Central Chile during the 1997/1998
El Niño, Marine Ecological Prog. Ser., 202, 81–99.
Guyoneaud, R., De Wit, R., Matheron, R. and Caumette, P. (1998), Impact of macroalgal dredging on
dystrophic crises and phototrophic bacterial blooms (red waters) in a brackish coastal lagoon.
Oceanologica Acta 21: 551-561.
Halpern, B.S., Walbridge, S., Selkoe, K.A., Kappel, C.V., Micheli, F., D‟Agrosa, C., Bruno, J.F., Casey,
K.S., Ebert, C., Fox, H.E., Fujita, R., Heinemann, D., Lenihan, H.S., Madin, E.M.P., Perry, M.T.,
Selig, E.R., Spalding, M., Steneck R. and Watson, R. (2008), A global map of human impact on
marine ecosystems. Science 319: 948–952.
Holling, C. S., Ed. Adaptive Environmental Assessment and Management; John Wiley and Sons: New
York, 1978.
Helly, J.J., Levin, L.A. (2004), Global distribution of naturally occurring marine hypoxia on continental
margins. Deep-Sea Research (Part I) 51, 1159–1168.
IOP (Interagency Ocean Policy Task Force) (2009), Interim framework for effective coastal and marine
spatial planning. The White House Council on Environmental Quality, Washington, D.C. 32 p.
IPCC (Intergovernmental Panel on Climate Change Climate Change) (2007), Impacts, adaptation and
vulnerability. Contribution of Working Group II to the Fourth Assessment Report of the
Intergovernmental Panel on Climate Change. Eds. M.I. Parry, O.F. Canziani, J.P. Patulikof, P.J. van
der Linden and C.E. Hanson. Cambridge University Press, Cambridge, UK. 976 p.
Jackson J.B.C., Kirby, M.X., Berger, W.H., Bjorndal, K.A., Botsford, L.W., Bourque, B.J., Bradbury,
R.H., Cooke, R., Erlandson, J., Estes, J.A., Hughes, T.P., Lange, S.K., Lenihan C.B., Pandol, J.M.,
Peterson, C.H., Steneck, R.S., Tegner, M.J., and Warner, R.R. (2001), Historical Overfishing and the
Recent Collapse of Coastal Ecosystems. Science 293: 629-638.
Jeppesen, E., Søndergaard, M., Jensen, J. P., Havens, K. E., Anneville, O., Carvalho, L., Coveney, M. F.,
Deneke, R., Dokulil, M. T., Foy, B., Gerdeaux, D., Hampton, S. E., et al. (2005), Lake responses to
reduced nutrient loading: an analysis of contemporary long-term data from 35 case studies.
Freshwater Biology 50, 1747–1771.
Jewett, E.B., Lopez, C.B., Kidwell, D.M., Bricker, S.B., Burke, M.K., Walbridge, M.R., Eldridge, P.M.,
Greene, R.M., Hagy, J.D., Buxton, H.T. and Díaz, R.J. (2009), Scientific assessment of hypoxia in
U.S. coastal waters. Interagency Working Group on Harmful Algal Blooms, Hypoxia, and Human
Health of the Joint Subcommittee on Ocean Science and Technology. Washington, DC. 160 p.
Jones P.D. (2006), Water quality and fisheries in the Mersey estuary, England: A historical perspective.
Marine Pollution Bulletin 53: 144-154.
Jones, T.O. and Iwama, G.K. (1991), Polyculture of the Pacific oyster, Crassostrea gigas (Thunberg), with
Chinook salmon, Oncorhynchus tshawytscha. Aquaculture 92: 313-322.
40
Jørgensen, B.B. (1980), Seasonal oxygen depletion in the bottom waters of a Danish fjord and its effect on
the benthic community. Oikos 34:68-76.
Justic′, D., T. Legovic′, L. Rottini-Sandrini (1987), Trends in oxygen content 1911-1984 and occurrence of
benthic mortality in the northern Adriatic Sea. Estuarine Coastal Shelf Sicence 25:435-445.
Karlson, K., Rosenberg, R., and Bonsdorff, E. (2002) Temporal and spatial large-scale effects of
eutrophication and oxygen deficiency on benthic fauna in Scandinavian and Baltic waters – a
review. Oceanography and Marine Biology: an Annual Review 40: 427-489.
Katsuki, K., Seto, K., Nomura, R., Maekawa, K. and Khim, B.-K. (2008), Effect of human activity on Lake
Saroma (Japan) during the past 150 years: Evidence by variation of diatom assemblages. Estuarine
Coastal and Shelf Science 81: 215–224.
Kemp, W.M., Testa, J.M., Conley, D.J., Gilbert, D., and Hagy, J.D. (2010), Temporal responses of coastal
hypoxia to nutrient loading and physical controls, Biogeosciences 6: 2985–3008.
Kemp, W.M., Boynton, W.R., Adolf, J.E., Boesch, D.F., Boicourt, W.C., Brush, G., Cornwell, J.C., Fisher,
T.R., Glibert, P.M., Hagy, J.D., Harding, L.W., Houde, E.D., Kimmel, D.G., Miller, W.D., Newell,
R.I.E., Roman, M.R., Smith, E.M. and Stevenson, J.C. (2005), Eutrophication of Chesapeake Bay
historical trends and ecological interactions, Marine Ecology Progress Series 303: 1–29.
Kodama K., Aoki, I., and Shimizu, M. (2002), Long-term changes in the assemblage of demersal fishes
and invertebrates in relation to environmental variations in Tokyo Bay, Japan. Fisheries
Management and Ecology 9: 303-313.
Kodama K., Horiguchi, T., Kume, G., Nagayama, S., Shimizu, T., Shiraishi, H., Morita, M., and Shimizu,
M. (2006), Effects of hypoxia on early life history of the stomatopod Oratosquilla oratoria in a
coastal sea. Marine Ecology Progress Series 324: 197-206.
Levin, L.A., Ekau, W., Gooday, A.J., Jorissen, F., Middelburg, J.J., Naqvi, S.W.A., Neira, C. Rabalais,
N.N. and Zhang. J. (2009), Effects of natural and human-induced hypoxia on coastal benthos.
Biogeosciences 6: 2063–2098.
Lim H.S., Díaz, R.J., Hong, J.S., and Schaffner, L.C. (2006), Hypoxia and benthic community recovery in
Korean coastal waters. Marine Pollution Bulletin 52: 1517-1526.
Lindahl, 0., Hart, R., Hernroth, B., Kollberg, S., Loo, L.-O., Olrog, L., Rehnstam-Holm, A.-S., Svensson,
J., Svensson, S. and Syversen, U. (2005), Improving marine water quality by mussel farming: a
profitable solution for Swedish society. Ambio 34: 131-137.
Lotze, H.K., Lenihan, H.S., Bourque, B.J., Bradbury, R.H., Cooke, R.G., Kay, M.C., Kidwell, S.M., Kirby,
M.X., Peterson, C.H. and Jackson, J.B.C. (2006), Depletion, Degradation, and Recovery Potential of
Estuaries and Coastal Seas. Science 312: 1806-1809.
MA (Millennium Ecosystem Assessment) (2005), Ecosystems and Human Well-being: Synthesis. Island
Press, Washington, DC. 155 p.
Maes J, Stevens M, and Breine J. (2007), Modelling the migration opportunities of diadromous fish species
along a gradient of dissolved oxygen concentration in a European tidal watershed. Estuarine Coastal
and Shelf Science 75: 151–62.
Mazouni, N., Gaertner, J.-C., Deslous-Paoli, J.M., Landrein, S., and Geringer d‟Oedenberg, M. (1996),
Nutrient and oxygen exchanges at the water–sediment interface in a shellfish farming lagoon (Thau,
France). Journal of Experimental Marine Biology and Ecology 205: 91–113.
Meyer-Reil, L.-A. and K¨oster, M. (2000), Eutrophication of marine waters effects on benthic microbial
communities, Marine Pollution Bulletin 41: 255–263.
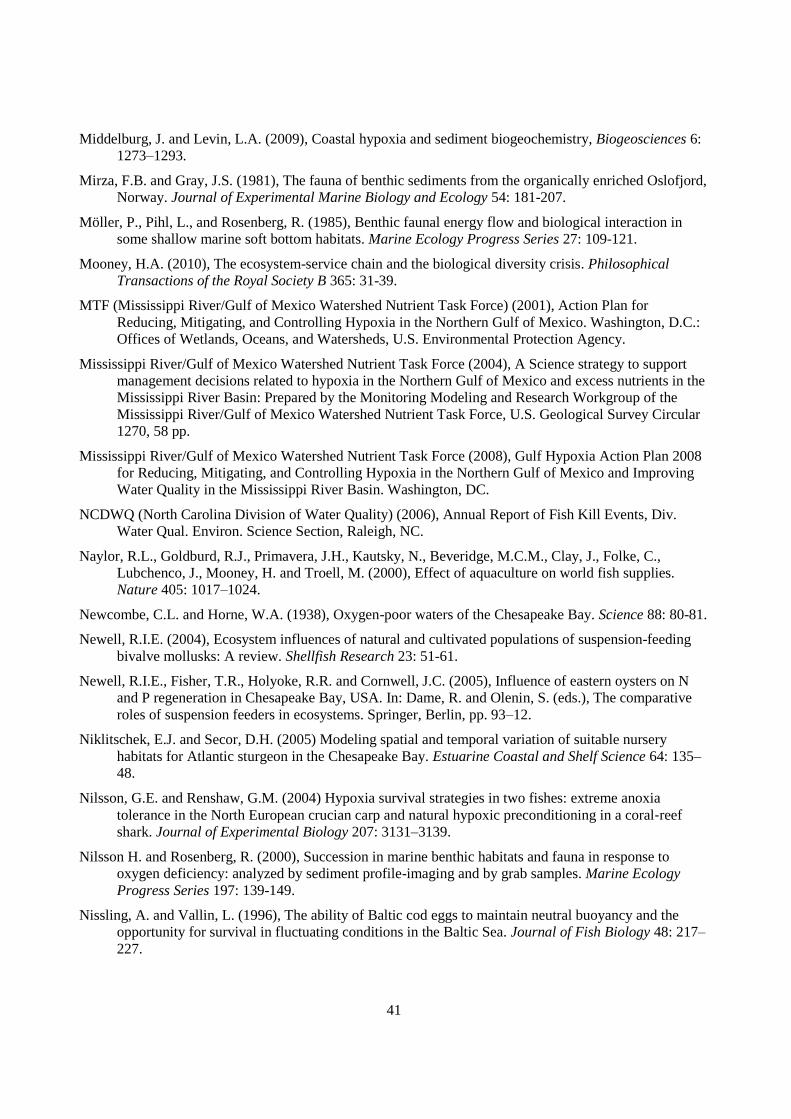
41
Middelburg, J. and Levin, L.A. (2009), Coastal hypoxia and sediment biogeochemistry, Biogeosciences 6:
1273–1293.
Mirza, F.B. and Gray, J.S. (1981), The fauna of benthic sediments from the organically enriched Oslofjord,
Norway. Journal of Experimental Marine Biology and Ecology 54: 181-207.
Möller, P., Pihl, L., and Rosenberg, R. (1985), Benthic faunal energy flow and biological interaction in
some shallow marine soft bottom habitats. Marine Ecology Progress Series 27: 109-121.
Mooney, H.A. (2010), The ecosystem-service chain and the biological diversity crisis. Philosophical
Transactions of the Royal Society B 365: 31-39.
MTF (Mississippi River/Gulf of Mexico Watershed Nutrient Task Force) (2001), Action Plan for
Reducing, Mitigating, and Controlling Hypoxia in the Northern Gulf of Mexico. Washington, D.C.:
Offices of Wetlands, Oceans, and Watersheds, U.S. Environmental Protection Agency.
Mississippi River/Gulf of Mexico Watershed Nutrient Task Force (2004), A Science strategy to support
management decisions related to hypoxia in the Northern Gulf of Mexico and excess nutrients in the
Mississippi River Basin: Prepared by the Monitoring Modeling and Research Workgroup of the
Mississippi River/Gulf of Mexico Watershed Nutrient Task Force, U.S. Geological Survey Circular
1270, 58 pp.
Mississippi River/Gulf of Mexico Watershed Nutrient Task Force (2008), Gulf Hypoxia Action Plan 2008
for Reducing, Mitigating, and Controlling Hypoxia in the Northern Gulf of Mexico and Improving
Water Quality in the Mississippi River Basin. Washington, DC.
NCDWQ (North Carolina Division of Water Quality) (2006), Annual Report of Fish Kill Events, Div.
Water Qual. Environ. Science Section, Raleigh, NC.
Naylor, R.L., Goldburd, R.J., Primavera, J.H., Kautsky, N., Beveridge, M.C.M., Clay, J., Folke, C.,
Lubchenco, J., Mooney, H. and Troell, M. (2000), Effect of aquaculture on world fish supplies.
Nature 405: 1017–1024.
Newcombe, C.L. and Horne, W.A. (1938), Oxygen-poor waters of the Chesapeake Bay. Science 88: 80-81.
Newell, R.I.E. (2004), Ecosystem influences of natural and cultivated populations of suspension-feeding
bivalve mollusks: A review. Shellfish Research 23: 51-61.
Newell, R.I.E., Fisher, T.R., Holyoke, R.R. and Cornwell, J.C. (2005), Influence of eastern oysters on N
and P regeneration in Chesapeake Bay, USA. In: Dame, R. and Olenin, S. (eds.), The comparative
roles of suspension feeders in ecosystems. Springer, Berlin, pp. 93–12.
Niklitschek, E.J. and Secor, D.H. (2005) Modeling spatial and temporal variation of suitable nursery
habitats for Atlantic sturgeon in the Chesapeake Bay. Estuarine Coastal and Shelf Science 64: 135–
48.
Nilsson, G.E. and Renshaw, G.M. (2004) Hypoxia survival strategies in two fishes: extreme anoxia
tolerance in the North European crucian carp and natural hypoxic preconditioning in a coral‐reef
shark. Journal of Experimental Biology 207: 3131–3139.
Nilsson H. and Rosenberg, R. (2000), Succession in marine benthic habitats and fauna in response to
oxygen deficiency: analyzed by sediment profile-imaging and by grab samples. Marine Ecology
Progress Series 197: 139-149.
Nissling, A. and Vallin, L. (1996), The ability of Baltic cod eggs to maintain neutral buoyancy and the
opportunity for survival in fluctuating conditions in the Baltic Sea. Journal of Fish Biology 48: 217–
227.
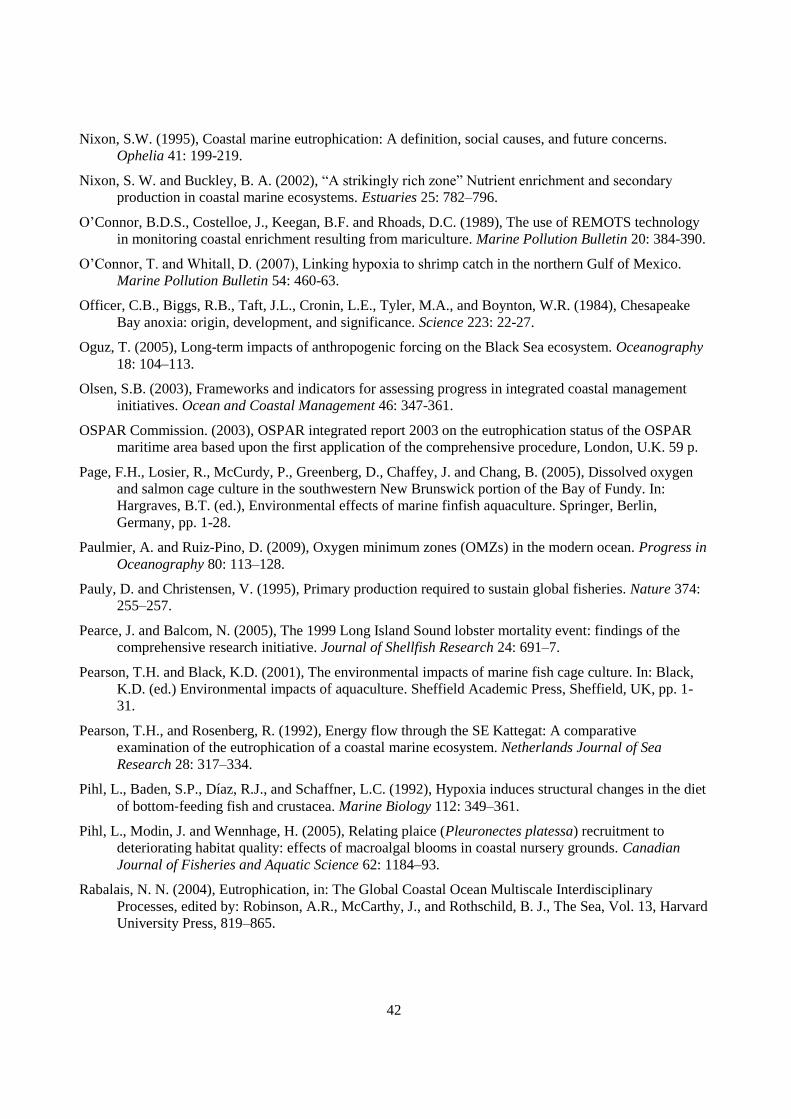
42
Nixon, S.W. (1995), Coastal marine eutrophication: A definition, social causes, and future concerns.
Ophelia 41: 199-219.
Nixon, S. W. and Buckley, B. A. (2002), “A strikingly rich zone” Nutrient enrichment and secondary
production in coastal marine ecosystems. Estuaries 25: 782–796.
O‟Connor, B.D.S., Costelloe, J., Keegan, B.F. and Rhoads, D.C. (1989), The use of REMOTS technology
in monitoring coastal enrichment resulting from mariculture. Marine Pollution Bulletin 20: 384-390.
O‟Connor, T. and Whitall, D. (2007), Linking hypoxia to shrimp catch in the northern Gulf of Mexico.
Marine Pollution Bulletin 54: 460-63.
Officer, C.B., Biggs, R.B., Taft, J.L., Cronin, L.E., Tyler, M.A., and Boynton, W.R. (1984), Chesapeake
Bay anoxia: origin, development, and significance. Science 223: 22-27.
Oguz, T. (2005), Long-term impacts of anthropogenic forcing on the Black Sea ecosystem. Oceanography
18: 104–113.
Olsen, S.B. (2003), Frameworks and indicators for assessing progress in integrated coastal management
initiatives. Ocean and Coastal Management 46: 347-361.
OSPAR Commission. (2003), OSPAR integrated report 2003 on the eutrophication status of the OSPAR
maritime area based upon the first application of the comprehensive procedure, London, U.K. 59 p.
Page, F.H., Losier, R., McCurdy, P., Greenberg, D., Chaffey, J. and Chang, B. (2005), Dissolved oxygen
and salmon cage culture in the southwestern New Brunswick portion of the Bay of Fundy. In:
Hargraves, B.T. (ed.), Environmental effects of marine finfish aquaculture. Springer, Berlin,
Germany, pp. 1-28.
Paulmier, A. and Ruiz-Pino, D. (2009), Oxygen minimum zones (OMZs) in the modern ocean. Progress in
Oceanography 80: 113–128.
Pauly, D. and Christensen, V. (1995), Primary production required to sustain global fisheries. Nature 374:
255–257.
Pearce, J. and Balcom, N. (2005), The 1999 Long Island Sound lobster mortality event: findings of the
comprehensive research initiative. Journal of Shellfish Research 24: 691–7.
Pearson, T.H. and Black, K.D. (2001), The environmental impacts of marine fish cage culture. In: Black,
K.D. (ed.) Environmental impacts of aquaculture. Sheffield Academic Press, Sheffield, UK, pp. 1-
31.
Pearson, T.H., and Rosenberg, R. (1992), Energy flow through the SE Kattegat: A comparative
examination of the eutrophication of a coastal marine ecosystem. Netherlands Journal of Sea
Research 28: 317–334.
Pihl, L., Baden, S.P., Díaz, R.J., and Schaffner, L.C. (1992), Hypoxia induces structural changes in the diet
of bottom‐feeding fish and crustacea. Marine Biology 112: 349–361.
Pihl, L., Modin, J. and Wennhage, H. (2005), Relating plaice (Pleuronectes platessa) recruitment to
deteriorating habitat quality: effects of macroalgal blooms in coastal nursery grounds. Canadian
Journal of Fisheries and Aquatic Science 62: 1184–93.
Rabalais, N. N. (2004), Eutrophication, in: The Global Coastal Ocean Multiscale Interdisciplinary
Processes, edited by: Robinson, A.R., McCarthy, J., and Rothschild, B. J., The Sea, Vol. 13, Harvard
University Press, 819–865.
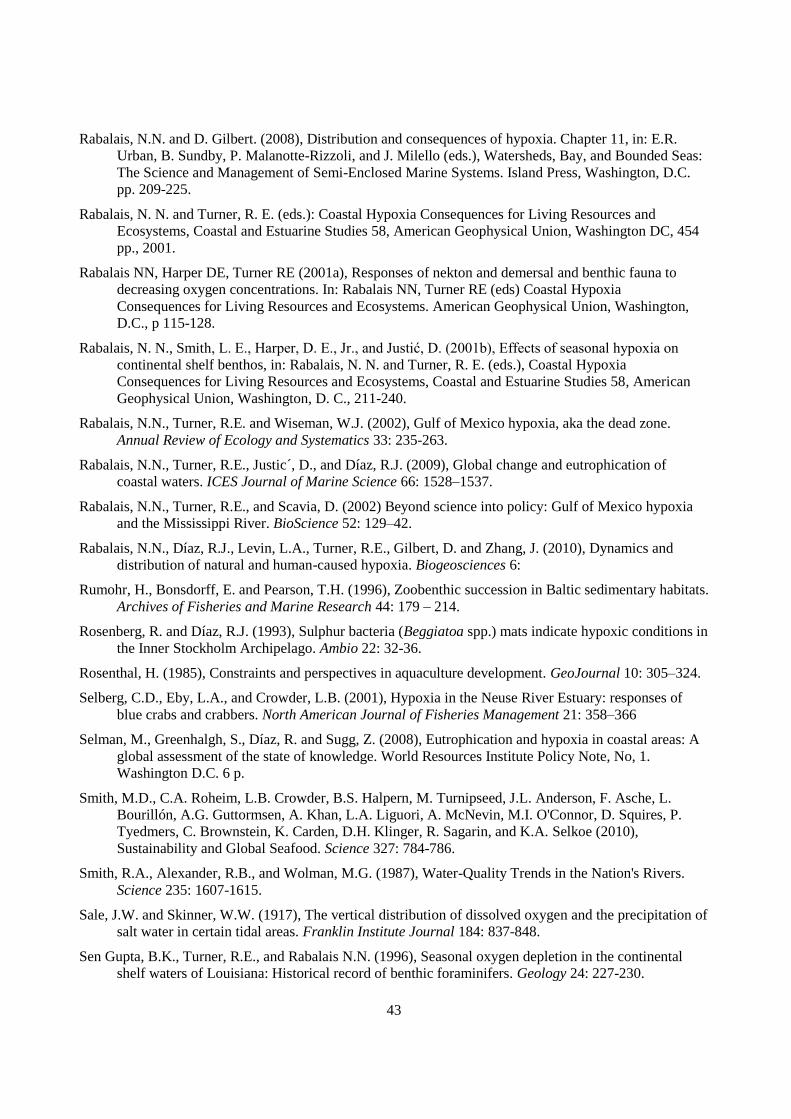
43
Rabalais, N.N. and D. Gilbert. (2008), Distribution and consequences of hypoxia. Chapter 11, in: E.R.
Urban, B. Sundby, P. Malanotte-Rizzoli, and J. Milello (eds.), Watersheds, Bay, and Bounded Seas:
The Science and Management of Semi-Enclosed Marine Systems. Island Press, Washington, D.C.
pp. 209-225.
Rabalais, N. N. and Turner, R. E. (eds.): Coastal Hypoxia Consequences for Living Resources and
Ecosystems, Coastal and Estuarine Studies 58, American Geophysical Union, Washington DC, 454
pp., 2001.
Rabalais NN, Harper DE, Turner RE (2001a), Responses of nekton and demersal and benthic fauna to
decreasing oxygen concentrations. In: Rabalais NN, Turner RE (eds) Coastal Hypoxia
Consequences for Living Resources and Ecosystems. American Geophysical Union, Washington,
D.C., p 115-128.
Rabalais, N. N., Smith, L. E., Harper, D. E., Jr., and Justić, D. (2001b), Effects of seasonal hypoxia on
continental shelf benthos, in: Rabalais, N. N. and Turner, R. E. (eds.), Coastal Hypoxia
Consequences for Living Resources and Ecosystems, Coastal and Estuarine Studies 58, American
Geophysical Union, Washington, D. C., 211-240.
Rabalais, N.N., Turner, R.E. and Wiseman, W.J. (2002), Gulf of Mexico hypoxia, aka the dead zone.
Annual Review of Ecology and Systematics 33: 235-263.
Rabalais, N.N., Turner, R.E., Justic´, D., and Díaz, R.J. (2009), Global change and eutrophication of
coastal waters. ICES Journal of Marine Science 66: 1528–1537.
Rabalais, N.N., Turner, R.E., and Scavia, D. (2002) Beyond science into policy: Gulf of Mexico hypoxia
and the Mississippi River. BioScience 52: 129–42.
Rabalais, N.N., Díaz, R.J., Levin, L.A., Turner, R.E., Gilbert, D. and Zhang, J. (2010), Dynamics and
distribution of natural and human-caused hypoxia. Biogeosciences 6:
Rumohr, H., Bonsdorff, E. and Pearson, T.H. (1996), Zoobenthic succession in Baltic sedimentary habitats.
Archives of Fisheries and Marine Research 44: 179 – 214.
Rosenberg, R. and Díaz, R.J. (1993), Sulphur bacteria (Beggiatoa spp.) mats indicate hypoxic conditions in
the Inner Stockholm Archipelago. Ambio 22: 32-36.
Rosenthal, H. (1985), Constraints and perspectives in aquaculture development. GeoJournal 10: 305–324.
Selberg, C.D., Eby, L.A., and Crowder, L.B. (2001), Hypoxia in the Neuse River Estuary: responses of
blue crabs and crabbers. North American Journal of Fisheries Management 21: 358–366
Selman, M., Greenhalgh, S., Díaz, R. and Sugg, Z. (2008), Eutrophication and hypoxia in coastal areas: A
global assessment of the state of knowledge. World Resources Institute Policy Note, No, 1.
Washington D.C. 6 p.
Smith, M.D., C.A. Roheim, L.B. Crowder, B.S. Halpern, M. Turnipseed, J.L. Anderson, F. Asche, L.
Bourillón, A.G. Guttormsen, A. Khan, L.A. Liguori, A. McNevin, M.I. O'Connor, D. Squires, P.
Tyedmers, C. Brownstein, K. Carden, D.H. Klinger, R. Sagarin, and K.A. Selkoe (2010),
Sustainability and Global Seafood. Science 327: 784-786.
Smith, R.A., Alexander, R.B., and Wolman, M.G. (1987), Water-Quality Trends in the Nation's Rivers.
Science 235: 1607-1615.
Sale, J.W. and Skinner, W.W. (1917), The vertical distribution of dissolved oxygen and the precipitation of
salt water in certain tidal areas. Franklin Institute Journal 184: 837-848.
Sen Gupta, B.K., Turner, R.E., and Rabalais N.N. (1996), Seasonal oxygen depletion in the continental
shelf waters of Louisiana: Historical record of benthic foraminifers. Geology 24: 227-230.
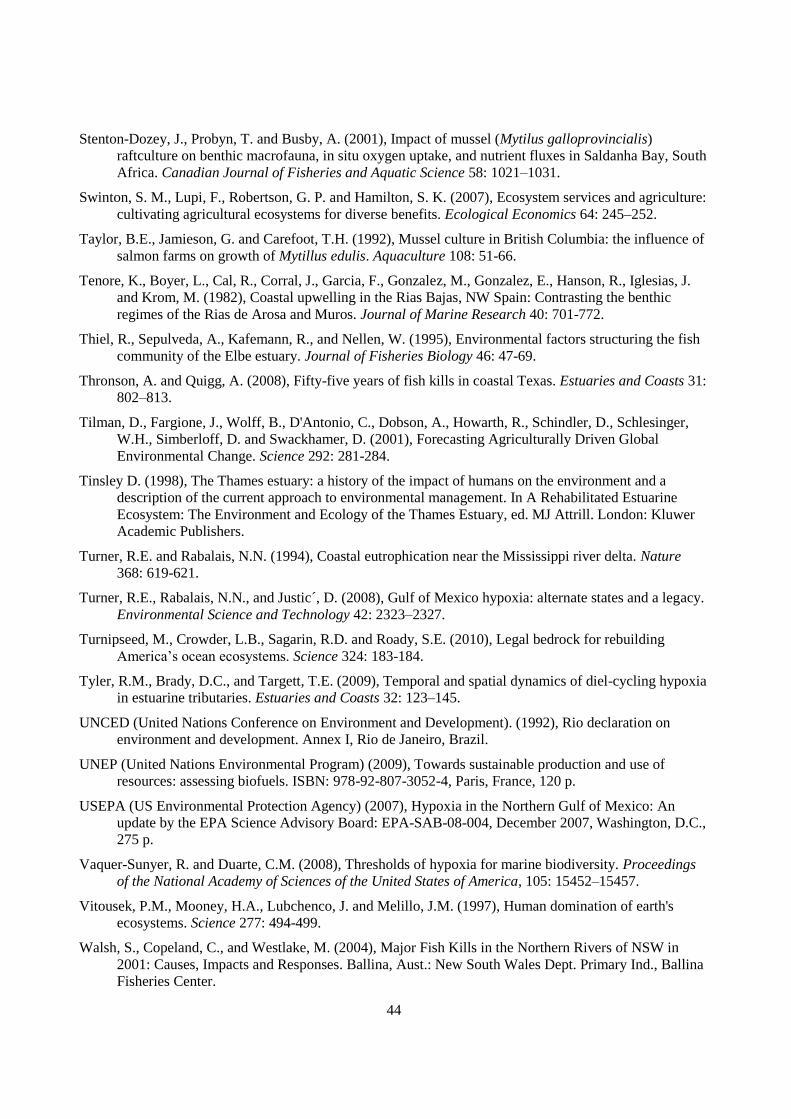
44
Stenton-Dozey, J., Probyn, T. and Busby, A. (2001), Impact of mussel (Mytilus galloprovincialis)
raftculture on benthic macrofauna, in situ oxygen uptake, and nutrient fluxes in Saldanha Bay, South
Africa. Canadian Journal of Fisheries and Aquatic Science 58: 1021–1031.
Swinton, S. M., Lupi, F., Robertson, G. P. and Hamilton, S. K. (2007), Ecosystem services and agriculture:
cultivating agricultural ecosystems for diverse benefits. Ecological Economics 64: 245–252.
Taylor, B.E., Jamieson, G. and Carefoot, T.H. (1992), Mussel culture in British Columbia: the influence of
salmon farms on growth of Mytillus edulis. Aquaculture 108: 51-66.
Tenore, K., Boyer, L., Cal, R., Corral, J., Garcia, F., Gonzalez, M., Gonzalez, E., Hanson, R., Iglesias, J.
and Krom, M. (1982), Coastal upwelling in the Rias Bajas, NW Spain: Contrasting the benthic
regimes of the Rias de Arosa and Muros. Journal of Marine Research 40: 701-772.
Thiel, R., Sepulveda, A., Kafemann, R., and Nellen, W. (1995), Environmental factors structuring the fish
community of the Elbe estuary. Journal of Fisheries Biology 46: 47-69.
Thronson, A. and Quigg, A. (2008), Fifty-five years of fish kills in coastal Texas. Estuaries and Coasts 31:
802–813.
Tilman, D., Fargione, J., Wolff, B., D'Antonio, C., Dobson, A., Howarth, R., Schindler, D., Schlesinger,
W.H., Simberloff, D. and Swackhamer, D. (2001), Forecasting Agriculturally Driven Global
Environmental Change. Science 292: 281-284.
Tinsley D. (1998), The Thames estuary: a history of the impact of humans on the environment and a
description of the current approach to environmental management. In A Rehabilitated Estuarine
Ecosystem: The Environment and Ecology of the Thames Estuary, ed. MJ Attrill. London: Kluwer
Academic Publishers.
Turner, R.E. and Rabalais, N.N. (1994), Coastal eutrophication near the Mississippi river delta. Nature
368: 619-621.
Turner, R.E., Rabalais, N.N., and Justic´, D. (2008), Gulf of Mexico hypoxia: alternate states and a legacy.
Environmental Science and Technology 42: 2323–2327.
Turnipseed, M., Crowder, L.B., Sagarin, R.D. and Roady, S.E. (2010), Legal bedrock for rebuilding
America‟s ocean ecosystems. Science 324: 183-184.
Tyler, R.M., Brady, D.C., and Targett, T.E. (2009), Temporal and spatial dynamics of diel-cycling hypoxia
in estuarine tributaries. Estuaries and Coasts 32: 123–145.
UNCED (United Nations Conference on Environment and Development). (1992), Rio declaration on
environment and development. Annex I, Rio de Janeiro, Brazil.
UNEP (United Nations Environmental Program) (2009), Towards sustainable production and use of
resources: assessing biofuels. ISBN: 978-92-807-3052-4, Paris, France, 120 p.
USEPA (US Environmental Protection Agency) (2007), Hypoxia in the Northern Gulf of Mexico: An
update by the EPA Science Advisory Board: EPA-SAB-08-004, December 2007, Washington, D.C.,
275 p.
Vaquer-Sunyer, R. and Duarte, C.M. (2008), Thresholds of hypoxia for marine biodiversity. Proceedings
of the National Academy of Sciences of the United States of America, 105: 15452–15457.
Vitousek, P.M., Mooney, H.A., Lubchenco, J. and Melillo, J.M. (1997), Human domination of earth's
ecosystems. Science 277: 494-499.
Walsh, S., Copeland, C., and Westlake, M. (2004), Major Fish Kills in the Northern Rivers of NSW in
2001: Causes, Impacts and Responses. Ballina, Aust.: New South Wales Dept. Primary Ind., Ballina
Fisheries Center.

45
Weisberg, S.B., Wilson, H.T., Himchak, P., Baum, T., and Allen, R. (1996), Temporal trends in abundance
of fish in the tidal Delaware River. Estuaries 19: 723-729.
Zimmerman, A.R. and Canuel, E.A. (2000), A geochemical record of eutrophication and anoxia in
Chesapeake Bay sediments: anthropogenic influence on organic matter composition. Marine
Chemistry 69: 117-137.

Agriculture’s Impact on Aquaculture:Hypoxia and Eutrophication in Marine Waters