Embed Size (px)
Citation preview
Agriculture Prospects Report
Ministry of Agriculture, Irrigation and Livestock
General Department of Policy and Planning Food, Agriculture and Animal Husbandry Information
Management and Policy Unit (FAAHM) Kabul, 15 May 2007
Abbreviations APR Agriculture Prospects Report CCPP contagious caprine pleuropneumonia CSO Central Statistics Office DAP Di-Ammonium Phosphate EC European Commission ERU Emergency and Rehabilitation Unit (FAO) FAAHM Food, Agriculture and Animal Husbandry Information Management and Policy Unit FAO Food and Agriculture Organization of the United Nations FMD Foot and Mouth Disease IMF International Monetary Fund IPM Integrated Pest Management LTA Long-term Average MAIL Ministry of Agriculture, Irrigation and Livestock OIE Office International des Epizooties (World Organization for Animal Health) PPQD Plant Protection and Quarantine Department PPR peste des petits ruminants QDS Quality Declared Seed RFA Regional Field Assistant UNDP United Nations Development Program USGS United States Geological Survey WFP World Food Program
Contact us Haqiqatpal Ghulam Rabbani, Director, FAAHM, MAIL
[email protected] Mobile: +93-(0)700 284879
Click here for FAAHM reports and bulletins
“Support to FAAHM in Developing an Agricultural Statistics and Market Information System” (FAAHM-II - a project funded by the European Commission)
Acknowledgement
Primary sources of information for Agriculture Prospects Report are individual provincial agricultural offices. We appreciate contributions made by provincial offices towards crop monitoring. FAAHM-II project provided technical guidance and financial support for crop and livestock monitoring, farmers’ survey, and crop assessment at the provincial levels. Thanks are due to MAIL officials who contributed towards field work and/or helped with the writing and production of this APR. Many thanks are due to national and international staff of MAIL, FAO projects, programs, and units for providing data and inputs. Very many thanks are also due to other projects, agencies and persons for sharing information.
Cover page
A lush irrigated wheat field in Rorabat village of Dand district (Kandahar) [29-Apr-07] Photo courtesy: Shams Uddin Shams, Region Field Assistant (RFA), FAO Area Office, Kandahar
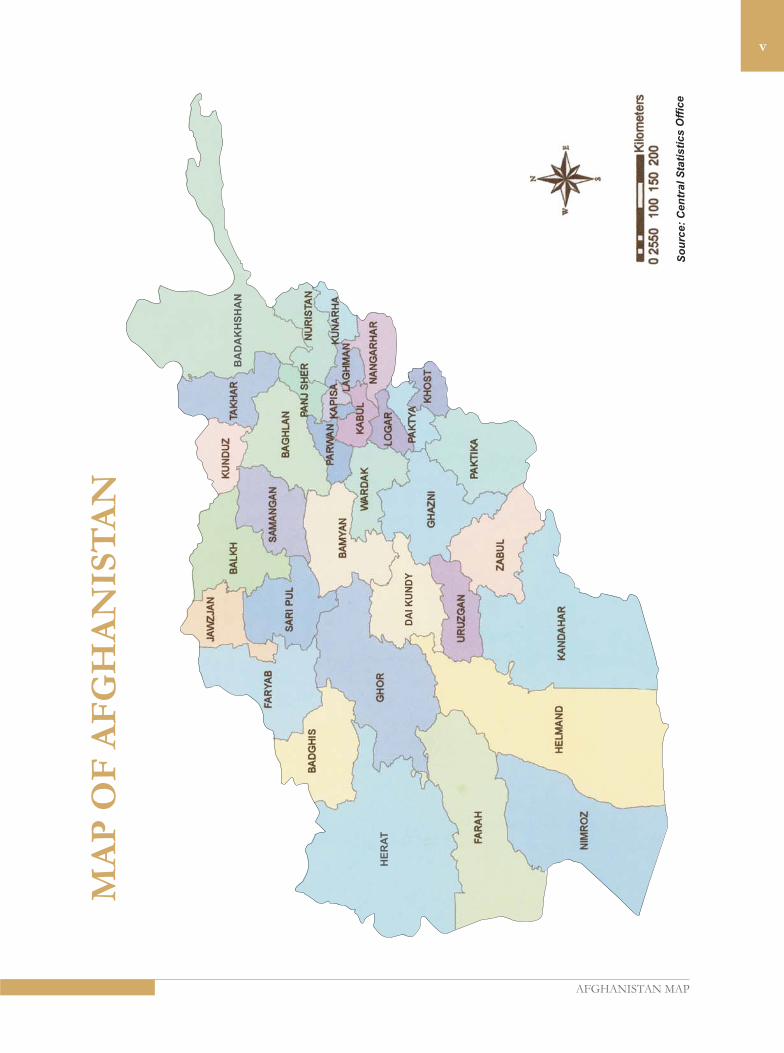
Contents Abbreviations Contact Address Acknowledgement Map of Afghanistan with provincial boundaries Map showing wheat surplus/deficit in 2007 by province 1. INTRODUCTION..............................................................................................................................................1 2. WEATHER CONDITION ................................................................................................................................2 3. CEREAL AREA, PRODUCTION AND REQUIREMENT...........................................................................3 4. LIVESTOCK......................................................................................................................................................5 5. ADVERSE FACTORS IN CROPS AND THEIR CONTROL ......................................................................8 6. ADVERSE FACTORS IN LIVESTOCK AND THEIR CONTROL ............................................................9 7. WHEAT SEED PRODUCTION.....................................................................................................................10 8. APPROACH TO REDUCE FOOD DEFICIT ..............................................................................................10 9. PRICE OF AGRICULTURAL COMMODITIES .......................................................................................10 10. PLAN FOR 2007..........................................................................................................................................11 Tables 1: Forecasted Area and Production of different Cereals in 2007 2: Cereal production in Afghanistan (2003-2007) 3: The 2007 Cereal Balance Sheet Maps 1. Afghanistan with provincial boundaries 2. Wheat balance in 2007 by province Annexes Annex I: Rainfall situation in the 2007 crop growing cycle Annex 2: Breeder , Foundation and Quality Declared Seed (QDS) produced by the FAO project
(GCP/AFG/018/EC) in the last four years Annex 3: Area and Production of Wheat in 2007 by province (May 2007 Estimates) Annex 4: Wheat Balance in 2007 by Province (Preliminary estimates) Annex 5: Production and Requirements of cereals in 2007
MA
PO
FA
FG
HA
NIS
TA
N
HE
RA
T
BA
DA
KH
SH
AN
v
So
urc
e:
Cen
tralS
tati
sti
cs
Off
ice
DA
IK
UN
DY
AFGHANISTAN MAP
Page 1
Ministry of Agriculture, Irrigation and Livestock (MAIL) General Department of Policy and Planning
Food, Agriculture and Animal Husbandry Information Management and Policy Unit
(FAAHM)
Agriculture Prospects Report (APR)1
1. Introduction This report provides preliminary estimates of the 2007 cereal crop outputs, quantifies the cereal surplus/deficit, identifies areas needing actions or interventions, and supplies data on retail market prices of agricultural commodities and services in various provinces. The report is intended for the use of Ministry of Agriculture, Irrigation and Livestock (MAIL), Central Statistics Office (CSO), international agencies, and others. The APR is mainly based on the reports filed by the provincial missions of MAIL that visited 28 provinces (out of 34) in the country. The last mission returned to Kabul in the fourth week of April. Following provinces were visited by the MAIL missions: • North (total 5 provinces) Faryab, Juzjan, Sar-i-Pul, Balkh, Samangan; 5 provinces • North-East (4) Bughlan, Kunduz, Takhar, and Badakhshan; 4 provinces • West (3) Herat and Badghis; 2 provinces • West Central (2) Ghor and Bamyan; 2 provinces • Central (6) Kabul, Parwan, Panjsher, Kapisa, Logar and Wardak; 6 provinces • South (4) Paktya, Khost and Ghazni; 3 provinces • East (4) Nangarhar, Laghman, Kunarha, and Nooristan; 4 provinces • South-West (6) Kandahar and Zabul; 2 provinces The MAIL missions held discussions with provincial and district staff and conducted survey of over 320 farmers across the visited provinces. The mission collected qualitative and quantitative information on rainfall condition, temperature, crop stages by types of crops, water stress to various crops, planting progress, irrigation status, crop area (last year, a normal year and current year), expected crop yield (last year, a normal year and current year), and adverse conditions or factors (e.g. drought, floods, avalanche, frost, pests, diseases, etc.), availability of inputs, etc. Besides these the collected information included, (i) adverse conditions for livestock, and (ii) most popular improved variety of wheat seeds used in the province, and their main source. In the farmer questionnaire, the collected data included weather condition; area under irrigated wheat, rainfed wheat and barley (last year, a normal year and current year) and production (last year, a normal year and estimated this year). There are two MAIL staff members in each province who collect information and data for FAAHM on a regular basis. Codan radios installed by MAIL and FAO in 34 provinces were used for more frequent contacts with them. Cellular phones were also used for the said purpose. Regional Field Assistants (RFA) of FAO - who are posted in Kunduz, Heart, Kandahar and Jalalabad - provided consolidated information at the regional level. Various technical departments of MAIL in the provinces and in Kabul provided a wealth of information in their areas of competence. Information and data provided by FAO projects and units (particularly ERU, Emergency Irrigation Rehabilitation Project, Seed, Veterinary Services, and Dairy), USGS Agro-met project, WFP, and FAO mission that visited the country were also very important sources of information for this APR.
1 Some information in this APR has been used by MAIL and IMF prior to its formal release
Page 2
In December 2006 MAIL provided qualitative information on good production prospect for the current year2.
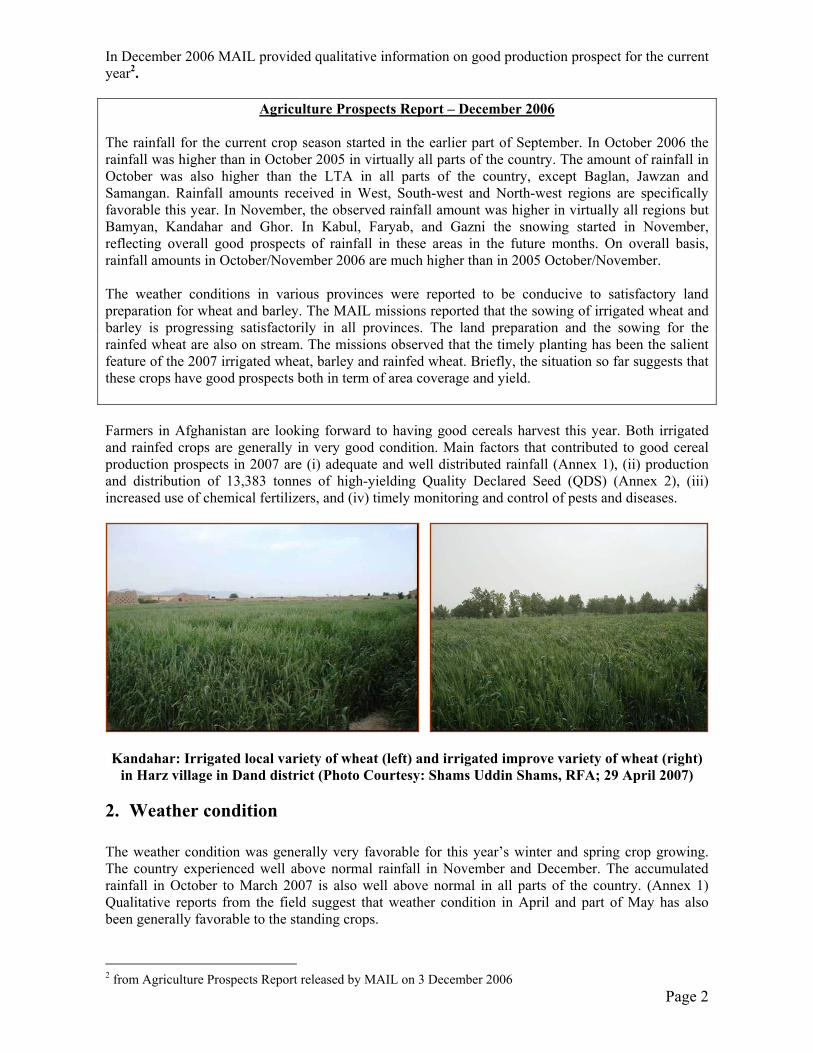
Agriculture Prospects Report – December 2006 The rainfall for the current crop season started in the earlier part of September. In October 2006 the rainfall was higher than in October 2005 in virtually all parts of the country. The amount of rainfall in October was also higher than the LTA in all parts of the country, except Baglan, Jawzan and Samangan. Rainfall amounts received in West, South-west and North-west regions are specifically favorable this year. In November, the observed rainfall amount was higher in virtually all regions but Bamyan, Kandahar and Ghor. In Kabul, Faryab, and Gazni the snowing started in November, reflecting overall good prospects of rainfall in these areas in the future months. On overall basis, rainfall amounts in October/November 2006 are much higher than in 2005 October/November. The weather conditions in various provinces were reported to be conducive to satisfactory land preparation for wheat and barley. The MAIL missions reported that the sowing of irrigated wheat and barley is progressing satisfactorily in all provinces. The land preparation and the sowing for the rainfed wheat are also on stream. The missions observed that the timely planting has been the salient feature of the 2007 irrigated wheat, barley and rainfed wheat. Briefly, the situation so far suggests that these crops have good prospects both in term of area coverage and yield. Farmers in Afghanistan are looking forward to having good cereals harvest this year. Both irrigated and rainfed crops are generally in very good condition. Main factors that contributed to good cereal production prospects in 2007 are (i) adequate and well distributed rainfall (Annex 1), (ii) production and distribution of 13,383 tonnes of high-yielding Quality Declared Seed (QDS) (Annex 2), (iii) increased use of chemical fertilizers, and (iv) timely monitoring and control of pests and diseases.
Kandahar: Irrigated local variety of wheat (left) and irrigated improve variety of wheat (right)
in Harz village in Dand district (Photo Courtesy: Shams Uddin Shams, RFA; 29 April 2007)
2. Weather condition The weather condition was generally very favorable for this year’s winter and spring crop growing. The country experienced well above normal rainfall in November and December. The accumulated rainfall in October to March 2007 is also well above normal in all parts of the country. (Annex 1) Qualitative reports from the field suggest that weather condition in April and part of May has also been generally favorable to the standing crops.
2 from Agriculture Prospects Report released by MAIL on 3 December 2006
Page 3
3. Cereal Area, Production and Requirement The total area used for cereals in 2007 is estimated at 3 million hectares. Production of cereals is estimated at 5.6 million tonnes, of which wheat is 4.5 million tonnes (80%). So far 2007 is adjudged to be a very good year for crop production.
Table 1: Forecasted Area and Production of different Cereals in 20073
Crop Area Yield Production(‘000 ha.) (tonnes/ha.) (‘000 tonnes)
Irrigated wheat (Winter & Spring) 1,071 2.690 2,878Rainfed wheat (Winter & Spring) 1,395 1.150 1,606All wheat 2,466 1.820 4,484Milled rice (paddy yield) 170 3.250 370Maize 137 2.628 360Barley 236 1.568 370Overall 3,009 5,584
The year to year changes in the production of cereals in the last five years are shown in Table 2. The 2003 and 2005 were years with very good cereal harvest mainly due to favorable weather conditions. In 2004 and 2006 cereal production dipped considerably down due to reduced rainfall in all parts of the country. The production of wheat in 2007 is going to be 33% higher than the production in 2006. Overall production of cereals in 2007 is estimated at 5.6 million tones, which is 26% more than in 2006. (Table 2)
Table 2: Cereal production4 in Afghanistan (2003-2007) (‘000 tonnes)
Crop
Irrigated wheat 3,017 1,867 2,728 2,604 2,878Rainfed wheat 1,345 426 1,538 759 1,606
Total wheat 4,362 2,293 4,266 3,363 4,484Milled Rice 291 310 325 361 370Maize 310 234 315 359 360Barley 410 220 337 364 370Total cereals 5,373 3,057 5,243 4,447 5,584
2006 20072003 2004 2005
Barley production is estimated at 370,000 tonnes. Assuming normal planting/growing conditions for paddy and maize in the coming months, milled rice and maize production in 2007 is forecast to reach 370,000 tonnes and 360,000 tonnes, respectively.
3 Preliminary estimates 4 Sources: FAO/WFP Food and Crop Assessment Mission for 2003-2004; MAIL 2005-2007
Page 4
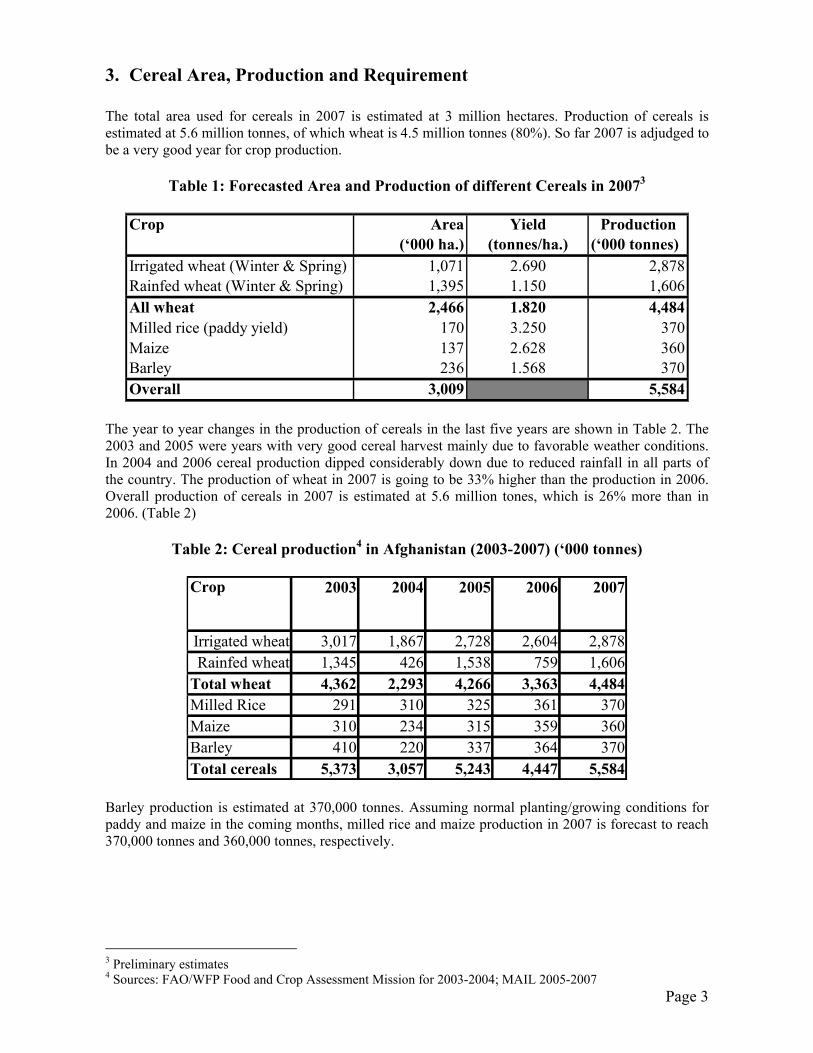
A farmer irrigating his wheat fields in Naw Daeh canal irrigation scheme, Farah province
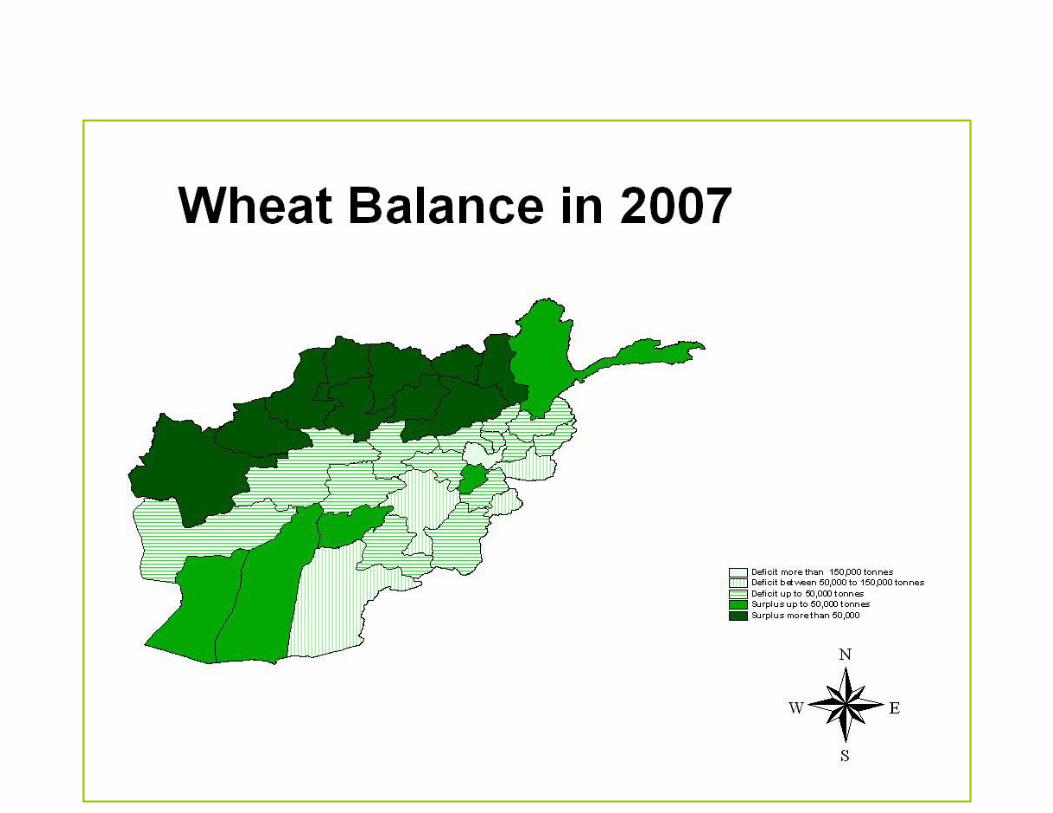
[Photo Courtesy: Najib Mohammad, RFA] The total cereal requirement in 2007 is estimated at 6.1 million tonnes, of which 4.9 million tonnes (80%) is wheat. Domestic production of cereals is estimated at 5.6 million tones, which means that the country will be 91% self-sufficient in food production this year. The total import requirement of cereals – including commercial import and food aid - is estimated at 526,000 tonnes, which includes 433,000 tonnes of wheat and 93,000 tonnes of milled rice. (Table 3 and Annex 5) Given the past trend, out of the total import requirement in 2007, little above three-fourth (400,000 tonnes) is expected to come through commercial import.
Table 3: The 2007 Cereal Balance Sheet (‘000 tonnes)
Domestic Cereal
Food Seed Feed Loss Total Production Surplus/Deficit
Irrigated wheat 187 -- 432 2,878Rainfed wheat 116 -- 241 1,606All wheat 3,941 303 0 673 4,917 4,484 -433Milled rice 419 18 0 26 463 370 -93Maize 49 8 249 54 360 360 0Barley 25 26 263 56 370 370 0Total 4,434 355 512 809 6,110 5,584 -526
CropRequirement
Given the favorable weather pattern, if pests and diseases are contained, production of horticulture crops in 2007 is expected to be higher than the last year by at least 7%.
Page 5
4. Livestock Livestock numbers in Afghanistan in 2003 were estimated at: 3.72 million cattle, 8.76 million sheep, 7.28 million goats, 1.59 million donkeys, 141,000 horses, 175,000 camels and 12.16 million chickens.5 A third of small ruminants and more than half of horses and camels in the country are kept by nomadic livestock owners. Overall situation Pasture and water availability this year is generally satisfactory so far. Livestock diseases causing problems this year included PPR, Enterotoxaemia, Anthrax, sheep pox, FMD and Avian Influenza. A late winter outbreak of PPR was observed in Badakhshan, Takhar, Kunduz, Baghlan and some other parts of the country. Mortality and abortion of the hosts (sheep and goats) were the main results. CCPP was prevalent in cold areas. Rabies created problems in Takhar, Badakshan and parts of Nangharhar. Some diseases cannot be contained because of the costs involved in the treatment. For example, FMD control is not effective partly because vaccination is seen as quite expensive compared to the impact of disease since affected animals rarely die; Newcastle disease control measures are effective because the vaccination is seen as affordable to farmers in light of the consequences of an outbreak, i.e. significant flock mortality. The poultry industry did not suffer severe effects of this year’s H5N1 outbreak, largely as a result of quick and appropriate government responses in terms of culling and compensation. H5N1 has apparently disappeared from Afghanistan now. All outbreaks detected so far have occurred within days to two weeks after outbreaks in Pakistan and all have shown a pattern of spread from Nangarhar province westward and radially outward. Latest reliable data on livestock number and resources are not available. However, given the favorable rainfall pattern, disease control, and very encouraging progress made in the field of animal production, overall livestock production (milk, meat and egg) in 2007 is forecasted to be at least 5% higher than in 2006.
5 Source: FAO Livestock Census, 2003
Page 6
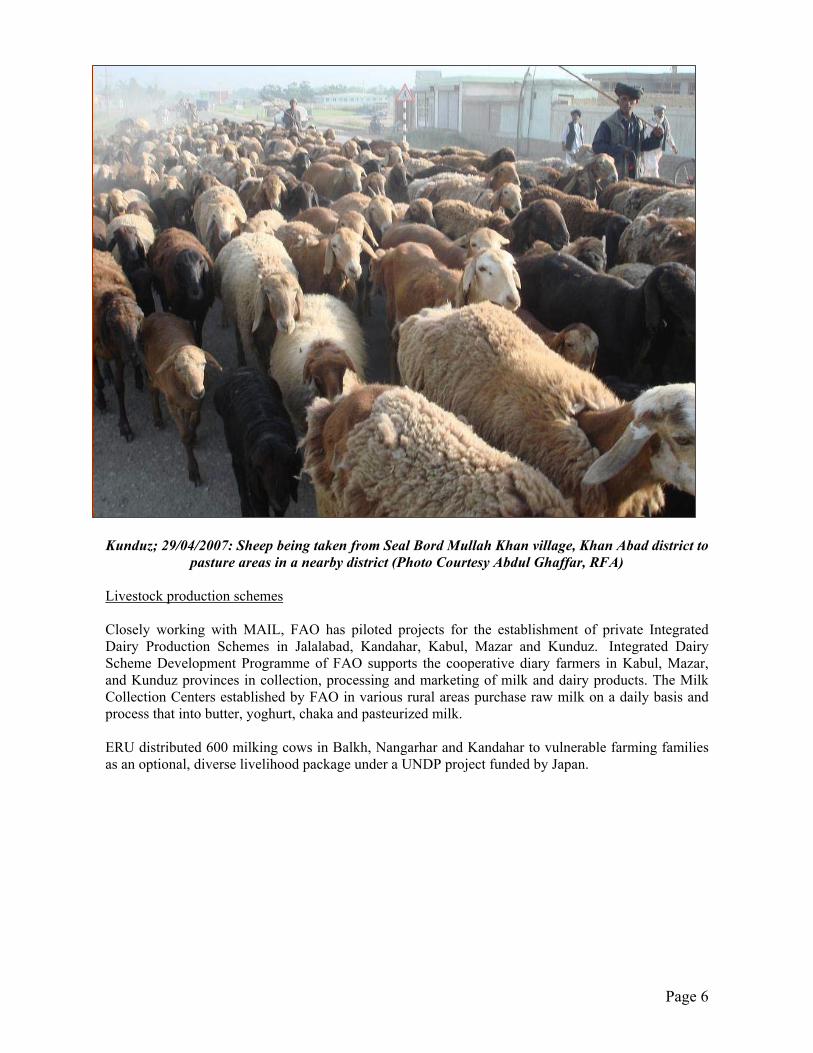
Kunduz; 29/04/2007: Sheep being taken from Seal Bord Mullah Khan village, Khan Abad district to
pasture areas in a nearby district (Photo Courtesy Abdul Ghaffar, RFA) Livestock production schemes Closely working with MAIL, FAO has piloted projects for the establishment of private Integrated Dairy Production Schemes in Jalalabad, Kandahar, Kabul, Mazar and Kunduz. Integrated Dairy Scheme Development Programme of FAO supports the cooperative diary farmers in Kabul, Mazar, and Kunduz provinces in collection, processing and marketing of milk and dairy products. The Milk Collection Centers established by FAO in various rural areas purchase raw milk on a daily basis and process that into butter, yoghurt, chaka and pasteurized milk. ERU distributed 600 milking cows in Balkh, Nangarhar and Kandahar to vulnerable farming families as an optional, diverse livelihood package under a UNDP project funded by Japan.
Page 7
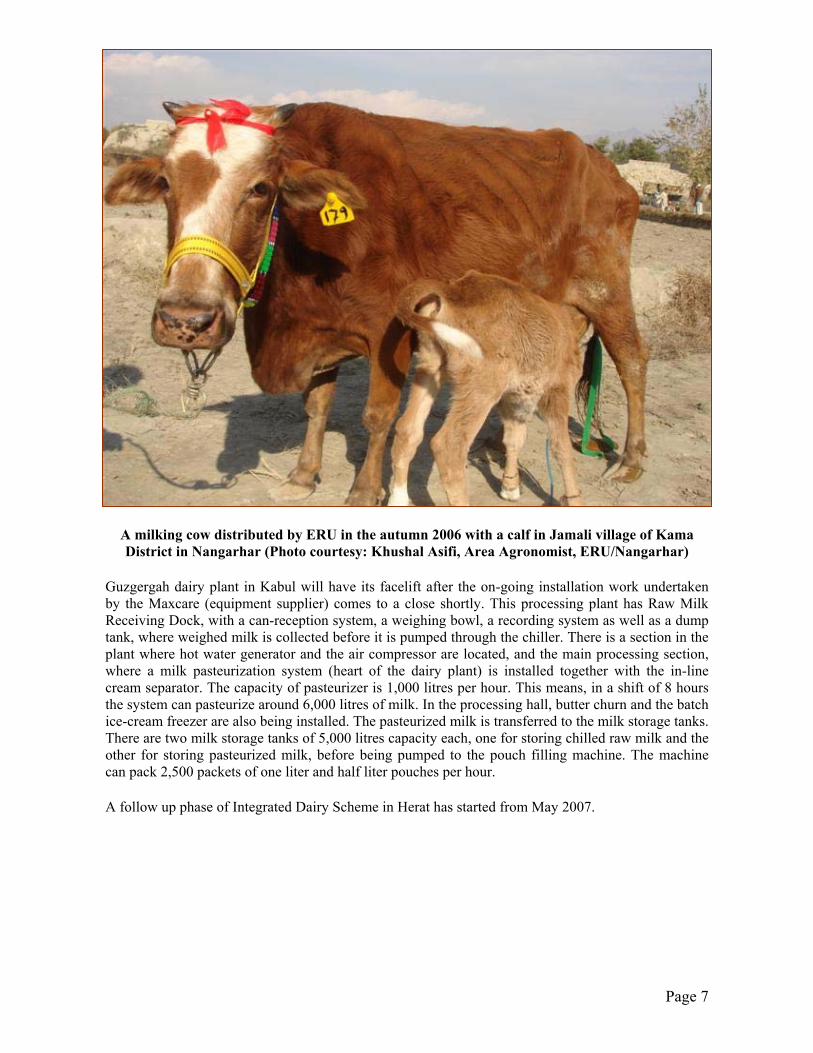
A milking cow distributed by ERU in the autumn 2006 with a calf in Jamali village of Kama District in Nangarhar (Photo courtesy: Khushal Asifi, Area Agronomist, ERU/Nangarhar)
Guzgergah dairy plant in Kabul will have its facelift after the on-going installation work undertaken by the Maxcare (equipment supplier) comes to a close shortly. This processing plant has Raw Milk Receiving Dock, with a can-reception system, a weighing bowl, a recording system as well as a dump tank, where weighed milk is collected before it is pumped through the chiller. There is a section in the plant where hot water generator and the air compressor are located, and the main processing section, where a milk pasteurization system (heart of the dairy plant) is installed together with the in-line cream separator. The capacity of pasteurizer is 1,000 litres per hour. This means, in a shift of 8 hours the system can pasteurize around 6,000 litres of milk. In the processing hall, butter churn and the batch ice-cream freezer are also being installed. The pasteurized milk is transferred to the milk storage tanks. There are two milk storage tanks of 5,000 litres capacity each, one for storing chilled raw milk and the other for storing pasteurized milk, before being pumped to the pouch filling machine. The machine can pack 2,500 packets of one liter and half liter pouches per hour. A follow up phase of Integrated Dairy Scheme in Herat has started from May 2007.
Page 8
Animal Feed Industry The development of private Animal Feed Industry in Afghanistan is very important. The FAO scheme is profitable, unique and beneficial to small livestock producers, including women. Assistance in privatization of FAO-established initiative in animal feed production is desirable.
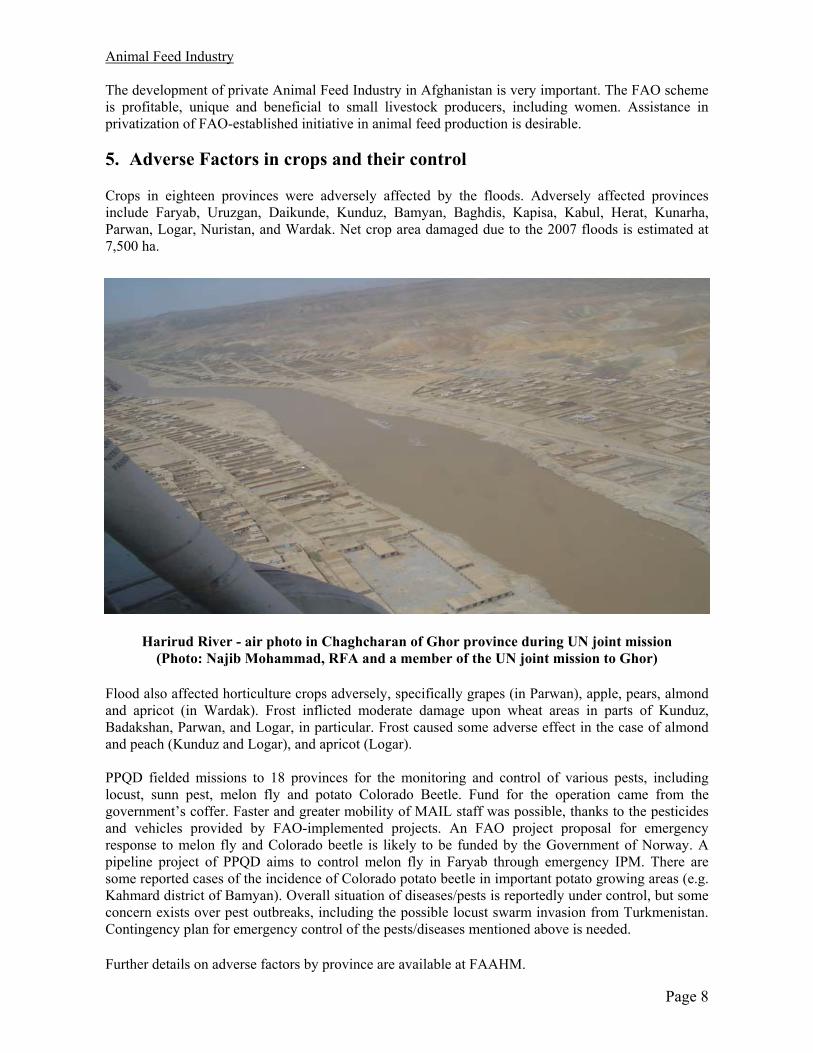
5. Adverse Factors in crops and their control Crops in eighteen provinces were adversely affected by the floods. Adversely affected provinces include Faryab, Uruzgan, Daikunde, Kunduz, Bamyan, Baghdis, Kapisa, Kabul, Herat, Kunarha, Parwan, Logar, Nuristan, and Wardak. Net crop area damaged due to the 2007 floods is estimated at 7,500 ha.
Harirud River - air photo in Chaghcharan of Ghor province during UN joint mission
(Photo: Najib Mohammad, RFA and a member of the UN joint mission to Ghor) Flood also affected horticulture crops adversely, specifically grapes (in Parwan), apple, pears, almond and apricot (in Wardak). Frost inflicted moderate damage upon wheat areas in parts of Kunduz, Badakshan, Parwan, and Logar, in particular. Frost caused some adverse effect in the case of almond and peach (Kunduz and Logar), and apricot (Logar). PPQD fielded missions to 18 provinces for the monitoring and control of various pests, including locust, sunn pest, melon fly and potato Colorado Beetle. Fund for the operation came from the government’s coffer. Faster and greater mobility of MAIL staff was possible, thanks to the pesticides and vehicles provided by FAO-implemented projects. An FAO project proposal for emergency response to melon fly and Colorado beetle is likely to be funded by the Government of Norway. A pipeline project of PPQD aims to control melon fly in Faryab through emergency IPM. There are some reported cases of the incidence of Colorado potato beetle in important potato growing areas (e.g. Kahmard district of Bamyan). Overall situation of diseases/pests is reportedly under control, but some concern exists over pest outbreaks, including the possible locust swarm invasion from Turkmenistan. Contingency plan for emergency control of the pests/diseases mentioned above is needed. Further details on adverse factors by province are available at FAAHM.
Page 9
6. Adverse Factors in livestock and their control Cattle, sheep, goats and chickens are being vaccinated against endemic animal diseases such as peste des petits ruminants (PPR), enterotoxaemia, anthrax, sheep pox, and Newcastle disease. For the Kuchi nomads and farmers, the provision of vaccines and animal drugs is a top priority to prevent the loss of any more breeding animals from livestock diseases. The fight against rabies is also on stream to protect people from this fatal disease. Many farmers and nomads are poor and cannot afford to pay the full price for the vaccines. Rinderpest6 An FAO project “Controlling Trans-boundary Animal Diseases in Central Asia”, funded by the Italian Government through the Special Trust Fund for Food Security, started its activities in August 2004. One of the main objectives of the project is to bring the Central Asian beneficiary countries (Afghanistan, Pakistan, Tajikistan, Turkmenistan and Uzbekistan) to be recognized officially free from rinderpest. The recognition of being officially free from this disease is achieved through the submission of appropriate documentation to the World Animal Health Organization (OIE). Afghanistan is being assisted by FAO in this process through the provision of laboratory equipment, training, supplies of diagnostic kits in order to be able to prove that rinderpest is no longer present in the country7. To fulfill the requirements of the OIE, a sero-surveillance campaign was launched during 2006, in which 6,700 blood samples from cattle and buffaloes were taken throughout the country and tested at the Central Veterinary Diagnostic Laboratory in Kabul. The test results proved that rinderpest no longer exists in Afghanistan. These results are encouraging because the other beneficiary countries of the project are also in the similar, favorable situation. In order for completing the process and acquire sufficient data for the preparation of a dossier to OIE in 2007, the second round of sero-surveillance will be launched. If the results from the second surveillance confirm the previous findings, Afghanistan will be eligible to be declared officially free from rinderpest. Avian Influenza Another FAO project “Regional Network for Avian Influenza in Central Asian countries” started its activities in August 2006. The project is supported by Asian Development Bank (ADB) and FAO through Special Fund for Emergency and Rehabilitation Activities (SFERA). The main purpose of this project is capacity building through training. The beneficiary countries of this regional network are Afghanistan, Azerbaijan, Iran, Kazakhstan, Kyrgyzstan, Pakistan, Tajikistan, Turkmenistan and Uzbekistan. Recognizing the trans-boundary nature of Avian Influenza, the project also aims to develop a harmonized approach to surveillance and its control in the neighboring countries. Afghanistan was supported through the network in implementation of an Emergency Assistance program for Avian Influenza, which was implemented following its outbreaks in 2006. The main purpose of this program was to prove that the areas affected during the 2006 epidemic of Avian Influenza were actually to be considered free from the disease after the completion of the field operations carried out by the Veterinary Services. Since August 2006, about 4,000 households have been visited and as of today more than 6,000 blood samples from domestic poultry have been collected and tested. Culling, vaccination, disinfection and compensation activities were carried out in March 2007. The strategy adopted by the Veterinary Services of MAIL is to carry out culling of affected birds within a 3 km radius from the infected areas. The analysis of the results so far indicates that H5N1 is not enzootic in Afghanistan, i.e., the several outbreaks most probably represent re-introductions from outside Afghanistan, not continued
6 Rinderpest is a devastating infectious viral disease of cattle and buffaloes with a mortality rate of virtually 100%. The presence of this disease in a country will inhibit any possibility of international trade. 7 In Afghanistan the last cases of rinderpest occurred in 1999
Page 10
circulation of the virus within Afghanistan. The analysis further suggests that it is necessary to continue surveillance activities in Jalalabad and Kabul areas in order to verify the absence of on-going outbreaks and detect future re-introductions as early as possible. Further details on the adverse factors for livestock by province are available at FAAHM.
7. Wheat seed production During 2006, implementing partners8 of the MAIL/EC/FAO seed project produced 9,383 tonnes of wheat QDS, of which the private sector partners accounted for 52% of the total quantity produced. Other producers in the country distributed about 3,000 tonnes quality wheat seed. Details on the amount of various types of wheat seeds produced by the FAO seed project are shown in Annex 2.
8. Approach to reduce food deficit Afghanistan is over 90% self-sufficient in cereal production in a good year. It will be far much easier for Afghanistan to narrow the gap in food deficit by reducing pre and post harvest losses of the cereals. For example, the pre-harvest cereal loss due to the locust infestation can be as high as one-fifth of the total production potential. Similarly, if post harvest losses are reduced by 3 percent points, about 75,000 tonnes to 100,000 tonnes of cereals will be available for human consumption. In this connection, the seven areas of interventions -- in order of priority -- are the control of: the locust, sunn pest, rodents, weeds, rust (through varietal changes and improvements), and smut (treatment of seed before sowing/planting), and use of proper storage facilities9.
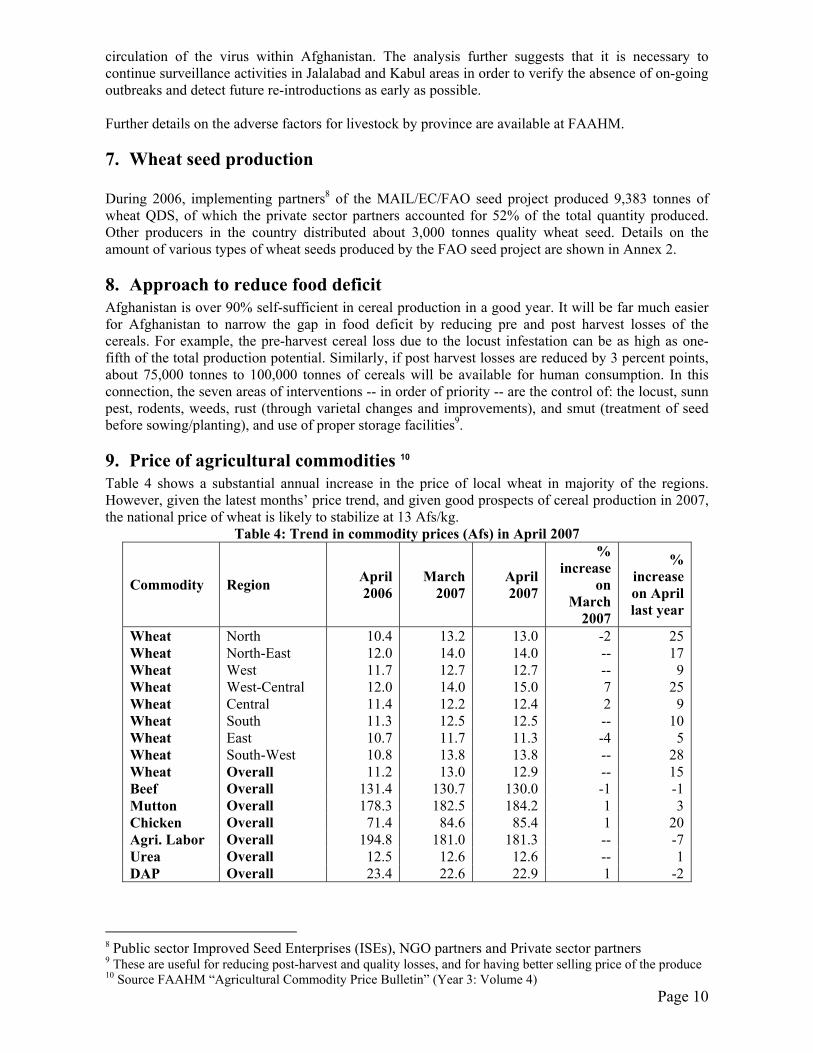
9. Price of agricultural commodities 10 Table 4 shows a substantial annual increase in the price of local wheat in majority of the regions. However, given the latest months’ price trend, and given good prospects of cereal production in 2007, the national price of wheat is likely to stabilize at 13 Afs/kg.
Table 4: Trend in commodity prices (Afs) in April 2007
Commodity Region April2006
March2007
April2007
% increase
on March
2007
% increase on April last year
Wheat North 10.4 13.2 13.0 -2 25Wheat North-East 12.0 14.0 14.0 -- 17Wheat West 11.7 12.7 12.7 -- 9Wheat West-Central 12.0 14.0 15.0 7 25Wheat Central 11.4 12.2 12.4 2 9Wheat South 11.3 12.5 12.5 -- 10Wheat East 10.7 11.7 11.3 -4 5Wheat South-West 10.8 13.8 13.8 -- 28Wheat Overall 11.2 13.0 12.9 -- 15Beef Overall 131.4 130.7 130.0 -1 -1Mutton Overall 178.3 182.5 184.2 1 3Chicken Overall 71.4 84.6 85.4 1 20Agri. Labor Overall 194.8 181.0 181.3 -- -7Urea Overall 12.5 12.6 12.6 -- 1DAP Overall 23.4 22.6 22.9 1 -2
8 Public sector Improved Seed Enterprises (ISEs), NGO partners and Private sector partners 9 These are useful for reducing post-harvest and quality losses, and for having better selling price of the produce 10 Source FAAHM “Agricultural Commodity Price Bulletin” (Year 3: Volume 4)
Page 11
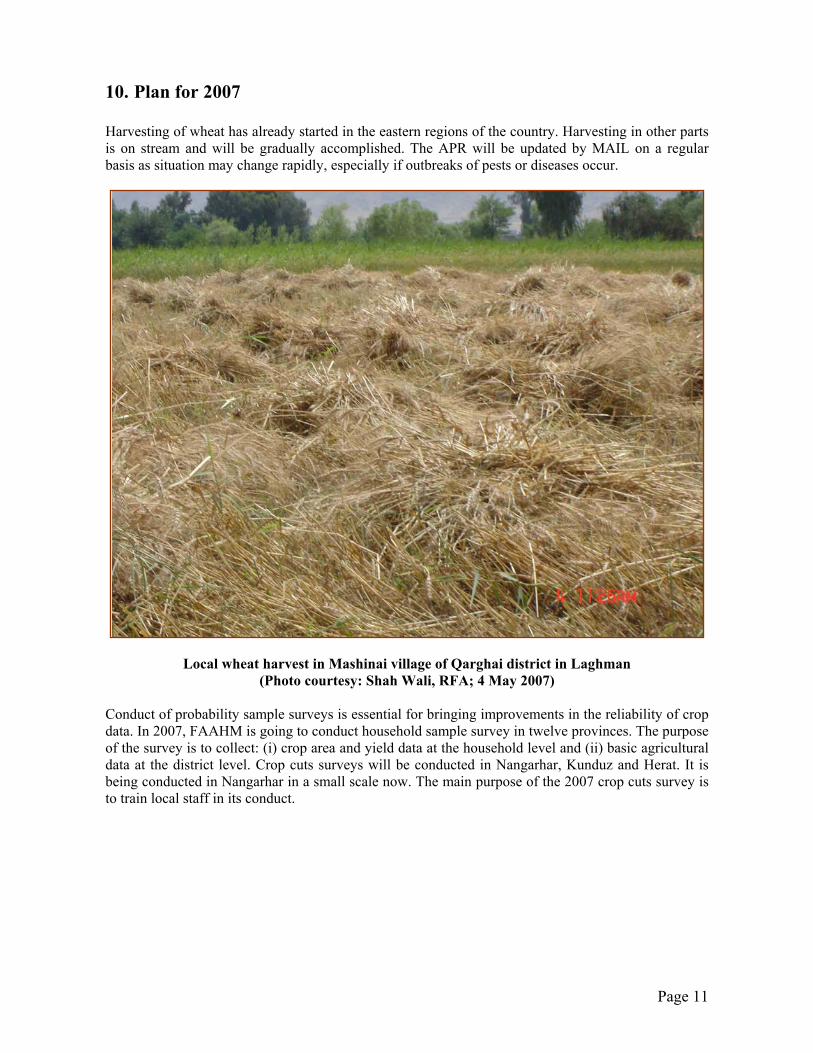
10. Plan for 2007 Harvesting of wheat has already started in the eastern regions of the country. Harvesting in other parts is on stream and will be gradually accomplished. The APR will be updated by MAIL on a regular basis as situation may change rapidly, especially if outbreaks of pests or diseases occur.
Local wheat harvest in Mashinai village of Qarghai district in Laghman
(Photo courtesy: Shah Wali, RFA; 4 May 2007) Conduct of probability sample surveys is essential for bringing improvements in the reliability of crop data. In 2007, FAAHM is going to conduct household sample survey in twelve provinces. The purpose of the survey is to collect: (i) crop area and yield data at the household level and (ii) basic agricultural data at the district level. Crop cuts surveys will be conducted in Nangarhar, Kunduz and Herat. It is being conducted in Nangarhar in a small scale now. The main purpose of the 2007 crop cuts survey is to train local staff in its conduct.
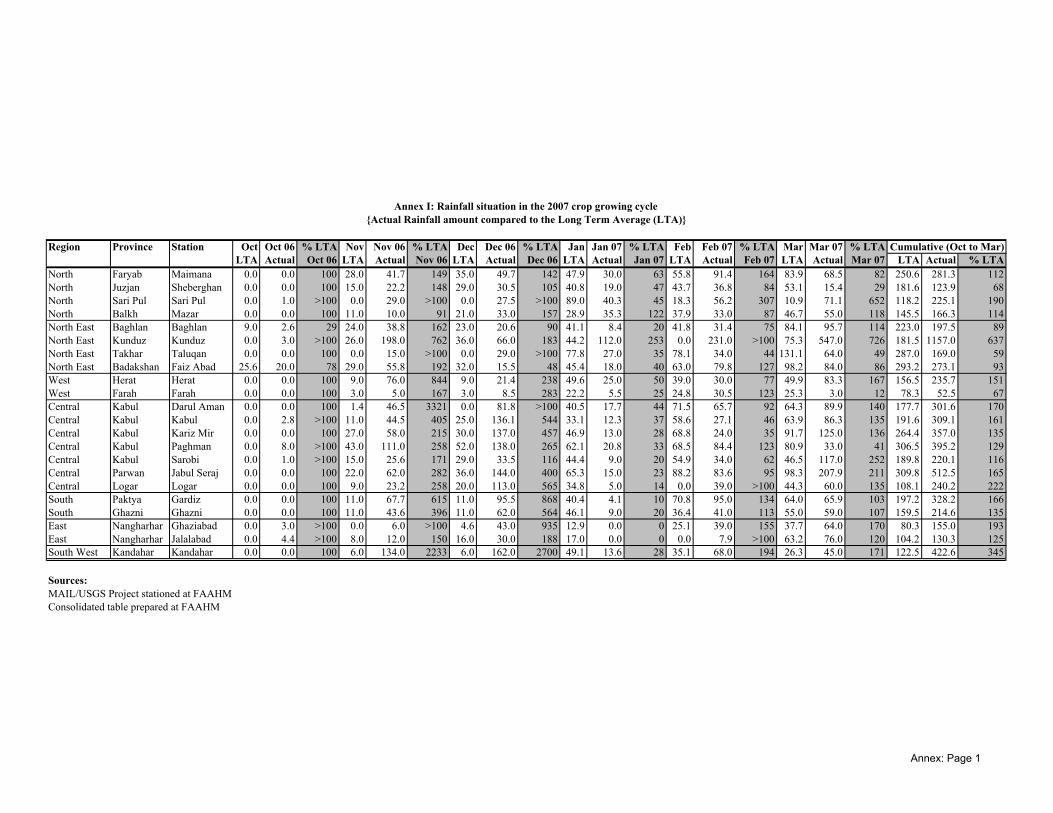
Region Province Station Oct Oct 06 % LTA Nov Nov 06 % LTA Dec Dec 06 % LTA Jan Jan 07 % LTA Feb Feb 07 % LTA Mar Mar 07 % LTALTA Actual Oct 06 LTA Actual Nov 06 LTA Actual Dec 06 LTA Actual Jan 07 LTA Actual Feb 07 LTA Actual Mar 07 LTA Actual % LTA
North Faryab Maimana 0.0 0.0 100 28.0 41.7 149 35.0 49.7 142 47.9 30.0 63 55.8 91.4 164 83.9 68.5 82 250.6 281.3 112North Juzjan Sheberghan 0.0 0.0 100 15.0 22.2 148 29.0 30.5 105 40.8 19.0 47 43.7 36.8 84 53.1 15.4 29 181.6 123.9 68North Sari Pul Sari Pul 0.0 1.0 >100 0.0 29.0 >100 0.0 27.5 >100 89.0 40.3 45 18.3 56.2 307 10.9 71.1 652 118.2 225.1 190North Balkh Mazar 0.0 0.0 100 11.0 10.0 91 21.0 33.0 157 28.9 35.3 122 37.9 33.0 87 46.7 55.0 118 145.5 166.3 114North East Baghlan Baghlan 9.0 2.6 29 24.0 38.8 162 23.0 20.6 90 41.1 8.4 20 41.8 31.4 75 84.1 95.7 114 223.0 197.5 89North East Kunduz Kunduz 0.0 3.0 >100 26.0 198.0 762 36.0 66.0 183 44.2 112.0 253 0.0 231.0 >100 75.3 547.0 726 181.5 1157.0 637North East Takhar Taluqan 0.0 0.0 100 0.0 15.0 >100 0.0 29.0 >100 77.8 27.0 35 78.1 34.0 44 131.1 64.0 49 287.0 169.0 59North East Badakshan Faiz Abad 25.6 20.0 78 29.0 55.8 192 32.0 15.5 48 45.4 18.0 40 63.0 79.8 127 98.2 84.0 86 293.2 273.1 93West Herat Herat 0.0 0.0 100 9.0 76.0 844 9.0 21.4 238 49.6 25.0 50 39.0 30.0 77 49.9 83.3 167 156.5 235.7 151West Farah Farah 0.0 0.0 100 3.0 5.0 167 3.0 8.5 283 22.2 5.5 25 24.8 30.5 123 25.3 3.0 12 78.3 52.5 67Central Kabul Darul Aman 0.0 0.0 100 1.4 46.5 3321 0.0 81.8 >100 40.5 17.7 44 71.5 65.7 92 64.3 89.9 140 177.7 301.6 170Central Kabul Kabul 0.0 2.8 >100 11.0 44.5 405 25.0 136.1 544 33.1 12.3 37 58.6 27.1 46 63.9 86.3 135 191.6 309.1 161Central Kabul Kariz Mir 0.0 0.0 100 27.0 58.0 215 30.0 137.0 457 46.9 13.0 28 68.8 24.0 35 91.7 125.0 136 264.4 357.0 135Central Kabul Paghman 0.0 8.0 >100 43.0 111.0 258 52.0 138.0 265 62.1 20.8 33 68.5 84.4 123 80.9 33.0 41 306.5 395.2 129Central Kabul Sarobi 0.0 1.0 >100 15.0 25.6 171 29.0 33.5 116 44.4 9.0 20 54.9 34.0 62 46.5 117.0 252 189.8 220.1 116Central Parwan Jabul Seraj 0.0 0.0 100 22.0 62.0 282 36.0 144.0 400 65.3 15.0 23 88.2 83.6 95 98.3 207.9 211 309.8 512.5 165Central Logar Logar 0.0 0.0 100 9.0 23.2 258 20.0 113.0 565 34.8 5.0 14 0.0 39.0 >100 44.3 60.0 135 108.1 240.2 222South Paktya Gardiz 0.0 0.0 100 11.0 67.7 615 11.0 95.5 868 40.4 4.1 10 70.8 95.0 134 64.0 65.9 103 197.2 328.2 166South Ghazni Ghazni 0.0 0.0 100 11.0 43.6 396 11.0 62.0 564 46.1 9.0 20 36.4 41.0 113 55.0 59.0 107 159.5 214.6 135East Nangharhar Ghaziabad 0.0 3.0 >100 0.0 6.0 >100 4.6 43.0 935 12.9 0.0 0 25.1 39.0 155 37.7 64.0 170 80.3 155.0 193East Nangharhar Jalalabad 0.0 4.4 >100 8.0 12.0 150 16.0 30.0 188 17.0 0.0 0 0.0 7.9 >100 63.2 76.0 120 104.2 130.3 125South West Kandahar Kandahar 0.0 0.0 100 6.0 134.0 2233 6.0 162.0 2700 49.1 13.6 28 35.1 68.0 194 26.3 45.0 171 122.5 422.6 345
Sources:MAIL/USGS Project stationed at FAAHMConsolidated table prepared at FAAHM
Cumulative (Oct to Mar)
Annex I: Rainfall situation in the 2007 crop growing cycle{Actual Rainfall amount compared to the Long Term Average (LTA)}
Annex: Page 1
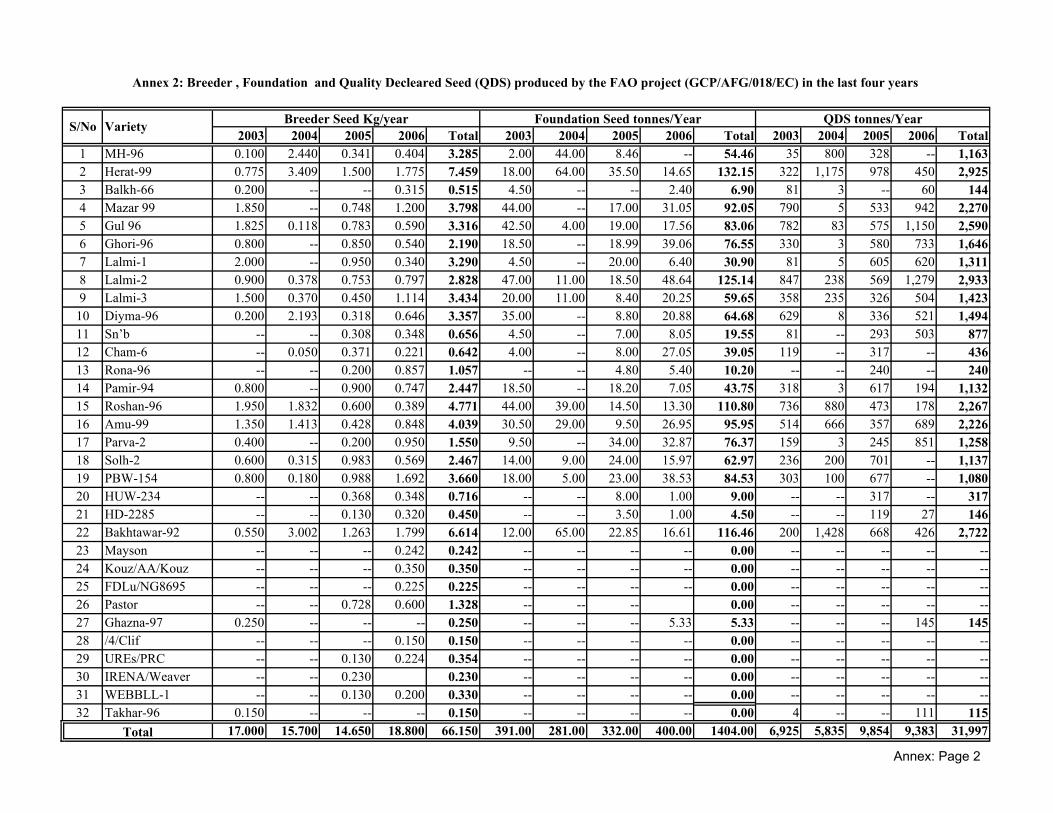
2003 2004 2005 2006 Total 2003 2004 2005 2006 Total 2003 2004 2005 2006 Total1 MH-96 0.100 2.440 0.341 0.404 3.285 2.00 44.00 8.46 -- 54.46 35 800 328 -- 1,1632 Herat-99 0.775 3.409 1.500 1.775 7.459 18.00 64.00 35.50 14.65 132.15 322 1,175 978 450 2,9253 Balkh-66 0.200 -- -- 0.315 0.515 4.50 -- -- 2.40 6.90 81 3 -- 60 1444 Mazar 99 1.850 -- 0.748 1.200 3.798 44.00 -- 17.00 31.05 92.05 790 5 533 942 2,2705 Gul 96 1.825 0.118 0.783 0.590 3.316 42.50 4.00 19.00 17.56 83.06 782 83 575 1,150 2,5906 Ghori-96 0.800 -- 0.850 0.540 2.190 18.50 -- 18.99 39.06 76.55 330 3 580 733 1,6467 Lalmi-1 2.000 -- 0.950 0.340 3.290 4.50 -- 20.00 6.40 30.90 81 5 605 620 1,3118 Lalmi-2 0.900 0.378 0.753 0.797 2.828 47.00 11.00 18.50 48.64 125.14 847 238 569 1,279 2,9339 Lalmi-3 1.500 0.370 0.450 1.114 3.434 20.00 11.00 8.40 20.25 59.65 358 235 326 504 1,423
10 Diyma-96 0.200 2.193 0.318 0.646 3.357 35.00 -- 8.80 20.88 64.68 629 8 336 521 1,49411 Sn’b -- -- 0.308 0.348 0.656 4.50 -- 7.00 8.05 19.55 81 -- 293 503 87712 Cham-6 -- 0.050 0.371 0.221 0.642 4.00 -- 8.00 27.05 39.05 119 -- 317 -- 43613 Rona-96 -- -- 0.200 0.857 1.057 -- -- 4.80 5.40 10.20 -- -- 240 -- 24014 Pamir-94 0.800 -- 0.900 0.747 2.447 18.50 -- 18.20 7.05 43.75 318 3 617 194 1,13215 Roshan-96 1.950 1.832 0.600 0.389 4.771 44.00 39.00 14.50 13.30 110.80 736 880 473 178 2,26716 Amu-99 1.350 1.413 0.428 0.848 4.039 30.50 29.00 9.50 26.95 95.95 514 666 357 689 2,22617 Parva-2 0.400 -- 0.200 0.950 1.550 9.50 -- 34.00 32.87 76.37 159 3 245 851 1,25818 Solh-2 0.600 0.315 0.983 0.569 2.467 14.00 9.00 24.00 15.97 62.97 236 200 701 -- 1,13719 PBW-154 0.800 0.180 0.988 1.692 3.660 18.00 5.00 23.00 38.53 84.53 303 100 677 -- 1,08020 HUW-234 -- -- 0.368 0.348 0.716 -- -- 8.00 1.00 9.00 -- -- 317 -- 31721 HD-2285 -- -- 0.130 0.320 0.450 -- -- 3.50 1.00 4.50 -- -- 119 27 14622 Bakhtawar-92 0.550 3.002 1.263 1.799 6.614 12.00 65.00 22.85 16.61 116.46 200 1,428 668 426 2,72223 Mayson -- -- -- 0.242 0.242 -- -- -- -- 0.00 -- -- -- -- --24 Kouz/AA/Kouz -- -- -- 0.350 0.350 -- -- -- -- 0.00 -- -- -- -- --25 FDLu/NG8695 -- -- -- 0.225 0.225 -- -- -- -- 0.00 -- -- -- -- --26 Pastor -- -- 0.728 0.600 1.328 -- -- -- 0.00 -- -- -- -- --27 Ghazna-97 0.250 -- -- -- 0.250 -- -- -- 5.33 5.33 -- -- -- 145 14528 /4/Clif -- -- -- 0.150 0.150 -- -- -- -- 0.00 -- -- -- -- --29 UREs/PRC -- -- 0.130 0.224 0.354 -- -- -- -- 0.00 -- -- -- -- --30 IRENA/Weaver -- -- 0.230 0.230 -- -- -- -- 0.00 -- -- -- -- --31 WEBBLL-1 -- -- 0.130 0.200 0.330 -- -- -- -- 0.00 -- -- -- -- --32 Takhar-96 0.150 -- -- -- 0.150 -- -- -- -- 0.00 4 -- -- 111 115
17.000 15.700 14.650 18.800 66.150 391.00 281.00 332.00 400.00 1404.00 6,925 5,835 9,854 9,383 31,997
Annex 2: Breeder , Foundation and Quality Decleared Seed (QDS) produced by the FAO project (GCP/AFG/018/EC) in the last four years
Total
S/No Variety Breeder Seed Kg/year Foundation Seed tonnes/Year QDS tonnes/Year
Annex: Page 2
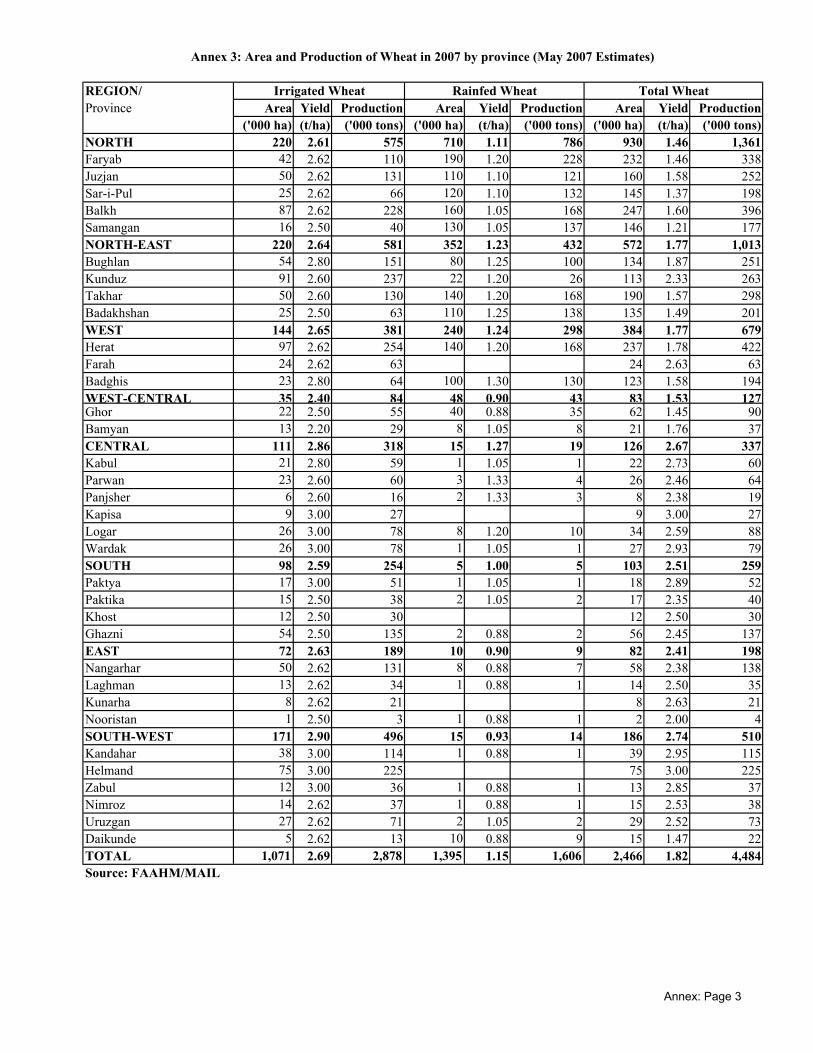
REGION/Province Area Yield Production Area Yield Production Area Yield Production
('000 ha) (t/ha) ('000 tons) ('000 ha) (t/ha) ('000 tons) ('000 ha) (t/ha) ('000 tons)NORTH 220 2.61 575 710 1.11 786 930 1.46 1,361Faryab 42 2.62 110 190 1.20 228 232 1.46 338Juzjan 50 2.62 131 110 1.10 121 160 1.58 252Sar-i-Pul 25 2.62 66 120 1.10 132 145 1.37 198Balkh 87 2.62 228 160 1.05 168 247 1.60 396Samangan 16 2.50 40 130 1.05 137 146 1.21 177NORTH-EAST 220 2.64 581 352 1.23 432 572 1.77 1,013Bughlan 54 2.80 151 80 1.25 100 134 1.87 251Kunduz 91 2.60 237 22 1.20 26 113 2.33 263Takhar 50 2.60 130 140 1.20 168 190 1.57 298Badakhshan 25 2.50 63 110 1.25 138 135 1.49 201WEST 144 2.65 381 240 1.24 298 384 1.77 679Herat 97 2.62 254 140 1.20 168 237 1.78 422Farah 24 2.62 63 24 2.63 63Badghis 23 2.80 64 100 1.30 130 123 1.58 194WEST-CENTRAL 35 2.40 84 48 0.90 43 83 1.53 127Ghor 22 2.50 55 40 0.88 35 62 1.45 90Bamyan 13 2.20 29 8 1.05 8 21 1.76 37CENTRAL 111 2.86 318 15 1.27 19 126 2.67 337Kabul 21 2.80 59 1 1.05 1 22 2.73 60Parwan 23 2.60 60 3 1.33 4 26 2.46 64Panjsher 6 2.60 16 2 1.33 3 8 2.38 19Kapisa 9 3.00 27 9 3.00 27Logar 26 3.00 78 8 1.20 10 34 2.59 88Wardak 26 3.00 78 1 1.05 1 27 2.93 79SOUTH 98 2.59 254 5 1.00 5 103 2.51 259Paktya 17 3.00 51 1 1.05 1 18 2.89 52Paktika 15 2.50 38 2 1.05 2 17 2.35 40Khost 12 2.50 30 12 2.50 30Ghazni 54 2.50 135 2 0.88 2 56 2.45 137EAST 72 2.63 189 10 0.90 9 82 2.41 198Nangarhar 50 2.62 131 8 0.88 7 58 2.38 138Laghman 13 2.62 34 1 0.88 1 14 2.50 35Kunarha 8 2.62 21 8 2.63 21Nooristan 1 2.50 3 1 0.88 1 2 2.00 4SOUTH-WEST 171 2.90 496 15 0.93 14 186 2.74 510Kandahar 38 3.00 114 1 0.88 1 39 2.95 115Helmand 75 3.00 225 75 3.00 225Zabul 12 3.00 36 1 0.88 1 13 2.85 37Nimroz 14 2.62 37 1 0.88 1 15 2.53 38Uruzgan 27 2.62 71 2 1.05 2 29 2.52 73Daikunde 5 2.62 13 10 0.88 9 15 1.47 22TOTAL 1,071 2.69 2,878 1,395 1.15 1,606 2,466 1.82 4,484Source: FAAHM/MAIL
Annex 3: Area and Production of Wheat in 2007 by province (May 2007 Estimates)
Total WheatIrrigated Wheat Rainfed Wheat
Annex: Page 3
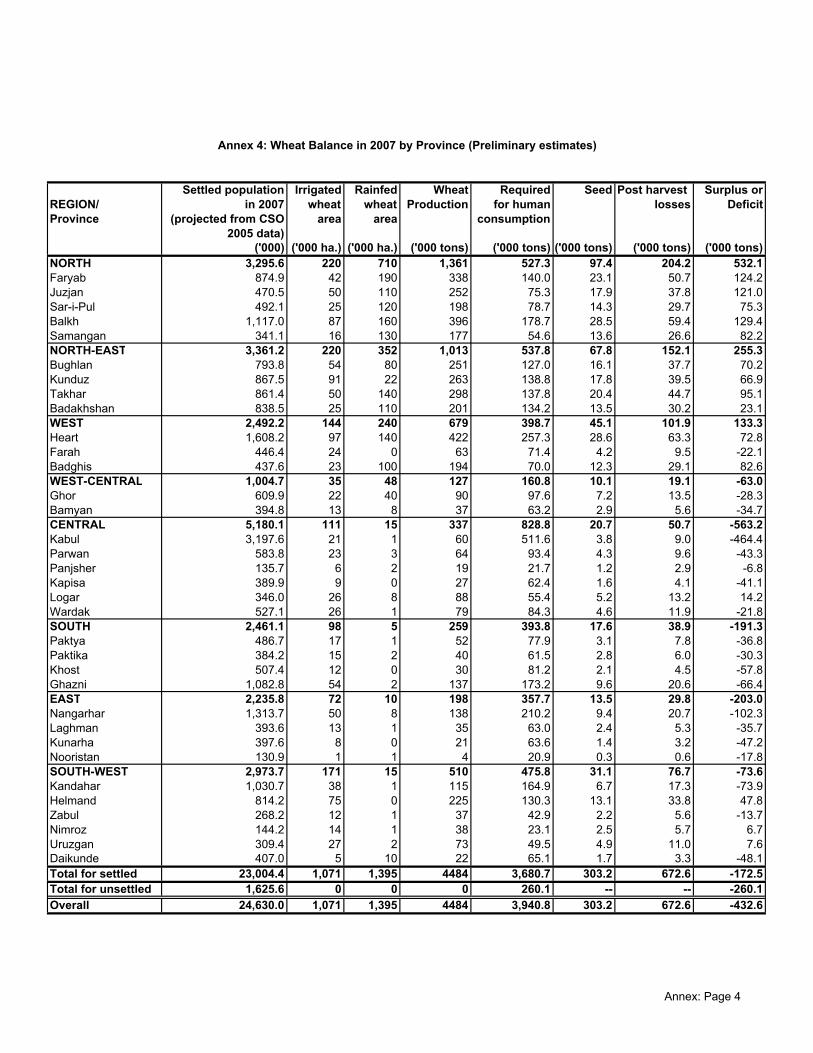
Settled population Irrigated Rainfed Wheat Required Seed Post harvest Surplus orREGION/ in 2007 wheat wheat Production for human losses DeficitProvince (projected from CSO area area consumption
2005 data)('000) ('000 ha.) ('000 ha.) ('000 tons) ('000 tons) ('000 tons) ('000 tons) ('000 tons)
NORTH 3,295.6 220 710 1,361 527.3 97.4 204.2 532.1Faryab 874.9 42 190 338 140.0 23.1 50.7 124.2Juzjan 470.5 50 110 252 75.3 17.9 37.8 121.0Sar-i-Pul 492.1 25 120 198 78.7 14.3 29.7 75.3Balkh 1,117.0 87 160 396 178.7 28.5 59.4 129.4Samangan 341.1 16 130 177 54.6 13.6 26.6 82.2NORTH-EAST 3,361.2 220 352 1,013 537.8 67.8 152.1 255.3Bughlan 793.8 54 80 251 127.0 16.1 37.7 70.2Kunduz 867.5 91 22 263 138.8 17.8 39.5 66.9Takhar 861.4 50 140 298 137.8 20.4 44.7 95.1Badakhshan 838.5 25 110 201 134.2 13.5 30.2 23.1WEST 2,492.2 144 240 679 398.7 45.1 101.9 133.3Heart 1,608.2 97 140 422 257.3 28.6 63.3 72.8Farah 446.4 24 0 63 71.4 4.2 9.5 -22.1Badghis 437.6 23 100 194 70.0 12.3 29.1 82.6WEST-CENTRAL 1,004.7 35 48 127 160.8 10.1 19.1 -63.0Ghor 609.9 22 40 90 97.6 7.2 13.5 -28.3Bamyan 394.8 13 8 37 63.2 2.9 5.6 -34.7CENTRAL 5,180.1 111 15 337 828.8 20.7 50.7 -563.2Kabul 3,197.6 21 1 60 511.6 3.8 9.0 -464.4Parwan 583.8 23 3 64 93.4 4.3 9.6 -43.3Panjsher 135.7 6 2 19 21.7 1.2 2.9 -6.8Kapisa 389.9 9 0 27 62.4 1.6 4.1 -41.1Logar 346.0 26 8 88 55.4 5.2 13.2 14.2Wardak 527.1 26 1 79 84.3 4.6 11.9 -21.8SOUTH 2,461.1 98 5 259 393.8 17.6 38.9 -191.3Paktya 486.7 17 1 52 77.9 3.1 7.8 -36.8Paktika 384.2 15 2 40 61.5 2.8 6.0 -30.3Khost 507.4 12 0 30 81.2 2.1 4.5 -57.8Ghazni 1,082.8 54 2 137 173.2 9.6 20.6 -66.4EAST 2,235.8 72 10 198 357.7 13.5 29.8 -203.0Nangarhar 1,313.7 50 8 138 210.2 9.4 20.7 -102.3Laghman 393.6 13 1 35 63.0 2.4 5.3 -35.7Kunarha 397.6 8 0 21 63.6 1.4 3.2 -47.2Nooristan 130.9 1 1 4 20.9 0.3 0.6 -17.8SOUTH-WEST 2,973.7 171 15 510 475.8 31.1 76.7 -73.6Kandahar 1,030.7 38 1 115 164.9 6.7 17.3 -73.9Helmand 814.2 75 0 225 130.3 13.1 33.8 47.8Zabul 268.2 12 1 37 42.9 2.2 5.6 -13.7Nimroz 144.2 14 1 38 23.1 2.5 5.7 6.7Uruzgan 309.4 27 2 73 49.5 4.9 11.0 7.6Daikunde 407.0 5 10 22 65.1 1.7 3.3 -48.1Total for settled 23,004.4 1,071 1,395 4484 3,680.7 303.2 672.6 -172.5Total for unsettled 1,625.6 0 0 0 260.1 -- -- -260.1Overall 24,630.0 1,071 1,395 4484 3,940.8 303.2 672.6 -432.6
Annex 4: Wheat Balance in 2007 by Province (Preliminary estimates)
Annex: Page 4
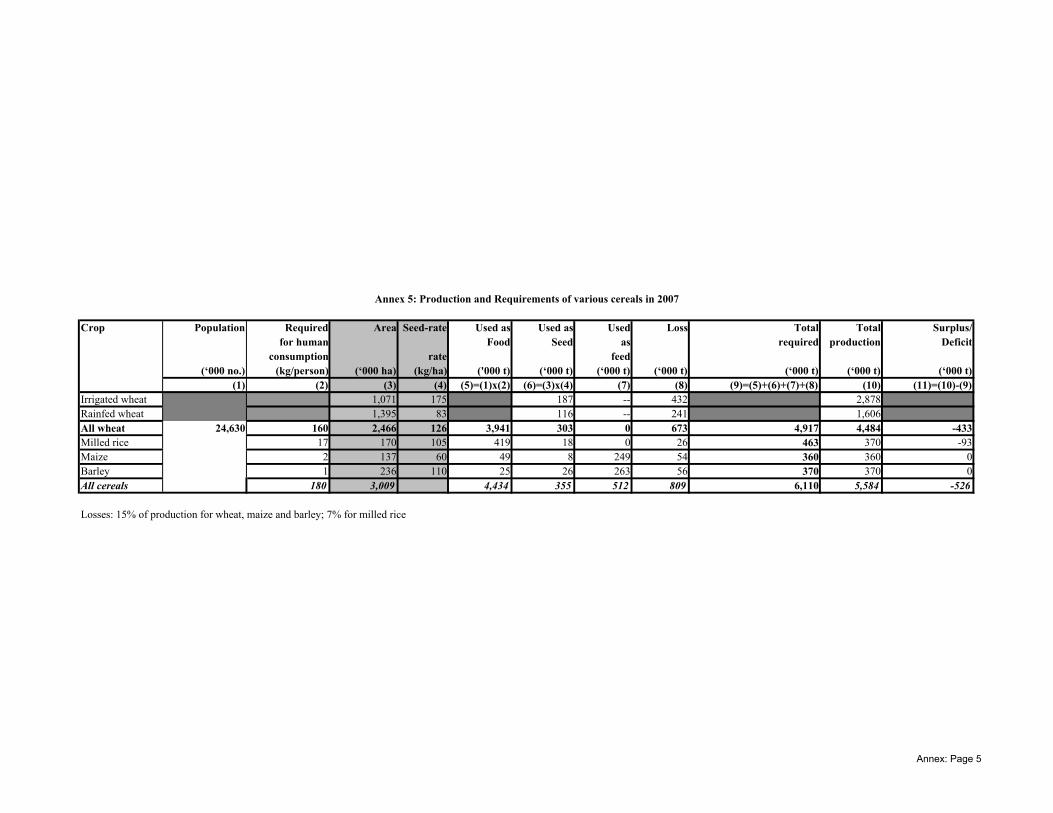
Population Required Area Seed-rate Used as Used as Used Loss Total Total Surplus/for human Food Seed as required production Deficit
consumption rate feed(‘000 no.) (kg/person) (‘000 ha) (kg/ha) ('000 t) (‘000 t) (‘000 t) (‘000 t) (‘000 t) (‘000 t) (‘000 t)
(1) (2) (3) (4) (5)=(1)x(2) (6)=(3)x(4) (7) (8) (9)=(5)+(6)+(7)+(8) (10) (11)=(10)-(9)Irrigated wheat 1,071 175 187 -- 432 2,878Rainfed wheat 1,395 83 116 -- 241 1,606All wheat 24,630 160 2,466 126 3,941 303 0 673 4,917 4,484 -433Milled rice 17 170 105 419 18 0 26 463 370 -93Maize 2 137 60 49 8 249 54 360 360 0Barley 1 236 110 25 26 263 56 370 370 0All cereals 180 3,009 4,434 355 512 809 6,110 5,584 -526
Losses: 15% of production for wheat, maize and barley; 7% for milled rice
Crop
Annex 5: Production and Requirements of various cereals in 2007
Annex: Page 5


![jg Joj:yfksx?sf nflu hnjfo' kl/jt{g lgb]{lzsfcoin.fao.org/coin-static/cms/media/20/14364235142140/climate... ·](https://img.pdfslide.us/doc/110x75/5a8a2a9d7f8b9a7f398b9905/jg-jojyfksxsf-nflu-hnjfo-kljtg-lgblzsf.jpg)


![ChallengeCoinUSA Challenge Coins that ROCK by Challenge Coin … · 2018. 1. 20. · CHALLENGE COIN USA COIN TEMPLATE COIN SIZE: 1.75"C] ART DETAILS: Please use this coin template](https://img.pdfslide.us/doc/110x75/5ff9c3994e904915c47dc15f/challengecoinusa-challenge-coins-that-rock-by-challenge-coin-2018-1-20-challenge.jpg)