Embed Size (px)
Citation preview

8
Agriculture
Coordinating Lead Authors:Pete Smith (UK), Daniel Martino (Uruguay)
Lead Authors:Zucong Cai (PR China), Daniel Gwary (Nigeria), Henry Janzen (Canada), Pushpam Kumar (India), Bruce McCarl (USA), Stephen Ogle
(USA), Frank O’Mara (Ireland), Charles Rice (USA), Bob Scholes (South Africa), Oleg Sirotenko (Russia)
Contributing Authors:Mark Howden (Australia), Tim McAllister (Canada), Genxing Pan (China), Vladimir Romanenkov (Russia), Steven Rose (USA),
Uwe Schneider (Germany), Sirintornthep Towprayoon (Thailand), Martin Wattenbach (UK)
Review Editors:Kristin Rypdal (Norway), Mukiri wa Githendu (Kenya)
This chapter should be cited as:Smith, P., D. Martino, Z. Cai, D. Gwary, H. Janzen, P. Kumar, B. McCarl, S. Ogle, F. O’Mara, C. Rice, B. Scholes, O. Sirotenko,
2007: Agriculture. In Climate Change 2007: Mitigation. Contribution of Working Group III to the Fourth Assessment Report of the
Intergovernmental Panel on Climate Change [B. Metz, O.R. Davidson, P.R. Bosch, R. Dave, L.A. Meyer (eds)], Cambridge University
Press, Cambridge, United Kingdom and New York, NY, USA.

498
Agriculture Chapter8
TableofContents
Executive Summary .................................................. 499
8.1 Introduction ..................................................... 501
8.2 Status of sector, development trends including production and consumption, and implications............................................... 501
8.3 Emission trends (global and regional) ........ 503
8.3.1 Trends since 1990 ............................................... 503
8.3.2 Future global trends ............................................ 503
8.3.3 Regional trends ................................................... 505
8.4 Description and assessment of mitigation technologies and practices, options and potentials, costs and sustainability .............. 505
8.4.1 Mitigation technologies and practices ................ 505
8.4.2 Mitigation technologies and practices: per-area estimates of potential .......................................... 511
8.4.3 Global and regional estimates of agricultural GHG mitigation potential ................................... 514
8.4.4 Bioenergy feed stocks from agriculture .............. 519
8.4.5 Potential implications of mitigation options for sustainable development .................................... 520
8.5 Interactions of mitigation options with adaptation and vulnerability ........................ 522
8.6 Effectiveness of, and experience with, climate policies; potentials, barriers and opportunities/implementation issues ......... 522
8.6.1 Impact of climate policies ................................... 522
8.6.2 Barriers and opportunities/implementation issues .................................................................. 525
8.7 Integrated and non-climate policies affecting emissions of GHGs ....................... 525
8.7.1 Other UN conventions ......................................... 525
8.7.2 Macroeconomic and sectoral policy ................... 526
8.7.3 Other environmental policies .............................. 526
8.8 Co-benefitsandtrade-offsofmitigationoptions ............................................................... 526
8.9 Technology research, development, deployment, diffusion and transfer ............ 530
8.10 Long-term outlook ........................................ 531
References ................................................................... 532

499
Chapter8 Agriculture
EXECUTIVE SUMMARY
Agricultural lands (lands used for agricultural production, consisting of cropland, managed grassland and permanent crops including agro-forestry and bio-energy crops) occupy about 40-50% of the Earth’s land surface.
Agriculture accounted for an estimated emission of 5.1 to 6.1 GtCO2-eq/yr in 2005 (10-12% of total global anthropogenic emissions of greenhouse gases (GHGs)). CH4 contributes 3.3 GtCO2-eq/yr and N2O 2.8 GtCO2-eq/yr. Of global anthropogenic emissions in 2005, agriculture accounts for about 60% of N2O and about 50% of CH4 (medium agreement, medium evidence). Despite large annual exchanges of CO2 between the atmosphere and agricultural lands, the net flux is estimated to be approximately balanced, with CO2 emissions around 0.04 GtCO2/yr only (emissions from electricity and fuel use are covered in the buildings and transport sector, respectively) (low agreement, limited evidence).
Globally, agricultural CH4 and N2O emissions have increased by nearly 17% from 1990 to 2005, an average annual emis-sion increase of about 60 MtCO2-eq/yr. During that period, the five regions composed of Non-Annex I countries showed a 32% increase, and were, by 2005, responsible for about three-quarters of total agricultural emissions. The other five regions, mostly Annex I countries, collectively showed a decrease of 12% in the emissions of these gases (high agreement, much evidence).
A variety of options exists for mitigation of GHG emissions in agriculture. The most prominent options are improved crop and grazing land management (e.g., improved agronomic practices, nutrient use, tillage, and residue management), res-toration of organic soils that are drained for crop production and restoration of degraded lands. Lower but still significant mitigation is possible with improved water and rice manage-ment; set-asides, land use change (e.g., conversion of cropland to grassland) and agro-forestry; as well as improved livestock and manure management. Many mitigation opportunities use current technologies and can be implemented immediately, but technological development will be a key driver ensuring the efficacy of additional mitigation measures in the future (high agreement, much evidence).
Agricultural GHG mitigation options are found to be cost competitive with non-agricultural options (e.g., energy, trans-portation, forestry) in achieving long-term (i.e., 2100) climate objectives. Global long-term modelling suggests that non-CO2 crop and livestock abatement options could cost-effectively contribute 270–1520 MtCO2-eq/yr globally in 2030 with car-bon prices up to 20 US$/tCO2-eq and 640–1870 MtCO2-eq/yr with C prices up to 50 US$/tCO2-eq Soil carbon management options are not currently considered in long-term modelling (medium agreement, limited evidence).
Considering all gases, the global technical mitigation potential from agriculture (excluding fossil fuel offsets from biomass) by 2030 is estimated to be ~5500-6,000 MtCO2-eq/yr (medium agreement, medium evidence). Economic potentials are estimated to be 1500-1600, 2500-2700, and 4000-4300 MtCO2-eq/yr at carbon prices of up to 20, 50 and 100 US$/tCO2-eq, respectively About 70% of the potential lies in non-OECD/EIT countries, 20% in OECD countries and 10% for EIT countries (medium agreement, limited evidence).
Soil carbon sequestration (enhanced sinks) is the mechanism responsible for most of the mitigation potential (high agreement, much evidence), with an estimated 89% contribution to the technical potantial. Mitigation of CH4 emissions and N2O emissions from soils account for 9% and 2%, respectively, of the total mitigation potential (medium agreement, medium evidence). The upper and lower limits about the estimates are largely determined by uncertainty in the per-area estimate for each mitigation measure. Overall, principal sources of uncertainties inherent in these mitigation potentials include: a) future level of adoption of mitigation measures (as influenced by barriers to adoption); b) effectiveness of adopted measures in enhancing carbon sinks or reducing N2O and CH4 emissions (particularly in tropical areas; reflected in the upper and lower bounds given above); and c) persistence of mitigation, as influenced by future climatic trends, economic conditions, and social behaviour (medium agreement, limited evidence).
The role of alternative strategies changes across the range of prices for carbon. At low prices, dominant strategies are those consistent with existing production such as changes in tillage, fertilizer application, livestock diet formulation, and manure management. Higher prices elicit land-use changes that displace existing production, such as biofuels, and allow for use of costly animal feed-based mitigation options. A practice effective in reducing emissions at one site may be less effective or even counterproductive elsewhere. Consequently, there is no universally applicable list of mitigation practices; practices need to be evaluated for individual agricultural systems based on climate, edaphic, social setting, and historical patterns of land use and management (high agreement, much evidence).
GHG emissions could also be reduced by substituting fossil fuels with energy produced from agricultural feed stocks (e.g., crop residues, dung, energy crops), which would be counted in sectors using the energy. The contribution of agriculture to the mitigation potential by using bioenergy depends on relative prices of the fuels and the balance of supply and demand. Using top-down models that include assumptions on such a balance the economic mitigation potential for agriculture in 2030 is estimated to be 70-1260 MtCO2-eq/yr at up to 20 US$/tCO2-eq, and 560-2320 MtCO2-eq/yr at up to 50 US$/tCO2-eq There are no estimates for the additional potential from top down models at carbon prices up to 100 US$/tCO2-eq, but the estimate for prices above 100 US$/tCO2-eq is 2720 MtCO2-eq/yr. These potentials represent mitigation of 5-80%, and 20-90% of all

500
Agriculture Chapter8
other agricultural mitigation measures combined, at carbon prices of up to 20, and up to50 US$/tCO2-eq, respectively. An additional mitigation of 770 MtCO2-eq/yr could be achieved by 2030 by improved energy efficiency in agriculture, though the mitigation potential is counted mainly in the buildings and transport sectors (medium agreement, medium evidence).
Agricultural mitigation measures often have synergy with sustainable development policies, and many explicitly influence social, economic, and environmental aspects of sustainability. Many options also have co-benefits (improved efficiency, reduced cost, environmental co-benefits) as well as trade-offs (e.g., increasing other forms of pollution), and balancing these effects will be necessary for successful implementation (high agreement, much evidence).
There are interactions between mitigation and adaptation in the agricultural sector, which may occur simultaneously, but differ in their spatial and geographic characteristics. The main climate change benefits of mitigation actions will emerge over decades, but there may also be short-term benefits if the drivers achieve other policy objectives. Conversely, actions to enhance adaptation to climate change impacts will have consequences in the short and long term. Most mitigation measures are likely robust to future climate change (e.g., nutrient management), but a subset will likely be vulnerable (e.g., irrigation in regions becoming more arid). It may be possible for a vulnerable practice to be modified as the climate changes and to maintain the efficacy of a mitigation measure (low agreement, limited evidence).
In many regions, non-climate policies related to macro-economics, agriculture and the environment, have a larger impact on agricultural mitigation than climate policies (high agreement, much evidence). Despite significant technical potential for mitigation in agriculture, there is evidence that little progress has been made in the implementation of mitigation measures at the global scale. Barriers to implementation are not likely to be overcome without policy/economic incentives and other programmes, such as those promoting global sharing of innovative technologies.
Current GHG emission rates may escalate in the future due to population growth and changing diets (high agreement, medium evidence). Greater demand for food could result in higher emissions of CH4 and N2O if there are more livestock and greater use of nitrogen fertilizers (high agreement, much evidence). Deployment of new mitigation practices for livestock systems and fertilizer applications will be essential to prevent an increase in emissions from agriculture after 2030. In addition, soil carbon may be more vulnerable to loss with climate change and other pressures, though increases in production will offset some or all of this carbon loss (low agreement, limited evidence).
Overall, the outlook for GHG mitigation in agriculture suggests that there is significant potential (high agreement, medium evidence). Current initiatives suggest that synergy between climate change policies, sustainable development and improvement of environmental quality will likely lead the way forward to realize the mitigation potential in this sector.

501
Chapter8 Agriculture
8.1 Introduction
Agriculture releases to the atmosphere significant amounts of CO2, CH4, and N2O (Cole et al., 1997; IPCC, 2001a; Paustian et al., 2004). CO2 is released largely from microbial decay or burning of plant litter and soil organic matter (Smith, 2004b; Janzen, 2004). CH4 is produced when organic materials decompose in oxygen-deprived conditions, notably from fermentative digestion by ruminant livestock, from stored manures, and from rice grown under flooded conditions (Mosier et al. 1998). N2O is generated by the microbial transformation of nitrogen in soils and manures, and is often enhanced where available nitrogen (N) exceeds plant requirements, especially under wet conditions (Oenema et al., 2005; Smith and Conen, 2004). Agricultural greenhouse gas (GHG) fluxes are complex and heterogeneous, but the active management of agricultural systems offers possibilities for mitigation. Many of these mitigation opportunities use current technologies and can be implemented immediately.
This chapter describes the development of GHG emissions from the agricultural sector (Section 8.2), and details agricultural practices that may mitigate GHGs (Section 8.4.1), with many practices affecting more than one GHG by more than one mechanism. These practices include: cropland management; grazing land management/pasture improvement; management of agricultural organic soils; restoration of degraded lands; livestock management; manure/bio-solid management; and bio-energy production.
It is theoretically possible to increase carbon storage in long-lived agricultural products (e.g., strawboards, wool, leather, bio-plastics) but the carbon held in these products has only increased from 37 to 83 MtC per year over the past 40 years. Assuming a first order decay rate of 10 to 20 % per year, this
is estimated to be a global net annual removal of 3 to 7 MtCO2 from the atmosphere, which is negligible compared to other mitigation measures. The option is not considered further here.
Smith et al. (2007a) recently estimated a global potential mitigation of 770 MtCO2-eq/yr by 2030 from improved energy efficiency in agriculture (e.g., through reduced fossil fuel use), However, this is usually counted in the relevant user sector rather than in agriculture and so is not considered further here. Any savings from improved energy efficiency are discussed in the relevant sections elsewhere in this volume, according to where fossil fuel savings are made, for example, from transport fuels (Chapter 5), or through improved building design (Chapter 6).
8.2 Status of sector, development trends including production and
consumption, and implications
Population pressure, technological change, public policies, and economic growth and the cost/price squeeze have been the main drivers of change in the agricultural sector during the last four decades. Production of food and fibre has more than kept pace with the sharp increase in demand in a more populated world. The global average daily availability of calories per capita has increased (Gilland, 2002), with some notable regional exceptions. This growth, however, has been at the expense of increased pressure on the environment, and depletion of natural resources (Tilman et al., 2001; Rees, 2003), while it has not resolved the problems of food security and child malnutrition suffered in poor countries (Conway and Toenniessen, 1999).
Agricultural land occupied 5023 Mha in 2002 (FAOSTAT, 2006). Most of this area was under pasture (3488 Mha, or 69%)
Area (Mha) Change 2000s/1960s
1961-70 1971-80 1981-90 1991-00 2001-02 % Mha
1. World
Agricultural land 4,562 4,684 4,832 4,985 5,023 +10 461
Arable land 1,297 1,331 1,376 1,393 1,405 +8 107
Permanent crops 82 92 104 123 130 +59 49
Permanent pasture 3,182 3,261 3,353 3,469 3,488 +10 306
2. Developed countries
Agricultural land 1,879 1,883 1,877 1,866 1,838 -2 -41
Arable land 648 649 652 633 613 -5 -35
Permanent crops 23 24 24 24 24 +4 1
Permanent pasture 1,209 1,210 1,201 1,209 1,202 -1 -7
3. Developing countries
Agricultural land 2,682 2,801 2,955 3,119 3,184 +19 502
Arable land 650 682 724 760 792 +22 142
Permanent crops 59 68 80 99 106 +81 48
Permanent pasture 1,973 2,051 2,152 2,260 2,286 +16 313
Table 8.1. Agricultural land use in the last four decades.
Source: FAOSTAT, 2006.

502
Agriculture Chapter8
and cropland occupied 1405 Mha (28%). During the last four decades, agricultural land gained almost 500 Mha from other land uses, a change driven largely by increasing demands for food from a growing population. Every year during this period, an average 6 Mha of forestland and 7 Mha of other land were converted to agriculture, a change occurring largely in the developing world (Table 8.1). This trend is projected to continue into the future (Huang et al., 2002; Trewavas, 2002; Fedoroff and Cohen, 1999; Green et al., 2005), and Rosegrant et al., (2001) project that an additional 500 Mha will be converted to agriculture during 1997-2020, mostly in Latin America and Sub-Saharan Africa.
Technological progress has made it possible to achieve remarkable improvements in land productivity, increasing per-capita food availability (Table 8.2), despite a consistent decline in per-capita agricultural land (Figure 8.1). The share of animal products in the diet has increased consistently in the developing countries, while remaining constant in developed countries (Table 8.2). Economic growth and changing lifestyles in some developing countries are causing a growing demand for meat and dairy products, notably in China where current demands
are low. Meat demand in developing countries rose from 11 to 24 kg/capita/yr during the period 1967-1997, achieving an annual growth rate of more than 5% by the end of that period. Rosegrant et al. (2001) forecast a further increase of 57% in global meat demand by 2020, mostly in South and Southeast Asia, and Sub-Saharan Africa. The greatest increases in demand are expected for poultry (83 % by 2020; Roy et al., 2002).
Annual GHG emissions from agriculture are expected to increase in coming decades (included in the baseline) due to escalating demands for food and shifts in diet. However, improved management practices and emerging technologies may permit a reduction in emissions per unit of food (or of protein) produced. The main trends in the agricultural sector with the implications for GHG emissions or removals are summarized as follows:
• Growth in land productivity is expected to continue, although at a declining rate, due to decreasing returns from further technological progress, and greater use of marginal land with lower productivity. Use of these marginal lands increases the risk of soil erosion and degradation, with highly uncertain consequences for CO2 emissions (Lal, 2004a; Van Oost et al., 2004).
• Conservation tillage and zero-tillage are increasingly being adopted, thus reducing the use of energy and often increas-ing carbon storage in soils. According to FAO (2001), the worldwide area under zero-tillage in 1999 was approxi-mately 50 Mha, representing 3.5% of total arable land. However, such practices are frequently combined with periodical tillage, thus making the assessment of the GHG balance highly uncertain.
• Further improvements in productivity will require higher use of irrigation and fertilizer, increasing the energy demand (for moving water and manufacturing fertilizer; Schlesinger, 1999). Also, irrigation and N fertilization can increase GHG emissions (Mosier, 2001).
• Growing demand for meat may induce further changes in land use (e.g., from forestland to grassland), often increas-ing CO2 emissions, and increased demand for animal
0
0.2
0.4
0.6
0.8
1
1.2
1.4
1960 1970 1980 1990 2000
ha
developed countries developing countries
pasturepasture
arable
arable
Figure 8.1. Per-capita area of arable land and pasture, in developed and develop-ing countries.Source: FAOSTAT, 2006.
Change 2000s/1960s
1961-70 1971-80 1981-90 1991-00 2001-02 % cal/d or g/d
1. Developed countries
Energy, all sources (cal/day) 3049 3181 3269 3223 3309 +9 261
% from animal sources 27 28 28 27 26 -2 --
Protein, all sources (g/day) 92 97 101 99 100 +9 8
% from animal sources 50 55 57 56 56 +12 --
2. Developing countries
Energy, all sources (cal/day) 2032 2183 2443 2600 2657 +31 625
% from animal sources 8 8 9 12 13 +77 --
Protein, all sources (g/day) 9 11 13 18 21 +123 48
% from animal sources 18 20 22 28 30 +67 --Source: FAOSTAT, 2006.
Table 8.2: Per capita food supply in developed and developing countries

503
Chapter8 Agriculture
the other three regions - Latin America and The Caribbean, the countries of Eastern Europe, the Caucasus and Central Asia, and OECD Pacific - CH4 from enteric fermentation was the dominant source (US-EPA, 2006a). This is due to the large livestock population in these three regions which, in 2004, had a combined stock of cattle and sheep equivalent to 36% and 24% of world totals, respectively (FAO, 2003).
Emissions from rice production and burning of biomass were heavily concentrated in the group of developing countries, with 97% and 92% of world totals, respectively. While CH4 emissions from rice occurred mostly in South and East Asia, where it is a dominant food source (82% of total emissions), those from biomass burning originated in Sub-Saharan Africa and Latin America and the Caribbean (74% of total). Manure management was the only source for which emissions where higher in the group of developed regions (52%) than in developing regions (48%; US-EPA, 2006a).
The balance between the large fluxes of CO2 emissions and removals in agricultural land is uncertain. A study by US-EPA (2006b) showed that some countries and regions have net emissions, while others have net removals of CO2. Except for the countries of Eastern Europe, the Caucasus and Central Asia, which had an annual emission of 26 MtCO2/yr in 2000, all other countries showed very low emissions or removals.
8.3.1 Trends since 1990
Globally, agricultural CH4 and N2O emissions increased by 17% from 1990 to 2005, an average annual emission increase of 58 MtCO2-eq/yr (US-EPA, 2006a). Both gases had about the same share of this increase. Three sources together explained 88% of the increase: biomass burning (N2O and CH4), enteric fermentation (CH4) and soil N2O emissions (US-EPA, 2006a).
During that period, according to US-EPA (2006a; Figure 8.2), the five regions composed of Non-Annex I countries showed a 32% increase in non-CO2 emissions (equivalent to 73 MtCO2-eq/yr).The other five regions, with mostly Annex I countries, collectively showed a decrease of 12% (equivalent to 15 MtCO2-eq/yr). This was mostly due to non-climate macroeconomic policies in the Central and Eastern European and the countries of Eastern Europe, the Caucasus and Central Asia (see Section 8.7.1 and 8.7.2).
8.3.2 Future global trends
Agricultural N2O emissions are projected to increase by 35-60% up to 2030 due to increased nitrogen fertilizer use and increased animal manure production (FAO, 2003). Similarly, Mosier and Kroeze (2000) and US-EPA (2006a; Figure 8.2) estimated that N2O emissions will increase by about 50% by 2020 (relative to 1990). If demands for food increase, and diets shift as projected, then annual emissions of GHGs from agriculture may escalate further. But improved management
feeds (e.g., cereals). Larger herds of beef cattle will cause increased emissions of CH4 and N2O, although use of intensive systems (with lower emissions per unit product) is expected to increase faster than growth in grazing-based systems. This may attenuate the expected rise in GHG emissions.
• Intensive production of beef, poultry, and pork is increas-ingly common, leading to increases in manure with con-sequent increases in GHG emissions. This is particularly true in the developing regions of South and East Asia, and Latin America, as well as in North America.
• Changes in policies (e.g., subsidies), and regional patterns of production and demand are causing an increase in inter-national trade of agricultural products. This is expected to increase CO2 emissions, due to greater use of energy for transportation.
• There is an emerging trend for greater use of agricultural products (e.g., bio-plastics bio-fuels and biomass for en-ergy) as substitutes for fossil fuel-based products. This has the potential to reduce GHG emissions in the future.
8.3 Emission trends (global and regional)
With an estimated global emission of non-CO2 GHGs from agriculture of between 5120 MtCO2-eq/yr (Denman et al., 2007) and 6116 MtCO2-eq/yr (US-EPA, 2006a) in 2005, agriculture accounts for 10-12 % of total global anthropogenic emissions of GHGs. Agriculture contributes about 47% and 58% of total anthropogenic emissions of CH4 and N2O, respectively, with a wide range of uncertainty in the estimates of both the agricultural contribution and the anthropogenic total. N2O emissions from soils and CH4 from enteric fermentation constitute the largest sources, 38% and 32% of total non-CO2 emissions from agriculture in 2005, respectively (US-EPA, 2006a). Biomass burning (12%), rice production (11%), and manure management (7%) account for the rest. CO2 emissions from agricultural soils are not normally estimated separately, but are included in the land use, land use change and forestry sector (e.g., in national GHG inventories). So there are few comparable estimates of emissions of this gas in agriculture. Agricultural lands generate very large CO2 fluxes both to and from the atmosphere (IPCC, 2001a), but the net flux is small. US-EPA, 2006b) estimated a net CO2 emission of 40 MtCO2-eq from agricultural soils in 2000, less than 1% of global anthropogenic CO2 emissions.
Both the magnitude of the emissions and the relative importance of the different sources vary widely among world regions (Figure 8.2). In 2005, the group of five regions mostly consisting of non-Annex I countries was responsible for 74% of total agricultural emissions.
In seven of the ten regions, N2O from soils was the main source of GHGs in the agricultural sector in 2005, mainly associated with N fertilizers and manure applied to soils. In

504
Agriculture Chapter8
practices and emerging technologies may permit a reduction in emissions per unit of food (or protein) produced, and perhaps also a reduction in emissions per capita food consumption.
If CH4 emissions grow in direct proportion to increases in livestock numbers, then global livestock-related methane production is expected to increase by 60% up to 2030 (FAO, 2003). However, changes in feeding practices and manure management could ameliorate this increase. US-EPA (2006a) forecast that combined methane emissions from enteric fermentation and manure management will increase by 21% between 2005 and 2020.
The area of rice grown globally is forecast to increase by 4.5% to 2030 (FAO, 2003), so methane emissions from rice production would not be expected to increase substantially. There may even be reductions if less rice is grown under continuous flooding (causing anaerobic soil conditions) as a result of scarcity of water, or if new rice cultivars that emit
less methane are developed and adopted (Wang et al., 1997). However, US-EPA (2006a) projects a 16% increase in CH4 emissions from rice crops between 2005 and 2020, mostly due to a sustained increase in the area of irrigated rice.
No baseline agricultural non-CO2 GHG emission estimates for the year 2030 have been published, but according to US-EPA (2006a), aggregate emissions are projected to increase by ~13% during the decades 2000-2010 and 2010-2020. Assuming similar rates of increase (10-15%) for 2020-2030, agricultural emissions might be expected to rise to 8000–8400, with a mean of 8300 MtCO2-eq by 2030. The future evolution of CO2 emissions from agriculture is uncertain. Due to stable or declining deforestation rates (FAO, 2003), and increased adoption of conservation tillage practices (FAO, 2001), these emissions are likely to decrease or remain at low levels.
Developing countries of South Asia
0
500
1000
1500
2000Mt CO2-eq
N2O Manure
N2O Soils
N2O Burning
CH4 Rice
CH4 Manure
CH4 Enteric
CH4 Burning
Developed regionsDeveloping regions
0
2000
4000
6000
OECD North America (Canada, USA, Mexico)
0
500
1000
1500
2000
1990
1995
2000
2005
2010
2015
2020
1990
1995
2000
2005
2010
2015
2020
1990
1995
2000
2005
2010
2015
2020
OECD Pacific (Australia, New Zealand, Japan, Korea)
Central and Eastern EuropeWestern Europe (EU15, Norway and Switzerland)
0
500
1000
1500
2000
Caucasus and Central AsiaMiddle East and North AfricaLatin America and the Carribean
0
500
1000
1500
2000
Sub-Saharan Africa Developing countries of East Asia
Figure 8.2: Estimated historical and projected N2O and CH4 emissions in the agricultural sector of the ten world regions during the period 1990-2020.
Source: Adapted from US-EPA, 2006a.
505
Chapter8 Agriculture
8.3.3 Regional trends
The Middle East and North Africa, and Sub-Saharan Africa have the highest projected growth in emissions, with a combined 95% increase in the period 1990 to 2020 (US-EPA, 2006a). Sub-Saharan Africa is the one world region where per-capita food production is either in decline, or roughly constant at a level that is less than adequate (Scholes and Biggs, 2004). This trend is linked to low and declining soil fertility (Sanchez, 2002), and inadequate fertilizer inputs. Although slow, the rising wealth of urban populations is likely to increase demand for livestock products. This would result in intensification of agriculture and expansion to still largely unexploited areas, particularly in South and Central Africa (including Angola, Zambia, DRC, Mozambique and Tanzania), with a consequent increase in GHG emissions.
East Asia is projected to show large increases in GHG emissions from animal sources. According to FAO (FAOSTAT, 2006), total production of meat and milk in Asian developing countries increased more than 12 times and 4 times, respectively, from 2004 to 1961. Since the per-capita consumption of meat and milk is still much lower in these countries than in developed countries, increasing trends are expected to continue for a relatively long time. Accordingly, US-EPA (2006a) forecast increases of 153% and 86% in emissions from enteric fermentation and manure management, respectively, from 1990 to 2020. In South Asia, emissions are increasing mostly because of expanding use of N fertilizers and manure to meet demands for food, resulting from rapid population growth.
In Latin America and the Caribbean, agricultural products are the main source of exports. Significant changes in land use and management have occurred, with forest conversion to cropland and grassland being the most significant, resulting in increased GHG emissions from soils (CO2 and N2O). The cattle population has increased linearly from 176 to 379 Mhead between 1961 and 2004, partly offset by a decrease in the sheep population from 125 to 80 Mhead. All other livestock categories have increased in the order of 30 to 600% since 1961. Cropland areas, including rice and soybean, and the use of N fertilizers have also shown dramatic increases (FAOSTAT, 2006). Another major trend in the region is the increased adoption of no-till agriculture, particularly in the Mercosur area (Brazil, Argentina, Paraguay, and Uruguay). This technology is used on ~30 Mha every year in the region, although it is unknown how much of this area is under permanent no-till.
In the countries of Central and Eastern Europe, the Caucasus and Central Asia, agricultural production is, at present, about 60-80% of that in 1990, but is expected to grow by 15-40% above 2001 levels by 2010, driven by the increasing wealth of these countries. A 10-14% increase in arable land area is forecast for the whole of Russia due to agricultural expansion. The
widespread application of intensive management technologies could result in a 2 to 2.5-fold rise in grain and fodder yields, with a consequent reduction of arable land, but may increase N fertilizer use. Decreases in fertilizer N use since 1990 have led to a significant reduction in N2O emissions. But, under favourable economic conditions, the amount of N fertilizer applied will again increase, although unlikely to reach pre-1990 levels in the near future. US-EPA (2006a) projected a 32% increase in N2O emissions from soils in these two regions between 2005 and 2020, equivalent to an average rate of increase of 3.5 MtCO2-eq/yr.
OECD North America and OECD Pacific are the only developed regions showing a consistent increase in GHG emissions in the agricultural sector (18% and 21%, respectively between 1990 and 2020; Figure 8.2). In both cases, the trend is largely driven by non-CO2 emissions from manure management and N2O emissions from soils. In Oceania, nitrogen fertilizer use has increased exponentially over the past 45 years with a 5 and 2.5 fold increase since 1990 in New Zealand and Australia, respectively. In North America, in contrast, nitrogen fertilizer use has remained stable; the main driver for increasing emissions is management of manure from cattle, poultry and swine production, and manure application to soils. In both regions, conservation policies have resulted in reduced CO2 emissions from land conversion. Land clearing in Australia has declined by 60% since 1990 with vegetation management policies restricting further clearing, while in North America, some marginal croplands have been returned to woodland or grassland.
Western Europe is the only region where, according to US-EPA (2006a), GHG emissions from agriculture are projected to decrease to 2020 (Figure 8.2). This is associated with the adoption of a number of climate-specific and other environmental policies in the European Union, as well as economic constraints on agriculture, as discussed in Sections 8.7.1 and 8.7.2.
8.4 Description and assessment of mitigation technologies and
practices, options and potentials, costs and sustainability
8.4.1 Mitigation technologies and practices
Opportunities for mitigating GHGs in agriculture fall into three broad categories1, based on the underlying mechanism:
a. Reducing emissions: Agriculture releases to the atmos-phere significant amounts of CO2, CH4, or N2O (Cole et al., 1997; IPCC, 2001a; Paustian et al., 2004). The fluxes
1 Smith et al. (2007a) have recently reviewed mechanisms for agricultural GHG mitigation. This section draws largely from that study.

506
Agriculture Chapter8
of these gases can be reduced by more efficient manage-ment of carbon and nitrogen flows in agricultural ecosys-tems. For example, practices that deliver added N more ef-ficiently to crops often reduce N2O emissions (Bouwman, 2001), and managing livestock to make most efficient use of feeds often reduces amounts of CH4 produced (Clem-ens and Ahlgrimm, 2001). The approaches that best reduce emissions depend on local conditions, and therefore, vary from region to region.
b. Enhancing removals: Agricultural ecosystems hold large carbon reserves (IPCC, 2001a), mostly in soil organic mat-ter. Historically, these systems have lost more than 50 Pg C (Paustian et al., 1998; Lal, 1999, 2004a), but some of this carbon lost can be recovered through improved manage-ment, thereby withdrawing atmospheric CO2. Any practice that increases the photosynthetic input of carbon and/or slows the return of stored carbon to CO2 via respiration, fire or erosion will increase carbon reserves, thereby ‘se-questering’ carbon or building carbon ‘sinks’. Many stud-ies, worldwide, have now shown that significant amounts of soil carbon can be stored in this way, through a range of practices, suited to local conditions (Lal, 2004a). Sig-nificant amounts of vegetative carbon can also be stored in agro-forestry systems or other perennial plantings on ag-ricultural lands (Albrecht and Kandji, 2003). Agricultural lands also remove CH4 from the atmosphere by oxidation (but less than forests; Tate et al., 2006), but this effect is small compared to other GHG fluxes (Smith and Conen, 2004).
c. Avoiding (or displacing) emissions: Crops and residues from agricultural lands can be used as a source of fuel, ei-ther directly or after conversion to fuels such as ethanol or diesel (Schneider and McCarl, 2003; Cannell, 2003). These bio-energy feedstocks still release CO2 upon com-bustion, but now the carbon is of recent atmospheric origin (via photosynthesis), rather than from fossil carbon. The net benefit of these bio-energy sources to the atmosphere is equal to the fossil-derived emissions displaced, less any emissions from producing, transporting, and processing. GHG emissions, notably CO2, can also be avoided by agri-cultural management practices that forestall the cultivation of new lands now under forest, grassland, or other non-ag-ricultural vegetation (Foley et al., 2005).
Many practices have been advocated to mitigate emissions through the mechanisms cited above. Often, a practice will affect more than one gas, by more than one mechanism, sometimes in opposite ways, so the net benefit depends on the combined effects on all gases (Robertson and Grace, 2004; Schils et al., 2005; Koga et al., 2006). In addition, the temporal pattern of influence may vary among practices or among gases for a given practice; some emissions are reduced indefinitely, other reductions are temporary (Six et al., 2004; Marland et al., 2003a). Where a practice affects radiative forcing through other
mechanisms such as aerosols or albedo, those impacts also need to be considered (Marland et al., 2003b; Andreae et al., 2005).
The impacts of the mitigation options considered are summarized qualitatively in Table 8.3. Although comprehensive life-cycle analyses are not always possible, given the complexity of many farming systems, the table also includes estimates of the confidence based on expert opinion that the practice can reduce overall net emissions at the site of adoption. Some of these practices also have indirect effects on ecosystems elsewhere. For example, increased productivity in existing croplands could avoid deforestation and its attendant emissions (see also Section 8.8). The most important options are discussed in Section 8.4.1.
8.4.1.1 Croplandmanagement
Because often intensively managed, croplands offer many opportunities to impose practices that reduce net GHG emissions (Table 8.3). Mitigation practices in cropland management include the following partly-overlapping categories:
a. Agronomy: Improved agronomic practices that increase yields and generate higher inputs of carbon residue can lead to increased soil carbon storage (Follett, 2001). Ex-amples of such practices include: using improved crop varieties; extending crop rotations, notably those with perennial crops that allocate more carbon below ground; and avoiding or reducing use of bare (unplanted) fal-low (West and Post, 2002; Smith, 2004a, b; Lal, 2003, 2004a; Freibauer et al., 2004). Adding more nutrients, when deficient, can also promote soil carbon gains (Alva-rez, 2005), but the benefits from N fertilizer can be off-set by higher N2O emissions from soils and CO2 from fertilizer manufacture (Schlesinger, 1999; Pérez-Ramírez et al., 2003; Robertson, 2004; Gregorich et al., 2005). Emissions per hectare can also be reduced by adopting cropping systems with reduced reliance on fertilizers, pesticides and other inputs (and therefore, the GHG cost of their production: Paustian et al., 2004). An important example is the use of rotations with legume crops (West and Post, 2002; Izaurralde et al., 2001), which reduce re-liance on external N inputs although legume-derived N can also be a source of N2O (Rochette and Janzen, 2005). Another group of agronomic practices are those that pro-vide temporary vegetative cover between successive agri-cultural crops, or between rows of tree or vine crops. These ‘catch’ or ‘cover’ crops add carbon to soils (Barthès et al., 2004; Freibauer et al., 2004) and may also extract plant-available N unused by the preceding crop, thereby reduc-ing N2O emissions.
b. Nutrient management: Nitrogen applied in fertilizers, ma-nures, biosolids, and other N sources is not always used efficiently by crops (Galloway et al., 2003; Cassman et al., 2003). The surplus N is particularly susceptible to emission

507
Chapter8 Agriculture
of N2O (McSwiney and Robertson, 2005). Consequently, improving N use efficiency can reduce N2O emissions and indirectly reduce GHG emissions from N fertilizer manu-facture (Schlesinger, 1999). By reducing leaching and vol-atile losses, improved efficiency of N use can also reduce off-site N2O emissions. Practices that improve N use effi-ciency include: adjusting application rates based on precise estimation of crop needs (e.g., precision farming); using slow- or controlled-release fertilizer forms or nitrification inhibitors (which slow the microbial processes leading to N2O formation); applying N when least susceptible to loss, often just prior to plant uptake (improved timing); placing the N more precisely into the soil to make it more acces-sible to crops roots; or avoiding N applications in excess of immediate plant requirements (Robertson, 2004; Dalal et al., 2003; Paustian et al., 2004; Cole et al., 1997; Monteny et al., 2006).
c. Tillage/residue management: Advances in weed control methods and farm machinery now allow many crops to be grown with minimal tillage (reduced tillage) or without tillage (no-till). These practices are now increasingly used throughout the world (e.g., Cerri et al., 2004). Since soil disturbance tends to stimulate soil carbon losses through enhanced decomposition and erosion (Madari et al., 2005), reduced- or no-till agriculture often results in soil carbon gain, but not always (West and Post, 2002; Ogle et al., 2005; Gregorich et al., 2005; Alvarez 2005). Adopting re-duced- or no-till may also affect N2O, emissions but the net effects are inconsistent and not well-quantified glo-bally (Smith and Conen, 2004; Helgason et al., 2005; Li et al., 2005; Cassman et al., 2003). The effect of reduced tillage on N2O emissions may depend on soil and climatic conditions. In some areas, reduced tillage promotes N2O emissions, while elsewhere it may reduce emissions or have no measurable influence (Marland et al., 2001). Fur-
Table 8.3: Proposed measures for mitigating greenhouse gas emissions from agricultural ecosystems, their apparent effects on reducing emissions of individual gases where adopted (mitigative effect), and an estimate of scientific confidence that the proposed practice can reduce overall net emissions at the site of adoption.
Mitigative effectsa Net mitigationb (confidence)
Measure Examples CO2 CH4 N2O Agreement Evidence
Cropland management
Agronomy + +/- *** **
Nutrient management + + *** **
Tillage/residue management + +/- ** **
Water management (irrigation, drainage) +/- + * *
Rice management +/- + +/- ** **
Agro-forestry + +/- *** *
Set-aside, land-use change + + + *** ***
Grazing land management/pasture improvement
Grazing intensity +/- +/- +/- * *
Increased productivity (e.g., fertilization) + +/- ** *
Nutrient management + +/- ** **
Fire management + + +/- * *
Species introduction (including legumes) + +/- * **
Management of organic soils
Avoid drainage of wetlands + - +/- ** **
Restoration of degraded lands
Erosion control, organic amendments, nutrient amendments
+ +/- *** **
Livestock management
Improved feeding practices + + *** ***
Specific agents and dietary additives + ** ***
Longer term structural and management changes and animal breeding
+ + ** *
Manure/biosolid management
Improved storage and handling + +/- *** **
Anaerobic digestion + +/- *** *
More efficient use as nutrient source + + *** **
Bio-energy Energy crops, solid, liquid, biogas, residues + +/- +/- *** **Notes:a + denotes reduced emissions or enhanced removal (positive mitigative effect); - denotes increased emissions or suppressed removal (negative mitigative effect); +/- denotes uncertain or variable response.b A qualitative estimate of the confidence in describing the proposed practice as a measure for reducing net emissions of greenhouse gases, expressed as CO2-eq: Agreement refers to the relative degree of consensus in the literature (the more asterisks, the higher the agreement); Evidence refers to the relative amount of data
in support of the proposed effect (the more asterisks, the more evidence).Source: adapted from Smith et al., 2007a.

508
Agriculture Chapter8
ther, no-tillage systems can reduce CO2 emissions from energy use (Marland et al., 2003b; Koga et al., 2006). Systems that retain crop residues also tend to increase soil carbon because these residues are the precursors for soil organic matter, the main carbon store in soil. Avoiding the burning of residues (e.g., mechanising sugarcane harvest-ing, eliminating the need for pre-harvest burning (Cerri et al., 2004)) also avoids emissions of aerosols and GHGs generated from fire, although CO2 emissions from fuel use may increase.
d. Water management: About 18% of the world’s croplands now receive supplementary water through irrigation (Mil-lennium Ecosystem Assessment, 2005). Expanding this area (where water reserves allow) or using more effec-tive irrigation measures can enhance carbon storage in soils through enhanced yields and residue returns (Follett, 2001; Lal, 2004a). But some of these gains may be offset by CO2 from energy used to deliver the water (Schlesing-er 1999; Mosier et al., 2005) or from N2O emissions from higher moisture and fertilizer N inputs (Liebig et al. 2005), The latter effect has not been widely measured. Drainage of croplands lands in humid regions can promote productivity (and hence soil carbon) and perhaps also sup-press N2O emissions by improving aeration (Monteny et al., 2006). Any nitrogen lost through drainage, however, may be susceptible to loss as N2O.(Reay et al. 2003).
e. Rice management: Cultivated wetland rice soils emit sig-nificant quantities of methane (Yan et al., 2003). Emissions during the growing season can be reduced by various prac-tices (Yagi et al., 1997; Wassmann et al., 2000; Aulakh et al., 2001). For example, draining wetland rice once or sev-eral times during the growing season reduces CH4 emis-sions (Smith and Conen, 2004; Yan et al., 2003; Khalil and Shearer, 2006). This benefit, however, may be partly offset by increased N2O emissions (Akiyama et al. 2005), and the practice may be constrained by water supply. Rice cultivars with low exudation rates could offer an important methane mitigation option (Aulakh et al., 2001). In the off-rice sea-son, methane emissions can be reduced by improved water management, especially by keeping the soil as dry as possi-ble and avoiding water logging (Cai et al., 2000 2003; Kang et al., 2002; Xu et al., 2003). Increasing rice production can also enhance soil organic carbon stocks (Pan et al., 2006). Methane emissions can be reduced by adjusting the timing of organic residue additions (e.g., incorporating organic materials in the dry period rather than in flooded periods; Xu et al., 2000; Cai and Xu, 2004), by composting the resi-dues before incorporation, or by producing biogas for use as fuel for energy production (Wang and Shangguan, 1996; Wassmann et al., 2000).
f. Agro-forestry: Agro-forestry is the production of livestock or food crops on land that also grows trees for timber, fire-wood, or other tree products. It includes shelter belts and riparian zones/buffer strips with woody species. The stand-ing stock of carbon above ground is usually higher than the equivalent land use without trees, and planting trees may also increase soil carbon sequestration (Oelbermann et al., 2004; Guo and Gifford, 2002; Mutuo et al., 2005; Paul et al., 2003). But the effects on N2O and CH4 emissions are not well known (Albrecht and Kandji, 2003).
g. Land cover (use) change: One of the most effective meth-ods of reducing emissions is often to allow or encourage the reversion of cropland to another land cover, typically one similar to the native vegetation. The conversion can occur over the entire land area (‘set-asides’), or in localized spots, such as grassed waterways, field margins, or shelterbelts (Follett, 2001; Freibauer et al., 2004; Lal, 2004b; Falloon et al., 2004; Ogle et al., 2003). Such land cover change often increases carbon storage. For example, converting arable cropland to grassland typically results in the accrual of soil carbon because of lower soil disturbance and reduced car-bon removal in harvested products. Compared to cultivated lands, grasslands may also have reduced N2O emissions from lower N inputs, and higher rates of CH4 oxidation, but recovery of oxidation may be slow (Paustian et al., 2004). Similarly, converting drained croplands back to wet-lands can result in rapid accumulation of soil carbon (removal of atmospheric CO2). This conversion may stimulate CH4 emissions because water logging cre-ates anaerobic conditions (Paustian et al., 2004). Plant-ing trees can also reduce emissions. These practices are considered under agro-forestry (Section 8.4.1.1f); af-forestation (Chapter 9), and reafforestation (Chapter 9). Because land cover (or use) conversion comes at the ex-pense of lost agricultural productivity, it is usually an op-tion only on surplus agricultural land or on croplands of marginal productivity.
8.4.1.2 Grazinglandmanagementandpastureimprovement
Grazing lands occupy much larger areas than croplands (FAOSTAT, 2006) and are usually managed less intensively. The following are examples of practices to reduce GHG emissions and to enhance removals:
a. Grazing intensity: The intensity and timing of grazing can influence the removal, growth, carbon allocation, and flora of grasslands, thereby affecting the amount of carbon ac-crual in soils (Conant et al., 2001; 2005; Freibauer et al., 2004; Conant and Paustian, 2002; Reeder et al., 2004). Carbon accrual on optimally grazed lands is often greater than on ungrazed or overgrazed lands (Liebig et al., 2005; Rice and Owensby, 2001). The effects are inconsistent, however, owing to the many types of grazing practices
509
Chapter8 Agriculture
employed and the diversity of plant species, soils, and cli-mates involved (Schuman et al., 2001; Derner et al., 2006). The influence of grazing intensity on emission of non-CO2 gases is not well-established, apart from the direct effects on emissions from adjustments in livestock numbers.
b. Increased productivity: (including fertilization): As for croplands, carbon storage in grazing lands can be im-proved by a variety of measures that promote productivity. For instance, alleviating nutrient deficiencies by fertilizer or organic amendments increases plant litter returns and, hence, soil carbon storage (Schnabel et al., 2001; Conant et al., 2001). Adding nitrogen, however, often stimulates N2O emissions (Conant et al., 2005) thereby offsetting some of the benefits. Irrigating grasslands, similarly, can promote soil carbon gains (Conant et al., 2001). The net effect of this practice, however, depends also on emissions from energy use and other activities on the irrigated land (Schlesinger, 1999).
c. Nutrient management: Practices that tailor nutrient addi-tions to plant uptake, such as those described for croplands, can reduce N2O emissions (Dalal et al., 2003; Follett et al., 2001). Management of nutrients on grazing lands, howev-er, may be complicated by deposition of faeces and urine from livestock, which are not as easily controlled nor as uniformly applied as nutritive amendments in croplands (Oenema et al., 2005).
d. Fire management: On-site biomass burning (not to be con-fused with bio-energy, where biomass is combusted off-site for energy) contributes to climate change in several ways. Firstly, it releases GHGs, notably CH4 and, and to a lesser extent, N2O (the CO2 released is of recent origin, is ab-sorbed by vegetative regrowth, and is usually not included in GHG inventories). Secondly, it generates hydrocarbon and reactive nitrogen emissions, which react to form tropo-spheric ozone, a powerful GHG. Thirdly, fires produce a range of smoke aerosols which can have either warming or cooling effects on the atmosphere; the net effect is thought to be positive radiative forcing (Andreae et al., 2005; Jones et al., 2003; Venkataraman et al., 2005; Andreae, 2001; Andreae and Merlet, 2001; Anderson et al., 2003; Menon et al., 2002). Fourth, fire reduces the albedo of the land sur-face for several weeks, causing warming (Beringer et al., 2003). Finally, burning can affect the proportion of woody versus grass cover, notably in savannahs, which occupy about an eighth of the global land surface. Reducing the frequency or intensity of fires typically leads to increased tree and shrub cover, resulting in a CO2 sink in soil and biomass (Scholes and van der Merwe, 1996). This woody-plant encroachment mechanism saturates over 20-50 years, whereas avoided CH4 and N2O emissions continue as long as fires are suppressed. Mitigation actions involve reducing the frequency or extent of fires through more effective fire suppression; re-
ducing the fuel load by vegetation management; and burn-ing at a time of year when less CH4 and N2O are emitted (Korontzi et al., 2003). Although most agricultural-zone fires are ignited by humans, there is evidence that the area burned is ultimately under climatic control (Van Wilgen et al., 2004). In the absence of human ignition, the fire-prone ecosystems would still burn as a result of climatic factors.
e. Species introduction: Introducing grass species with higher productivity, or carbon allocation to deeper roots, has been shown to increase soil carbon. For example, establishing deep-rooted grasses in savannahs has been reported to yield very high rates of carbon accrual (Fisher et al., 1994), al-though the applicability of these results has not been wide-ly confirmed (Conant et al., 2001; Davidson et al., 1995). In the Brazilian Savannah (Cerrado Biome), integrated crop-livestock systems using Brachiaria grasses and zero tillage are being adopted (Machado and Freitas, 2004). Introducing legumes into grazing lands can promote soil carbon storage (Soussana et al., 2004), through enhanced productivity from the associated N inputs, and perhaps also reduced emissions from fertilizer manufacture if biologi-cal N2 fixation displaces applied N fertilizer N (Sisti et al., 2004; Diekow et al., 2005). Ecological impacts of species introduction need to be considered.
Grazing lands also emit GHGs from livestock, notably CH4 from ruminants and their manures. Practices for reducing these emissions are considered under Section 8.4.1.5: Livestock management.
8.4.1.3 Managementoforganic/peatysoils
Organic or peaty soils contain high densities of carbon accumulated over many centuries because decomposition is suppressed by absence of oxygen under flooded conditions. To be used for agriculture, these soils are drained, which aerates the soil, favouring decomposition and therefore, high CO2 and N2O fluxes. Methane emissions are usually suppressed after draining, but this effect is far outweighed by pronounced increases in N2O and CO2 (Kasimir-Klemedtsson et al., 1997). Emissions from drained organic soils can be reduced to some extent by practices such as avoiding row crops and tubers, avoiding deep ploughing, and maintaining a shallower water table. But the most important mitigation practice is avoiding the drainage of these soils in the first place or re-establishing a high water table (Freibauer et al., 2004).
8.4.1.4 Restorationofdegradedlands
A large proportion of agricultural lands has been degraded by excessive disturbance, erosion, organic matter loss, salinization, acidification, or other processes that curtail productivity (Batjes, 1999; Foley et al., 2005; Lal, 2001a, 2003, 2004b). Often, carbon storage in these soils can be partly restored by practices that reclaim productivity including: re-vegetation (e.g., planting

510
Agriculture Chapter8
grasses); improving fertility by nutrient amendments; applying organic substrates such as manures, biosolids, and composts; reducing tillage and retaining crop residues; and conserving water (Lal, 2001b; 2004b; Bruce et al., 1999; Olsson and Ardö, 2002; Paustian et al., 2004). Where these practices involve higher nitrogen amendments, the benefits of carbon sequestration may be partly offset by higher N2O emissions.
8.4.1.5 Livestockmanagement
Livestock, predominantly ruminants such as cattle and sheep, are important sources of CH4, accounting for about one-third of global anthropogenic emissions of this gas (US-EPA, 2006a). The methane is produced primarily by enteric fermentation and voided by eructation (Crutzen, 1995; Murray et al., 1976; Kennedy and Milligan, 1978). All livestock generate N2O emissions from manure as a result of excretion of N in urine and faeces. Practices for reducing CH4 and N2O emissions from this source fall into three general categories: improved feeding practices, use of specific agents or dietary additives; and longer-term management changes and animal breeding (Soliva et al., 2006; Monteny et al., 2006).
a. Improved feeding practices: Methane emissions can be reduced by feeding more concentrates, normally replac-ing forages (Blaxter and Claperton, 1965; Johnson and Johnson, 1995; Lovett et al., 2003; Beauchemin and McGinn, 2005). Although concentrates may increase daily methane emissions per animal, emissions per kg-feed intake and per kg-product are almost invariably re-duced. The magnitude of this reduction per kg-product decreases as production increases. The net benefit of con-centrates, however, depends on reduced animal numbers or younger age at slaughter for beef animals, and on how the practice affects land use, the N content of manure and emissions from producing and transporting the con-centrates (Phetteplace et al., 2001; Lovett et al., 2006). Other practices that can reduce CH4 emissions include: add-ing certain oils or oilseeds to the diet (e.g., Machmüller et al., 2000; Jordan et al., 2006c); improving pasture quality, especially in less developed regions, because this improves animal productivity, and reduces the proportion of energy lost as CH4 (Leng, 1991; McCrabb et al., 1998; Alcock and Hegarty, 2006); and optimizing protein intake to reduce N excretion and N2O emissions (Clark et al., 2005).
b. Specific agents and dietary additives: A wide range of spe-cific agents, mostly aimed at suppressing methanogenesis, has been proposed as dietary additives to reduce CH4 emis-sions:• Ionophores are antibiotics that can reduce methane
emissions (Benz and Johnson, 1982; Van Nevel and Demeyer, 1996; McGinn et al., 2004), but their effect may be transitory (Rumpler et al., 1986); and they have been banned in the EU.
• Halogenated compounds inhibit methanogenic bacteria (Wolin et al., 1964; Van Nevel and Demeyer, 1995) but their effects, too, are often transitory and they can have side-effects such as reduced intake.
• Novel plant compounds such as condensed tannins (Pinares-Patiño et al., 2003; Hess et al., 2006), saponins (Lila et al., 2003) or essential oils (Patra et al., 2006; Kamra et al., 2006) may have merit in reducing methane emissions, but these responses may often be obtained through reduced digestibility of the diet.
• Probiotics, such as yeast culture, have shown only small, insignificant effects (McGinn et al., 2004), but selecting strains specifically for methane-reducing ability could improve results (Newbold and Rode, 2006).
• Propionate precursors such as fumarate or malate reduce methane formation by acting as alternative hydrogen acceptors (Newbold et al., 2002). But as response is elicited only at high doses, propionate precursors are, therefore, expensive (Newbold et al., 2005).
• Vaccines against methanogenic bacteria are being developed but are not yet available commercially (Wright et al., 2004).
• Bovine somatotropin (bST) and hormonal growth implants do not specifically suppress CH4 formation, but by improving animal performance (Bauman, 1992; Schmidely, 1993), they can reduce emissions per-kg of animal product (Johnson et al., 1991; McCrabb, 2001).
c. Longer-term management changes and animal breeding: Increasing productivity through breeding and better man-agement practices, such as a reduction in the number of replacement heifers, often reduces methane output per unit of animal product (Boadi et al., 2004). Although selecting cattle directly for reduced methane production has been proposed (Kebreab et al., 2006), it is still impractical due to difficulties in accurately measuring methane emissions at a magnitude suitable for breeding programmes. With im-proved efficiency, meat-producing animals reach slaughter weight at a younger age, with reduced lifetime emissions (Lovett and O’Mara, 2002). However, the whole-system effects of such practices may not always lead to reduced emissions. For example in dairy cattle, intensive selection for higher yield may reduce fertility, requiring more re-placement heifers in the herd (Lovett et al., 2006).
8.4.1.6 Manuremanagement
Animal manures can release significant amounts of N2O and CH4 during storage, but the magnitude of these emissions varies. Methane emissions from manure stored in lagoons or tanks can be reduced by cooling, use of solid covers, mechanically separating solids from slurry, or by capturing the CH4 emitted (Amon et al. 2006; Clemens and Ahlgrimm, 2001; Monteny et al. 2001, 2006; Paustian et al., 2004). The manures can also be digested anaerobically to maximize CH4 retrieval as a renewable

511
Chapter8 Agriculture
energy source (Clemens and Ahlgrimm, 2001; Clemens et al., 2006). Handling manures in solid form (e.g., composting) rather than liquid form can suppress CH4 emissions, but may increase N2O formation (Paustian et al., 2004). Preliminary evidence suggests that covering manure heaps can reduce N2O emissions, but the effect of this practice on CH4 emissions is variable (Chadwick, 2005). For most animals, worldwide there is limited opportunity for manure management, treatment, or storage; excretion happens in the field and handling for fuel or fertility amendment occurs when it is dry and methane emissions are negligible (Gonzalez-Avalos and Ruiz-Suarez, 2001). To some extent, emissions from manure might be curtailed by altering feeding practices (Külling et al., 2003; Hindrichsen et al., 2006; Kreuzer and Hindrichsen, 2006), or by composting the manure (Pattey et al., 2005; Amon et al., 2001), but if aeration is inadequate CH4 emissions during composting can still be substantial (Xu et al., 2007). All of these practices require further study from the perspective of their impact on whole life-cycle GHG emissions.
Manures also release GHGs, notably N2O, after application to cropland or deposition on grazing lands. Practices for reducing these emissions are considered in Subsection 8.4.1.1: Cropland management and Subsection 8.4.1.2: Grazing land management.
8.4.1.7 Bioenergy
Increasingly, agricultural crops and residues are seen as sources of feedstocks for energy to displace fossil fuels. A wide range of materials have been proposed for use, including grain, crop residue, cellulosic crops (e.g., switchgrass, sugarcane), and various tree species (Edmonds, 2004; Cerri et al., 2004; Paustian et al., 2004; Sheehan et al., 2004; Dias de Oliveira et al., 2005; Eidman, 2005). These products can be burned directly, but can also be processed further to generate liquid fuels such as ethanol or diesel fuel (Richter, 2004). Such fuels release CO2 when burned, but this CO2 is of recent atmospheric origin (via photosynthetic carbon uptake) and displaces CO2 which otherwise would have come from fossil carbon. The net benefit to atmospheric CO2, however, depends on energy used in growing and processing the bioenergy feedstock (Spatari et al., 2005).
The competition for other land uses and the environmental impacts need to be considered when planning to use energy crops (e.g., European Environment Agency, 2006). The interactions of an expanding bioenergy sector with other land uses, and impacts on agro-ecosystem services such as food production, biodiversity, soil and nature conservation, and carbon sequestration have not yet been adequately studied, but bottom-up approaches (Smeets et al., 2007) and integrated assessment modelling (Hoogwijk et al., 2005; Hoogwijk, 2004)
offer opportunities to improve understanding. Latin America, Sub-Saharan Africa, and Eastern Europe are promising regions for bio-energy, with additional long-term contributions from Oceania and East and Northeast Asia. The technical potential for biomass production may be developed at low production costs in the range of 2 US$/GJ (Hoogwijk, 2004; Rogner et al., 2000).
Major transitions are required to exploit the large potential for bioenergy. Improving agricultural efficiency in developing countries is a key factor. It is still uncertain to what extent, and how fast, such transitions could be realized in different regions. Under less favourable conditions, the regional bio-energy potential(s) could be quite low. Also, technological developments in converting biomass to energy, as well as long distance biomass supply chains (e.g., those involving intercontinental transport of biomass derived energy carriers) can dramatically improve competitiveness and efficiency of bio-energy (Faaij, 2006; Hamelinck et al., 2004).
8.4.2 Mitigation technologies and practices: per-area estimates of potential
As mitigation practices can affect more than one GHG2, it is important to consider the impact of mitigation options on all GHGs (Robertson et al,. 2000; Smith et al., 2001; Gregorich et al., 2005). For non-livestock mitigation options, ranges for per-area mitigation potentials of each GHG are provided in Table 8.4 (tCO2-eq/ha/yr).
Mitigation potentials for CO2 represent the net change in soil carbon pools, reflecting the accumulated difference between carbon inputs to the soil after CO2 uptake by plants, and release of CO2 by decomposition in soil. Mitigation potentials for N2O and CH4 depend solely on emission reductions. Soil carbon stock changes were derived from about 200 studies, and the emission ranges for CH4 and N2O were derived using the DAYCENT and DNDC simulation models (IPCC, 2006; US-EPA, 2006b; Smith et al., 2007b; Ogle et al., 2004, 2005).
Table 8.5 presents the mitigation potentials in livestock (dairy cows, beef cattle, sheep, dairy buffalo and other buffalo) for reducing enteric methane emissions via improved feeding practices, specific agents and dietary additives, and longer term structural and management changes/animal breeding. These estimates were derived by Smith et al. (2007a) using a model similar to that described in US-EPA (2006b).
Some mitigation measures operate predominantly on one GHG (e.g., dietary management of ruminants to reduce CH4 emissions) while others have impacts on more than one GHG (e.g., rice management). Moreover, practices may benefit more
2 Smith et al. (2007a) have recently collated per-area estimates of agricultural GHG mitigation options. This section draws largely from that study.

512
Agriculture Chapter8
Climate zone
Activity
Practice
CO2 (tCO2/ha/yr)
CH4 (tCO2-eq/ha/yr)
N2O (tCO2-eq/ha/yr)
All GHG (tCO2-eq/ha/yr)
Mean
estimateLow High Mean
estimateLow High Mean
estimateLow High Mean
estimateLow High
Cool-dry Croplands Agronomy 0.29 0.07 0.51 0.00 0.00 0.00 0.10 0.00 0.20 0.39 0.07 0.71 Croplands Nutrient
management0.26 -0.22 0.73 0.00 0.00 0.00 0.07 0.01 0.32 0.33 -0.21 1.05
Croplands Tillage and residue management
0.15 -0.48 0.77 0.00 0.00 0.00 0.02 -0.04 0.09 0.17 -0.52 0.86
Croplands Water management
1.14 -0.55 2.82 0.00 0.00 0.00 0.00 0.00 0.00 1.14 -0.55 2.82
Croplands Set-aside and LUC 1.61 -0.07 3.30 0.02 0.00 0.00 2.30 0.00 4.60 3.93 -0.07 7.90 Croplands Agro-forestry 0.15 -0.48 0.77 0.00 0.00 0.00 0.02 -0.04 0.09 0.17 -0.52 0.86 Grasslands Grazing,
fertilization, fire0.11 -0.55 0.77 0.02 0.01 0.02 0.00 0.00 0.00 0.13 -0.54 0.79
Organic soils Restoration 36.67 3.67 69.67 -3.32 -0.05 -15.30 0.16 0.05 0.28 33.51 3.67 54.65 Degraded lands Restoration 3.45 -0.37 7.26 0.08 0.04 0.14 0.00 0.00 0.00 3.53 -0.33 7.40 Manure/
biosolidsApplication 1.54 -3.19 6.27 0.00 0.00 0.00 0.00 -0.17 1.30 1.54 -3.36 7.57
Bioenergy Soils only 0.15 -0.48 0.77 0.00 0.00 0.00 0.02 -0.04 0.09 0.17 -0.52 0.86Cool-moist Croplands Agronomy 0.88 0.51 1.25 0.00 0.00 0.00 0.10 0.00 0.20 0.98 0.51 1.45 Croplands Nutrient
management0.55 0.01 1.10 0.00 0.00 0.00 0.07 0.01 0.32 0.62 0.02 1.42
Croplands tillage and residue management
0.51 0.00 1.03 0.00 0.00 0.00 0.02 -0.04 0.09 0.53 -0.04 1.12
Croplands Water management
1.14 -0.55 2.82 0.00 0.00 0.00 0.00 0.00 0.00 1.14 -0.55 2.82
Croplands Set-aside and LUC 3.04 1.17 4.91 0.02 0.00 0.00 2.30 0.00 4.60 5.36 1.17 9.51 Croplands Agro-forestry 0.51 0.00 1.03 0.00 0.00 0.00 0.02 -0.04 0.09 0.53 -0.04 1.12 Grasslands Grazing,
fertilization, fire0.81 0.11 1.50 0.00 0.00 0.00 0.00 0.00 0.00 0.80 0.11 1.50
Organic soils Restoration 36.67 3.67 69.67 -3.32 -0.05 -15.30 0.16 0.05 0.28 33.51 3.67 54.65 Degraded lands Restoration 3.45 -0.37 7.26 1.00 0.69 1.25 0.00 0.00 0.00 4.45 0.32 8.51 Manure/
biosolidsApplication 2.79 -0.62 6.20 0.00 0.00 0.00 0.00 -0.17 1.30 2.79 -0.79 7.50
Bioenergy Soils only 0.51 0.00 1.03 0.00 0.00 0.00 0.02 -0.04 0.09 0.53 -0.04 1.12Warm-dry Croplands Agronomy 0.29 0.07 0.51 0.00 0.00 0.00 0.10 0.00 0.20 0.39 0.07 0.71 Croplands Nutrient
management0.26 -0.22 0.73 0.00 0.00 0.00 0.07 0.01 0.32 0.33 -0.21 1.05
Croplands Tillage and residue management
0.33 -0.73 1.39 0.00 0.00 0.00 0.02 -0.04 0.09 0.35 -0.77 1.48
Croplands Water management
1.14 -0.55 2.82 0.00 0.00 0.00 0.00 0.00 0.00 1.14 -0.55 2.82
Croplands Set-aside and LUC 1.61 -0.07 3.30 0.02 0.00 0.00 2.30 0.00 4.60 3.93 -0.07 7.90 Croplands Agro-forestry 0.33 -0.73 1.39 0.00 0.00 0.00 0.02 -0.04 0.09 0.35 -0.77 1.48 Grasslands Grazing,
fertilization, fire0.11 -0.55 0.77 0.00 0.00 0.00 0.00 0.00 0.00 0.11 -0.55 0.77
Organic soils Restoration 73.33 7.33 139.33 -3.32 -0.05 -15.30 0.16 0.05 0.28 70.18 7.33 124.31 Degraded lands Restoration 3.45 -0.37 7.26 0.00 0.00 0.00 0.00 0.00 0.00 3.45 -0.37 7.26 Manure/
biosolidsApplication 1.54 -3.19 6.27 0.00 0.00 0.00 0.00 -0.17 1.30 1.54 -3.36 7.57
Bioenergy Soils only 0.33 -0.73 1.39 0.00 0.00 0.00 0.02 -0.04 0.09 0.35 -0.77 1.48Warm-moist
Croplands Agronomy 0.88 0.51 1.25 0.00 0.00 0.00 0.10 0.00 0.20 0.98 0.51 1.45
Croplands Nutrient management
0.55 0.01 1.10 0.00 0.00 0.00 0.07 0.01 0.32 0.62 0.02 1.42
Croplands Tillage and residue management
0.70 -0.40 1.80 0.00 0.00 0.00 0.02 -0.04 0.09 0.72 -0.44 1.89
Croplands Water management
1.14 -0.55 2.82 0.00 0.00 0.00 0.00 0.00 0.00 1.14 -0.55 2.82
Croplands Set-aside and LUC 3.04 1.17 4.91 0.02 0.00 0.00 2.30 0.00 4.60 5.36 1.17 9.51 Croplands Agro-forestry 0.70 -0.40 1.80 0.00 0.00 0.00 0.02 -0.04 0.09 0.72 -0.44 1.89 Grasslands Grazing,
fertilization, fire0.81 0.11 1.50 0.00 0.00 0.00 0.00 0.00 0.00 0.81 0.11 1.50
Organic soils Restoration 73.33 7.33 139.33 -3.32 -0.05 -15.30 0.16 0.05 0.28 70.18 7.33 124.31 Degraded lands Restoration 3.45 -0.37 7.26 0.00 0.00 0.00 0.00 0.00 0.00 3.45 -0.37 7.26 Manure/
biosolidsApplication 2.79 -0.62 6.20 0.00 0.00 0.00 0.00 -0.17 1.30 2.79 -0.79 7.50
Bioenergy Soils only 0.70 -0.40 1.80 0.00 0.00 0.00 0.02 -0.04 0.09 0.72 -0.44 1.89
Notes: The estimates represent average change in soil carbon stocks (CO2) or emissions of N2O and CH4 on a per hectare basis. Positive values represent CO2 uptake which increases the soil carbon stock, or a reduction in emissions of N2O and CH4.Estimates of soil carbon storage (CO2 mitigation) for all practices except management of organic soils were derived from about 200 studies (see IPCC, 2006, Grassland and Cropland Chapters of Volume IV, Annexes 5A and 6A) using a linear mixed-effect modelling approach, which is a standard linear regression technique with the inclusion of random effects due to dependencies in data from the same country, site and time series (Ogle et al., 2004, 2005; IPCC, 2006; Smith et al., 2007b). The studies were conducted in regions throughout the world, but temperate studies were more prevalent leading to smaller uncertainties than for estimates for warm tropical climates. Estimates represent annual soil carbon change rate for a 20-year time horizon in the top 30 cm of the soil. Soils under bio-energy crops and agro-forestry were assumed to derive their mitigation potential mainly from cessation of soil disturbance, and given the same estimates as no-till. Management of organic soils was based on emissions under drained conditions from IPCC guidelines (IPCC, 1997). Soil CH4 and N2O emission reduction potentials were derived as follows:
a) for organic soils, N2O emissions were based on the median, low and high nutrient status organic soil N2O emission factors from the IPCC GPG LULUCF (IPCC, 2003) and CH4 emissions were based on low, high and median values from Le Mer and Roger (2001); b) N2O figures for nutrient management were derived using the DAYCENT simulation model, and include both direct emissions from nitrification/denitrification at the site, as well as indirect N2O emissions associated with volatilization and leaching/runoff of N that is converted into N2O following atmospheric deposition or in waterways, respectively (US-EPA, 2006b; assuming a N reduction to 80% of current application);c) N2O figures for tillage and residue management were derived using DAYCENT (US-EPA, 2006b; figures for no till);d) Rice figures were taken directly from US-EPA (2006b) so are not shown here. Low and high values represent the range of a 95% confidence interval. Table 8.4 has mean and uncertainty for change in soil C, N2O and CH4 emissions at the climate region scale, and are not intended for use in assessments at finer scales such as individual farms.
Table 8.4: Annual mitigation potentials in each climate region for non-livestock mitigation options

513
Chapter8 Agriculture
than one gas (e.g., set-aside/headland management) while others involve a trade-off between gases (e.g., restoration of organic soils). The effectiveness of non-livestock mitigation options are variable across and within climate regions (see Table 8.4). Consequently, a practice that is highly effective in reducing emissions at one site may be less effective or even counter-productive elsewhere. Similarly, effectiveness of livestock options also varies regionally (Table 8.5). This means that there is no universally applicable list of mitigation practices, but that proposed practices will need to be evaluated for individual agricultural systems according to the specific climatic, edaphic, social settings, and historical land use and management.
Assessments can be conducted to evaluate the effectiveness of practices in specific areas, building on findings from the global scale assessment reported here. In addition, such assessments could address GHG emissions associated with energy use and other inputs (e.g., fuel, fertilizers, and pesticides) in a full life cycle analysis for the production system.
The effectiveness of mitigation strategies also changes with time. Some practices, like those which elicit soil carbon gain, have diminishing effectiveness after several decades; others such as methods that reduce energy use may reduce emissions indefinitely. For example, Six et al. (2004) found a strong
Table 8.5: Technical reduction potential (proportion of an animal’s enteric methane production) for enteric methane emissions due to (i) improved feeding practices, (ii) spe-cific agents and dietary additives and (iii) longer term structural/management change and animal breedinga
Improved feeding practicesb Specific agents and dietary additivescLonger term structural/management change and animal breedingd
AEZ regionsDairy cows
Beef cattle Sheep
Dairy buffalo
Non-dairy buffalo
Dairy cows
Beef cattle Sheep
Dairy buffalo
Non-dairy buffalo
Dairy cows
Beef cattle Sheep
Dairy buffalo
Non-dairy buffalo
Northern Europe 0.18 0.12 0.04 0.08 0.04 0.004 0.04 0.03 0.003
Southern. Europe 0.18 0.12 0.04 0.08 0.04 0.004 0.04 0.03 0.003
Western Europe 0.18 0.12 0.04 0.08 0.04 0.004 0.04 0.03 0.003
Eastern. Europe 0.11 0.06 0.03 0.04 0.01 0.002 0.03 0.07 0.003
Russian Federation 0.10 0.05 0.03 0.03 0.04 0.002 0.03 0.06 0.003
Japan 0.17 0.11 0.04 0.08 0.09 0.004 0.03 0.03 0.003
South Asia 0.04 0.02 0.02 0.04 0.02 0.01 0.01 0.0005 0.01 0.002 0.01 0.01 0.001 0.01 0.02
East Asia 0.10 0.05 0.03 0.10 0.05 0.03 0.05 0.002 0.03 0.012 0.03 0.06 0.003 0.03 0.07
West Asia 0.06 0.03 0.02 0.06 0.03 0.01 0.02 0.001 0.01 0.004 0.01 0.02 0.001 0.02 0.03
Southeast Asia 0.06 0.03 0.02 0.06 0.03 0.01 0.02 0.001 0.01 0.004 0.01 0.02 0.001 0.02 0.03
Central Asia 0.06 0.03 0.02 0.06 0.03 0.01 0.02 0.001 0.01 0.004 0.01 0.02 0.001 0.02 0.03
Oceania 0.22 0.14 0.06 0.08 0.08 0.004 0.05 0.03 0.004
North America 0.16 0.11 0.04 0.11 0.09 0.004 0.03 0.03 0.003
South America 0.06 0.03 0.02 0.03 0.02 0.001 0.02 0.03 0.002
Central America 0.03 0.02 0.02 0.02 0.01 0.001 0.01 0.02 0.002
East Africa 0.01 0.01 0.01 0.003 0.004 0.0002 0.004 0.006 0.0004
West Africa 0.01 0.01 0.01 0.003 0.004 0.0002 0.004 0.006 0.0004
North Africa 0.01 0.01 0.01 0.003 0.004 0.0002 0.004 0.006 0.0004
South Africa 0.01 0.01 0.01 0.003 0.004 0.0002 0.004 0.006 0.0004
Middle Africa 0.01 0.01 0.01 0.003 0.004 0.0002 0.004 0.006 0.0004
Notes: a The proportional reduction due to application of each practice was estimated from reports in the scientific literature (see footnotes below). These estimates were adjusted for: (i) proportion of the animal’s life where the practice was applicable; (ii) technical adoption feasibility in a region, such as whether farmers have the necessary knowledge, equipment, extension services, etc. to apply the practice (average dairy cow milk production
in each region over the period 2000-2004 was used as an index of the level of technical efficiency in the region, and was used to score a region’s technical adoption feasibility); (iii) proportion of animals in a region that the measure can be applied (i.e. if the measure is already being applied to some animals as in the case of bST use in North America, it is considered to
be only applicable to the proportion of animals not currently receiving the product; (iv) Non-additivity of simultaneous application of multiple measures. There is evidence in the literature that some measures are not additive when applied simultaneously, such as the use of dietary oils and ionophores, but this is probably not the case with most
measures. However, the model used (as described in Smith et al., 2007a) did account for the fact that once one measure is applied, the emissions base for the second measure is reduced, and so on, and a further 20% reduction in mitigation potential was incorporated to account for unknown non-additivity effects. Only measures considered feasible for a region were applied in that region (e.g., bST was not considered for European regions due to the ban on its use in the EU). It was assumed that total production of milk or meat was not affected by application of the practices, so that if a measure increased animal productivity, animal numbers were reduced in order to keep production constant.
b Includes replacing roughage with concentrate (Blaxter & Claperton, 1965; Moe & Tyrrell, 1979; Johnson & Johnson, 1995; Yan et al., 2000; Mills et al., 2003; Beauchemin & McGinn, 2005; Lovett et al., 2006), improving forages/inclusion of legumes (Leng, 1991; McCrabb et al., 1998; Woodward et al., 2001; Waghorn et al., 2002; Pinares-Patiño et al., 2003; Alcock & Hegarty, 2006) and feeding extra dietary oil (Machmüller et al., 2000; Dohme et al., 2001; Machmüller et al., 2003, Lovett et al., 2003; McGinn et al., 2004; Beauchemin & McGinn, 2005; Jordan et al., 2006a; Jordan et al., 2006b; Jordan et al., 2006c).
c Includes bST (Johnson et al., 1991; Bauman, 1992), growth hormones (McCrabb, 2001), ionophores (Benz & Johnson, 1982; Rumpler et al., 1986; Van Nevel & Demeyer, 1996; McGinn et al., 2004), propionate precursors (McGinn et al., 2004; Beauchemin & McGinn, 2005; Newbold et al., 2005; Wallace et al., 2006).
d Includes lifetime management of beef cattle (Johnson et al., 2002; Lovett & O’Mara, 2002) and improved productivity through animal breeding (Ferris et al., 1999; Hansen, 2000; Robertson and Waghorn, 2002; Miglior et al., 2005).
Source: adapted from Smith et al., 2007a.
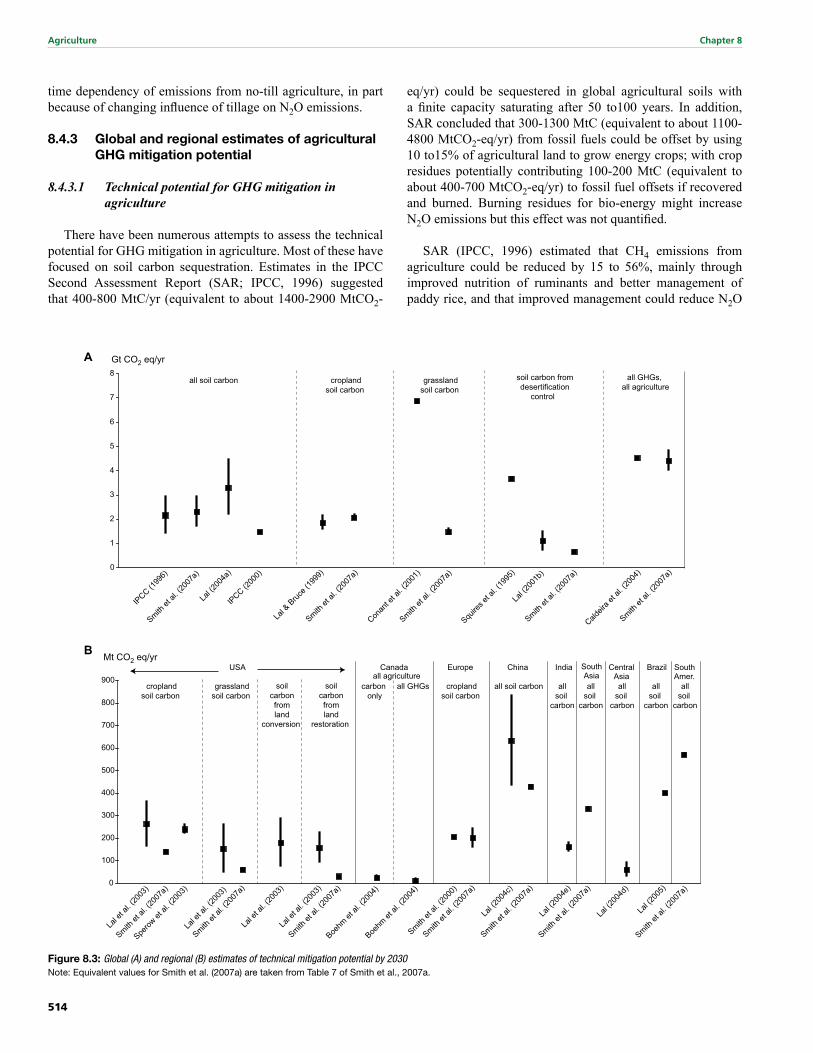
514
Agriculture Chapter8
time dependency of emissions from no-till agriculture, in part because of changing influence of tillage on N2O emissions.
8.4.3 Global and regional estimates of agricultural GHG mitigation potential
8.4.3.1 TechnicalpotentialforGHGmitigationinagriculture
There have been numerous attempts to assess the technical potential for GHG mitigation in agriculture. Most of these have focused on soil carbon sequestration. Estimates in the IPCC Second Assessment Report (SAR; IPCC, 1996) suggested that 400-800 MtC/yr (equivalent to about 1400-2900 MtCO2-
eq/yr) could be sequestered in global agricultural soils with a finite capacity saturating after 50 to100 years. In addition, SAR concluded that 300-1300 MtC (equivalent to about 1100-4800 MtCO2-eq/yr) from fossil fuels could be offset by using 10 to15% of agricultural land to grow energy crops; with crop residues potentially contributing 100-200 MtC (equivalent to about 400-700 MtCO2-eq/yr) to fossil fuel offsets if recovered and burned. Burning residues for bio-energy might increase N2O emissions but this effect was not quantified.
SAR (IPCC, 1996) estimated that CH4 emissions from agriculture could be reduced by 15 to 56%, mainly through improved nutrition of ruminants and better management of paddy rice, and that improved management could reduce N2O
0
1
2
3
4
5
6
7
8
A
B
Gt CO2 eq/yr
Mt CO2 eq/yr
IPCC (1
996)
Smith
et a
l. (20
07a)
Lal (
2004
a)
IPCC (2
000)
Lal &
Bru
ce (1
999)
Smith
et a
l. (20
07a)
Conan
t et a
l. (20
01)
Smith
et a
l. (20
07a)
Squire
s et a
l. (19
95)
Lal (
2001
b)
Smith
et a
l. (20
07a)
Caldeir
a et
al. (
2004
)
Smith
et a
l. (20
07a)
all soil carbon croplandsoil carbon
grasslandsoil carbon
soil carbon fromdesertification
control
all GHGs, all agriculture
0
100
200
300
400
500
600
700
800
900
Lal e
t al. (
2003
)
Smith
et a
l. (20
07a)
Spero
w et a
l. (20
03)
Lal e
t al. (
2003
)
Smith
et a
l. (20
07a)
Lal e
t al. (
2003
)
Lal e
t al. (
2003
)
Smith
et a
l. (20
07a)
Boehm
et a
l. (20
04)
Boehm
et a
l. (20
04)
Smith
et a
l. (20
00)
Smith
et a
l. (20
07a)
Lal (
2004
c)
Smith
et a
l. (20
07a)
Lal (
2004
e)
Smith
et a
l. (20
07a)
Lal (
2004
d)
Lal (
2005
)
Smith
et a
l. (20
07a)
croplandsoil carbon
grasslandsoil carbon
soilcarbonfromland
conversion
soilcarbonfromland
restoration
USA Canadaall agriculture
carbon only
all GHGs
Europe
croplandsoil carbon
China
all soil carbon allsoil
carbon
allsoil
carbon
allsoil
carbon
allsoil
carbon
allsoil
carbon
India BrazilSouthAsia
CentralAsia
SouthAmer.
Figure 8.3: Global (A) and regional (B) estimates of technical mitigation potential by 2030 Note: Equivalent values for Smith et al. (2007a) are taken from Table 7 of Smith et al., 2007a.

515
Chapter8 Agriculture
emissions by 9-26%. The document also stated that GHG mitigation techniques will not be adopted by land managers unless they improve profitability but some measures are adopted for reasons other than climate mitigation. Options that both reduce GHG emissions and increase productivity are more likely to be adopted than those which only reduce emissions.
Of published estimates of technical potential, only Caldeira et al. (2004) and Smith et al. (2007a) provide global estimates considering all GHGs together, and Boehm et al. (2004) consider all GHGs for Canada only for 2008. Smith et al. (2007a) used per-area or per-animal estimates of mitigation potential for each GHG and multiplied this by the area available for that practice in each region. It was not necessary to use baseline emissions in calculating mitigation potential. US-EPA (2006b) estimated baseline emissions for 2020 for non-CO2 GHGs as 7250 MtCO2-eq in 2020 (see Chapter 11; Table 11.4). Non-CO2 GHG emissions in agriculture are projected to increase by about 13% from 2000 to 2010 and by 13% from 2010 to 2020 (US-EPA, 2006b). Assuming a similar rate of increase as in the period from 2000 to 2020, global agricultural non-CO2 GHG emissions would be around 8200 MtCO2-eq in 2030.
The global technical potential for mitigation options in agriculture by 2030, considering all gases, was estimated to be ~4500 by Caldeira et al. (2004) and ~5500-6000 MtCO2-
eq/yr by Smith et al. (2007a) if considering no economic or other barriers. Economic potentials are considerably lower (see Section 8.4.3.2). Figure 8.3 presents global and regional estimates of agricultural mitigation potential. Of the technical potentials estimated by Smith et al. (2007a), about 89% is from soil carbon sequestration, about 9% from mitigation of methane and about 2% from mitigation of soil N2O emissions (Figure 8.4). The total mitigation potential per region is presented in Figure 8.5.
The uncertainty in the estimates of the technical potential is given in Figure 8.6, which shows one standard deviation either side of the mean estimate (box), and the 95% confidence interval about the mean (line). The range of the standard deviation, and the 95% confidence interval about the mean of 5800 MtCO2-eq/yr, are 3000-8700, and 300-11400 MtCO2-eq/yr, respectively, and are largely determined by uncertainty in the per-area estimate for the mitigation measure. For soil carbon sequestration (89% of the total potential), this arises from the mixed linear effects model used to derive the mitigation potentials. The most appropriate mitigation response will vary among regions, and different portfolios of strategies will be developed in different regions, and in countries within a region.
-200
0
200
400
600
800
1000
1200
1400
1600
1800
crop
land
man
agem
ent
graz
ing la
nd m
anag
emen
t
resto
re cu
ltivat
ed
orga
nic so
ils
resto
re d
egra
ded
lands
rice
man
agem
ent
lives
tock
bioen
ergy
(soil
s com
pone
nt)
water
man
agem
ent
seta
side,
LUC &
agr
ofor
estry
man
ure
man
agem
ent
Mt CO2-eq/yr
N2O
CH4
CO2
Figure 8.4: Global technical mitigation potential by 2030 of each agricultural management practice showing the impacts of each practice on each GHG.Note: based on the B2 scenario though the pattern is similar for all SRES scenarios. Source: Drawn from data in Smith et al., 2007a.

516
Agriculture Chapter8
8.4.3.2 EconomicpotentialforGHGmitigationinagriculture
US-EPA (2006b) provided estimates of the agricultural mitigation potential (global and regional) at various assumed
carbon prices, for N2O and CH4, but not for soil carbon sequestration. Manne & Richels (2004) estimated the economic mitigation potential (at 27 US$/tCO2-eq) for soil carbon sequestration only.
Figure 8.5: Total technical mitigation potentials (all practices, all GHGs: MtCO2-eq/yr) for each region by 2030, showing mean estimates.Note: based on the B2 scenario though the pattern is similar for all SRES scenarios. Source: Drawn from data in Smith et al., 2007a.
Figure 8.6: Total technical mitigation potentials (all practices, all GHGs) for each region by 2030 Note: Boxes show one standard deviation above and below the mean estimate for per-area mitigation potential, and the bars show the 95% confidence interval about the mean. Based on the B2 scenario, although the pattern is similar for all SRES scenarios.Source: Drawn from data in Smith et al., 2007a.
0
200
400
600
800
1000
1200
1400
1600
1800
South
east
Asia
South
Am
erica
East A
sia
South
Asia
Easte
rn A
frica
Russia
n Fed
erat
ion
North
Am
erica
Wes
tern
Eur
ope
Wes
tern
Afri
ca
Centra
l Asia
North
ern
Europ
e
Midd
le Afri
ca
Easte
rn E
urop
e
Ocean
ia
South
ern
Europ
e
Centra
l Am
erica
North
ern A
frica
Wes
tern
Asia
South
ern A
frica
Carrib
ean
Japa
n
Polyne
sia
Region
Mt CO2-eq/yr

517
Chapter8 Agriculture
In the IPCC Third Assessment Report (TAR; IPCC, 2001b), estimates of agricultural mitigation potential by 2020 were 350-750 MtC/yr (~1300-2750 MtCO2/yr). The range was mainly caused by large uncertainties about CH4, N2O, and soil-related CO2 emissions. Most reductions will cost between 0 and 100 US$/tC-eq (~0-27 US$/tCO2-eq) with limited opportunities for negative net direct cost options. The analysis of agriculture included only conservation tillage, soil carbon sequestration, nitrogen fertilizer management, enteric methane reduction and rice paddy irrigation and fertilizers. The estimate for global mitigation potential was not broken down by region or practice.
Smith et al. (2007a) estimated the GHG mitigation potential in agriculture for all GHGs, for four IPCC SRES scenarios, at a range of carbon prices, globally and for all world regions. Using methods similar to McCarl and Schneider (2001), Smith et al. (2007a) used marginal abatement cost (MAC) curves given in US-EPA (2006b) for either region-specific MACs where available for a given practice and region, or global MACs where these were unavailable from US-EPA (2006b).
Recent bottom-up estimates of agricultural mitigation potential of CH4 and N2O from US-EPA (2006b) and DeAngelo et al. (2006) have allowed inclusion of agricultural abatement into top-down global modelling of long-term climate stabilization scenario pathways. In the top-down framework, a dynamic cost-effective portfolio of abatement strategies is identified. The portfolio includes the least-cost combination of mitigation strategies from across all sectors of the economy, including agriculture. Initial implementations of agricultural abatement into top-down models have employed a variety of alternative approaches resulting in different decision modelling of agricultural abatement (Rose et al., 2007). Currently, only non-CO2 GHG crop (soil and paddy rice) and livestock (enteric and manure) abatement options are considered by top-down models. In addition, some models also consider emissions from burning of agricultural residues and waste, and fossil fuel combustion CO2 emissions. Top-down estimates of global CH4 and N2O mitigation potential, expressed in CO2 equivalents, are given in Table 8.6 and Figure 8.7.
Comparing mitigation estimates from top-down and bottom-up modelling is not straightforward. Bottom-up mitigation responses are typically constrained to input management (e.g.,
fertilizer quantity, livestock feed type) and cost estimates are partial equilibrium in that input and output market prices are fixed as can be key input quantities such as acreage or production. Top-down mitigation responses include more generic input management responses and changes in output (e.g., shifts from cropland to forest) as well as changes in market prices (e.g., decreases in land prices with increasing production costs due to a carbon tax). Global estimates of economic mitigation potential from different studies at different assumed carbon prices are presented in Figure 8.8.
The top-down 2030 carbon prices, as well as the agricultural mitigation response, reflect the confluence of multiple forces, including differences in implementation of agricultural emissions and mitigation, as well as the stabilization target used, the magnitude of baseline emissions, baseline energy technology options, the eligible set of mitigation options, and the solution algorithm. As a result, the opportunity cost of agricultural mitigation in 2030 is very different across scenarios (i.e., model/baseline/mitigation option combinations). As illustrated by the connecting lines in Figure 8.7, agricultural abatement
Carbon price Mitigation (MtCO2-eq/yr) Number of scenariosUS$/tCO2-eq CH4 N2O CH4+N2O
0-20 0-1116 89-402 267-1518 6
20-50 348-1750 116-1169 643-1866 6
50-100 388 217 604 1
>100 733 475 1208 1
Note: From Chapter 3, Sections 3.3.5 and 3.6.2.
Source: Data assembled from USCCSP, 2006; Rose et al., 2007; Fawcett and Sands, 2006; Smith and Wigley, 2006; Fujino et al., 2006; and Kemfert et al., 2006.
Table 8.6: Global agricultural mitigation potential in 2030 from top-down models
0
200
400
600
800
1000
1200
1400
1600
1800
2000Mt CO2-eq/yr
0 20 40 60 80 100 120 140US$/tCO2-eq
4-5 W/m2 (590-710 ppm CO2-eq concentration)
3.25-4 W/m2 (510-590 ppm CO2-eq concentration)
< 3.25 W/m2 (< 510 ppm CO2-eq concentration)
Figure 8.7: Global agricultural mitigation potential in 2030 from top-down models by carbon price and stabilisation targetNote: Dashed lines connect results from scenarios where tighter stabilization targets were modelled with the same model and identical baseline characteriza-tion and mitigation technologies. From Chapter 3, Sections 3.3.5 and 3.6.2. Source: Data assembled from USCCSP, 2006; Rose et al., 2007; Fawcett and Sands, 2006; Smith and Wigley, 2006; Fujino et al., 2006; Kemfert et al., 2006.

518
Agriculture Chapter8
is projected to increase with the tightness of the stabilization target. On-going model development in top-down land-use modelling is expected to yield more refined characterizations of agricultural alternatives and mitigation potential in the future.
Smith et al. (2007a) estimated global economic mitigation potentials for 2030 of 1500-1600, 2500-2700, and 4000-4300 MtCO2-eq/yr at carbon prices of up to 20, 50 and 100 US$/
tCO2-eq., respectively shown for OECD versus EIT versus non-OECD/EIT (Table 8.7). The change in global mitigation potential with increasing carbon price for each practice is shown in Figure 8.9.
0
500
1000
1500
2000
2500
3000
IPCC (2
001b
)
Smith
et a
l. (20
07a)
Man
ne &
Rich
els (2
004)
Smith
et a
l. (20
07a)
US-EPA (2
006b
)
Smith
et a
l. (20
07a)
Figure
8.7
"top
dow
n"
US-EPA (2
006b
)
Smith
et a
l. (20
07a)
Figure
8.7
"top
dow
n"
Smith
et a
l. (20
07a)
Figure
8.7
"top
dow
n"
US-EPA (2
006b
)
Smith
et a
l. (20
07a)
US-EPA (2
006b
)
Smith
et a
l. (20
07a)
US-EPA (2
006b
)
Smith
et a
l. (20
07a)
US-EPA (2
006b
)
Smith
et a
l. (20
07a)
US-EPA (2
006b
)
Smith
et a
l. (20
07a)
US-EPA (2
006b
)
Smith
et a
l. (20
07a)
US-EPA (2
006b
)
Smith
et a
l. (20
07a)
all GHG CO2 only N2O and CH4 only soil N2O only rice all GHG livestock CH4 only@ 27 US$/
tCO2-eq@ 20 US$/
tCO2-eq@ 50 US$/
tCO2-eq@ 100 US$/
tCO2-eq@ 20 US$/
tCO2-eq@ 50 US$/
tCO2-eq@ 20 US$/
tCO2-eq@ 50 US$/
tCO2-eq@ 100 US$/
tCO2-eq@ 20 US$/
tCO2-eq@ 50 US$/
tCO2-eq@ 27 US$/
tCO2-eq
Mt CO2-eq/yr
Figure 8.8: Global economic potentials for agricultural mitigation arising from various practices shown for comparable carbon prices at 2030.Notes: US-EPA (2006b) figures are for 2020 rather than 2030. Values for top-down models are taken from ranges given in Figure 8.7.
Price of CO2-eq (US$/tCO2-eq)
SRES Scenario Up to 20 Up to 50 Up to 100
B1 OECD 310 (60-450) 510 (290-740) 810 (440-1180)
EIT 150 (30-220) 250 (140-370) 410 (220-590)
Non-OECD/EIT 1080 (210-1560) 1780 (1000-2580) 2830 (1540-4120)
A1b OECD 320 (60-460) 520 (290-760) 840 (450-1230)
EIT 160 (30-230) 260 (150-380) 410 (220-610)
Non-OECD/EIT 1110 (210-1610) 1820 (1020-2660) 2930 (1570-4290)
B2 OECD 330 (60-470) 540 (300-780) 870 (460-1280)
EIT 160 (30-240) 270 (150-390) 440 (230-640)
Non-OECD/EIT 1140 (210-1660) 1880 (1040-2740) 3050 (1610-4480)
A2 OECD 330 (60-480) 540 (300-790) 870 (460-1280)
EIT 165 (30-240) 270 (150-400) 440 (230-640)
Non-OECD/EIT 1150 (210-1670) 1890 (1050-2760) 3050 (1620-4480)
Note: Figures in brackets show one standard deviation about the mean estimate.
Table 8.7: Estimates of the global agricultural economic GHG mitigation potential (MtCO2-eq/yr) by 2030 under different assumed prices of CO2-equivalents
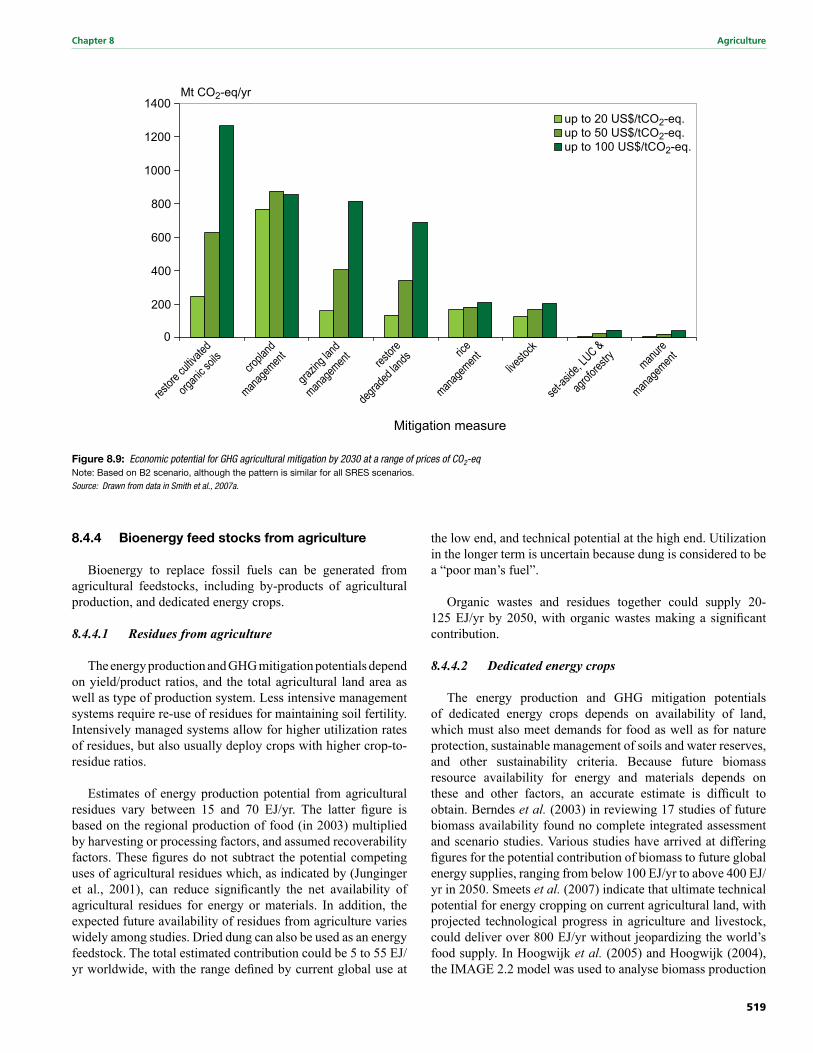
519
Chapter8 Agriculture
8.4.4 Bioenergy feed stocks from agriculture
Bioenergy to replace fossil fuels can be generated from agricultural feedstocks, including by-products of agricultural production, and dedicated energy crops.
8.4.4.1 Residuesfromagriculture
The energy production and GHG mitigation potentials depend on yield/product ratios, and the total agricultural land area as well as type of production system. Less intensive management systems require re-use of residues for maintaining soil fertility. Intensively managed systems allow for higher utilization rates of residues, but also usually deploy crops with higher crop-to-residue ratios.
Estimates of energy production potential from agricultural residues vary between 15 and 70 EJ/yr. The latter figure is based on the regional production of food (in 2003) multiplied by harvesting or processing factors, and assumed recoverability factors. These figures do not subtract the potential competing uses of agricultural residues which, as indicated by (Junginger et al., 2001), can reduce significantly the net availability of agricultural residues for energy or materials. In addition, the expected future availability of residues from agriculture varies widely among studies. Dried dung can also be used as an energy feedstock. The total estimated contribution could be 5 to 55 EJ/yr worldwide, with the range defined by current global use at
the low end, and technical potential at the high end. Utilization in the longer term is uncertain because dung is considered to be a “poor man’s fuel”.
Organic wastes and residues together could supply 20-
125 EJ/yr by 2050, with organic wastes making a significant contribution.
8.4.4.2 Dedicatedenergycrops
The energy production and GHG mitigation potentials of dedicated energy crops depends on availability of land, which must also meet demands for food as well as for nature protection, sustainable management of soils and water reserves, and other sustainability criteria. Because future biomass resource availability for energy and materials depends on these and other factors, an accurate estimate is difficult to obtain. Berndes et al. (2003) in reviewing 17 studies of future biomass availability found no complete integrated assessment and scenario studies. Various studies have arrived at differing figures for the potential contribution of biomass to future global energy supplies, ranging from below 100 EJ/yr to above 400 EJ/yr in 2050. Smeets et al. (2007) indicate that ultimate technical potential for energy cropping on current agricultural land, with projected technological progress in agriculture and livestock, could deliver over 800 EJ/yr without jeopardizing the world’s food supply. In Hoogwijk et al. (2005) and Hoogwijk (2004), the IMAGE 2.2 model was used to analyse biomass production
0
200
400
600
800
1000
1200
1400
restor
e cult
ivated
organ
ic so
ilscro
pland
manag
emen
t
grazin
g lan
d
manag
emen
tres
tore
degra
ded l
ands ric
e
manag
emen
tlive
stock
set-a
side,
LUC &
agrof
orestr
yman
ure
manag
emen
t
Mitigation measure
Mt CO2-eq/yr
up to 20 US$/tCO2-eq.up to 50 US$/tCO2-eq.up to 100 US$/tCO2-eq.
Figure 8.9: Economic potential for GHG agricultural mitigation by 2030 at a range of prices of CO2-eqNote: Based on B2 scenario, although the pattern is similar for all SRES scenarios. Source: Drawn from data in Smith et al., 2007a.
520
Agriculture Chapter8
potentials for different SRES scenarios. Biomass production on abandoned agricultural land is calculated at 129 EJ (A2) up to 411 EJ (A1) for 2050 and possibly increasing after that timeframe. 273 EJ (for A1) – 156 EJ (for A2) may be available below US$ 2/GJ production costs. A recent study (Sims et al., 2006) which used lower per-area yield assumptions and bio-energy crop areas projected by the IMAGE 2.2 model suggested more modest potentials (22 EJ/yr) by 2025.
Based on assessment of other studies, Hoogwijk et al. (2003), indicated that marginal and degraded lands (including a land surface of 1.7 Gha worldwide) could, be it with lower productivities and higher production costs, contribute another 60-150 EJ. Differences among studies are largely attributable to uncertainty in land availability, energy crop yields, and assumptions on changes in agricultural efficiency. Those with the largest projected potential assume that not only degraded/surplus land are used, but also land currently used for food production (including pasture land, as did Smeets et al., 2007).
Converting the potential biomass production into a mitigation potential is not straightforward. First, the mitigation potential is determined by the lowest supply and demand potentials, so without the full picture (see Chapter 11) no estimate can be made. Second, any potential from bioenergy use will be counted towards the potential of the sectors where bioenergy is used (mainly energy supply and transport). Third, the proportion of the agricultural biomass supply compared to that from the waste or forestry sector cannot be specified due to lack of information on cost curves.
Top-down integrated assessment models can give an estimate of the cost competitiveness of bioenergy mitigation options relative to one another and to other mitigation options in achieving specific climate goals. By taking into account the various bioenergy supplies and demands, these models can give estimates of the combined contribution of the agriculture, waste, and forestry sectors to bioenergy mitigation potential. For achieving long-term climate stabilization targets, the competitive cost-effective mitigation potential of biomass energy (primarily from agriculture) in 2030 is estimated to be 70 to 1260 MtCO2-eq/yr (0-13 EJ/yr) at up to 20 US$/t CO2-eq, and 560-2320 MtCO2-eq/yr (0-21 EJ/yr) at up to 50 US$/tCO2-eq (Rose et al., 2007, USCCSP, 2006). There are no estimates for the additional potential from top down models at carbon prices up to 100 US$/tCO2-eq, but the estimate for prices above 100 US$/tCO2-eq is 2720 MtCO2-eq/yr (20-45 EJ/yr). This is of the same order of magnitude as the estimate from a synthesis of supply and demand presented in Chapter 11, Section 11.3.1.4. The mitigation potentials estimated by top-down models represent mitigation of 5-80%, and 20-90% of all other agricultural mitigation measures combined, at carbon prices of up to 20, and up to 50 US$/tCO2-eq, respectively.
8.4.5 Potential implications of mitigation options for sustainable development
There are various potential impacts of agricultural GHG mitigation on sustainable development. The impacts of mitigation activities in agriculture, on the constituents and determinants of sustainable development are set out in Table 8.8. Broadly, three constituents of sustainable development have been envisioned as the critical minimum: social, economic, and environmental factors. Table 8.8 presents the degree and direction of the likely impact of the mitigation options. The exact magnitude of the effect, however, depends on the scale and intensity of the mitigation measures, and the sectors and policy arena in which they are undertaken.
Agriculture contributes 4% of global GDP (World Bank, 2003) and provides employment to 1.3 billion people (Dean, 2000). It is a critical sector of the world economy, but uses more water than any other sector. In low-income countries, agriculture uses 87% of total extracted water, while this figure is 74% in middle-income countries and 30% in high-income countries (World Bank, 2003). There are currently 276 Mha of irrigated croplands (FAOSTAT, 2006), a five-fold increase since the beginning of the 20th century. With irrigation increasing, water management is a serious issue. Through proper institutions and effective functioning of markets, water management can be implemented with favourable outcomes for both environmental and economic goals. There is a greater need for policy coherence and innovative responses creating a situation where users are asked to pay the full economic costs of the water. This has special relevance for developing countries. Removal of subsidies in the electricity and water sectors might lead to effective water use in agriculture, through adaptation of appropriate irrigation technology, such as drip irrigation in place of tube well irrigation.
Agriculture contributes nearly half of the CH4 and N2O emissions (Bhatia et al., 2004) and rice, nutrient, water and tillage management can help to mitigate these GHGs. By careful drainage and effective institutional support, irrigation costs for farmers can also be reduced, thereby improving economic aspects of sustainable development (Rao, 1994). An appropriate mix of rice cultivation with livestock, known as integrated annual crop-animal systems and traditionally found in West Africa, India and Indonesia and Vietnam, can enhance net income, improve cultivated agro-ecosystems, and enhance human well-being (Millennium Ecosystem Assessment, 2005). Such combinations of livestock and cropping, especially for rice, can improve income generation, even in semi-arid and arid areas of the world.
Groundwater quality may be enhanced and the loss of biodiversity can be influenced by the choice of fertilizer used and use of more targeted pesticides. Further, greater demand for farmyard manure would create income for the animal husbandry sector where usually the poor are engaged. Various country

521
Chapter8 Agriculture
strategy papers on The Millennium Development Goal (MDG) clearly recommend encouragement to animal husbandry (e.g., World Bank, 2005). This is intended to enhance livelihoods and create greater employment. Better nutrient management can also improve environmental sustainability.
Controlling overgrazing through pasture improvement has a favourable impact on livestock productivity (greater income from the same number of livestock) and slows or halts desertification (environmental aspect). It also provides social security to the poorest people during extreme events such as drought (especially in Sub-Saharan Africa). One effective strategy to control overgrazing is the prohibition of free
grazing, as was done in China (Rao, 1994) but approaches in other regions need to take into account cultural and institutional contexts. Dryland and desert areas have the highest number of poor people (Millennium Ecosystem Assessment, 2005) and measures to halt overgrazing, coupled with improved livelihood options (e.g., fisheries in Syria , Israel and other central Asian countries), can help reduce poverty and achieve sustainability goals.
Land cover and tillage management could encourage favourable impacts on environmental goals. A mix of horticulture with optimal crop rotations would promote carbon sequestration and could also improve agro-ecosystem function.
Table 8.8: Potential sustainable development consequences of mitigation options
Activity categorySustainable development
NotesSocial Economic Environmental
Croplands – agronomy ? + + 1
Croplands – nutrient management ? + + 2
Croplands – tillage/residues ? ? + 3
Croplands – water management + + + 4
Croplands – rice management + + + 5
Croplands – set-aside & LUC ? - + 6
Croplands – agro-forestry + ? + 7
Grasslands – grazing, nutrients, fire + + + 8
Organic soils – restoration ? ? + 9
Degraded soils – restoration + + + 10
Biosolid applications + - +/- 11
Bioenergy + ? +/- 12
Livestock – feeding -/? + ? 13
Livestock – additives -/? n/d n/d 14
Livestock – breeding -/? n/d n/d 14
Manure management ? n/d n/d 15Notes:+ denotes beneficial impact on component of SD - denotes negative impact? denotes uncertain impact n/d denotes no data 1 Improved yields would mean better economic returns and less land required for new cropland. Societal impact uncertain - impact could be positive but could
negatively affect traditional practices. 2 Improved yields would mean better economic returns and less land required for new cropland. Societal impact uncertain - impact could be positive but could
negatively affect traditional practices.3 Improves soil fertility may not increase yield so societal and economic impacts uncertain.4 All efficiency improvements are positive for sustainability goals and should yield economic benefits even if costs of irrigation are borne by the farmer.5 Improved yields would mean better economic returns and less land required for new cropland. Societal impacts likely to benign or positive as no large-scale change
to traditional practices.6 Improve soil fertility but less land available for production; potential negative impact on economic returns.7 Likely environmental benefits, less travel required for fuelwood; positive societal benefits; economic impact uncertain.8 Improved production would mean better economic returns and less land required for grazing; lower degradation. Societal effects likely to be positive.9 Organic soil restoration has a host of biodiversity/environmental co-benefits but opportunity cost of crop production lost from this land; economic impact depends
upon whether farmers receive payment for the GHG emission reduction.10 Restoration of degraded lands will provide higher yields and economic returns, less new cropland and provide societal benefits via production stability.11 Likely environmental benefits though some negative impacts possible (e.g., water pollution) but, depending on the bio-solid system implemented, could increase
costs.12 Bio-energy crops could yield environmental co-benefits or could lead to loss of bio-diversity (depending on the land use they replace). Economic impact uncertain.
Social benefits could arise from diversified income stream.13 Negative/uncertain societal impacts as these practices may not be acceptable due to prevailing cultural practices especially in developing countries. Could improve
production and economic returns.14 Negative/uncertain societal impacts as these practices may not be acceptable due to prevailing cultural practices especially in developing countries. No data (n/d) on
economic or environmental impacts.15 Uncertain societal impacts. No data (n/d) on economic or environmental impacts.

522
Agriculture Chapter8
Societal well-being would also be enhanced by providing water and enhanced productivity. While the environmental benefits of tillage/residue management are clear, other impacts are less certain. Land restoration will have positive environmental impacts, but conversion of floodplains and wetlands to agriculture could hamper ecological function (reduced water recharge, bioremediation, nutrient cycling, etc.) and therefore, could have an adverse impact on sustainable development goals (Kumar, 2001).
The other mitigation measures listed in Table 8.8 are context- and location-specific in their influence on sustainable development constituents. Appropriate adoption of mitigation measures is likely in many cases to help achieve environmental goals, but farmers may incur additional costs, reducing their returns and income. This trade-off would be most visible in the short term, but in the long term, synergy amongst the constituents of sustainable development would emerge through improved natural capital. Trade-offs between economic and environmental aspects of sustainable development might become less important if the environmental gains were better acknowledged, quantified, and incorporated in the decision-making framework.
Large-scale production of modern bioenergy crops, partly for export, could generate income and employment for rural regions of world. Nevertheless, these benefits will not necessarily flow to the rural populations that need them most. The net impacts for a region as a whole, including possible changes and improvements in agricultural production methods should be considered when developing biomass and bioenergy production capacity. Although experience around the globe (e.g., Brazil, India biofuels) shows that major socioeconomic benefits can be achieved, new bioenergy production schemes could benefit from the involvement of the regional stakeholders, particularly the farmers. Experience with such schemes needs to be built around the globe.
8.5 Interactions of mitigation options with adaptation and vulnerability
As discussed in Chapters 3, 11 and 12, mitigation, climate change impacts, and adaptation will occur simultaneously and interactively. Mitigation-driven actions in agriculture could have (a) positive adaptation consequences (e.g., carbon sequestration projects with positive drought preparedness aspects) or (b) negative adaptation consequences (e.g., if heavy dependence on biomass energy increases the sensitivity of energy supply to climatic extremes; see Chapter 12, Subsection 12.1.4). Adaptation-driven actions also may have both (a) positive consequences for mitigation (e.g., residue return to fields to improve water holding capacity will also sequester carbon); and (b) negative consequences for mitigation (e.g., increasing use of nitrogen fertilizer to overcome falling yield leading to
increased nitrous oxide emissions). In many cases, actions taken for reasons unrelated to either mitigation or adaptation (see Sections 8.6 and 8.7) may have considerable consequences for either or both(e.g., deforestation for agriculture or other purposes results in carbon loss as well as loss of ecosystems and resilience of local populations). Adaptation to climate change in the agricultural sector is detailed in (IPCC, 2007; Chapter 5).
For mitigation, variables such as growth rates for bioenergy feedstocks, the size of livestock herds, and rates of carbon sequestration in agricultural lands are affected by climate change (Paustian et al., 2004). The extent depends on the sign and magnitude of changes in temperature, soil moisture, and atmospheric CO2 concentration, which vary regionally (Christensen et al., 2007). All of these factors will alter the mitigation potential; some positively and some negatively. For example: (a) lower growth rates in bioenergy feedstocks will lead to larger emissions from hauling and increased cost; (b) lower livestock growth rates would possibly increase herd size and consequent emissions from manure and enteric fermentation; and (c) increased microbial decomposition under higher temperatures will lower soil carbon sequestration potential. Interactions also occur with adaptation. Butt et al. (2006) and Reilly et al. (2001) found that modified crop mix, land use, and irrigation are all potential adaptations to warmer climates. All would alter the mitigation potential. Some of the key vulnerabilities of agricultural mitigation strategies to climate change, and the implications of adaptation on GHG emissions from agriculture are summarized in Table 8.9.
8.6 Effectiveness of, and experience with, climate policies; potentials, barriers and opportunities/implementation issues
8.6.1 Impact of climate policies
Many recent studies have shown that actual levels of GHG mitigation are far below the technical potential for these measures. The gap between technical potential and realized GHG mitigation occurs due to costs and other barriers to implementation (Smith, 2004b).
Globally and for Europe, Cannell (2003) suggested that, for carbon sequestration and bioenergy-derived fossil fuel offsets, the realistically achievable potential (potential estimated to take account of all barriers) was ~20% of the technical potential. Similar figures were derived by Freibauer et al. (2004) and the European Climate Change Programme (2001) for agricultural carbon sequestration in Europe. Smith et al. (2005a) showed recently that carbon sequestration in Europe is likely to be negligible by the first Commitment Period of the Kyoto Protocol (2008-2012), despite the significant technical potential (e.g.,

523
Chapter8 Agriculture
Ag
ricu
ltur
al m
itig
atio
n st
rate
gie
sVu
lner
abili
ty o
f th
e m
itig
atio
n o
pti
on
to c
limat
e ch
ang
eIm
plic
atio
n fo
r G
HG
em
issi
ons
of
ad
apta
tio
n ac
tio
ns
Cro
pla
nd m
anag
emen
t –
agro
nom
yVu
lner
able
to
dec
reas
ed r
ainf
all,
and
in c
ases
nea
r th
e lim
it of
the
ir cl
imat
e ni
che,
to
high
er t
emp
erat
ures
.N
O2
emis
sion
s w
ould
incr
ease
if fe
rtili
zer
use
incr
ease
d, o
r if
mor
e le
gum
es w
ere
pla
nted
in r
esp
onse
to
clim
ate-
ind
uced
pro
duc
tion
dec
lines
.
Cro
pla
nd m
anag
emen
t –
nutr
ient
man
age-
men
tO
nly
wea
kly
sens
itive
to
clim
ate
chan
ge, e
xcep
t in
cas
es w
here
the
en
tire
crop
pin
g en
terp
rise
bec
omes
unv
iab
le.
No
sign
ifica
nt a
dap
tatio
n to
effe
cts
of c
limat
e ch
ange
pos
sib
le b
eyon
d
tailo
ring
of p
ract
ices
to
amb
ient
con
diti
ons.
The
refo
re, a
dd
ition
al G
HG
s no
t ex
pec
ted
.
Cro
pla
nd m
anag
emen
t –
tilla
ge/r
esid
ue
man
agem
ent
Sen
sitiv
e to
clim
ate
chan
ge. H
ighe
r te
mp
erat
ures
cou
ld lo
wer
so
il ca
rbon
seq
uest
ratio
n p
oten
tial.
War
mer
, wet
ter
clim
ates
can
in
crea
se r
isk
of c
rop
pes
ts a
nd d
isea
ses
asso
ciat
ed w
ith r
educ
ed
till p
ract
ices
.
Ad
apta
tion
not
antic
ipat
ed t
o ha
ve a
sig
nific
ant
GH
G e
ffect
.
Cro
pla
nd m
anag
emen
t –
wat
er m
anag
e-m
ent
Irrig
atio
n is
sus
cep
tible
to
clim
ate
chan
ges
that
red
uce
the
avai
lab
ility
of w
ater
for
irrig
atio
n or
incr
ease
s cr
op w
ater
dem
and
.P
ossi
ble
incr
ease
in e
nerg
y-re
late
d G
HG
em
issi
ons
if gr
eate
r p
ump
ing
dis
tanc
es o
r vo
lum
es a
re r
equi
red
. Ad
optio
n of
mor
e w
ater
-use
effi
cien
t p
ract
ices
will
gen
eral
ly lo
wer
GH
G e
mis
sion
s.
Cro
pla
nd m
anag
emen
t –
rice
man
agem
ent
Vuln
erab
le t
o cl
imat
e-ch
ange
-ind
uced
cha
nges
in w
ater
ava
ilab
ility
. Lo
w C
H4
emitt
ing
culti
vars
may
be
susc
eptib
le t
o ch
ange
s in
te
mp
erat
ure
bey
ond
the
ir to
lera
nce
limits
.
Ad
apta
tion
stra
tegi
es a
re li
mite
d a
nd n
ot e
xpec
ted
to
have
larg
e G
HG
co
nseq
uenc
es.
Cro
pla
nd m
anag
emen
t –
set-
asid
e an
d
land
-use
cha
nge
Set
-asi
des
may
be
need
ed t
o of
fset
loss
of p
rod
uctiv
ity o
n ot
her
land
s.A
dap
tatio
n is
eith
er t
o tr
y to
kee
p p
rod
uctio
n hi
gh o
n no
n-se
t-as
ide
land
, whi
ch c
ould
incr
ease
GH
G e
mis
sion
s, o
r re
turn
som
e se
t-as
ides
to
pro
duc
tion.
Incr
ease
s in
GH
Gs
are
in b
oth
case
s fa
irly
smal
l, an
d le
ss
than
the
cas
e of
not
hav
ing
set-
asid
es in
the
firs
t p
lace
. The
y co
uld
be
furt
her
miti
gate
d b
y ap
ply
ing
low
GH
G e
mitt
ing
pra
ctic
es in
all
case
s.
Cro
pla
nd m
anag
emen
t –
agro
-for
estr
yLa
rge
chan
ges
in c
limat
e co
uld
mak
e ce
rtai
n fo
rms
of a
gro-
fore
stry
un
viab
le in
par
ticul
ar s
ituat
ions
.A
dap
tatio
n of
pra
ctic
es a
nd s
pec
ies
used
to
less
favo
urab
le c
limat
es
coul
d le
ad t
o so
me
loss
of C
O2
upta
ke p
oten
tial.
Gra
zing
land
man
agem
ent/
pas
ture
im-
pro
vem
ent
Fire
man
agem
ent
can
be
imp
acte
d n
egat
ivel
y or
pos
itive
ly b
y cl
imat
e ch
ange
dep
end
ing
on e
cosy
stem
and
sig
n of
clim
ate
chan
ge. E
xtre
me
dry
ing
or w
arm
ing
coul
d m
ake
mar
gina
l gra
zing
la
nds
unvi
able
. Wet
ter
cond
ition
s w
ill p
rom
ote
conv
ersi
on o
f gra
zing
la
nds
to c
rop
s.
Incr
ease
d fi
re p
rote
ctio
n ac
tiviti
es c
an in
crea
se G
HG
s em
issi
ons
by
a sm
all a
mou
nt, t
hus
red
ucin
g th
e ne
t b
enefi
t ob
tain
ed fr
om r
educ
ing
fire
exte
nt a
nd fr
eque
ncy.
Man
agem
ent
of a
gric
ultu
ral o
rgan
ic s
oils
The
miti
gatio
n m
easu
re is
sen
sitiv
e to
incr
ease
s in
tem
per
atur
e or
d
ecre
ases
in m
oist
ure,
bot
h of
whi
ch w
ould
dec
reas
e th
e ca
rbon
se
que
stra
tion
pot
entia
l.
Som
e tr
ade-
offs
bet
wee
n C
O2
upta
ke a
nd C
H4
emis
sion
s ca
n b
e ex
pec
ted
if t
he s
oils
bec
ome
wet
ter
as a
res
ult
of t
he a
dap
tatio
n m
anag
emen
t.
Res
tora
tion
of d
egra
ded
land
sTh
e su
stai
nab
ility
of r
esto
red
land
s co
uld
be
vuln
erab
le t
o in
crea
sed
te
mp
erat
ure
and
/or
dec
reas
ed s
oil m
oist
ure.
Ene
rgy
used
to
rep
lant
, or
fert
ilize
r us
ed t
o in
crea
se e
stab
lishm
ent,
su
cces
s co
uld
lead
to
smal
l ad
diti
onal
GH
G e
mis
sion
s
Live
stoc
k -
imp
rove
d fe
edin
g p
ract
ices
, sp
ecifi
c ag
ents
and
die
tary
ad
diti
ves,
lo
nger
ter
m s
truc
tura
l and
man
agem
ent
chan
ges
and
ani
mal
bre
edin
g
Wea
kly
vuln
erab
le t
o cl
imat
e ch
ange
exc
ept
if it
lead
s to
the
loss
of
viab
ility
of l
ives
tock
ent
erp
rises
in m
argi
nal a
reas
or
incr
ease
d c
ost
(or
dec
reas
ed a
vaila
bili
ty) o
f fee
d in
put
s.
No
gene
ral a
dap
tatio
n st
rate
gies
. Sp
ecifi
c st
rate
gies
may
hav
e m
inor
im
pac
ts o
n G
HG
em
issi
ons,
for
exam
ple
, tr
ansp
ort
of fe
ed s
upp
lem
ents
fr
om d
ista
nt lo
catio
ns c
ould
lead
to
incr
ease
d n
et G
HG
em
issi
ons.
Man
ure/
bio
solid
man
agem
ent
Con
trol
led
was
te d
iges
tion
gene
rally
pos
itive
ly a
ffect
ed b
y m
oder
atel
y ris
ing
tem
per
atur
es. W
here
GH
Gs
are
not
trap
ped
, hi
gher
tem
per
atur
es c
ould
ham
per
man
agem
ent.
If us
ed a
s a
nutr
ient
sou
rce
on p
astu
re c
an in
crea
se C
O2
upta
ke a
nd
carb
on s
tora
ge.
Bio
ener
gy –
ene
rgy
crop
s, s
olid
, liq
uid
, b
ioga
s, r
esid
ues
Par
ticul
ar b
ioen
ergy
cro
ps
pot
entia
lly s
ensi
tive
to c
limat
e ch
ange
, ei
ther
pos
itive
ly o
r ne
gativ
ely.
Are
as d
evot
ed t
o b
ioen
ergy
cou
ld b
e un
der
incr
easi
ng c
omp
etiti
on w
ith t
he n
eed
s fo
r fo
od a
gric
ultu
re o
r b
iod
iver
sity
con
serv
atio
n un
der
cha
ngin
g cl
imat
e.
Gen
eral
ly, r
esul
ts in
net
CO
2 up
take
on
land
(ap
art
from
the
foss
il-fu
el
sub
stitu
tion)
. N2O
em
issi
ons
wou
ld in
crea
se if
N t
urno
ver
rate
s w
ere
grea
ter
than
und
er p
revi
ous
land
use
s. P
ossi
ble
pos
itive
and
neg
ativ
e im
pac
ts o
n ne
t G
HG
em
issi
ons
at v
ario
us s
tage
s of
the
ene
rgy
chai
n (c
ultiv
atio
n, h
arve
stin
g, t
rans
por
t, c
onve
rsio
n) m
ust
be
man
aged
.
Tab
le 8
.9: S
ome
of th
e ke
y vu
lner
abili
ties
of a
gric
ultu
ral m
itiga
tion
stra
tegi
es to
clim
ate
chan
ge a
nd th
e im
plic
atio
ns o
f ada
ptat
ion
on G
HG e
mis
sion
s fro
m a
gric
ultu
re

524
Agriculture Chapter8
Smith et al., 2000; Freibauer et al., 2004; Smith, 2004a). The estimates of global economic mitigation potential in 2030 at different costs reported in Smith et al. (2007a) were 28, 45 and 73% of technical potential at up to 20, 50 and 100 US$/tCO2-eq, respectively.
In Europe, there is little evidence that climate policy is
affecting GHG emissions from agriculture (see Smith et al., 2005a), with most emission reduction occurring through non-climate policy (see Section 8.7; Freibauer et al., 2004). Some countries have agricultural policies designed to reduce GHG emissions (e.g., Belgium), but most do not (Smith et al., 2005a). The European Climate Change Programme (2001) recommended improvement of fertilizer application, set-aside, and reduction of livestock methane emissions (mainly through biogas production) as being the most cost-effective GHG mitigation options for European agriculture.
In North America, the US Global Climate Change Initiative aims to reduce GHG intensity by 18% by 2012. Agricultural sector activities include manure management, reduced tillage, grass plantings, and afforestation of agricultural land. In Canada, agriculture contributes about 10% to national emissions, so mitigation (removals and emission reductions) is considered to be an important contribution to reducing emissions (and at the same time to reduce risk to air, water and soil quality). Various programmes (e.g., AAFC GHG Mitigation programme) encourage voluntary adoption of mitigation practices on farms.
In Oceania, vegetation management policies in Australia have assisted in progressively restricting emissions from land-use change (mainly land clearing for agriculture) to about 60% of 1990 levels. Complementary policies that aim to foster establishment of both commercial and non-commercial forestry and agro-forestry are resulting in significant afforestation of agricultural land in both Australia and New Zealand. Research is being supported to develop cost-effective GHG abatement technologies for livestock (including dietary manipulation and other methods of reducing enteric methane emissions, as well as manure management), agricultural soils (including nutrient and soil management strategies), savannas, and planted forests. The Greenhouse Challenge Plus programme and other partnership initiatives between the Government and industry are facilitating the integration of GHG abatement measures into agricultural management systems.
In Latin America and the Caribbean, climate change mitigation is still not considered in mainstream policy. Most countries have devoted efforts to capacity building for complying with obligations under the UNFCCC, and a few have prepared National Strategy Studies for Kyoto Protocol’s Clean Development Mechanism (CDM). Carbon sequestration in agricultural soils has the highest mitigation potential in the region, and its exclusion from the CDM has hindered wider adoption of pertinent practices (e.g., zero tillage).
In Asia, China has policies that reduce GHG emissions, but these were implemented for reasons other than climate policy. These are discussed further in Section 8.7. Currently, there are no policies specifically aimed at reducing GHG emissions. Japan has a number of policies such as Biomass Nippon Strategy, which promotes the utilization of biomass as an alternative energy source, and Environment-Conserving Agriculture, which promotes energy-efficient agricultural machinery, reduction in use of fertilizer, and appropriate management of livestock waste, etc.
In Africa, the impacts of climate policy on agricultural emissions are small. There are no approved CDM projects in Africa related to the reduction of agricultural GHG emissions per se. Several projects are under investigation in relation to the restoration of agriculturally-degraded lands, carbon sequestration potential of agro-forestry, and reduction in sugarcane burning. Many countries in Africa have prepared National Strategy Studies for the CDM in complying with obligations under UNFCCC. The main obstacles to implementation of CDM projects in Africa, however, are lack of financial resources, qualified personnel, and the complexity of the CDM.
Agricultural GHG offsets can be encouraged by market-based trading schemes. Offset trading, or trading of credits, allows farmers to obtain credits for reducing their GHG emission reductions. The primary agricultural project types include CH4 capture and destruction, and soil carbon sequestration. Although not included in current projects, measures to reduce N2O emissions could be included in the future. The vast majority of agricultural projects have focused on CH4 reduction from livestock wastes in North America (Canada, Mexico and the United States), South America (Brazil), China, and Eastern Europe. Most of these projects have resulted in the production of Certified Emission Reductions (CERs) from the CDM. Credits are bought and sold through the use of offset aggregators, brokers, and traders. Although the CDM does not currently support soil carbon sequestration projects, emerging markets in Canada and the United States are supporting offset trading from soil carbon sequestration. In Canada, farm groups such as the Saskatchewan Soil Conservation Association (SSCA) encourage farmers to adopt no-till practices in return for carbon offset credits. In the USA, the Pacific Northwest Direct Seed Association offers soil carbon credits generated from no-till management to an energy company The Chicago Climate Exchange (CCX) (www.chicagoclimatex.com/) allows GHG offsets from no-tillage and conversion of cropland to grasslands to be traded by voluntary action through a market trading mechanism. These approaches to agriculturally derived GHG offset will likely expand geographically and in scope. Policy instruments are detailed in Chapter 13 (Section 13.2).

525
Chapter8 Agriculture
8.6.2 Barriers and opportunities/implementation issues
The commonly mentioned barriers to adoption of carbon sequestration activities on agricultural lands include the following:
Maximum Storage: Carbon sequestration in soils or terrestrial biomass has a maximum capacity for the ecosystem, which may be reached after 15 to 60 years, depending on management practice, management history, and the system (West and Post, 2002). However, sequestration is a rapidly and cheaply deployable mitigation option, until more capital-intensive developments, and longer-lasting actions become available (Caldeira et al., 2004; Sands and McCarl, 2005).
Reversibility: A subsequent change in management can reverse the gains in carbon sequestration over a similar period of time. Not all agricultural mitigation options are reversible; reduction in N2O and CH4 emissions, avoided emissions as a result of agricultural energy efficiency gains or substitution of fossil fuels by bio-energy are non-reversible.
Baseline: The GHG net emission reductions need to be assessed relative to a baseline. Selection of an appropriate baseline to measure management-induced soil carbon changes is still an obstacle in some mitigation projects. The extent of practices already in place in project regions will need to be determined for the baseline.
Uncertainty: This has two components: mechanism
uncertainty and measurement uncertainty. Uncertainty about the complex biological and ecological processes involved in GHG emissions and carbon storage in agricultural systems makes investors more wary of these options than of more clear-cut industrial mitigation activities. This barrier can be reduced by investment in research. Secondly, agricultural systems exhibit substantial variability between seasons and locations, creating high variability in offset quantities at the farm level. This variability can be reduced by increasing the geographical extent and duration of the accounting unit (e.g., multi-region, multi-year contracts; Kim and McCarl, 2005).
Displacement of Emissions: Adopting certain agricultural mitigation practices may reduce production within implementing regions, which, in turn, may be offset by increased production outside the project region unconstrained by GHG mitigation objectives, reducing the net emission reductions. ‘Wall-to-wall’ accounting can detect this, and crediting correction factors may need to be employed (Murray et al., 2004; US-EPA, 2005).
Transaction costs: Under an incentive-based system such as a carbon market, the amount of money farmers receive is not the market price, but the market price less brokerage cost. This may be substantial, and is an increasing fraction as the amount of carbon involved diminishes, creating a serious entry barrier for
smallholders. For example, a 50 kt contract needs 25 kha under soil carbon management (uptake ~ 2 tCO2 ha/yr). In developing countries, this could involve many thousands of farmers.
Measurement and monitoring costs: Mooney et al. (2004) argue that such costs are likely to be small (under 2% of the contract), but other studies disagree (Smith, 2004c). In general, measurement costs per carbon-credit sold decrease as the quantity of carbon sequestered and area sampled increase. Methodological advances in measuring soil carbon may reduce costs and increase the sensitivity of change detection. However, improved methods to account for changes in soil bulk density remain a hindrance to quantification of changes in soil carbon stocks (Izaurralde and Rice, 2006). Development of remote sensing, new spectral techniques to measure soil carbon, and modelling offer opportunities to reduce costs but will require evaluation (Izaurralde and Rice, 2006, Brown et al., 2006; Ogle and Paustian, 2005; Gehl and Rice, 2007).
Property rights: Property rights, landholdings, and the lack of a clear single-party land ownership in certain areas may inhibit implementation of management changes.
Other barriers: Other possible barriers to implementation include the availability of capital, the rate of capital stock turnover, the rate of technological development, risk attitudes, need for research and outreach, consistency with traditional practices, pressure for competing uses of agricultural land and water, demand for agricultural products, high costs for certain enabling technologies (e.g., soil tests before fertilization), and ease of compliance (e.g., straw burning is quicker than residue removal and can also control some weeds and diseases, so farmers favour straw burning).
8.7 Integrated and non-climate policies affecting emissions of GHGs
Many policies other than climate policies affect GHG emis-sions from agriculture. These include other UN conventions such as Biodiversity, Desertification and actions on Sustain-able Development (see Section 8.4.5), macroeconomic policy such as EU Common Agricultural Policy (CAP)/CAP reform, international free trade agreements, trading blocks, trade bar-riers, region-specific programmes, energy policy and price adjustment, and other environmental policies including vari-ous environmental/agro-environmental schemes. These are described further below.
8.7.1 Other UN conventions
In Asia, China has introduced laws to convert croplands to forest and grassland in Vulnerable Ecological Zones under the UN Convention on Desertification. This will increase carbon storage and reduce N2O emissions. Under the UN Convention

526
Agriculture Chapter8
on Biodiversity, China has initiated a programme that restores croplands close to lakes, the sea, or other natural lands as conservation zones for wildlife. This may increase soil carbon sequestration but, if restored to wetland, could increase CH4 emissions. In support of UN Sustainable Development guidelines, China has introduced a Land Reclamation Regulation (1988) in which land degraded by, for example, construction or mining is restored for use in agriculture, thereby increasing soil carbon storage. In Europe (including Eastern Europe, the Caucasus and Central Asia) and North America, the UN conventions have had few significant impacts on agricultural GHG emissions. In Europe, the UN Convention on Long Range Trans-boundary Air Pollutants also leads to regulations to control air pollutants (e.g., by regulating N emissions) that could have substantial impacts on emission reductions in the agricultural sector.
8.7.2 Macroeconomic and sectoral policy
Some macro-economic changes, such as the burden of a high external debt in Latin America, triggered the adoption in the 1970s of policies designed for improving the trade balance, mainly by promoting agricultural exports (Tejo, 2004). This resulted in the changes in land use and management (see Section 8.3.3), which are still causing increases in annual GHG emissions today. In other regions, such as the countries of Eastern Europe, the Caucasus and Central Asia and many Central and East European countries, political changes since 1990 have meant agricultural de-intensification with less inputs, and land abandonment, leading to a decrease in agricultural GHG emissions. In Africa, the cultivated area in Southern Africa has increased by 30% since 1960, while agricultural production has doubled (Scholes and Biggs, 2004). The macroeconomic development framework for Africa (NEPAD, 2005) emphasises agriculture-led development. It is, therefore, anticipated that the cropped area will continue to increase, especially in Central, East, and Southern Africa, perhaps at an accelerating rate. In Western Europe, North America, Asia (China) and Oceania, macroeconomic policy has tended to reduce GHG emissions. The declining emission trend in Western Europe is likely a consequence of successive reforms of the Common Agricultural Policy (CAP) since 1992. The 2003 EU CAP reform is expected to lead to further reductions, mainly through reduction of animal numbers (Binfield et al., 2006). The reduced GHG emissions could be offset by activity elsewhere. Various macro-economic policies that potentially affect agricultural GHG emissions in each major world region are presented in Table 8.10.
WTO negotiations, to the extent they move toward free trade, would permit countries to better adjust to climate change and the dislocations in production caused by mitigation activities, by adjusting their import/export mix. International trade agreements such as WTO may also have impacts on the amount and geographical distribution of GHG emissions. If agricultural subsidies are reduced and markets become more open, a shift in production from developed to developing countries would be expected, with the consequent displacement of GHG emissions
to the latter. Since agricultural practices and GHG emissions per unit product differ between countries, such displacement may also cause changes in total emissions from agriculture. In addition, the increase in international flow of agricultural products which may result from trade liberalization could cause higher GHG emissions from the use of transport fuels.
8.7.3 Other environmental policies
In most world regions, environmental policies have been put in place to improve fertility, to reduce erosion and soil loss, and to improve agricultural efficiency. The majority of these environmental policies also reduce GHG emissions. Various environmental policies not implemented specifically to address GHG emissions but potentially affect agricultural GHG emissions in each major world region are presented in Table 8.11.
In all regions, policies to improve other aspects of the environment have been more effective in reducing GHG emissions from agriculture than policies aimed specifically at reducing agricultural GHG emissions (see Section 8.6.1). The importance of identifying these co-benefits when formulating climate and other environmental policy is addressed in Section 8.8.
8.8 Co-benefits and trade-offs of mitigation options
Many of the measures aimed at reducing GHG emissions have other impacts on the productivity and environmental integrity of agricultural ecosystems, mostly positive (Table 8.12). These measures are often adopted mainly for reasons other than GHG mitigation (see Section 8.7.3). Agro-ecosystems are inherently complex and very few practices yield purely win-win outcomes; most involve some trade-offs (DeFries et al., 2004; Viner et al., 2006) above certain levels or intensities of implementation. Specific examples of co-benefits and trade-offs among agricultural GHG mitigation measures include:
• Practices that maintain or increase crop productivity can improve global or regional food security (Lal, 2004a, b; Follett et al., 2005). This co-benefit may become more im-portant as global food demands increase in coming decades (Sanchez and Swaminathan, 2005; Rosegrant and Cline, 2003; FAO, 2003; Millennium Ecosystem Assessment, 2005). Building reserves of soil carbon often also increases the potential productivity of these soils. Furthermore, many of the measures that promote carbon sequestration also prevent degradation by avoiding erosion and improving soil structure. Consequently, many carbon conserving prac-tices sustain or enhance future fertility, productivity and resilience of soil resources (Lal, 2004a; Cerri et al., 2004; Freibauer et al., 2004; Paustian et al., 2004; Kurkalova
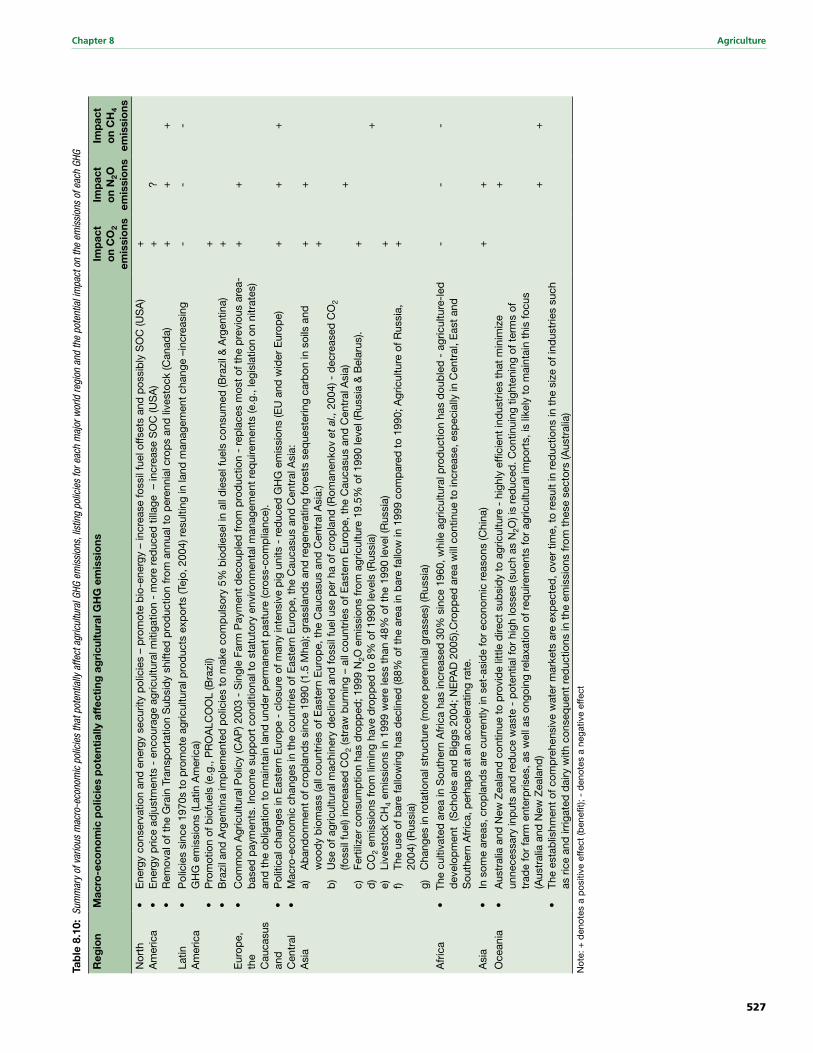
527
Chapter8 Agriculture
Tab
le 8
.10:
Sum
mar
y of
var
ious
mac
ro-e
cono
mic
pol
icie
s th
at p
oten
tially
affe
ct a
gric
ultu
ral G
HG e
mis
sion
s, li
stin
g po
licie
s fo
r eac
h m
ajor
wor
ld re
gion
and
the
pote
ntia
l im
pact
on
the
emis
sion
s of
eac
h GH
G
Reg
ion
Mac
ro-e
cono
mic
po
licie
s p
ote
ntia
lly a
ffec
ting
ag
ricu
ltur
al G
HG
em
issi
ons
Imp
act
on
CO
2 em
issi
ons
Imp
act
on
N2O
em
issi
ons
Imp
act
on
CH
4 em
issi
ons
Nor
th
Am
eric
a•
Ene
rgy
cons
erva
tion
and
ene
rgy
secu
rity
pol
icie
s –
pro
mot
e b
io-e
nerg
y –
incr
ease
foss
il fu
el o
ffset
s an
d p
ossi
bly
SO
C (U
SA
)•
Ene
rgy
pric
e ad
just
men
ts -
enc
oura
ge a
gric
ultu
ral m
itiga
tion
- m
ore
red
uced
till
age
– in
crea
se S
OC
(US
A)
• R
emov
al o
f the
Gra
in T
rans
por
tatio
n S
ubsi
dy
shift
ed p
rod
uctio
n fr
om a
nnua
l to
per
enni
al c
rop
s an
d li
vest
ock
(Can
ada)
+ + +? +
+
Latin
A
mer
ica
• P
olic
ies
sinc
e 19
70s
to p
rom
ote
agric
ultu
ral p
rod
ucts
exp
orts
(Tej
o, 2
004)
res
ultin
g in
land
man
agem
ent
chan
ge –
incr
easi
ng
GH
G e
mis
sion
s (L
atin
Am
eric
a)•
Pro
mot
ion
of b
iofu
els
(e.g
., P
RO
ALC
OO
L (B
razi
l)•
Bra
zil a
nd A
rgen
tina
imp
lem
ente
d p
olic
ies
to m
ake
com
pul
sory
5%
bio
die
sel i
n al
l die
sel f
uels
con
sum
ed (B
razi
l & A
rgen
tina)
- + +
--
Eur
ope,
th
e C
auca
sus
and
C
entr
al
Asi
a
• C
omm
on A
gric
ultu
ral P
olic
y (C
AP
) 200
3 -
Sin
gle
Farm
Pay
men
t d
ecou
ple
d fr
om p
rod
uctio
n -
rep
lace
s m
ost
of t
he p
revi
ous
area
-b
ased
pay
men
ts. I
ncom
e su
pp
ort
cond
ition
al t
o st
atut
ory
envi
ronm
enta
l man
agem
ent
req
uire
men
ts (e
.g.,
legi
slat
ion
on n
itrat
es)
and
the
ob
ligat
ion
to m
aint
ain
land
und
er p
erm
anen
t p
astu
re (c
ross
-com
plia
nce)
.•
Pol
itica
l cha
nges
in E
aste
rn E
urop
e -
clos
ure
of m
any
inte
nsiv
e p
ig u
nits
- r
educ
ed G
HG
em
issi
ons
(EU
and
wid
er E
urop
e)•
Mac
ro-e
cono
mic
cha
nges
in t
he c
ount
ries
of E
aste
rn E
urop
e, t
he C
auca
sus
and
Cen
tral
Asi
a:
a)
Ab
and
onm
ent
of c
rop
land
s si
nce
1990
(1.5
Mha
); gr
assl
and
s an
d r
egen
erat
ing
fore
sts
seq
uest
erin
g ca
rbon
in s
oils
and
w
ood
y b
iom
ass
(all
coun
trie
s of
Eas
tern
Eur
ope,
the
Cau
casu
s an
d C
entr
al A
sia:
)b
) U
se o
f agr
icul
tura
l mac
hine
ry d
eclin
ed a
nd fo
ssil
fuel
use
per
ha
of c
rop
land
(Rom
anen
kov
et a
l., 2
004)
- d
ecre
ased
CO
2 (fo
ssil
fuel
) inc
reas
ed C
O2
(str
aw b
urni
ng –
all
coun
trie
s of
Eas
tern
Eur
ope,
the
Cau
casu
s an
d C
entr
al A
sia)
c)
Fert
ilize
r co
nsum
ptio
n ha
s d
rop
ped
; 199
9 N
2O e
mis
sion
s fr
om a
gric
ultu
re 1
9.5%
of 1
990
leve
l (R
ussi
a &
Bel
arus
).d
) C
O2
emis
sion
s fr
om li
min
g ha
ve d
rop
ped
to
8% o
f 199
0 le
vels
(Rus
sia)
e)
Live
stoc
k C
H4
emis
sion
s in
199
9 w
ere
less
tha
n 48
% o
f the
199
0 le
vel (
Rus
sia)
f)
The
use
of b
are
fallo
win
g ha
s d
eclin
ed (8
8% o
f the
are
a in
bar
e fa
llow
in 1
999
com
par
ed t
o 19
90; A
gric
ultu
re o
f Rus
sia,
20
04) (
Rus
sia)
g)
Cha
nges
in r
otat
iona
l str
uctu
re (m
ore
per
enni
al g
rass
es) (
Rus
sia)
+ + + + + + +
+ + + +
+ +
Afr
ica
• T
he c
ultiv
ated
are
a in
Sou
ther
n A
fric
a ha
s in
crea
sed
30%
sin
ce 1
960,
whi
le a
gric
ultu
ral p
rod
uctio
n ha
s d
oub
led
- a
gric
ultu
re-l
ed
dev
elop
men
t (S
chol
es a
nd B
iggs
200
4; N
EPA
D 2
005)
.Cro
pp
ed a
rea
will
con
tinue
to
incr
ease
, esp
ecia
lly in
Cen
tral
, Eas
t an
d
Sou
ther
n A
fric
a, p
erha
ps
at a
n ac
cele
ratin
g ra
te.
--
-
Asi
a•
In
som
e ar
eas,
cro
pla
nds
are
curr
ently
in s
et-a
sid
e fo
r ec
onom
ic r
easo
ns (C
hina
)+
+
Oce
ania
•
Aus
tral
ia a
nd N
ew Z
eala
nd c
ontin
ue t
o p
rovi
de
little
dire
ct s
ubsi
dy
to a
gric
ultu
re -
hig
hly
effic
ient
ind
ustr
ies
that
min
imiz
e un
nece
ssar
y in
put
s an
d r
educ
e w
aste
- p
oten
tial f
or h
igh
loss
es (s
uch
as N
2O) i
s re
duc
ed. C
ontin
uing
tig
hten
ing
of t
erm
s of
tr
ade
for
farm
ent
erp
rises
, as
wel
l as
ongo
ing
rela
xatio
n of
req
uire
men
ts fo
r ag
ricul
tura
l im
por
ts, i
s lik
ely
to m
aint
ain
this
focu
s (A
ustr
alia
and
New
Zea
land
)•
Th
e es
tab
lishm
ent
of c
omp
rehe
nsiv
e w
ater
mar
kets
are
exp
ecte
d, o
ver
time,
to
resu
lt in
red
uctio
ns in
the
siz
e of
ind
ustr
ies
such
as
ric
e an
d ir
rigat
ed d
airy
with
con
seq
uent
red
uctio
ns in
the
em
issi
ons
from
the
se s
ecto
rs (A
ustr
alia
)
+ ++
Not
e: +
den
otes
a p
ositi
ve e
ffect
(ben
efit);
- d
enot
es a
neg
ativ
e ef
fect

528
Agriculture Chapter8Ta
ble
8.1
1: A
non
-exh
aust
ive
sum
mar
y of
env
ironm
enta
l pol
icie
s th
at w
ere
not i
mpl
emen
ted
spec
ifica
lly to
add
ress
GHG
em
issi
ons,
but
that
can
affe
ct a
gric
ultu
ral G
HG e
mis
sion
s. E
xam
ples
of p
olic
ies
are
liste
d fo
r maj
or
wor
ld re
gion
and
the
pote
ntia
l im
pact
on
the
emis
sion
s of
eac
h GH
G is
indi
cate
d.
Reg
ion
Oth
er e
nvir
onm
enta
l po
licie
s p
ote
ntia
lly a
ffec
ting
ag
ricu
ltur
al G
HG
em
issi
ons
Imp
act
on
CO
2
emis
sio
ns
Imp
act
on
N2O
em
issi
ons
Imp
act
on
CH
4
emis
sio
nsN
orth
A
mer
ica
• E
nviro
nmen
tal Q
ualit
y In
cent
ives
Pro
gram
(EQ
IP) –
cos
t-sh
arin
g an
d in
cent
ive
pay
men
ts fo
r co
nser
vatio
n p
ract
ices
on
wor
king
farm
s (U
SA
)•
Con
serv
atio
n R
eser
ve P
rogr
am (C
RP
) - e
nviro
nmen
tally
sen
sitiv
e la
nd c
onve
rted
to
nativ
e gr
asse
s, t
rees
, etc
. (U
SA
)•
Con
serv
atio
n S
ecur
ity P
rogr
am (C
SP
) – a
ssis
tanc
e p
rom
otin
g co
nser
vatio
n on
cro
pla
nd, p
astu
re a
nd r
ange
land
(and
farm
woo
dla
nd)
(US
A)
• G
reen
cov
er in
Can
ada
and
pro
vinc
ial i
nitia
tives
– e
ncou
rage
s sh
ift fr
om a
nnua
l to
per
enni
al c
rop
pro
duc
tion
on p
oor
qua
lity
soils
(Can
ada)
• A
gric
ultu
re P
olic
y Fr
amew
ork
(AP
F) p
rogr
amm
es t
o re
duc
e ag
ricul
ture
ris
ks t
o th
e en
viro
nmen
t, in
clud
ing
GH
G e
mis
sion
s (C
anad
a)
• N
utrie
nt M
anag
emen
t p
rogr
amm
es –
intr
oduc
ed t
o im
pro
ve w
ater
qua
lity,
may
ind
irect
ly r
educ
e N
2O e
mis
sion
s (C
anad
a)
+ + + + + +
+ + + + + ++ +
Latin
A
mer
ica
• In
crea
sing
ad
optio
n of
env
ironm
enta
l pol
icie
s d
riven
by
glob
aliz
atio
n, c
onso
lidat
ion
of d
emoc
ratic
reg
imes
(Lat
in A
mer
ica
& C
arib
bea
n)•
14 c
ount
ries
have
intr
oduc
ed e
nviro
nmen
tal r
egul
atio
ns o
ver
the
last
20
year
s –
mos
t ha
ve im
ple
men
ted
mea
sure
s to
pro
tect
the
en
viro
nmen
t•
Pro
mot
ion
of n
o-til
l agr
icul
ture
in t
he M
erco
sur
area
(Bra
zil,
Arg
entin
a, U
rugu
ay a
nd P
arag
uay)
• “P
rogr
am C
rop
-Liv
esto
ck In
tegr
atio
n” p
rom
otes
soi
l car
bon
, red
uced
ero
sion
, red
uced
pat
hoge
ns, f
ertil
ity fo
r p
astu
res,
no
till c
rop
pin
g (B
razi
l)
+/- + + +
+/- ? ?
+/-
Eur
ope,
th
e C
auca
sus
and
C
entr
al
Asi
a
• E
U s
et a
sid
e p
rogr
amm
e -
enco
urag
ed c
arb
on s
eque
ster
ing
pra
ctic
es, b
ut n
ow r
epla
ced
by
the
sing
le fa
rm p
aym
ent
und
er t
he n
ew C
AP
(E
U)
• E
U/n
umb
er o
f mem
ber
sta
tes
- so
il ac
tion
pla
ns t
o p
rom
ote
soil
qua
lity/
heal
th/
sust
aina
bili
ty, e
ncou
rage
s so
il ca
rbon
seq
uest
ratio
n (E
U)
• E
ncou
rage
men
t of
com
pos
ting
in s
ome
EU
mem
ber
sta
tes
(e.g
., B
elgi
um; S
leut
el 2
005)
, but
pol
icie
s ar
e lim
ited
(Sm
ith e
t al
., 20
05a)
(EU
)•
EU
Wat
er F
ram
ewor
k D
irect
ive
(WFD
) pro
mot
es c
aref
ul u
se o
f N fe
rtili
zer.
Imp
act
of W
FD o
n ag
ricul
tura
l GH
G e
mis
sion
s as
yet
unc
lear
(EU
)•
The
ban
of b
urni
ng o
f fiel
d r
esid
ues
in t
he 1
980s
(for
air
qua
lity
pur
pos
es) e
nhan
ce s
oil c
arb
on, r
educ
e N
2O a
nd C
H4
(Sm
ith e
t al
., 19
97;
2000
) (E
U)
• Th
e d
ump
ing
ban
at
sea
of s
ewag
e sl
udge
in E
urop
e in
199
8 -
mor
e sl
udge
rea
ched
agr
icul
tura
l lan
d (S
mith
et
al.,
2000
; 200
1) (E
U)
• "V
and
milj
øpla
ner"
(wat
er e
nviro
nmen
tal p
lans
) for
the
agr
icul
tura
l sec
tor
with
cle
ar e
ffect
(dec
reas
e) o
f GH
Gs
(Den
mar
k)•
Land
Cod
es o
f the
Rus
sian
Fed
erat
ion,
Bel
arus
and
the
Ukr
aine
- la
nd c
onse
rvat
ion
for
pro
mot
ing
soil
qua
lity
rest
orat
ion
and
pro
tect
ion
• “L
and
Ref
orm
Dev
elop
men
t in
Rus
sian
Fed
erat
ion”
& “
Fert
ility
200
6-20
10”
- p
lans
to
pro
mot
e so
il co
nser
vatio
n/fe
rtili
ty/s
usta
inab
ility
(R
ussi
a)•
Ukr
aini
an la
w “
Land
pro
tect
ion”
- a
ctio
n p
lans
to
pro
mot
e so
il co
nser
vatio
n/in
crea
se c
omm
erci
al y
ield
s/fe
rtili
ty/s
usta
inab
ility
(Ukr
aine
)•
Law
s in
Bel
arus
suc
h as
“S
tate
Con
trol
of L
and
Use
and
Lan
d P
rote
ctio
n” e
ncou
rage
s ca
rbon
seq
uest
ratio
n (B
elar
us)
• La
ws
in t
he U
krai
ne t
o p
rom
ote
conv
ersi
on o
f deg
rad
ed la
nds
to s
et-a
sid
e (U
krai
ne)
• W
ater
qua
lity
initi
ativ
es, f
or e
xam
ple
, Wat
er C
odes
enc
oura
ge r
efor
esta
tion
and
gra
ssla
nd r
ipar
ian
zone
s (R
ussi
a, U
krai
ne a
nd B
elar
us)
• Th
e b
an o
f fer
tiliz
er a
pp
licat
ion
in s
ome
area
s -
red
uce
N2O
em
issi
ons
(Rus
sia,
Bel
arus
, Ukr
aine
) & r
egio
nal p
rogr
amm
es fo
r ex
amp
le,
Rev
ival
of t
he V
olga
+ + + ? + + + + + + + + + +
+ + + ? +
+ +
Afr
ica
• Th
e re
duc
tion
of t
he a
rea
of r
ange
land
s b
urne
d -
ob
ject
ive
of b
oth
colo
nial
and
pos
t-co
loni
al a
dm
inis
trat
ions
; ren
ewed
effo
rts
(Sou
th
Afr
ica,
199
8)
++
+
Asi
a•
Soi
l sus
tain
abili
ty p
rogr
amm
es -
N fe
rtili
zer
add
ed t
o so
ils o
nly
afte
r so
il N
tes
ting
(Chi
na)
• R
egio
nal a
gric
ultu
ral d
evel
opm
ent
pro
gram
mes
- e
nhan
ce s
oil c
arb
on s
tora
ge (C
hina
)•
Wat
er q
ualit
y p
rogr
amm
es t
hat
cont
rol n
on-p
oint
sou
rce
pol
lutio
n (C
hina
) •
Air
qua
lity
legi
slat
ion
- b
ans
stra
w b
urni
ng, t
hus
red
ucin
g C
O2
(and
CH
4 an
d N
2O) e
mis
sion
s (C
hina
)•
“Tow
nshi
p E
nter
pris
es”
& “
Eco
logi
cal M
unic
ipal
ity”
- re
duc
e w
aste
dis
pos
al, c
hem
ical
fert
ilize
r an
d p
estic
ides
, and
ban
s st
raw
bur
ning
(Chi
na)
+ + +
+ + + ++ +
Oce
ania
• W
ide
rang
e of
pol
icie
s to
mai
ntai
n fu
nctio
n/co
nser
vatio
n of
agr
icul
tura
l lan
dsc
apes
, riv
er s
yste
ms
and
oth
er e
cosy
stem
s (A
ustr
alia
and
N
ew Z
eala
nd)
• In
dus
try
chan
ges
lead
ing
to r
apid
incr
ease
in N
fert
ilize
r us
e ov
er t
he p
ast
dec
ade
(250
% a
nd 5
00%
incr
ease
s in
Aus
tral
ia a
nd N
ew
Zea
land
, res
pec
tivel
y)•
Incr
ease
s in
inte
nsiv
e liv
esto
ck p
rod
uctio
n; r
aise
d c
once
rns
abou
t w
ater
qua
lity
and
the
hea
lth o
f riv
erin
e/of
fsho
re e
cosy
stem
s (A
ustr
alia
an
d N
ew Z
eala
nd)
• P
olic
y re
spon
ses
are
bei
ng d
evel
oped
tha
t in
clud
e m
onito
ring,
reg
ulat
ory,
res
earc
h an
d e
xten
sion
com
pon
ents
(Aus
tral
ia a
nd N
ew
Zea
land
)
+ + + +
- + + +
- +
Not
e: +
den
otes
a p
ositi
ve e
ffect
(ben
efit);
- d
enot
es a
neg
ativ
e ef
fect

529
Chapter8 Agriculture
Tab
le 8
.12:
Sum
mar
y of
pos
sibl
e co
-ben
efits
and
trad
e-of
fs o
f miti
gatio
n op
tions
in a
gric
ultu
re.
Mea
sure
Exa
mp
les
Food security (productivity)
Water quality
Water conservation
Soil quality
Air quality
Bio-diversity, wildlife habitat
Energy conservation
Conservation of other biomes
Aesthetic/amenity value
Cro
pla
nd m
anag
emen
tA
gron
omy
++
/-+
/-+
+/-
+/-
-+
+/-
Nut
rient
man
agem
ent
-/+
++
++
Tilla
ge/r
esid
ue m
anag
emen
t+
+/-
++
++
Wat
er m
anag
emen
t (ir
rigat
ion,
dra
inag
e)+
+/-
+/-
+/-
-+
Ric
e m
anag
emen
t+
++
/-+
/-+
Agr
o-fo
rest
ry+
/-+
/--
++
Set
-asi
de,
land
-use
cha
nge
-+
++
++
+-
+
Gra
zing
land
man
agem
ent/
pas
ture
imp
rove
men
tG
razi
ng in
tens
ity+
/-+
++
Incr
ease
d p
rod
uctiv
ity (e
.g.,
fert
iliza
tion)
++
/-
Nut
rient
man
agem
ent
++
/-+
++
-+
+/-
Fire
man
agem
ent
++
++
/-+
/-
Sp
ecie
s in
trod
uctio
n (in
clud
ing
legu
mes
)+
++
Man
agem
ent
of o
rgan
ic s
oils
Avo
id d
rain
age
of/r
esto
re w
etla
nds
-+
++
-+
Res
tora
tion
of d
egra
ded
land
sE
rosi
on c
ontr
ol, o
rgan
ic a
men
dm
ents
, nut
rient
am
end
men
ts+
++
++
+
Live
stoc
k m
anag
emen
tIm
pro
ved
feed
ing
pra
ctic
es+
+/-
+
Sp
ecifi
c ag
ents
and
die
tary
ad
diti
ves
+
Long
er t
erm
str
uctu
ral a
nd m
anag
emen
t ch
ange
s an
d a
nim
al b
reed
ing
+
Man
ure/
bio
solid
man
agem
ent
Imp
rove
d s
tora
ge a
nd h
and
ling
++
/-+
+/-
Ana
erob
ic d
iges
tion
++
Mor
e ef
ficie
nt u
se a
s nu
trie
nt s
ourc
e+
++
++
Bio
ener
gyE
nerg
y cr
ops,
sol
id, l
iqui
d, b
ioga
s, r
esid
ues
--
+-
Ref
eren
ces
(see
foot
note
s)a
bc
de
fg
hi
Not
e:+
den
otes
a p
ositi
ve e
ffect
(ben
efit);
- d
enot
es a
neg
ativ
e ef
fect
(tra
de-
off).
The
co-
ben
efits
and
tra
de-
offs
var
y am
ong
regi
ons.
Eco
nom
ic c
osts
and
ben
efits
, oft
en k
ey d
rivin
g va
riab
les,
are
con
sid
ered
in S
ectio
n 8.
4.3
Sour
ces:
a
Fole
y et
al.,
200
5; L
al, 2
001a
, 200
4a;
b M
osie
r, 20
02; F
reib
auer
et a
l., 2
004;
Pau
stia
n et
al.,
200
4; C
erri
et a
l.., 2
004
c La
l, 20
02, 2
004b
; Dia
s de
Oliv
eira
et a
l., 2
005;
Roc
kströ
m, 2
003.
d La
l, 20
01b,
Jan
zen,
200
5; C
assm
an e
t al.,
200
3; C
erri
et a
l., 2
004;
Wan
der a
nd N
isse
n, 2
004
e M
osie
r, 20
01; 2
002;
Pau
stia
n et
al..
, 200
4f
Fole
y et
al..
, 200
5; D
ias
de O
livei
ra e
t al.,
200
5; F
reib
auer
et a
l., 2
004;
Fal
loon
et a
l., 2
004;
Hus
ton
and
Mar
land
, 200
3; T
otte
n et
al.,
200
3g
Lal e
t al.,
200
3; W
est a
nd M
arla
nd, 2
003
h Ba
lmfo
rd e
t al.,
200
5; T
rew
avas
, 200
2; G
reen
et a
l., 2
005;
Wes
t and
Mar
land
, 200
3i
Frei
baue
r et a
l., 2
004

530
Agriculture Chapter8
et al., 2004; Díaz-Zorita et al., 2002). In some instances, where productivity is enhanced through increased inputs, there may be risks of soil depletion through mechanisms such as acidification or salinization (Barak et al., 1997; Díez et al., 2004; Connor, 2004).
• A key potential trade-off is between the production of bio-energy crops and food security. To the extent that bio-ener-gy production uses crop residues, excess agricultural prod-ucts or surplus land and water, there will be little resultant loss of food production. But above this point, proportional losses of food production will be strongly negative. Food insecurity is determined more by inequity of access to food (at all scales) than by absolute food production insufficien-cies, so the impact of this trade-off depends among other things on the economic distributional effects of bio-energy production.
• Fresh water is a dwindling resource in many parts of the world (Rosegrant and Cline, 2003; Rockström, 2003). Agricultural practices for mitigation of GHGs can have both negative and positive effects on water conservation, and on water quality. Where measures promote water use efficiency (e.g., reduced tillage), they provide potential benefits. But in some cases, the practices could intensify water use, thereby reducing stream flow or groundwater reserves (Unkovich, 2003; Dias de Oliveira et al., 2005). For instance, high-productivity, evergreen, deep-rooted bio-energy plantations generally have a higher water use than the land cover they replace (Berndes, 2002, Jackson et al., 2005). Some practices may affect water quality through enhanced leaching of pesticides and nutrients (Freibauer et al., 2004; Machado and Silva, 2001).
• If bio-energy plantations are appropriately located, de-signed, and managed, they may reduce nutrient leaching and soil erosion and generate additional environmental services such as soil carbon accumulation, improved soil fertility; removal of cadmium and other heavy metals from soils or wastes. They may also increase nutrient recircula-tion, aid in the treatment of nutrient-rich wastewater and sludge; and provide habitats for biodiversity in the agricul-tural landscape (Berndes and Börjesson, 2002; Berndes et al. 2004; Börjesson and Berndes, 2006).
• Changes to land use and agricultural management can affect biodiversity, both positively and negatively (e.g., Xiang et al., 2006; Feng et al., 2006). For example, intensification of agriculture and large-scale production of biomass energy crops will lead to loss of biodiversity where they occur in biodiversity-rich landscapes (Euro-pean Environment Agency, 2006). But perennial crops often used for energy production can favour biodiversity, if they displace annual crops or degraded areas (Berndes and Börjesson, 2002).
• Agricultural mitigation practices may influence non-agri-cultural ecosystems. For example, practices that diminish productivity in existing cropland (e.g., set-aside lands) or divert products to alternate uses (e.g., bio-energy crops) may induce conversion of forests to cropland elsewhere.
Conversely, increasing productivity on existing croplands may ‘spare’ some forest or grasslands (West and Marland, 2003; Balmford et al., 2005; Mooney et al., 2005). The net effect of such trade-offs on biodiversity and other ecosys-tem services has not yet been fully quantified (Huston and Marland, 2003; Green et al., 2005).
• Agro-ecosystems have become increasingly dependent on input of reactive nitrogen, much of it added as manufac-tured fertilizers (Galloway et al., 2003; Galloway, 2004). Practices that reduce N2O emission often improve the efficiency of N use from these and other sources (e.g., manures), thereby also reducing GHG emissions from fertilizer manufacture and avoiding deleterious effects on water and air quality from N pollutants (Oenema et al., 2005; Dalal et al., 2003; Olesen et al., 2006; Paustian et al., 2004). Suppressing losses of N as N2O might in some cases increase the risk of losing that N via leaching. Curtailing supplemental N use without a corresponding increase in N-use efficiency will restrict yields, thereby hampering food security.
• Implementation of agricultural GHG mitigation measures may allow expanded use of fossil fuels, and may have some negative effects through emissions of sulphur, mer-cury and other pollutants (Elbakidze and McCarl, 2007).
The co-benefits and trade-offs of a practice may vary from place to place because of differences in climate, soil, or the way the practice is adopted. In producing bio-energy, for example, if the feedstock is crop residue, that may reduce soil quality by depleting soil organic matter. Conversely, if the feedstock is a densely rooted perennial crop that may replenish organic matter and thereby improve soil quality (Paustian et al., 2004).These few examples, and the general trends described in Table 8.12, demonstrate that GHG mitigation practices on farm lands exert complex, interactive effects on the environment, sometimes far from the site at which they are imposed. The merits of a given practice, therefore, cannot be judged solely on effectiveness of GHG mitigation.
8.9 Technology research, development, deployment, diffusion and transfer
There is much scope for technological developments to reduce GHG emissions in the agricultural sector. For example, increases in crop yields and animal productivity will reduce emissions per unit of production. Such increases in crop and animal productivity will be implemented through improved management and husbandry techniques, such as better management, genetically modified crops, improved cultivars, fertilizer recommendation systems, precision agriculture, improved animal breeds, improved animal nutrition, dietary additives and growth promoters, improved animal fertility, bio-energy crops, anaerobic slurry digestion and methane capture

531
Chapter8 Agriculture
systems. All of these depend to some extent on technological developments. Although technological improvement may have very significant effects, transfer of these technologies is a key requirement for these mitigations to be realized. For example, the efficiency of N use has improved over the last two decades in developed countries, but continues to decline in many developing countries due to barriers to technology transfer (International Fertilizer Industry Association, 2007). Based on technology change scenarios developed by Ewert et al. (2005), and derived from extrapolation of current trends in FAO data, Smith et al. (2005b) showed that technological improvements could potentially counteract the negative impacts of climate change on cropland and grassland soil carbon stocks in Europe. This and other work (Rounsevell et al., 2006) suggest that technological improvement will be a key factor in GHG mitigation in the future.
In most instances, the cost of employing mitigation strategies will not alter radically in the medium term. There will be some shifts in costs due to changes in prices of agricultural products and inputs, but these are unlikely to be of significant magnitude. Likewise, the potential of most options for CO2 reduction is unlikely to change greatly. There are some exceptions which fall into two categories: (i) options where the practice or technology is not new, but where the emission reduction potential has not been adequately quantified, such as improved nutrient utilization; and (ii) options where technologies are still being refined such as probiotics in animal diets, or nitrification inhibitors.
Many of the mitigation strategies outlined for agriculture employ existing technology (e.g., crop management, livestock management). With such strategies, the main issue is technology transfer, diffusion, and deployment. Other strategies involve new use of existing technologies. For example, oils have been used in animal diets for many years to increase dietary energy content, but their role as a methane suppressant is relatively new, and the parameters of the technology in terms of scope for methane reduction are only now being defined. Other strategies still require further research to allow viable systems to operate (e.g., bio-energy crops). Finally, many novel mitigation strategies are presently being refined, such as the use of probiotics, novel plant extracts, and the development of vaccines. Thus, there is still a major role for research and development in this area.
Differences between regions can arise due to the state of development of the agricultural industry, the resources available and legislation. For example, the scope to use specific agents and dietary additives in ruminants is much greater in developed than in the developing regions because of cost, opportunity (e.g., it is easier to administer products to animals in confined systems than in free ranging or nomadic systems), and availability of the technology (US-EPA, 2006a). Furthermore, certain technologies are not allowed in some regions, for example, ionophores are banned from use in animal feeding in the EU, and genetically modified crops are not approved for use in some countries.
8.10 Long-term outlook
Trends in GHG emissions in the agricultural sector depend mainly on the level and rate of socio-economic development, human population growth, and diet, application of adequate technologies, climate and non-climate policies, and future climate change. Consequently, mitigation potentials in the agricultural sector are uncertain, making a consensus difficult to achieve and hindering policy making. However, agriculture is a significant contributor to GHG emissions (Section 8.2). Mitigation is unlikely to occur without action, and higher emissions are projected in the future if current trends are left unconstrained. According to current projections, the global population will reach 9 billion by 2050, an increase of about 50% over current levels (Lutz et al., 2001; Cohen, 2003). Because of these increases and changing consumption patterns, some analyses estimate that the production of cereals will need to roughly double in coming decades (Tilman et al., 2001; Roy et al., 2002; Green et al., 2005). Achieving these increases in food production may require more use of N fertilizer, leading to possible increases in N2O emissions, unless more efficient fertilization techniques and products can be found (Galloway, 2003; Mosier, 2002). Greater demands for food could also increase CH4 emissions from enteric fermentation if livestock numbers increase in response to demands for meat and other livestock products. As projected by the IMAGE 2.2 model, CO2, CH4, and N2O emissions associated with land use vary greatly between scenarios (Strengers et al., 2004), depending on trends towards globalization or regionalization, and on the emphasis placed on material wealth relative to sustainability and equity.
Some countries are moving forward with climate and non-climate policies, particularly those linked with sustainable development and improving environmental quality as described in Sections 8.6 and 8.7. These policies will likely have direct or synergistic effects on GHG emissions and provide a way forward for mitigation in the agricultural sector. Moreover, global sharing of innovative technologies for efficient use of land resources and agricultural inputs, in an effort to eliminate poverty and malnutrition, will also enhance the likelihood of significant mitigation from the agricultural sector.
Mitigation of GHG emissions associated with various agricultural activities and soil carbon sequestration could be achieved through best management practices, many of which are currently available for implementation. Best management practices are not only essential for mitigating GHG emissions, but also for other facets of environmental protection such as air and water quality management. Uncertainties do exist, but they can be reduced through finer scale assessments of best management practices within countries, evaluating not only the GHG mitigation potential but also the influences of mitigation options on socio-economic conditions and other environmental impacts.

532
Agriculture Chapter8
The long-term outlook for development of mitigation practices for livestock systems is encouraging. Continuous improvements in animal breeds are likely, and these will improve the GHG emissions per kg of animal product. Enhanced production efficiency due to structural change or better application of existing technologies is also generally associated with reduced emissions, and there is a trend towards increased efficiency in both developed and developing countries. New technologies may emerge to reduce emissions from livestock such as probiotics, a methane vaccine or methane inhibitors. However, increased world demand for animal products may mean that while emissions per kg of product decline, total emissions may increase.
Recycling of agricultural by-products, such as crop residues and animal manures, and production of energy crops provides opportunities for direct mitigation of GHG emissions from fossil fuel offsets. However, there are barriers in technologies and economics to using agricultural wastes, and in converting energy crops into commercial fuels. The development of innovative technologies is a critical factor in realizing the potential for biofuel production from agricultural wastes and energy crops. This mitigation option could be moved forward with government investment for the development of these technologies, and subsidies for using these forms of energy.
A number of agricultural mitigation options which have limited potential now will likely have increased potential in the long-term. Examples include better use of fertilizer through precision farming, wider use of slow and controlled release fertilizers and of nitrification inhibitors, and other practices that reduce N application (and thus N2O emissions). Similarly, enhanced N-use efficiency is achievable as technologies such as field diagnostics, fertilizer recommendations from expert/decision support systems and fertilizer placement technologies are developed and more widely used. New fertilizers and water management systems in paddy rice are also likely in the longer term.
Possible changes to climate and atmosphere in coming decades may influence GHG emissions from agriculture, and the effectiveness of practices adopted to minimize them. For example, atmospheric CO2 concentrations, likely to double within the next century, may affect agro-ecosystems through changes in plant growth rates, plant litter composition, drought tolerance, and nitrogen demands (e.g., Long et al., 2006; Henry et al., 2005; Van Groenigen et al., 2005; Jensen and Christensen, 2004; Torbert et al., 2000; Norby et al., 2001). Similarly, atmospheric nitrogen deposition also affects crop production systems as well as changing temperature regimes, although the effect will depend on the magnitude of change and response of the crop, forage, or livestock species. For example, increasing temperatures are likely to have a positive effect on crop production in colder regions due to a longer growing season (Smith et al., 2005b). In contrast, increasing temperatures could accelerate decomposition of soil organic matter, releasing
stored soil carbon into the atmosphere (Knorr et al., 2005; Fang et al., 2005; Smith et al. 2005b). Furthermore, changes in precipitation patterns could change the adaptability of crops or cropping systems selected to reduce GHG emissions. Many of these effects have high levels of uncertainty; but demonstrate that practices chosen to reduce GHG emissions may not have the same effectiveness in coming decades. Consequently, programmes to reduce emissions in the agricultural sector will need to be designed with flexibility for adaptation in response to climate change.
Overall, the outlook for GHG mitigation in agriculture suggests significant potential. Current initiatives suggest that identifying synergies between climate change policies, sustainable development, and improvement of environmental quality will likely lead the way forward to realization of mitigation potential in this sector.
REFERENCES
Akiyama, H., K. Yagi, and X. Yan 2005: Direct N2O emissions from rice paddy fields: summary of available data. Global Biogeochemical Cycles, 19, GB1005, doi:10.1029/2004GB002378.
Albrecht, A. and S.T. Kandji, 2003: Carbon sequestration in tropical agroforestry systems. Agriculture, Ecosystems and Environment, 99, pp. 15-27.
Alcock, D. and R.S. Hegarty, 2006: Effects of pasture improvement on productivity, gross margin and methane emissions of a grazing sheep enterprise. In Greenhouse Gases and Animal Agriculture: An Update. C.R. Soliva, J. Takahashi, and M. Kreuzer (eds.), International Congress Series No. 1293, Elsevier, The Netherlands, pp. 103-106.
Alvarez, R. 2005: A review of nitrogen fertilizer and conservative tillage effects on soil organic storage. Soil Use and Management, 21, pp. 38-52.
Amon, B., T. Amon, J. Boxberger, and C. Wagner-Alt, 2001: Emissions of NH3, N2O and CH4 from dairy cows housed in a farmyard manure tying stall (housing, manure storage, manure spreading). Nutrient Cycling in Agro-Ecosystems, 60, pp. 103-113.
Amon, B., V. Kryvoruchko, T. Amon, and S. Zechmeister-Boltenstern, 2006: Methane, nitrous oxide and ammonia emissions during storage and after application of dairy cattle slurry and influence of slurry treatment. Agriculture, Ecosystems & Environment, 112, pp. 153-162.
Anderson, T.L., R.J. Charlson, S.E. Schwartz, R. Knutti, O. Boucher, H. Rodhe, and J. Heintzenberg, 2003: Climate forcing by aerosols - a hazy picture. Science, 300, pp. 1103-1104.
Andreae, M.O. 2001: The dark side of aerosols. Nature, 409, pp. 671-672.
Andreae, M.O. and P. Merlet, 2001: Emission to trace gases and aerosols from biomass burning. Global Biogeochemical Cycles, 15, pp. 955-966.
Andreae, M.O., C.D. Jones, and P.M. Cox, 2005: Strong present-day aerosol cooling implies a hot future. Nature, 435, 1187 pp.
Aulakh, M.S., R., Wassmann, C. Bueno, and H. Rennenberg, 2001: Impact of root exudates of different cultivars and plant development stages of rice (Oryza sativa L.) on methane production in a paddy soil. Plant and Soil, 230, pp. 77-86.
Balmford, A., R.E. Green, and J.P.W. Scharlemann, 2005: Sparing land for nature: exploring the potential impact of changes in agricultural yield on the area needed for crop production. Global Change Biology, 11, pp. 1594-1605.
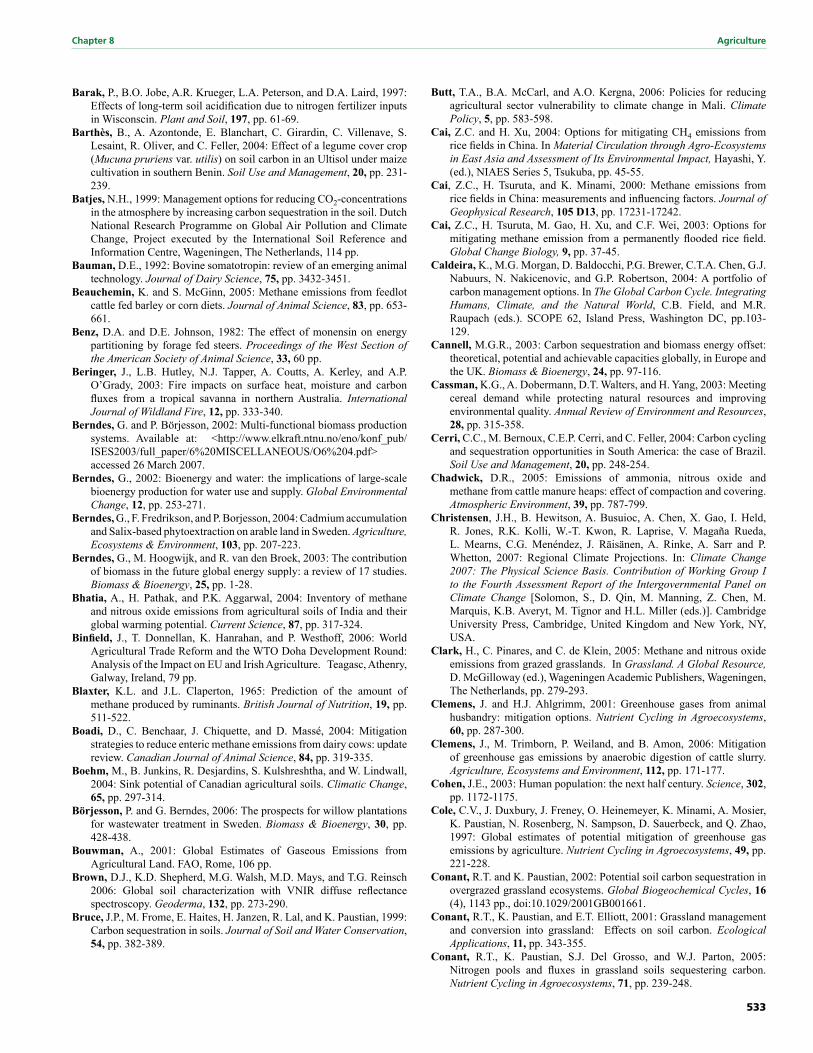
533
Chapter8 Agriculture
Barak, P., B.O. Jobe, A.R. Krueger, L.A. Peterson, and D.A. Laird, 1997: Effects of long-term soil acidification due to nitrogen fertilizer inputs in Wisconscin. Plant and Soil, 197, pp. 61-69.
Barthès, B., A. Azontonde, E. Blanchart, C. Girardin, C. Villenave, S. Lesaint, R. Oliver, and C. Feller, 2004: Effect of a legume cover crop (Mucuna pruriens var. utilis) on soil carbon in an Ultisol under maize cultivation in southern Benin. Soil Use and Management, 20, pp. 231-239.
Batjes, N.H., 1999: Management options for reducing CO2-concentrations in the atmosphere by increasing carbon sequestration in the soil. Dutch National Research Programme on Global Air Pollution and Climate Change, Project executed by the International Soil Reference and Information Centre, Wageningen, The Netherlands, 114 pp.
Bauman, D.E., 1992: Bovine somatotropin: review of an emerging animal technology. Journal of Dairy Science, 75, pp. 3432-3451.
Beauchemin, K. and S. McGinn, 2005: Methane emissions from feedlot cattle fed barley or corn diets. Journal of Animal Science, 83, pp. 653-661.
Benz, D.A. and D.E. Johnson, 1982: The effect of monensin on energy partitioning by forage fed steers. Proceedings of the West Section of the American Society of Animal Science, 33, 60 pp.
Beringer, J., L.B. Hutley, N.J. Tapper, A. Coutts, A. Kerley, and A.P. O’Grady, 2003: Fire impacts on surface heat, moisture and carbon fluxes from a tropical savanna in northern Australia. International Journal of Wildland Fire, 12, pp. 333-340.
Berndes, G. and P. Börjesson, 2002: Multi-functional biomass production systems. Available at: <http://www.elkraft.ntnu.no/eno/konf_pub/ISES2003/full_paper/6%20MISCELLANEOUS/O6%204.pdf> accessed 26 March 2007.
Berndes, G., 2002: Bioenergy and water: the implications of large-scale bioenergy production for water use and supply. Global Environmental Change, 12, pp. 253-271.
Berndes, G., F. Fredrikson, and P. Borjesson, 2004: Cadmium accumulation and Salix-based phytoextraction on arable land in Sweden. Agriculture, Ecosystems & Environment, 103, pp. 207-223.
Berndes, G., M. Hoogwijk, and R. van den Broek, 2003: The contribution of biomass in the future global energy supply: a review of 17 studies. Biomass & Bioenergy, 25, pp. 1-28.
Bhatia, A., H. Pathak, and P.K. Aggarwal, 2004: Inventory of methane and nitrous oxide emissions from agricultural soils of India and their global warming potential. Current Science, 87, pp. 317-324.
Binfield, J., T. Donnellan, K. Hanrahan, and P. Westhoff, 2006: World Agricultural Trade Reform and the WTO Doha Development Round: Analysis of the Impact on EU and Irish Agriculture. Teagasc, Athenry, Galway, Ireland, 79 pp.
Blaxter, K.L. and J.L. Claperton, 1965: Prediction of the amount of methane produced by ruminants. British Journal of Nutrition, 19, pp. 511-522.
Boadi, D., C. Benchaar, J. Chiquette, and D. Massé, 2004: Mitigation strategies to reduce enteric methane emissions from dairy cows: update review. Canadian Journal of Animal Science, 84, pp. 319-335.
Boehm, M., B. Junkins, R. Desjardins, S. Kulshreshtha, and W. Lindwall, 2004: Sink potential of Canadian agricultural soils. Climatic Change, 65, pp. 297-314.
Börjesson, P. and G. Berndes, 2006: The prospects for willow plantations for wastewater treatment in Sweden. Biomass & Bioenergy, 30, pp. 428-438.
Bouwman, A., 2001: Global Estimates of Gaseous Emissions from Agricultural Land. FAO, Rome, 106 pp.
Brown, D.J., K.D. Shepherd, M.G. Walsh, M.D. Mays, and T.G. Reinsch 2006: Global soil characterization with VNIR diffuse reflectance spectroscopy. Geoderma, 132, pp. 273-290.
Bruce, J.P., M. Frome, E. Haites, H. Janzen, R. Lal, and K. Paustian, 1999: Carbon sequestration in soils. Journal of Soil and Water Conservation, 54, pp. 382-389.
Butt, T.A., B.A. McCarl, and A.O. Kergna, 2006: Policies for reducing agricultural sector vulnerability to climate change in Mali. Climate Policy, 5, pp. 583-598.
Cai, Z.C. and H. Xu, 2004: Options for mitigating CH4 emissions from rice fields in China. In Material Circulation through Agro-Ecosystems in East Asia and Assessment of Its Environmental Impact, Hayashi, Y. (ed.), NIAES Series 5, Tsukuba, pp. 45-55.
Cai, Z.C., H. Tsuruta, and K. Minami, 2000: Methane emissions from rice fields in China: measurements and influencing factors. Journal of Geophysical Research, 105 D13, pp. 17231-17242.
Cai, Z.C., H. Tsuruta, M. Gao, H. Xu, and C.F. Wei, 2003: Options for mitigating methane emission from a permanently flooded rice field. Global Change Biology, 9, pp. 37-45.
Caldeira, K., M.G. Morgan, D. Baldocchi, P.G. Brewer, C.T.A. Chen, G.J. Nabuurs, N. Nakicenovic, and G.P. Robertson, 2004: A portfolio of carbon management options. In The Global Carbon Cycle. Integrating Humans, Climate, and the Natural World, C.B. Field, and M.R. Raupach (eds.). SCOPE 62, Island Press, Washington DC, pp.103-129.
Cannell, M.G.R., 2003: Carbon sequestration and biomass energy offset: theoretical, potential and achievable capacities globally, in Europe and the UK. Biomass & Bioenergy, 24, pp. 97-116.
Cassman, K.G., A. Dobermann, D.T. Walters, and H. Yang, 2003: Meeting cereal demand while protecting natural resources and improving environmental quality. Annual Review of Environment and Resources, 28, pp. 315-358.
Cerri, C.C., M. Bernoux, C.E.P. Cerri, and C. Feller, 2004: Carbon cycling and sequestration opportunities in South America: the case of Brazil. Soil Use and Management, 20, pp. 248-254.
Chadwick, D.R., 2005: Emissions of ammonia, nitrous oxide and methane from cattle manure heaps: effect of compaction and covering. Atmospheric Environment, 39, pp. 787-799.
Christensen, J.H., B. Hewitson, A. Busuioc, A. Chen, X. Gao, I. Held, R. Jones, R.K. Kolli, W.-T. Kwon, R. Laprise, V. Magaña Rueda, L. Mearns, C.G. Menéndez, J. Räisänen, A. Rinke, A. Sarr and P. Whetton, 2007: Regional Climate Projections. In: Climate Change 2007: The Physical Science Basis. Contribution of Working Group I to the Fourth Assessment Report of the Intergovernmental Panel on Climate Change [Solomon, S., D. Qin, M. Manning, Z. Chen, M. Marquis, K.B. Averyt, M. Tignor and H.L. Miller (eds.)]. Cambridge University Press, Cambridge, United Kingdom and New York, NY, USA.
Clark, H., C. Pinares, and C. de Klein, 2005: Methane and nitrous oxide emissions from grazed grasslands. In Grassland. A Global Resource, D. McGilloway (ed.), Wageningen Academic Publishers, Wageningen, The Netherlands, pp. 279-293.
Clemens, J. and H.J. Ahlgrimm, 2001: Greenhouse gases from animal husbandry: mitigation options. Nutrient Cycling in Agroecosystems, 60, pp. 287-300.
Clemens, J., M. Trimborn, P. Weiland, and B. Amon, 2006: Mitigation of greenhouse gas emissions by anaerobic digestion of cattle slurry. Agriculture, Ecosystems and Environment, 112, pp. 171-177.
Cohen, J.E., 2003: Human population: the next half century. Science, 302, pp. 1172-1175.
Cole, C.V., J. Duxbury, J. Freney, O. Heinemeyer, K. Minami, A. Mosier, K. Paustian, N. Rosenberg, N. Sampson, D. Sauerbeck, and Q. Zhao, 1997: Global estimates of potential mitigation of greenhouse gas emissions by agriculture. Nutrient Cycling in Agroecosystems, 49, pp. 221-228.
Conant, R.T. and K. Paustian, 2002: Potential soil carbon sequestration in overgrazed grassland ecosystems. Global Biogeochemical Cycles, 16 (4), 1143 pp., doi:10.1029/2001GB001661.
Conant, R.T., K. Paustian, and E.T. Elliott, 2001: Grassland management and conversion into grassland: Effects on soil carbon. Ecological Applications, 11, pp. 343-355.
Conant, R.T., K. Paustian, S.J. Del Grosso, and W.J. Parton, 2005: Nitrogen pools and fluxes in grassland soils sequestering carbon. Nutrient Cycling in Agroecosystems, 71, pp. 239-248.

534
Agriculture Chapter8
Connor, D.J., 2004: Designing cropping systems for efficient use of limited water in southern Australia. European Journal of Agronomy, 21, pp. 419-431.
Conway, G. and G. Toenniessen, 1999: Feeding the world in the twenty-first century. Nature, 402, pp. C55-C58.
Crutzen, P.J., 1995: The role of methane in atmospheric chemistry and climate. Proceedings of the Eighth International Symposium on Ruminant Physiology. Ruminant Physiology: Digestion, Metabolism, Growth and Reproduction, Von Engelhardt, W., S. Leonhard-Marek, G. Breves, and D. Giesecke (eds.), Ferdinand Enke Verlag, Stuttgart, pp. 291-316.
Dalal, R.C., W. Wang, G.P. Robertson, and W.J. Parton, 2003: Nitrous oxide emission from Australian agricultural lands and mitigation options: a review. Australian Journal of Soil Research, 41, pp. 165-195.
Davidson, E.A., D.C. Nepstad, C. Klink, and S.E. Trumbore, 1995: Pasture soils as carbon sink. Nature, 376, pp. 472-473.
Dean, T., 2000: Development: agriculture workers too poor to buy food. UN IPS, New York, 36 pp.
DeAngelo, B.J., F.C. de la Chesnaye, R.H. Beach, A. Sommer, and B.C. Murray, 2006: Methane and nitrous oxide mitigation in agriculture. Multi-Greenhouse Gas Mitigation and Climate Policy, Energy Journal, Special Issue #3.Available at: <http://www.iaee.org/en/publications/journal.aspx> accessed 26 March 2007.
DeFries, R.S., J.A. Foley, and G.P. Asner, 2004: Land-use choices: balancing human needs and ecosystem function. Frontiers in Ecology and Environment, 2, pp. 249-257.
Denman, K.L., G. Brasseur, A. Chidthaisong, P. Ciais, P.M. Cox, R.E. Dickinson, D. Hauglustaine, C. Heinze, E. Holland, D. Jacob, U. Lohmann, S Ramachandran, P.L. da Silva Dias, S.C. Wofsy and X. Zhang, 2007: Couplings Between Changes in the Climate System and Biogeochemistry. In: Climate Change 2007: The Physical Science Basis. Contribution of Working Group I to the Fourth Assessment Report of the Intergovernmental Panel on Climate Change [Solomon, S., D. Qin, M. Manning, Z. Chen, M. Marquis, K.B. Averyt, M.Tignor and H.L. Miller (eds.)]. Cambridge University Press, Cambridge, United Kingdom and New York, NY, USA.
Derner, J.D., T.W. Boutton, and D.D. Briske, 2006: Grazing and ecosystem carbon storage in the North American Great Plains. Plant and Soil, 280, pp. 77-90.
Dias de Oliveira, M.E., B.E. Vaughan, and E.J. Rykiel, Jr., 2005: Ethanol as fuel: energy, carbon dioxide balances, and ecological footprint. BioScience, 55, pp. 593-602.
Díaz -Zorita, M., G.A. Duarte, and J.H. Grove, 2002: A review of no-till systems and soil management for sustainable crop production in the subhumid and semiarid Pampas of Argentina. Soil and Tillage Research, 65, pp. 1-18.
Diekow, J., J. Mielniczuk, H. Knicker, C. Bayer, D.P. Dick, and I. Kögel-Knabner, I. 2005: Soil C and N stocks as affected by cropping systems and nitrogen fertilization in a southern Brazil Acrisol managed under no-tillage for 17 years. Soil and Tillage Research, 81, pp. 87-95.
Díez, J.A., P. Hernaiz, M.J. Muñoz, A. de la Torre, A. Vallejo, 2004: Impact of pig slurry on soil properties, water salinization, nitrate leaching and crop yield in a four-year experiment in Central Spain. Soil Use and Management, 20, pp. 444-450.
Dohme, F.A., A. Machmuller, A.Wasserfallen, and M. Kreuzer, 2001: Comparative efficiency of various fats rich in medium-chain fatty acids to suppress ruminal methanogenesis as measured with Rusitec. Canadian Journal of Animal Science, 80, pp. 473-482.
Edmonds, J.A., 2004: Climate change and energy technologies. Mitigation and Adaptation Strategies for Global Change, 9, pp. 391-416.
Eidman, V.R., 2005: Agriculture as a producer of energy. In Agriculture as a Producer and Consumer of Energy, J.L. Outlaw, K.J. Collins, and J.A. Duffield (eds.), CABI Publishing, Cambridge, MA, pp.30-67.
Elbakidze, L. and B.A. McCarl, 2007: Sequestration offsets versus direct emission reductions: consideration of environmental co-effects. Ecological Economics, 60(3), pp. 564-571.
European Climate Change Programme, 2001: Agriculture. Mitigation potential of Greenhouse Gases in the Agricultural Sector. Working Group 7, Final report, COMM(2000)88. European Commission, Brussels, 17 pp.
European Environment Agency, 2006: How much biomass can Europe use without harming the environment? EEA Briefing 2/2006. Available at: <http://reports.eea.europa.eu/briefing_2005_2/en> (accessed 26 March 2007).
Ewert, F., M.D.A. Rounsevell, I. Reginster, M. Metzger, and R. Leemans, 2005: Future scenarios of European agricultural land use. I: estimating changes in crop productivity. Agriculture, Ecosystems and Environment, 107, pp. 101-116.
Faaij, A., 2006: Modern biomass conversion technologies. Mitigation and Adaptation Strategies for Global Change, 11, pp. 335-367.
Falloon, P., P. Smith, and D.S. Powlson, 2004: Carbon sequestration in arable land - the case for field margins. Soil Use and Management, 20, pp. 240-247.
Fang, C., P. Smith, J.B. Moncrieff, and J.U. Smith, 2005: Similar response of labile and resistant soil organic matter pools to changes in temperature. Nature, 433, pp. 57-59.
FAO, 2001: Soil carbon sequestration for improved land management. World Soil Resources Reports No. 96. FAO, Rome, 58 pp.
FAO, 2003: World Agriculture: Towards 2015/2030. An FAO Perspective. FAO, Rome, 97 pp.
FAOSTAT, 2006: FAOSTAT Agricultural Data. Available at: <http://faostat.fao.org/> accessed 26 March 2007.
Fawcett, A.A. and R.D. Sands. 2006: Non-CO2 Greenhouse Gases in the Second Generation Model. Multi-Greenhouse Gas Mitigation and Climate Policy, Energy Journal, Special Issue #3, pp 305-322. Available at: <http://www.iaee.org/en/publications/journal.aspx> accessed 26 March 2007.
Fedoroff, N.V. and J.E. Cohen, 1999: Plants and population: is there time? Proceedings of the National Academy of Sciences USA, 96, pp. 5903-5907.
Feng, W., G.X. Pan, S. Qiang, R.H. Li, and J.G. Wei, 2006: Influence of long-term fertilization on soil seed bank diversity of a paddy soil under rice/rape rotation. Biodiversity Science, 14 (6), pp. 461-469.
Ferris, C.P., F.J. Gordon, D.C. Patterson, M.G. Porter, and T. Yan, 1999: The effect of genetic merit and concentrate proportion in the diet on nutrient utilization by lactating dairy cows. Journal of Agricultural Science, Cambridge 132, pp. 483-490.
Fisher, M.J., I.M. Rao, M.A. Ayarza, C.E. Lascano, J.I. Sanz, R.J. Thomas, and R.R. Vera,1994: Carbon storage by introduced deep-rooted grasses in the South American savannas. Nature, 371, pp. 236-238.
Foley, J.A., R. DeFries, G. Asner, C. Barford, G. Bonan, S.R. Carpenter, F.S. Chapin, M.T. Coe, G.C. Dailey, H.K. Gibbs, J.H. Helkowski, T. Holloway, E.A. Howard, C.J. Kucharik, C. Monfreda, J.A. Patz, I.C. Prentice, N. Ramankutty, and P.K. Snyder, 2005: Global consequences of land use. Science, 309, pp. 570-574.
Follett, R.F., 2001: Organic carbon pools in grazing land soils. In The Potential of U.S. Grazing Lands to Sequester Carbon and Mitigate the Greenhouse Effect. R.F. Follett, J.M. Kimble, and R. Lal (eds.), Lewis Publishers, Boca Raton, Florida, pp. 65-86.
Follett, R.F., J.M. Kimble, and R. Lal, 2001: The potential of U.S. grazing lands to sequester soil carbon. In The Potential of U.S. Grazing Lands to Sequester Carbon and Mitigate the Greenhouse Effect, R.F. Follett, J.M. Kimble, and R. Lal (eds.), Lewis Publishers, Boca Raton, Florida, pp. 401-430.
Follett, R.F., S.R. Shafer, M.D. Jawson, and A.J. Franzluebbers, 2005: Research and implementation needs to mitigate greenhouse gas emissions from agriculture in the USA. Soil and Tillage Research, 83, pp. 159-166.
Freibauer, A., M. Rounsevell, P. Smith, and A. Verhagen, 2004: Carbon sequestration in the agricultural soils of Europe. Geoderma, 122, pp. 1-23.

535
Chapter8 Agriculture
Fujino, J., R. Nair, M. Kainuma, T. Masui, and Y. Matsuoka, 2006: Multi-gas mitigation analysis on stabilization scenarios using AIM global model. Multi-Greenhouse Gas Mitigation and Climate Policy, Energy Journal, Special Issue #3, pp 343-354. Available at: <http://www.iaee.org/en/publications/journal.aspx> (accessed 26 March 2007).
Galloway, J.N., 2003: The global nitrogen cycle. Treatise on Geochemistry, 8, pp. 557-583.
Galloway, J.N., F.J. Dentener, D.G. Capone, E.W. Boyer, R.W. Howarth, S.P. Seitzinger, G.P. Asner, C.C. Cleveland, P.A. Green, E.A. Holland, D.M. Karl, A.F. Michaels, J.H. Porter, A.R. Townsend, and C.J. Vörösmarty, 2004: Nitrogen cycles: past, present, and future. Biogeochemistry, 70, pp. 153-226.
Galloway, J.N., J.D. Aber, J.W. Erisman, S.P. Seitzinger, R.W. Howarth, E.B. Cowling, and B.J. Cosby, 2003: The nitrogen cascade. Bioscience, 53, pp. 341-356.
Gehl, R.J., C.W. Rice, 2007: Emerging technologies for in situ measurement of soil carbon. Climatic Change 80, pp. 43-54.
Gilland, B., 2002: World population and food supply. Can food production keep pace with population growth in the next half-century? Food Policy, 27, pp. 47-63.
Gonzalez-Avalos, E. and L.G. Ruiz-Suarez, 2001: Methane emission factors from cattle in Mexico. Bioresource Technology, 80, pp. 63-71.
Green, R.E., S.J. Cornell, J.P.W. Scharlemann, and A. Balmford, 2005: Farming and the fate of wild nature. Science, 307, pp. 550-555.
Gregorich, E.G., P. Rochette, A.J. van den Bygaart, and D.A. Angers, 2005: Greenhouse gas contributions of agricultural soils and potential mitigation practices in Eastern Canada. Soil and Tillage Research, 83, pp. 53-72.
Guo, L.B. and R.M. Gifford, 2002: Soil carbon stocks and land use change: a meta analysis. Global Change Biology, 8, pp. 345-360.
Hamelinck, C.N., R.A.A. Suurs, and A.P.C. Faaij, 2004: Techno-economic analysis of international bio-energy trade chains. Biomass & Bioenergy, 29, pp. 114-134.
Hansen, L.B., 2000: Consequences of selection for milk yield from a geneticist’s viewpoint. Journal of Dairy Science, 83, pp. 1145-1150.
Helgason, B.L., H.H. Janzen, M.H. Chantigny, C.F. Drury, B.H. Ellert, E.G. Gregorich, Lemke, E. Pattey, P. Rochette, and C. Wagner-Riddle, 2005: Toward improved coefficients for predicting direct N2O emissions from soil in Canadian agroecosystems. Nutrient Cycling in Agroecosystems, 71, pp. 87-99.
Henry, H.A.L., E.E. Cleland, C.B. Field, and P.M. Vitousek, 2005: Interactive effects of elevated CO2, N deposition and climate change on plant litter quality in a California annual grassland. Oecologia, 142, pp. 465-473.
Hess, H.D., T.T. Tiemann, F. Noto, J.E. Carulla, and M. Kruezer, 2006: Strategic use of tannins as means to limit methane emission from ruminant livestock. In Greenhouse Gases and Animal Agriculture: An Update, C.R. Soliva, J. Takahashi, and M. Kreuzer (eds.). International Congress Series No. 1293, Elsevier, The Netherlands, pp. 164-167.
Hindrichsen, I.K., H.R. Wettstein, A. Machmüller, and M. Kreuzer, 2006: Methane emission, nutrient degradation and nitrogen turnover in dairy cows and their slurry at different production scenarios with and without concentrate supplementation. Agriculture, Ecosystems and Environment, 113, pp. 150-161.
Hoogwijk, M., 2004: On the Global and Regional Potential of Renewable Energy Sources. PhD Thesis, Copernicus Institute, Utrecht University, March 12, 2004. 256 pp.
Hoogwijk, M., A. Faaij, R. van den Broek, G. Berndes, D. Gielen, and W. Turkenburg, 2003: Exploration of the ranges of the global potential of biomass for energy. Biomass and Bioenergy, 25, pp. 119-133.
Hoogwijk, M., A. Faaij, B. Eickhout, B. de Vries, and W. Turkenburg, 2005: Potential of biomass energy out to 2100, for four IPCC SRES land-use scenarios. Biomass & Bioenergy, 29, pp. 225-257.
Huang, J., C. Pray, and S. Rozelle, 2002: Enhancing the crops to feed the poor. Nature, 418, pp. 678-684.
Huston, M.A. and G. Marland, 2003: Carbon management and biodiversity. Journal of Environmental Management, 67, pp. 77-86.
International Fertilizer Industry Association, 2007: Fertilizer consumption statistics. Available at: <http://www.fertilizer.org/ifa/statistics.asp> (accessed 26 March 2007).
IPCC, 1996: Climate change 1995: The Science of Climate Change. Contribution of Working Group I to the Second Assessment Report of the Intergovernmental Panel on Climate Change (IPCC). Cambridge University Press, Cambridge.
IPCC, 1997: Revised 1996 IPCC Guidelines for National Greenhouse Gas Inventories Workbook. Volume 2. Cambridge University Press, Cambridge.
IPCC, 2000: Land Use, Land-Use Change and Forestry. Special Report of the Intergovernmental Panel on Climate Change. Cambridge University Press, Cambridge.
IPCC, 2001a: Climate Change 2001: The Scientific Basis. Contribution of Working Group I to the Third Assessment Report of the Intergovernmental Panel on Climate Change [Houghton, J.T., Y. Ding, D.J. Griggs, M. Noguer, P.J. van der Linden, X. Dai, K. Maskell, and C.A. Johnson, (eds.)], Cambridge University Press, 881 pp.
IPCC, 2001b: Climate Change 2001: Mitigation: Contribution of Working Group III to the Third Assessment Report of the Intergovernmental Panel on Climate Change [Metz, B., O. Davidson, R. Swart, and J. Pan, (eds.)], Cambridge University Press, 752 pp.
IPCC, 2003: Good Practice Guidance for Greenhouse Gas Inventories for Land-Use, Land-Use Change & Forestry. Institute of Global Environmental Strategies (IGES), Kanagawa, Japan.
IPCC, 2006: 2006 National Greenhouse Gas Inventory Guidelines. Institute of Global Environmental Strategies (IGES), Kanagawa, Japan.
IPCC, 2007: Climate Change 2007: Impacts, Adaptation and Vulnerability. Contribution of Working Group II to the Fourth Assessment Report of the Intergovernmental Panel on Climate Change [Parry, M.L., O.F. Canziani, J.P Palutikof, P.J. van der Linden, C.E. Hanson (eds.)]. Cambridge University Press, Cambridge, United Kingdom and New York, NY, USA.
Izaurralde, R.C. and C.W. Rice, 2006: Methods and tools for designing pilot soil carbon sequestration projects. In Carbon Sequestration in Soils of Latin America, Lal, R., C.C. Cerri, M. Bernoux, J. Etchvers, and C.E. Cerri (eds.), CRC Press, Boca Raton, pp. 457-476.
Izaurralde, R.C., W.B. McGill, J.A. Robertson, N.G. Juma, and J.J. Thurston, 2001: Carbon balance of the Breton classical plots over half a century. Soil Science Society of America Journal, 65, pp. 431-441.
Jackson, R.B., E.G. Jobbágy, R. Avissar, S. Baidya Roy, D. Barrett, C.W. Cook, K.A. Farley, D.C. le Maitre, B.A. McCarl, and B.C. Murray 2005: Trading water for carbon with biological carbon sequestration. Science, 310, pp. 1944-1947.
Janzen, H.H., 2004: Carbon cycling in earth systems - a soil science perspective. Agriculture, Ecosystems and Environment, 104, pp. 399-417.
Janzen, H.H., 2005: Soil carbon: A measure of ecosystem response in a changing world? Canadian Journal of Soil Science, 85, pp. 467-480.
Jensen, B., B.T. Christensen, 2004: Interactions between elevated CO2 and added N: effects on water use, biomass, and soil 15N uptake in wheat. Acta Agriculturae Scandinavica, Section B 54, pp. 175-184.
Johnson, D.E., G.M. Ward, and J. Torrent, 1991: The environmental impact of bovine somatotropin (bST) use in dairy cattle. Journal of Dairy Science, 74S, 209 pp.
Johnson, D.E., H.W. Phetteplace, and A.F. Seidl, 2002: Methane, nitrous oxide and carbon dioxide emissions from ruminant livestock production systems. In Greenhouse Gases and Animal Agriculture, J. Takahashi, and B.A. Young (eds.), Elsevier, Amsterdam, The Netherlands, pp. 77-85.
Johnson, K.A. and D.E. Johnson, 1995: Methane emissions from cattle. Journal of Animal Science, 73, pp. 2483-2492.
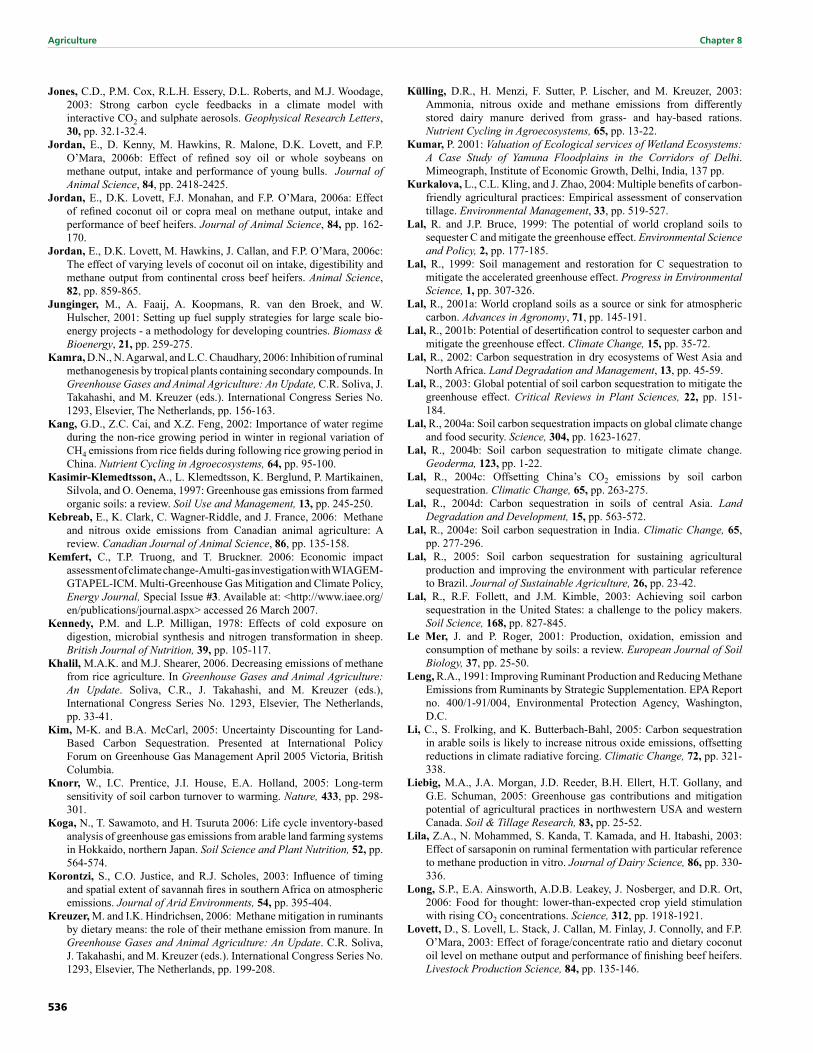
536
Agriculture Chapter8
Jones, C.D., P.M. Cox, R.L.H. Essery, D.L. Roberts, and M.J. Woodage, 2003: Strong carbon cycle feedbacks in a climate model with interactive CO2 and sulphate aerosols. Geophysical Research Letters, 30, pp. 32.1-32.4.
Jordan, E., D. Kenny, M. Hawkins, R. Malone, D.K. Lovett, and F.P. O’Mara, 2006b: Effect of refined soy oil or whole soybeans on methane output, intake and performance of young bulls. Journal of Animal Science, 84, pp. 2418-2425.
Jordan, E., D.K. Lovett, F.J. Monahan, and F.P. O’Mara, 2006a: Effect of refined coconut oil or copra meal on methane output, intake and performance of beef heifers. Journal of Animal Science, 84, pp. 162-170.
Jordan, E., D.K. Lovett, M. Hawkins, J. Callan, and F.P. O’Mara, 2006c: The effect of varying levels of coconut oil on intake, digestibility and methane output from continental cross beef heifers. Animal Science, 82, pp. 859-865.
Junginger, M., A. Faaij, A. Koopmans, R. van den Broek, and W. Hulscher, 2001: Setting up fuel supply strategies for large scale bio-energy projects - a methodology for developing countries. Biomass & Bioenergy, 21, pp. 259-275.
Kamra, D.N., N. Agarwal, and L.C. Chaudhary, 2006: Inhibition of ruminal methanogenesis by tropical plants containing secondary compounds. In Greenhouse Gases and Animal Agriculture: An Update, C.R. Soliva, J. Takahashi, and M. Kreuzer (eds.). International Congress Series No. 1293, Elsevier, The Netherlands, pp. 156-163.
Kang, G.D., Z.C. Cai, and X.Z. Feng, 2002: Importance of water regime during the non-rice growing period in winter in regional variation of CH4 emissions from rice fields during following rice growing period in China. Nutrient Cycling in Agroecosystems, 64, pp. 95-100.
Kasimir-Klemedtsson, A., L. Klemedtsson, K. Berglund, P. Martikainen, Silvola, and O. Oenema, 1997: Greenhouse gas emissions from farmed organic soils: a review. Soil Use and Management, 13, pp. 245-250.
Kebreab, E., K. Clark, C. Wagner-Riddle, and J. France, 2006: Methane and nitrous oxide emissions from Canadian animal agriculture: A review. Canadian Journal of Animal Science, 86, pp. 135-158.
Kemfert, C., T.P. Truong, and T. Bruckner. 2006: Economic impact assessment of climate change-A multi-gas investigation with WIAGEM-GTAPEL-ICM. Multi-Greenhouse Gas Mitigation and Climate Policy, Energy Journal, Special Issue #3. Available at: <http://www.iaee.org/en/publications/journal.aspx> accessed 26 March 2007.
Kennedy, P.M. and L.P. Milligan, 1978: Effects of cold exposure on digestion, microbial synthesis and nitrogen transformation in sheep. British Journal of Nutrition, 39, pp. 105-117.
Khalil, M.A.K. and M.J. Shearer, 2006. Decreasing emissions of methane from rice agriculture. In Greenhouse Gases and Animal Agriculture: An Update. Soliva, C.R., J. Takahashi, and M. Kreuzer (eds.), International Congress Series No. 1293, Elsevier, The Netherlands, pp. 33-41.
Kim, M-K. and B.A. McCarl, 2005: Uncertainty Discounting for Land-Based Carbon Sequestration. Presented at International Policy Forum on Greenhouse Gas Management April 2005 Victoria, British Columbia.
Knorr, W., I.C. Prentice, J.I. House, E.A. Holland, 2005: Long-term sensitivity of soil carbon turnover to warming. Nature, 433, pp. 298-301.
Koga, N., T. Sawamoto, and H. Tsuruta 2006: Life cycle inventory-based analysis of greenhouse gas emissions from arable land farming systems in Hokkaido, northern Japan. Soil Science and Plant Nutrition, 52, pp. 564-574.
Korontzi, S., C.O. Justice, and R.J. Scholes, 2003: Influence of timing and spatial extent of savannah fires in southern Africa on atmospheric emissions. Journal of Arid Environments, 54, pp. 395-404.
Kreuzer, M. and I.K. Hindrichsen, 2006: Methane mitigation in ruminants by dietary means: the role of their methane emission from manure. In Greenhouse Gases and Animal Agriculture: An Update. C.R. Soliva, J. Takahashi, and M. Kreuzer (eds.). International Congress Series No. 1293, Elsevier, The Netherlands, pp. 199-208.
Külling, D.R., H. Menzi, F. Sutter, P. Lischer, and M. Kreuzer, 2003: Ammonia, nitrous oxide and methane emissions from differently stored dairy manure derived from grass- and hay-based rations. Nutrient Cycling in Agroecosystems, 65, pp. 13-22.
Kumar, P. 2001: Valuation of Ecological services of Wetland Ecosystems: A Case Study of Yamuna Floodplains in the Corridors of Delhi. Mimeograph, Institute of Economic Growth, Delhi, India, 137 pp.
Kurkalova, L., C.L. Kling, and J. Zhao, 2004: Multiple benefits of carbon-friendly agricultural practices: Empirical assessment of conservation tillage. Environmental Management, 33, pp. 519-527.
Lal, R. and J.P. Bruce, 1999: The potential of world cropland soils to sequester C and mitigate the greenhouse effect. Environmental Science and Policy, 2, pp. 177-185.
Lal, R., 1999: Soil management and restoration for C sequestration to mitigate the accelerated greenhouse effect. Progress in Environmental Science, 1, pp. 307-326.
Lal, R., 2001a: World cropland soils as a source or sink for atmospheric carbon. Advances in Agronomy, 71, pp. 145-191.
Lal, R., 2001b: Potential of desertification control to sequester carbon and mitigate the greenhouse effect. Climate Change, 15, pp. 35-72.
Lal, R., 2002: Carbon sequestration in dry ecosystems of West Asia and North Africa. Land Degradation and Management, 13, pp. 45-59.
Lal, R., 2003: Global potential of soil carbon sequestration to mitigate the greenhouse effect. Critical Reviews in Plant Sciences, 22, pp. 151-184.
Lal, R., 2004a: Soil carbon sequestration impacts on global climate change and food security. Science, 304, pp. 1623-1627.
Lal, R., 2004b: Soil carbon sequestration to mitigate climate change. Geoderma, 123, pp. 1-22.
Lal, R., 2004c: Offsetting China’s CO2 emissions by soil carbon sequestration. Climatic Change, 65, pp. 263-275.
Lal, R., 2004d: Carbon sequestration in soils of central Asia. Land Degradation and Development, 15, pp. 563-572.
Lal, R., 2004e: Soil carbon sequestration in India. Climatic Change, 65, pp. 277-296.
Lal, R., 2005: Soil carbon sequestration for sustaining agricultural production and improving the environment with particular reference to Brazil. Journal of Sustainable Agriculture, 26, pp. 23-42.
Lal, R., R.F. Follett, and J.M. Kimble, 2003: Achieving soil carbon sequestration in the United States: a challenge to the policy makers. Soil Science, 168, pp. 827-845.
Le Mer, J. and P. Roger, 2001: Production, oxidation, emission and consumption of methane by soils: a review. European Journal of Soil Biology, 37, pp. 25-50.
Leng, R.A., 1991: Improving Ruminant Production and Reducing Methane Emissions from Ruminants by Strategic Supplementation. EPA Report no. 400/1-91/004, Environmental Protection Agency, Washington, D.C.
Li, C., S. Frolking, and K. Butterbach-Bahl, 2005: Carbon sequestration in arable soils is likely to increase nitrous oxide emissions, offsetting reductions in climate radiative forcing. Climatic Change, 72, pp. 321-338.
Liebig, M.A., J.A. Morgan, J.D. Reeder, B.H. Ellert, H.T. Gollany, and G.E. Schuman, 2005: Greenhouse gas contributions and mitigation potential of agricultural practices in northwestern USA and western Canada. Soil & Tillage Research, 83, pp. 25-52.
Lila, Z.A., N. Mohammed, S. Kanda, T. Kamada, and H. Itabashi, 2003: Effect of sarsaponin on ruminal fermentation with particular reference to methane production in vitro. Journal of Dairy Science, 86, pp. 330-336.
Long, S.P., E.A. Ainsworth, A.D.B. Leakey, J. Nosberger, and D.R. Ort, 2006: Food for thought: lower-than-expected crop yield stimulation with rising CO2 concentrations. Science, 312, pp. 1918-1921.
Lovett, D., S. Lovell, L. Stack, J. Callan, M. Finlay, J. Connolly, and F.P. O’Mara, 2003: Effect of forage/concentrate ratio and dietary coconut oil level on methane output and performance of finishing beef heifers. Livestock Production Science, 84, pp. 135-146.

537
Chapter8 Agriculture
Lovett, D.K. and F.P. O’Mara, 2002: Estimation of enteric methane emissions originating from the national livestock beef herd: a review of the IPCC default emission factors. Tearmann, 2, pp. 77-83.
Lovett, D.K., L. Shalloo, P. Dillon, and F.P. O’Mara, 2006: A systems approach to quantify greenhouse gas fluxes from pastoral dairy production as affected by management regime. Agricultural Systems, 88, pp. 156-179.
Lutz, W., W. Sanderson, S. Scherbov, 2001: The end of world population growth. Nature, 412, pp. 543-545.
Machado, P.L.O.A. and C.A. Silva, 2001: Soil management under no-tillage systems in the tropics with special reference to Brazil. Nutrient Cycling in Agroecosystems, 61, pp. 119-130.
Machado, P.L.O.A. and P.L. Freitas 2004: No-till farming in Brazil and its impact on food security and environmental quality. In Sustainable Agriculture and the International Rice-Wheat System, R. Lal, P.R. Hobbs, N. Uphoff, D.O. Hansen (eds.), Marcel Dekker, New York, pp. 291-310.
Machmüller, A., C.R. Soliva, and M. Kreuzer, 2003: Methane-suppressing effect of myristic acid in sheep as affected by dietary calcium and forage proportion. British Journal of Nutrition, 90, pp. 529-540.
Machmülller, A., D.A. Ossowski, and M. Kreuzer, 2000: Comparative evaluation of the effects of coconut oil, oilseeds and crystalline fat on methane release, digestion and energy balance in lambs. Animal Feed Science and Technology, 85, pp. 41-60.
Madari, B., P.L.O.A. Machado, E. Torres, A.G. Andrade, and L.I.O. Valencia, 2005: No tillage and crop rotation effects on soil aggregation and organic carbon in a Fhodic Ferralsol from southern Brazil. Soil and Tillage Research, 80, pp. 185-200.
Manne, A.S. and R.G. Richels, 2004: A multi-gas approach to climate policy. In The Global Carbon Cycle. Integrating Humans, Climate, and the Natural World, C.B. Field and M.R. Raupach (eds.). SCOPE 62, Island Press, Washington DC, pp. 439-452.
Marland, G., B.A. McCarl, and U.A. Schneider, 2001: Soil carbon: policy and economics. Climatic Change, 51, pp. 101-117.
Marland, G., R.A. Pielke Jr., M. Apps, R. Avissar, R.A. Betts, K.J. Davis, P.C. Frumhoff, S.T. Jackson, L.A. Joyce, P. Kauppi, J. Katzenberger, K.G. MacDicken, R.P. Neilson, J.O. Niles, D.S. Niyogi, R.J. Norby, N. Pena, N. Sampson, and Y. Xue, 2003a: The climatic impacts of land surface change and carbon management, and the implications for climate-change mitigation policy. Climate Policy, 3, pp. 149-157.
Marland, G., T.O. West, B. Schlamadinger, and L. Canella, 2003b: Managing soil organic carbon in agriculture: the net effect on greenhouse gas emissions. Tellus 55B, pp. 613-621.
McCarl, B.A. and U.A. Schneider, 2001: Greenhouse gas mitigation in U.S. agriculture and forestry. Science, 294, pp. 2481-2482.
McCrabb, G.C., 2001: Nutritional options for abatement of methane emissions from beef and dairy systems in Australia. In Greenhouse Gases and Animal Agriculture, J. Takahashi and B.A. Young (eds.), Elsevier, Amsterdam, pp 115-124.
McCrabb, G.J., M. Kurihara, and R.A. Hunter, 1998: The effect of finishing strategy of lifetime methane production for beef cattle in northern Australia. Proceedings of the Nutrition Society of Australia, 22, 55 pp.
McGinn, S.M., K.A. Beauchemin, T. Coates, and D. Colombatto, 2004: Methane emissions from beef cattle: effects of monensin, sunflower oil, enzymes, yeast, and fumaric acid. Journal of Animal Science, 82, pp. 3346-3356.
McSwiney, C.P. and G.P. Robertson, 2005: Nonlinear response of N2O flux to incremental fertilizer addition in a continuous maize (Zea mays L.) cropping system. Global Change Biology, 11, pp. 1712-1719.
Menon, S., J. Hansen, L. Nazarenko, and Y. Luo, 2002: Climate effects of black carbon aerosols in China and India. Science, 297, pp. 2250-2253.
Miglior, F., B.L. Muir, and B.J. Van Doormaal, 2005: Selection indices in Holstein cattle of various countries. Journal of Dairy Science, 88, pp. 1255-1263.
Millennium Ecosystem Assessment, 2005: Ecosystems and Human Well-Being: Current State and Trends. Findings of the Condition and Trends Working Group. Millennium Ecosystem Assessment Series, Island press, Washington D.C., 815 pp.
Mills, J.A.N., E. Kebreab, C.M. Yates, L.A. Crompton, S.B. Cammell, M.S. Dhanoa, R.E. Agnew, and J. France, 2003: Alternative approaches to predicting methane emissions from dairy cows. Journal of Animal Science, 81, pp. 3141-3150.
Moe, P.W. and H.F. Tyrrell, 1979: Methane production in dairy cows. Journal of Dairy Science, 62, pp. 1583-1586.
Monteny, G.-J., A. Bannink, and D. Chadwick, 2006: Greenhouse gas abatement strategies for animal husbandry. Agriculture, Ecosystems and Environment, 112, pp. 163-170.
Monteny, G.J., C.M. Groenestein, and M.A. Hilhorst, 2001: Interactions and coupling between emissions of methane and nitrous oxide from animal husbandry. Nutrient Cycling in Agroecosystems, 60, pp. 123-132.
Mooney, H., A. Cropper, and W. Reid, 2005: Confronting the human dilemma. Nature, 434, pp. 561-562.
Mooney, S., J.M. Antle, S.M. Capalbo, and K. Paustian, 2004: Influence of project scale on the costs of measuring soil C sequestration. Environmental Management, 33(S1), pp. S252-S263.
Mosier, A. and C. Kroeze, 2000: Potential impact on the global atmospheric N2O budget of the increased nitrogen input required to meet future global food demands. Chemosphere-Global Change Science, 2, pp. 465-473.
Mosier, A.R., 2001: Exchange of gaseous nitrogen compounds between agricultural systems and the atmosphere. Plant and Soil, 228, pp. 17-27.
Mosier, A.R., 2002: Environmental challenges associated with needed increases in global nitrogen fixation. Nutrient Cycling in Agroecosystems, 63, pp. 101-116.
Mosier, A.R., A.D. Halvorson, G.A. Peterson, G.P. Robertson, and L. Sherrod, 2005: Measurement of net global warming potential in three agroecosystems. Nutrient Cycling in Agroecosystems, 72, pp. 67-76.
Mosier, A.R., J.M. Duxbury, J.R. Freney, O. Heinemeyer, K. Minami, and D.E. Johnson, 1998: Mitigating agricultural emissions of methane. Climatic Change, 40, pp. 39-80.
Murray, B.C., B.A. McCarl, and H-C. Lee, 2004: Estimating leakage from forest carbon sequestration programs. Land Economics, 80, pp. 109-124.
Murray, R.M., A.M. Bryant, and R.A. Leng, 1976: Rate of production of methane in the rumen and the large intestine of sheep. British Journal of Nutrition, 36, pp. 1-14.
Mutuo, P.K., G. Cadisch, A. Albrecht, C.A. Palm, and L. Verchot, 2005: Potential of agroforestry for carbon sequestration and mitigation of greenhouse gas emissions from soils in the tropics. Nutrient Cycling in Agroecosystems, 71, pp. 43-54.
NEPAD, 2005: The NEPAD Framework Document. New Partnership for Africa’s Development, <http://www.uneca.org/nepad/> (accessed 26 March 2007).
Newbold, C.J. and L.M. Rode, 2006: Dietary additives to control methanogenesis in the rumen. In Greenhouse Gases and Animal Agriculture: An Update. C.R. Soliva, J. Takahashi, and M. Kreuzer (eds.), International Congress Series No. 1293, Elsevier, The Netherlands, pp. 138-147.
Newbold, C.J., J.O. Ouda, S. López, N. Nelson, H. Omed, R.J. Wallace, and A.R. Moss, 2002: Propionate precursors as possible alternative electron acceptors to methane in ruminal fermentation. In Greenhouse Gases and Animal Agriculture. J. Takahashi and B.A. Young (eds.), Elsevier, Amsterdam, pp. 151-154.
Newbold, C.J., S. López, N. Nelson, J.O. Ouda, R.J. Wallace, and A.R. Moss, 2005: Proprionate precursors and other metabolic intermediates as possible alternative electron acceptors to methanogenesis in ruminal fermentation in vitro. British Journal of Nutrition, 94, pp. 27-35.

538
Agriculture Chapter8
Norby, R.J., M.F. Cotrufo, P. Ineson, E.G. O’Neill, and J.G. Canadell, 2001: Elevated CO2, litter chemistry, and decomposition: a synthesis. Oecologia, 127, pp. 153-165.
Oelbermann, M., R.P. Voroney, and A.M. Gordon, 2004: Carbon sequestration in tropical and temperate agroforestry systems: a review with examples from Costa Rica and southern Canada. Agriculture Ecosystems and Environment, 104, pp. 359-377.
Oenema, O., N. Wrage, G.L. Velthof, J.W. van Groenigen, J. Dolfing, and P.J. Kuikman, 2005: Trends in global nitrous oxide emissions from animal production systems. Nutrient Cycling in Agroecosystems, 72, pp. 51-65.
Ogle, S.M. and K. Paustian, 2005: Soil organic carbon as an indicator of environmental quality at the national scale: monitoring methods and policy relevance. Canadian Journal of Soil Science, 8, pp. 531-540.
Ogle, S.M., F.J. Breidt, and K. Paustian, 2005: Agricultural management impacts on soil organic carbon storage under moist and dry climatic conditions of temperate and tropical regions. Biogeochemistry, 72, pp. 87-121.
Ogle, S.M., F.J. Breidt, M.D. Eve, and K. Paustian, 2003: Uncertainty in estimating land use and management impacts on soil organic storage for US agricultural lands between 1982 and 1997. Global Change Biology, 9, pp. 1521-1542.
Ogle, S.M., R.T. Conant, and K. Paustian, 2004: Deriving grassland management factors for a carbon accounting approach developed by the Intergovernmental Panel on Climate Change. Environmental Management, 33, pp. 474-484.
Olesen, J.E., K. Schelde, A. Weiske, M.R. Weisbjerg, W.A.H. Asman, and J. Djurhuus, 2006: Modelling greenhouse gas emissions from European conventional and organic dairy farms. Agriculture, Ecosystems and Environment, 112, pp. 207-220.
Olsson, L. and J. Ardö, 2002: Soil carbon sequestration in degraded semiarid agro-ecosystems - perils and potentials. Ambio, 31, pp. 471-477.
Pan, G.X., P. Zhou, X.H. Zhang, L.Q. Li, J.F. Zheng, D.S. Qiu, and Q.H. Chu, 2006: Effect of different fertilization practices on crop C assimilation and soil C sequestration: a case of a paddy under a long-term fertilization trial from the Tai Lake region, China. Acta Ecologica Sinica, 26(11), pp. 3704-3710.
Patra, A.K., D.N. Kamra, and N. Agarwal, 2006: Effect of spices on rumen fermentation, methanogenesis and protozoa counts in in vitro gas production test. In Greenhouse Gases and Animal Agriculture: An Update, C.R. Soliva, J. Takahashi, and M. Kreuzer (eds.), International Congress Series No. 1293, Elsevier, The Netherlands, pp. 176-179.
Pattey, E., M.K. Trzcinski, and R.L. Desjardins, 2005: Quantifying the reduction of greenhouse gas emissions as a result of composting dairy and beef cattle manure. Nutrient Cycling in Agroecosystems, 72, pp. 173-187.
Paul, E.A., S.J. Morris, J. Six, K. Paustian, and E.G. Gregorich, 2003: Interpretation of soil carbon and nitrogen dynamics in agricultural and afforested soils. Soil Science Society of America Journal, 67, pp. 1620-1628.
Paustian, K., B.A. Babcock, J. Hatfield, R. Lal, B.A. McCarl, S. McLaughlin, A. Mosier, C. Rice, G.P. Robertson, N.J. Rosenberg, C. Rosenzweig, W.H. Schlesinger, and D. Zilberman, 2004: Agricultural Mitigation of Greenhouse Gases: Science and Policy Options. CAST (Council on Agricultural Science and Technology) Report, R141 2004, ISBN 1-887383-26-3, 120 pp.
Paustian, K., C.V. Cole, D. Sauerbeck, and N. Sampson, 1998: CO2 mitigation by agriculture: An overview. Climatic Change, 40, pp. 135-162.
Pérez-Ramírez, J., F. Kapteijn, K. Schöffel, and J.A. Moulijn, 2003: Formation and control of N2O in nitric acid production: Where do we stand today? Applied Catalysis B: Environmental, 44, pp. 117-151.
Phetteplace, H.W., D.E. Johnson, and A.F. Seidl, 2001: Greenhouse gas emissions from simulated beef and dairy livestock systems in the United States. Nutrient Cycling in Agroecosystems, 60, 9-102.
Pinares-Patiño, C.S., M.J. Ulyatt, G.C. Waghorn, C.W. Holmes, T.N. Barry, K.R. Lassey, and D.E. Johnson, 2003: Methane emission by alpaca and sheep fed on lucerne hay or grazed on pastures of perennial ryegrass/white clover or birdsfoot trefoil. Journal of Agricultural Science, 140, pp. 215-226.
Rao, C.H., 1994: Agricultural Growth, Rural Poverty and Environmental Degradation in India. Oxford University Press, Delhi.
Reay, D.S., K.A. Smith, and A.C. Edwards, 2003: Nitrous oxide emission from agricultural drainage waters. Global Change Biology, 9, pp. 195-203.
Reeder, J.D., G.E. Schuman, J.A. Morgan, and D.R. Lecain, 2004: Response of organic and inorganic carbon and nitrogen to long-term grazing of the shortgrass steppe. Environmental Management, 33, pp. 485-495.
Rees, W.E., 2003: A blot on the land. Nature, 421, 898 pp.Reilly, J.M., F. Tubiello, B.A. McCarl, and J. Melillo, 2001: Climate change
and agriculture in the United States. In Climate Change Impacts on the United States: US National Assessment of the Potential Consequences of Climate Variability and Change: Foundation, Cambridge University Press, Cambridge, Chapter 13, pp 379-403.
Rice, C.W. and C.E. Owensby, 2001: Effects of fire and grazing on soil carbon in rangelands. In The Potential of U.S. Grazing Lands to Sequester Carbon and Mitigate the Greenhouse Effect. R. Follet, J.M. Kimble, and R. Lal (eds.), Lewis Publishers, Boca Raton, Florida, pp. 323-342.
Richter, B., 2004: Using ethanol as an energy source. Science, 305, 340 pp.
Robertson, G.P. and P.R. Grace, 2004: Greenhouse gas fluxes in tropical and temperate agriculture: The need for a full-cost accounting of global warming potentials. Environment, Development and Sustainability, 6, pp. 51-63.
Robertson, G.P., 2004: Abatement of nitrous oxide, methane and other non-CO2 greenhouse gases: the need for a systems approach. In The global carbon cycle. Integrating Humans, Climate, and the Natural World, C.B. Field, and M.R. Raupach (eds.). SCOPE 62, Island Press, Washington D.C., pp. 493-506.
Robertson, G.P., E.A. Paul, and R.R. Harwood, 2000: Greenhouse gases in intensive agriculture: Contributions of individual gases to the radiative forcing of the atmosphere. Science, 289, pp. 1922-1925.
Robertson, L.J. and G.C. Waghorn, 2002: Dairy industry perspectives on methane emissions and production from cattle fed pasture or total mixed rations in New Zealand. Proceedings of the New Zealand Society of Animal Production, 62, pp. 213-218.
Rochette, P. and H.H. Janzen, 2005: Towards a revised coefficient for estimating N2O emissions from legumes. Nutrient Cycling in Agroecosystems, 73, pp. 171-179.
Rockström, J., 2003: Water for food and nature in drought-prone tropics: vapour shift in rain-fed agriculture. Philosophical Transactions of the Royal Society of London B, 358, pp. 1997-2009.
Rogner, H., M. Cabrera, A. Faaij, M. Giroux, D. Hall, V. Kagramanian, Serguei, T.Lefevre,R. Moreira, R. Notstaller, P. Odell, M. Taylor, 2000: Energy Resources. In World Energy Assessment of the United Nations, J. Goldemberg et al. (eds.), UNDP, UNDESA/WEC. UNDP, New York, Chapter 5, pp. 135-171.
Romanenkov, V., I. Romanenko, O. Sirotenko, and L. Shevtsova, 2004: Soil carbon sequestration strategy as a component of integrated agricultural sustainability policy under climate change. In Proceedings of Russian National Workshop on Research Related to the IHDP on Global Environmental Change, November 10-12, 2004, IHDP, Moscow, Russia, pp. 180-189.
Rose, S., H. Ahammad, B. Eickhout, B. Fisher, A. Kurosawa, S. Rao, K. Riahi, and D. van Vuuren, 2007. Land in Climate Stabilization Modeling. Energy Modeling Forum Report, Stanford University < http://www.stanford.edu/group/EMF/projects/group21/Landuse.pdf > accessed 26 March 2007.

539
Chapter8 Agriculture
Rosegrant, M., M.S. Paisner, and S. Meijer, 2001: Long-Term Prospects for Agriculture and the Resource Base. The World Bank Rural Development Family. Rural Development Strategy Background Paper #1. The World Bank, Washington.
Rosegrant, M.W. and S.A. Cline, 2003: Global food security: challenges and policies. Science, 302, pp. 1917-1919.
Rounsevell, M.D.A, I. Reginster, M.B. Araújo, T.R. Carter, N. Dendoncker, F. Ewert, J.I. House, S. Kankaanpää, R. Leemans, M.J. Metzger, C. Schmit, P. Smith, and G. Tuck, 2006: A coherent set of future land use change scenarios for Europe. Agriculture Ecosystems and Environment, 114, pp. 57-68.
Roy, R.N., R.V. Misra, and A. Montanez, 2002: Decreasing reliance on mineral nitrogen - yet more food. Ambio, 31, pp. 177-183.
Rumpler, W.V., D.E. Johnson, and D.B. Bates, 1986: The effect of high dietary cation concentrations on methanogenesis by steers fed with or without ionophores. Journal of Animal Science, 62, pp. 1737-1741.
Sanchez, P.A. and M.S. Swaminathan, 2005: Cutting world hunger in half. Science, 307, pp. 357-359.
Sanchez, P.A., 2002: Soil fertility and hunger in Africa. Science, 295, pp. 2019-2020.
Sands, R.D. and B.A. McCarl, 2005: Competitiveness of terrestrial greenhouse gas offsets: are they a bridge to the future? In Abstracts of USDA Symposium on Greenhouse Gases and Carbon Sequestration in Agriculture and Forestry, March 22-24, USDA, Baltimore, Maryland.
Schils, R.L.M., A. Verhagen, H.F.M. Aarts, and L.B.J. Sebek, 2005: A farm level approach to define successful mitigation strategies for GHG emissions from ruminant livestock systems. Nutrient Cycling in Agroecosystems, 71, pp. 163-175.
Schlesinger, W.H., 1999: Carbon sequestration in soils. Science, 284, pp. 2095
Schmidely, P., 1993: Quantitative review on the use of anabolic hormones in ruminants for meat production. I. Animal performance. Annales de Zootechie, 42, pp. 333-359.
Schnabel, R.R., A.J. Franzluebbers, W.L. Stout, M.A. Sanderson, and J.A. Stuedemann, 2001: The effects of pasture management practices. In The Potential of U.S. Grazing Lands to Sequester Carbon and Mitigate the Greenhouse Effect R.F. Follett, J.M. Kimble, and R. Lal (eds.), Lewis Publishers, Boca Raton, Florida, pp. 291-322.
Schneider, U.A. and B.A. McCarl, 2003: Economic potential of biomass based fuels for greenhouse gas emission mitigation. Environmental and Resource Economics, 24, pp. 291-312.
Scholes, R.J. and M.R. van der Merwe, 1996: Sequestration of carbon in savannas and woodlands. The Environmental Professional, 18, pp. 96-103.
Scholes, R.J. and R. Biggs, 2004: Ecosystem services in southern Africa: a regional assessment. CSIR, Pretoria.
Schuman, G.E., J.E. Herrick, and H.H. Janzen, 2001: The dynamics of soil carbon in rangelands. In The Potential of U.S. Grazing Lands to Sequester Carbon and Mitigate the Greenhouse Effect, R.F. Follett, J.M. Kimble, and R. Lal (eds.), Lewis Publishers, Boca Raton, Florida, pp. 267-290.
Sheehan, J., A. Aden, K. Paustian, K. Killian, J. Brenner, M. Walsh, and R. Nelson, 2004: Energy and environmental aspects of using corn stover for fuel ethanol. Journal of Industrial Ecology, 7, pp. 117-146.
Sims, R.E.H., A. Hastings, B. Schlamadinger, G. Taylor, and P. Smith, 2006: Energy crops: current status and future prospects. Global Change Biology, 12, pp. 1-23.
Sisti, C.P.J., H.P. Santos, R. Kohhann, B.J.R. Alves, S. Urquiaga, and R.M. Boddey, 2004: Change in carbon and nitrogen stocks in soil under 13 years of conventional or zero tillage in southern Brazil. Soil and Tillage Research, 76, pp. 39-58.
Six, J., S.M. Ogle, F.J. Breidt, R.T. Conant, A.R. Mosier, and K. Paustian, 2004: The potential to mitigate global warming with no-tillage management is only realized when practised in the long term. Global Change Biology, 10, pp.155-160.
Sleutel, S., 2005: Carbon Sequestration in Cropland Soils: Recent Evolution and Potential of Alternative Management Options. PhD. thesis, Ghent University, Ghent, Belgium.
Smeets, E.M.W., A.P.C. Faaij, I.M. Lewandowski, and W.C. Turkenburg, 2007: A bottom up quickscan and review of global bio-energy potentials to 2050. Progress in Energy and Combustion Science, 33, pp. 56-106.
Smith, J.U., P. Smith, M. Wattenbach, S. Zaehle, R. Hiederer, R.J.A. Jones, L. Montanarella, M.D.A. Rounsevell, I. Reginster, and F. Ewert, 2005b: Projected changes in mineral soil carbon of European croplands and grasslands, 1990-2080. Global Change Biology, 11, pp. 2141-2152.
Smith, K.A. and F. Conen, 2004: Impacts of land management on fluxes of trace greenhouse gases. Soil Use and Management, 20, pp. 255-263.
Smith, P., 2004a: Carbon sequestration in croplands: the potential in Europe and the global context. European Journal of Agronomy, 20, pp. 229-236.
Smith, P., 2004b: Engineered biological sinks on land. In The Global Carbon Cycle. Integrating humans, climate, and the natural world, C.B. Field and M.R. Raupach (eds.). SCOPE 62, Island Press, Washington D.C., pp. 479-491.
Smith, P., 2004c: Monitoring and verification of soil carbon changes under Article 3.4 of the Kyoto Protocol. Soil Use and Management, 20, pp. 264-270.
Smith, P., D. Martino, Z. Cai, D. Gwary, H.H. Janzen, P. Kumar, B. McCarl, S. Ogle, F. O’Mara, C. Rice, R.J. Scholes, O. Sirotenko, M. Howden, T. McAllister, G. Pan, V. Romanenkov, U. Schneider, S. Towprayoon, M. Wattenbach, and J.U. Smith, 2007a: Greenhouse gas mitigation in agriculture. Philosophical Transactions of the Royal Society, B., 363. doi:10.1098/rstb.2007.2184.
Smith, P., D. Martino, Z. Cai, D. Gwary, H.H. Janzen, P. Kumar, B.A. McCarl, S.M. Ogle, F. O’Mara, C. Rice, R.J. Scholes, O. Sirotenko, M. Howden, T. McAllister, G. Pan, V. Romanenkov, U.A. Schneider, and S. Towprayoon, 2007b: Policy and technological constraints to implementation of greenhouse gas mitigation options in agriculture. Agriculture, Ecosystems and Environment, 118, pp. 6-28.
Smith, P., D.S. Powlson, J.U. Smith, P.D. Falloon, and K. Coleman, 2000: Meeting Europe’s climate change commitments: quantitative estimates of the potential for carbon mitigation by agriculture. Global Change Biology, 6, pp. 525-539.
Smith, P., D.S. Powlson, M.J. Glendining, and J.U. Smith, 1997: Potential for carbon sequestration in European soils: preliminary estimates for five scenarios using results from long-term experiments. Global Change Biology, 3, pp. 67-79.
Smith, P., K.W. Goulding, K.A. Smith, D.S. Powlson, J.U. Smith, P.D. Falloon, and K. Coleman, 2001: Enhancing the carbon sink in European agricultural soils: Including trace gas fluxes in estimates of carbon mitigation potential. Nutrient Cycling in Agroecosystems, 60, pp. 237-252.
Smith, P., O. Andrén, T. Karlsson, P. Perälä, K. Regina, M. Rounsevell, and B. Van Wesemael, 2005a: Carbon sequestration potential in European croplands has been overestimated. Global Change Biology, 11, pp. 2153-2163.
Smith, S.J. and T.M.L. Wigley, 2006: Multi-Gas Forcing Stabilization with the MiniCAM. Multi-Greenhouse Gas Mitigation and Climate Policy, Energy Journal, Special Issue #3. Available at: <http://www.iaee.org/en/publications/journal.aspx> accessed 26 March 2007.
Soliva, C.R., J. Takahashi, and M. Kreuzer (eds.), 2006: Greenhouse Gases and Animal Agriculture: An Update. International Congress Series No. 1293, Elsevier, The Netherlands, 377 pp.
Soussana, J.-F., P. Loiseau, N. Viuchard, E. Ceschia, J. Balesdent, T. Chevallier, and D. Arrouays, 2004: Carbon cycling and sequestration opportunities in temperate grasslands. Soil Use and Management, 20, pp. 219-230.
South Africa, 1988: Fire Act. Government Printer, Pretoria, South Africa.Spatari, S., Y. Zhang, and H.L. Maclean, 2005: Life cycle assessment of
switchgrass- and corn stover-derived ethanol-fueled automobiles. Environmental Science and Technology, 39, pp. 9750-9758.
Sperow, M., M. Eve, and K. Paustian, 2003: Potential soil C sequestration on U.S. agricultural soils. Climatic Change, 57, pp. 319-339.
Squires, V., E.P. Glenn, and A.T. Ayoub, 1995: Combating Global Climate Change by Combating Land Degradation. Proceedings of Workshop in Nairobi, 4-8 Sept. 1995. UNEP, Nairobi, Kenya. 348 pp.

540
Agriculture Chapter8
Strengers, B., R. Leemans, B. Eickhout, B. de Vries, and L. Bouwman, 2004: The land-use projections and resulting emissions in the IPCC SRES scenarios as simulated by the IMAGE 2.2 model. GeoJournal, 61, pp. 381-393.
Tate, K.R., D.J. Ross, N.A. Scott, N.J. Rodda, J.A. Townsend, and G.C. Arnold, 2006: Post-harvest patterns of carbon dioxide production, methane uptake and nitrous oxide production in a Pinus radiata D. Don plantation. Forest Ecology and Management, 228, pp. 40-50.
Tejo, P., 2004: Public Policies and Agriculture in Latin America During the 2000’s. CEPAL (Comisión Económica para América Latina), Serie Desarrollo Productivo 152 (in Spanish), Santiago, Chile, 74 pp.
Tilman, D., J. Fargione, B. Wolff, C. D’Antonio, A. Dobson, R. Howarth, D. Schindler, W.H. Schlesinger, D. Simberloff, and D. Swackhamer, 2001: Forecasting agriculturally driven global environmental change. Science, 292, pp. 281-284.
Torbert, H.A., S.A. Prior, H.H. Hogers, and C.W. Wood, 2000: Review of elevated atmospheric CO2 effects on agro-ecosystems: residue decomposition processes and soil C storage. Plant and Soil, 224, pp. 59-73.
Totten, M., S.I. Pandya, and T. Janson-Smith, 2003: Biodiversity, climate, and the Kyoto Protocol: risks and opportunities. Frontiers in Ecology and Environment, 1, pp. 262-270.
Trewavas, A., 2002: Malthus foiled again and again. Nature, 418, pp. 668-670.
Unkovich, M., 2003: Water use, competition, and crop production in low rainfall, alley farming systems of south-eastern Australia. Australian Journal of Agricultural Research, 54, pp. 751-762.
USCCSP, 2006: Scenarios of Greenhouse Gas Emissions and Atmospheric Concentrations. Report by the U.S. Climate Change Science Program and approved by the Climate Change Science Program Product Development Advisory Committee. Clarke, L., J. Edmonds, J. Jacoby, H. Pitcher, J. Reilly, R. Richels (eds.), U.S. Climate Change Science Program.
US-EPA, 2005: Greenhouse Gas Mitigation Potential in U.S. Forestry and Agriculture. United States Environmental Protection Agency, EPA 430-R-05-006, November 2005. Washington, D.C., <http://epa.gov/sequestration/pdf/ghg_part2.pdf> accessed 26 March 2007.
US-EPA, 2006a: Global Anthropogenic Non-CO2 Greenhouse Gas Emissions: 19902020. United States Environmental Protection Agency, EPA 430-R-06-003, June 2006. Washington, D.C., < http://www.epa.gov/nonco2/econ-inv/downloads/GlobalAnthroEmissionsReport.pdf > accessed 26 March 2007.
US-EPA, 2006b: Global Mitigation of Non-CO2 Greenhouse Gases. United States Environmental Protection Agency, EPA 430-R-06-005, Washington, D.C. < http://www.epa.gov/nonco2/econ-inv/downloads/GlobalMitigationFullReport.pdf > accessed 26 March 2007.
Van Groenigen, K.J., A. Gorissen, J. Six, D. Harris, P.J. Kuikman, J.W. van Groenigen, and C. van Kessel, 2005: Decomposition of 14C-labeled roots in a pasture soil exposed to 10 years of elevated CO2. Soil Biology and Biochemistry, 37, pp. 497-506.
Van Nevel, C.J. and D.I. Demeyer, 1995: Lipolysis and biohydrogenation of soybean oil in the rumen in vitro: Inhibition by antimicrobials. Journal of Dairy Science, 78, pp. 2797-2806.
Van Nevel, C.J. and D.I. Demeyer, 1996: Influence of antibiotics and a deaminase inhibitor on volatile fatty acids and methane production from detergent washed hay and soluble starch by rumen microbes in vitro. Animal Feed Science and Technology, 37, pp. 21-31.
Van Oost, K., G. Govers, T.A., Quine, and G. Heckrath, 2004: Comment on ‘Managing soil carbon’ (I). Science, 305, 1567 pp.
Van Wilgen, B.W., N. Govender, H.C. Biggs, D. Ntsala, and X.N. Funda, 2004: Response of savanna fire regimes to changing fire-management policies in a large African National Park. Conservation Biology, 18, pp. 1533-1540.
Venkataraman, C., G. Habib, A. Eiguren-Fernandez, A.H. Miguel, and S.K. Friedlander, 2005: Residential biofuels in south Asia: carbonaceous aerosol emissions and climate impacts. Science, 307, pp. 1454-1456.
Viner, D., M. Sayer, M. Uyarra, and N. Hodgson, 2006: Climate Change and the European Countryside: Impacts on Land Management and Response Strategies. Report prepared for the Country Land and
Business Association, UK. Publ., CLA, UK, 180 pp.Waghorn, G.C., M.H. Tavendale, and D.R. Woodfield, 2002:
Methanogenesis from forages fed to sheep. Proceedings of New Zealand Society of Animal Production, 64, pp. 161-171.
Wallace, R.J., T.A. Wood, A. Rowe, J. Price, D.R. Yanez, S.P. Williams, and C.J. Newbold, 2006: Encapsulated fumaric acid as a means of decreasing ruminal methane emissions. In Greenhouse Gases and Animal Agriculture: An Update. Soliva, C.R., J. Takahashi and M. Kreuzer (eds.), International Congress Series No. 1293, Elsevier, The Netherlands, pp. 148-151.
Wander, M. and T. Nissen, 2004: Value of soil organic carbon in agricultural lands. Mitigation and Adaptation Strategies for Global Change, 9, pp. 417-431.
Wang, B., H. Neue, and H. Samonte, 1997: Effect of cultivar difference on methane emissions. Agriculture, Ecosystems and Environment, 62, pp. 31-40.
Wang, M.X. and X.J. Shangguan, 1996: CH4 emission from various rice fields in PR China. Theoretical and Applied Climatology, 55, pp. 129-138.
Wassmann, R., R.S. Lantin, H.U. Neue, L.V. Buendia, T.M. Corton, and Y. Lu, 2000: Characterization of methane emissions from rice fields in Asia. III. Mitigation options and future research needs. Nutrient Cycling Agroecosystems, 58, pp. 23-36.
West, T.O. and G. Marland, 2003: Net carbon flux from agriculture: Carbon emissions, carbon sequestration, crop yield, and land-use change. Biogeochemistry, 63, pp. 73-83.
West, T.O. and W.M. Post, 2002: Soil organic carbon sequestration rates by tillage and crop rotation: A global data analysis. Soil Science Society of America Journal, 66, pp. 1930-1946.
Wolin, E.A., R.S. Wolf, and M.J. Wolin, 1964: Microbial formation of methane. Journal of Bacteriology, 87, pp. 993-998.
Woodward, S.L., G.C. Waghorn, M.J. Ulyatt, and K.R. Lassey, 2001: Early indications that feeding Lotus will reduce methane emissions in ruminants. Proceedings of the New Zealand Society of Animal Production, 61, pp. 23-26.
World Bank, 2003: World Development Indicators [CD-ROM]. The World Bank, Washington, D.C..
World Bank, 2005: India Development Strategy Paper 2005-2008. The World Bank, Washington D.C..
Wright, A.D.G., P. Kennedy, C.J. O’Neill, A.F. Troovey, S. Popovski, S.M. Rea, C.L. Pimm, and L. Klein. 2004: Reducing methane emissions in sheep by immunization against rumen methanogens. Vaccine, 22, pp. 3976-3985.
Xiang, C.G, P.J. Zhang, G.X. Pan, D.S. Qiu, and Q.H. Chu, 2006: Changes in diversity, protein content, and amino acid composition of earthworms from a paddy soil under different long-term fertilizations in the Tai Lake Region, China. Acta Ecologica Sinica, 26(6), pp. 1667-1674.
Xu, H., Z.C. Cai, and H. Tsuruta, 2003: Soil moisture between rice-growing seasons affects methane emission, production, and oxidation. Soil Science Society of America Journal, 67, pp. 1147-1157.
Xu, H., Z.C. Cai, Z.J. Jia, and H. Tsuruta, 2000: Effect of land management in winter crop season on CH4 emission during the following flooded and rice-growing period. Nutrient Cycling in Agroecosystems, 58, pp. 327-332.
Xu, S., X. Hao, K. Stanford, T. McAllister, F.J. Larney, and J. Wang, 2007: Greenhouse gas emissions during co-composting of cattle mortalities with manure. Nutrient Cycling in Agroecosystems, 78, 177-187.
Yagi, K., H. Tsuruta, and K. Minami, 1997: Possible options for mitigating methane emission from rice cultivation. Nutrient Cycling in Agroecosystems, 49, pp. 213-220.
Yan, T., R.E. Agnew, F.J. Gordon, and M.G. Porter, 2000: Prediction of methane energy output in dairy and beef cattle offered grass silage-based diets. Livestock Production Science, 64, pp. 253-263.
Yan, X., T. Ohara, and H. Akimoto, 2003: Development of region-specific emission factors and estimation of methane emission from rice field in East, Southeast and South Asian countries. Global Change Biology, 9, pp. 237-254.