Embed Size (px)
Citation preview
Ljubljana, May 2014
Agriculture in Slovenia
and in the rest of the EU
Ljubljana, May 2014
Original title: O kmetijstvu doma in drugje po EUAuthors: Aleš Stele and Irena ŽaucerTranslated by Boris Panič
Cover photo: Ministry of Agriculture and the Environment The publication is available at http://www.stat.si/eng/pub_brosure.aspInformation provided by the Information Centre:Phone: +386 1 241 64 04E-mail: [email protected]
Issued, published and printed by the Statistical Office of the Republic of Slovenia, Ljubljana, Litostrojska cesta 54 – © SURS – Use and publication of data is allowed provided the source is acknowledged – Printed in 60 copies - ISBN 978-961-239-296-3
CIP - Kataložni zapis o publikaciji Narodna in univerzitetna knjižnica, Ljubljana
63(497.4)(0.034.2) 061.1EU:63(0.034.2) 311:63(497.4)(0.034.2)
STELE, Aleš Agriculture in Slovenia and in the rest of the EU [Elektronski vir] / [authors Aleš Stele, Irena Žaucer ; translated by Boris Panič]. - El. knjiga. - Ljubljana : Statistical Office of the Republic of Slovenia, 2014
ISBN 978-961-239-296-3 (pdf) 1. Gl. stv. nasl. 273560832
AGRICULTURE IN SLOVENIA AND IN THE REST OF THE EU 3
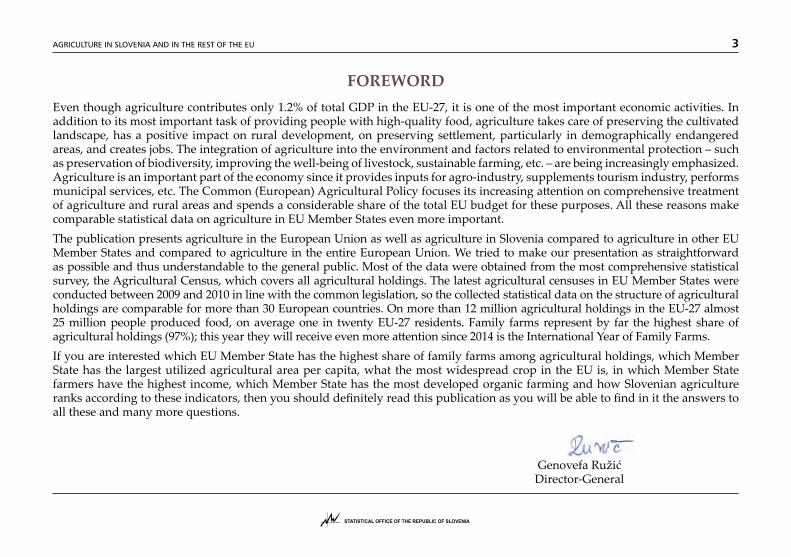
FOREWORDEven though agriculture contributes only 1.2% of total GDP in the EU-27, it is one of the most important economic activities. In addition to its most important task of providing people with high-quality food, agriculture takes care of preserving the cultivated landscape, has a positive impact on rural development, on preserving settlement, particularly in demographically endangered areas, and creates jobs. The integration of agriculture into the environment and factors related to environmental protection – such as preservation of biodiversity, improving the well-being of livestock, sustainable farming, etc. – are being increasingly emphasized. Agriculture is an important part of the economy since it provides inputs for agro-industry, supplements tourism industry, performs municipal services, etc. The Common (European) Agricultural Policy focuses its increasing attention on comprehensive treatment of agriculture and rural areas and spends a considerable share of the total EU budget for these purposes. All these reasons make comparable statistical data on agriculture in EU Member States even more important. The publication presents agriculture in the European Union as well as agriculture in Slovenia compared to agriculture in other EU Member States and compared to agriculture in the entire European Union. We tried to make our presentation as straightforward as possible and thus understandable to the general public. Most of the data were obtained from the most comprehensive statistical survey, the Agricultural Census, which covers all agricultural holdings. The latest agricultural censuses in EU Member States were conducted between 2009 and 2010 in line with the common legislation, so the collected statistical data on the structure of agricultural holdings are comparable for more than 30 European countries. On more than 12 million agricultural holdings in the EU-27 almost 25 million people produced food, on average one in twenty EU-27 residents. Family farms represent by far the highest share of agricultural holdings (97%); this year they will receive even more attention since 2014 is the International Year of Family Farms. If you are interested which EU Member State has the highest share of family farms among agricultural holdings, which Member State has the largest utilized agricultural area per capita, what the most widespread crop in the EU is, in which Member State farmers have the highest income, which Member State has the most developed organic farming and how Slovenian agriculture ranks according to these indicators, then you should definitely read this publication as you will be able to find in it the answers to all these and many more questions.
Genovefa Ružić Director-General
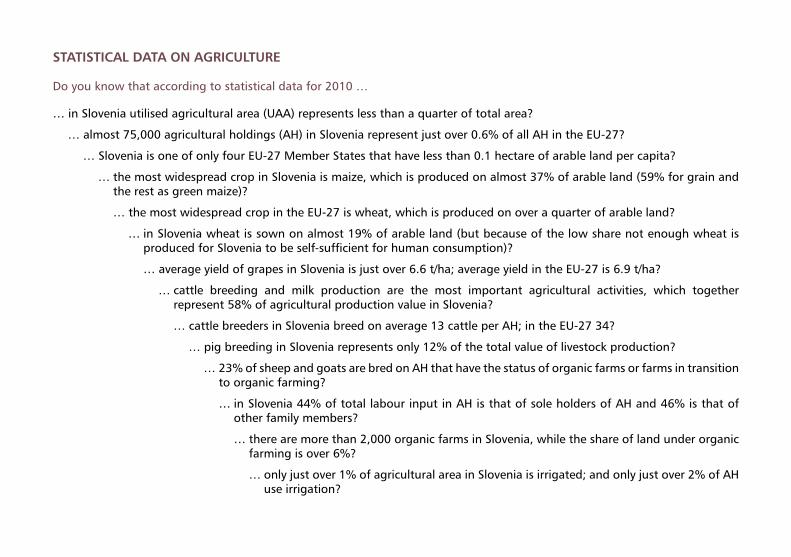
STATISTICAL DATA ON AGRICULTURE
Do you know that according to statistical data for 2010 …
… in Slovenia utilised agricultural area (UAA) represents less than a quarter of total area?
… almost 75,000 agricultural holdings (AH) in Slovenia represent just over 0.6% of all AH in the EU-27?
… Slovenia is one of only four EU-27 Member States that have less than 0.1 hectare of arable land per capita?
… the most widespread crop in Slovenia is maize, which is produced on almost 37% of arable land (59% for grain and the rest as green maize)?
… the most widespread crop in the EU-27 is wheat, which is produced on over a quarter of arable land?
… in Slovenia wheat is sown on almost 19% of arable land (but because of the low share not enough wheat is produced for Slovenia to be self-sufficient for human consumption)?
… average yield of grapes in Slovenia is just over 6.6 t/ha; average yield in the EU-27 is 6.9 t/ha?
… cattle breeding and milk production are the most important agricultural activities, which together represent 58% of agricultural production value in Slovenia?
… cattle breeders in Slovenia breed on average 13 cattle per AH; in the EU-27 34?
… pig breeding in Slovenia represents only 12% of the total value of livestock production?
… 23% of sheep and goats are bred on AH that have the status of organic farms or farms in transition to organic farming?
… in Slovenia 44% of total labour input in AH is that of sole holders of AH and 46% is that of other family members?
… there are more than 2,000 organic farms in Slovenia, while the share of land under organic farming is over 6%?
… only just over 1% of agricultural area in Slovenia is irrigated; and only just over 2% of AH use irrigation?
AGRICULTURE IN SLOVENIA AND IN THE REST OF THE EU 5
CONTENTS
1 AGRICULTURALHOLDINGSINTHEEU (GENERALOVERVIEW).......................................................... 7 1.1 Numberofagriculturalholdings(AH)........................... 8 1.2 Averagesizeofagriculturalholdingsbyutilised agriculturalarea(UAA)................................................. 9 1.3 Averagesizeofagriculturalholdingsbythenumber oflivestockunits(LSU).................................................. 11 1.4 Labourforceonagriculturalholdings........................... 13 1.5 Economicsizeofagriculturalholdings.......................... 16 1.6 Structureofagriculturaloutput.................................. 18 1.7 Standardoutputbymaintypesoffarming................... 19 1.8 Agriculturalholdingsbylegalstatus............................. 20
2 LAND ......................................................................... 21 2.1 ShareofUAAandforestintotalarea........................... 21 2.2 DetailedstructureofUAA............................................. 22 2.3 Arablelandandkitchengardens................................. 25 2.4 Permanentcrops........................................................... 27
3 CROPPRODUCTION.............................................................. 28 3.1 Cropoutputvalueasashareoftotal agriculturaloutput........................................................ 28 3.2 Yieldsofmaincrops...................................................... 29
4 LIVESTOCKPRODUCTION...................................................... 32 4.1 Livestockoutputvalueasashareoftotal agriculturaloutputvalue.............................................. 32 4.2 Sharesoflivestockbyspecies........................................ 33 4.3 SizestructureofAHwithlivestock................................ 34
5 REGULARLABOURFORCEONAGRICULTURALHOLDINGS..... 39 5.1 Numberofpersonsworkingregularlyonagricultural holdings........................................................................ 39 5.2 Womeninregularlabourforceonagricultural holdings........................................................................ 40 5.3 Labourinputonagriculturalholdings(AWU)............... 41 5.4 AgeandeducationalstructureofmanagersofAH...... 43 5.5 Factorincomeperemployeeinagriculture................... 44 5.6 Subsidiesinagriculture................................................. 45
6 ORGANICAGRICULTURE...................................................... 46 6.1 Numberofagriculturalholdingswithorganic farming......................................................................... 46 6.2 OrganicareaintotalUAA............................................. 47 6.3 Organiclivestockproduction........................................ 48
7 PRODUCTIONMETHODS....................................................... 49 7.1 Grazingonagriculturalholdings................................... 49 7.2 Irrigation...................................................................... 50
8 AGRICULTURALMACHINERY–TRACTORS............................. 51 8.1 Numberofowntractors............................................... 51 8.2 Agriculturalholdingsusingowntractorsand agriculturalholdingsusingsharedtractors.................. 52
9 GROSSFIXEDCAPITALFORMATION...................................... 53
10ENVIRONMENTALASPECTS................................................... 54 10.1Useofmineralfertilisers............................................... 54 10.2Greenhousegasemissionsfromagriculture................. 55
11INTERMEDIATECONSUMPTION............................................ 56
AGRICULTURE IN SLOVENIA AND IN THE REST OF THE EU6
AH agricultural holdingAWU annual work unit (1,800 working hours per year)EUR euroFI factor incomeGDP gross domestic productGFCF gross fixed capital formationGVA gross value addedLSU livestock size unitSO standard outputUAA utilised agricultural area
% percentha hectarekg kilogramm2 square metremio. milliont ton
Agriculture and fisheries. Statistics Database. Luxembourg: European Commission, EUROSTAT. Retrieved on 8. 3. 2013 from the website:http://epp.eurostat.ec.europa.eu/portal/page/portal/statistics/themes Agriculture. Statistics Database. Luxembourg: European Commission, EUROSTAT. Retrieved on 8. 3. 2013 from the website:http://epp.eurostat.ec.europa.eu/portal/page/portal/agriculture/introduction Organic farming. Statistics Database. Luxembourg: European Commission, EUROSTAT. Retrieved on 8. 3. 2013 from the website:http://epp.eurostat.ec.europa.eu/portal/page/portal/organic_farming/introduction Agri-Environmental Indicators. Statistics Database. Luxembourg: European Commission, EUROSTAT. Retrieved on 8. 3. 2013 from the website:http://epp.eurostat.ec.europa.eu/portal/page/portal/agri_environmental_indicators/introduction
ABBREVIATIONS AND UNITS OF MEASUREMENT
SOURCES AND LITERATURE
LIST OF COUNTRIES AND THEIR ABBREVIATIONS
Abbrevia- tion Country Abbrevia-
tion Country
EU-27 27 EU Member States IT ItalyAT Austria LT LithuaniaBE Belgium LU LuxembourgBG Bulgaria LV LatviaCY Cyprus MT MaltaCZ Czech Republic NL Netherlands DE Germany PL PolandDK Denmark PT PortugalEE Estonia RO RomaniaEL Greece SE SwedenES Spain SI SloveniaFI Finland SK SlovakiaFR France UK United KingdomHU HungaryIE Ireland HR Croatia
AGRICULTURE IN SLOVENIA AND IN THE REST OF THE EU 7
1 AGRICULTURAL HOLDINGS IN THE EU (GENERAL OVERVIEW)
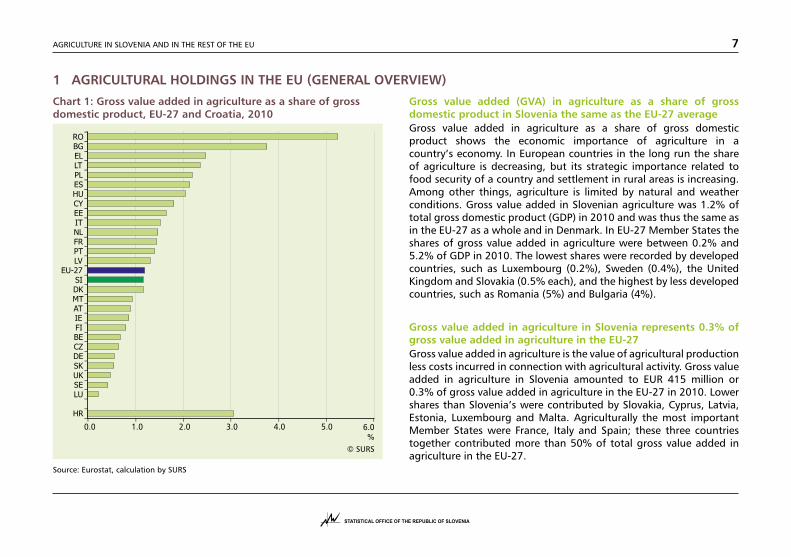
Chart 1: Gross value added in agriculture as a share of gross domestic product, EU-27 and Croatia, 2010
Source: Eurostat, calculation by SURS
Gross value added (GVA) in agriculture as a share of gross domestic product in Slovenia the same as the EU-27 averageGross value added in agriculture as a share of gross domestic product shows the economic importance of agriculture in a country’s economy. In European countries in the long run the share of agriculture is decreasing, but its strategic importance related to food security of a country and settlement in rural areas is increasing. Among other things, agriculture is limited by natural and weather conditions. Gross value added in Slovenian agriculture was 1.2% of total gross domestic product (GDP) in 2010 and was thus the same as in the EU-27 as a whole and in Denmark. In EU-27 Member States the shares of gross value added in agriculture were between 0.2% and 5.2% of GDP in 2010. The lowest shares were recorded by developed countries, such as Luxembourg (0.2%), Sweden (0.4%), the United Kingdom and Slovakia (0.5% each), and the highest by less developed countries, such as Romania (5%) and Bulgaria (4%).
Gross value added in agriculture in Slovenia represents 0.3% of gross value added in agriculture in the EU-27Gross value added in agriculture is the value of agricultural production less costs incurred in connection with agricultural activity. Gross value added in agriculture in Slovenia amounted to EUR 415 million or 0.3% of gross value added in agriculture in the EU-27 in 2010. Lower shares than Slovenia’s were contributed by Slovakia, Cyprus, Latvia, Estonia, Luxembourg and Malta. Agriculturally the most important Member States were France, Italy and Spain; these three countries together contributed more than 50% of total gross value added in agriculture in the EU-27.
AGRICULTURAL HOLDINGS IN THE EU (GENERAL OVERVIEW) 8 AGRICULTURE IN SLOVENIA AND IN THE REST OF THE EU
1.1 Number of agricultural holdings (AH)
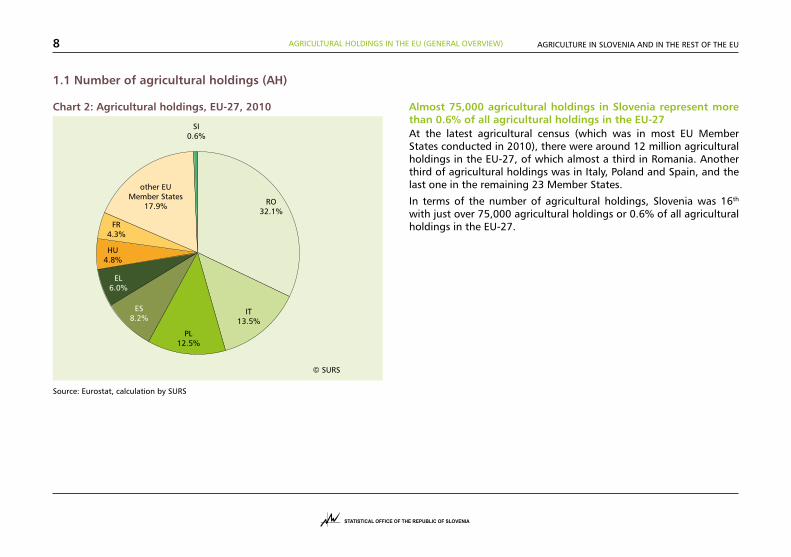
Almost 75,000 agricultural holdings in Slovenia represent more than 0.6% of all agricultural holdings in the EU-27 At the latest agricultural census (which was in most EU Member States conducted in 2010), there were around 12 million agricultural holdings in the EU-27, of which almost a third in Romania. Another third of agricultural holdings was in Italy, Poland and Spain, and the last one in the remaining 23 Member States.
In terms of the number of agricultural holdings, Slovenia was 16th with just over 75,000 agricultural holdings or 0.6% of all agricultural holdings in the EU-27.
Chart 2: Agricultural holdings, EU-27, 2010
Source: Eurostat, calculation by SURS
AGRICULTURAL HOLDINGS IN THE EU (GENERAL OVERVIEW) 9AGRICULTURE IN SLOVENIA AND IN THE REST OF THE EU
1.2 Average size of agricultural holdings by utilised agricultural area (UAA)
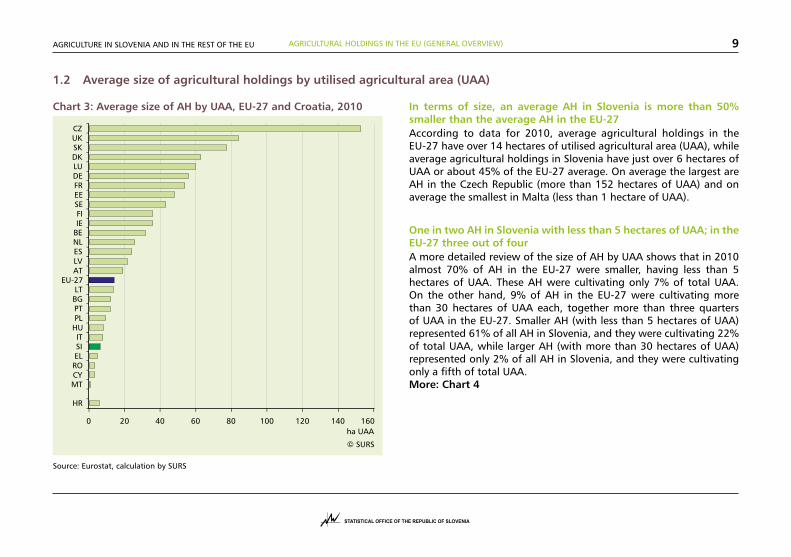
In terms of size, an average AH in Slovenia is more than 50% smaller than the average AH in the EU-27According to data for 2010, average agricultural holdings in the EU-27 have over 14 hectares of utilised agricultural area (UAA), while average agricultural holdings in Slovenia have just over 6 hectares of UAA or about 45% of the EU-27 average. On average the largest are AH in the Czech Republic (more than 152 hectares of UAA) and on average the smallest in Malta (less than 1 hectare of UAA).
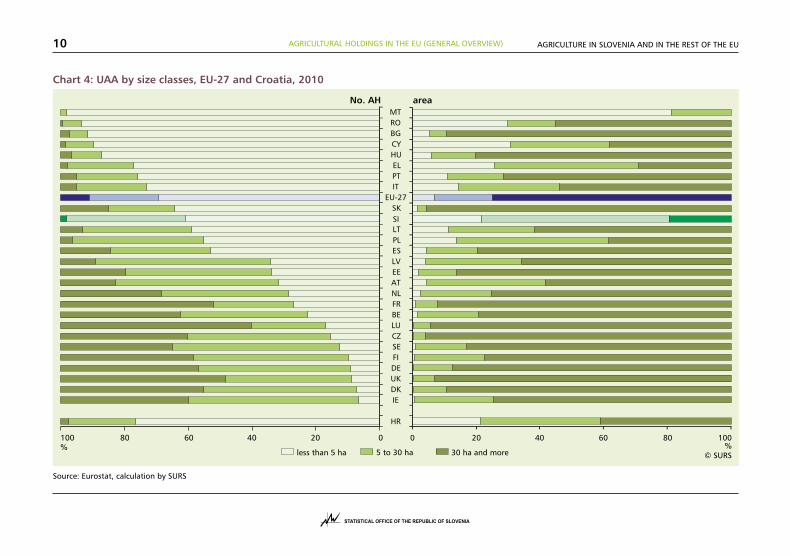
One in two AH in Slovenia with less than 5 hectares of UAA; in the EU-27 three out of four A more detailed review of the size of AH by UAA shows that in 2010 almost 70% of AH in the EU-27 were smaller, having less than 5 hectares of UAA. These AH were cultivating only 7% of total UAA. On the other hand, 9% of AH in the EU-27 were cultivating more than 30 hectares of UAA each, together more than three quarters of UAA in the EU-27. Smaller AH (with less than 5 hectares of UAA) represented 61% of all AH in Slovenia, and they were cultivating 22% of total UAA, while larger AH (with more than 30 hectares of UAA) represented only 2% of all AH in Slovenia, and they were cultivating only a fifth of total UAA. More: Chart 4
Chart 3: Average size of AH by UAA, EU-27 and Croatia, 2010
Source: Eurostat, calculation by SURS
AGRICULTURAL HOLDINGS IN THE EU (GENERAL OVERVIEW) 10 AGRICULTURE IN SLOVENIA AND IN THE REST OF THE EU
Chart 4: UAA by size classes, EU-27 and Croatia, 2010
Source: Eurostat, calculation by SURS
AGRICULTURAL HOLDINGS IN THE EU (GENERAL OVERVIEW) 11AGRICULTURE IN SLOVENIA AND IN THE REST OF THE EU
1.3 Average size of agricultural holdings by the number of livestock units (LSU)
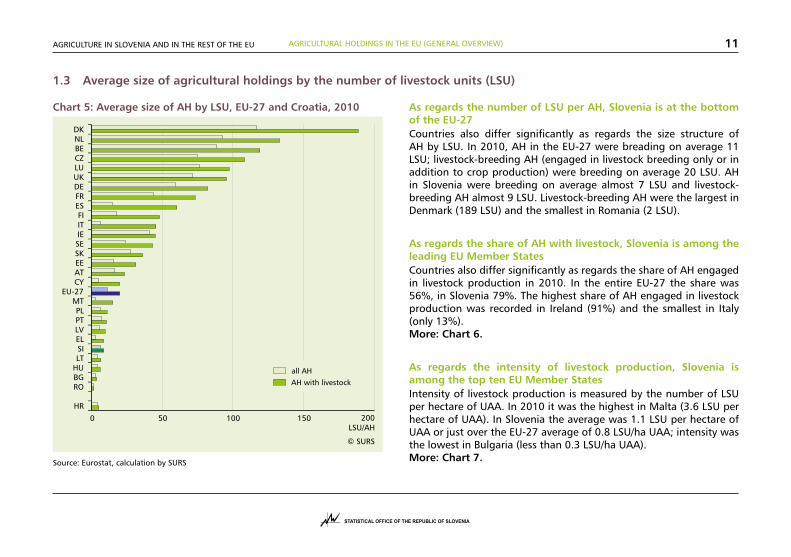
Chart 5: Average size of AH by LSU, EU-27 and Croatia, 2010
Source: Eurostat, calculation by SURS
As regards the number of LSU per AH, Slovenia is at the bottom of the EU-27 Countries also differ significantly as regards the size structure of AH by LSU. In 2010, AH in the EU-27 were breading on average 11 LSU; livestock-breeding AH (engaged in livestock breeding only or in addition to crop production) were breeding on average 20 LSU. AH in Slovenia were breeding on average almost 7 LSU and livestock-breeding AH almost 9 LSU. Livestock-breeding AH were the largest in Denmark (189 LSU) and the smallest in Romania (2 LSU).
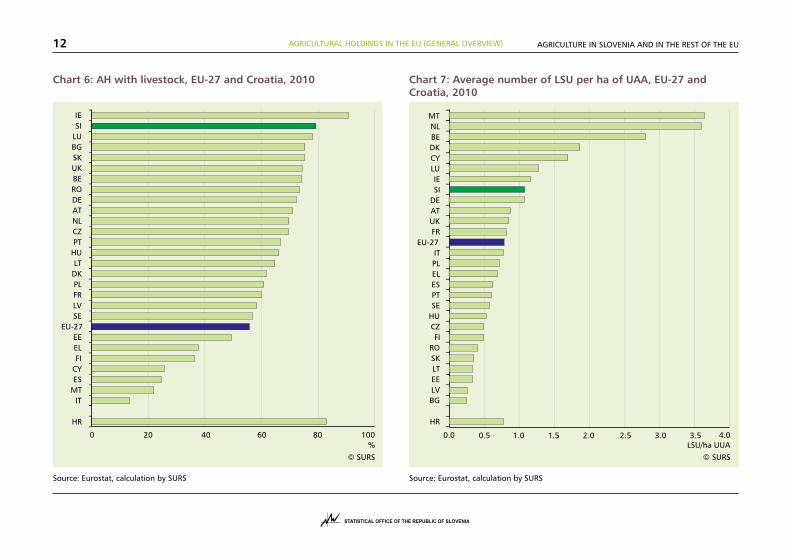
As regards the share of AH with livestock, Slovenia is among the leading EU Member States Countries also differ significantly as regards the share of AH engaged in livestock production in 2010. In the entire EU-27 the share was 56%, in Slovenia 79%. The highest share of AH engaged in livestock production was recorded in Ireland (91%) and the smallest in Italy (only 13%). More: Chart 6.
As regards the intensity of livestock production, Slovenia is among the top ten EU Member States Intensity of livestock production is measured by the number of LSU per hectare of UAA. In 2010 it was the highest in Malta (3.6 LSU per hectare of UAA). In Slovenia the average was 1.1 LSU per hectare of UAA or just over the EU-27 average of 0.8 LSU/ha UAA; intensity was the lowest in Bulgaria (less than 0.3 LSU/ha UAA). More: Chart 7.
AGRICULTURAL HOLDINGS IN THE EU (GENERAL OVERVIEW) 12 AGRICULTURE IN SLOVENIA AND IN THE REST OF THE EU
Chart 6: AH with livestock, EU-27 and Croatia, 2010
Source: Eurostat, calculation by SURS
Chart 7: Average number of LSU per ha of UAA, EU-27 and Croatia, 2010
Source: Eurostat, calculation by SURS
AGRICULTURAL HOLDINGS IN THE EU (GENERAL OVERVIEW) 13AGRICULTURE IN SLOVENIA AND IN THE REST OF THE EU
1.4 Labour force on agricultural holdings
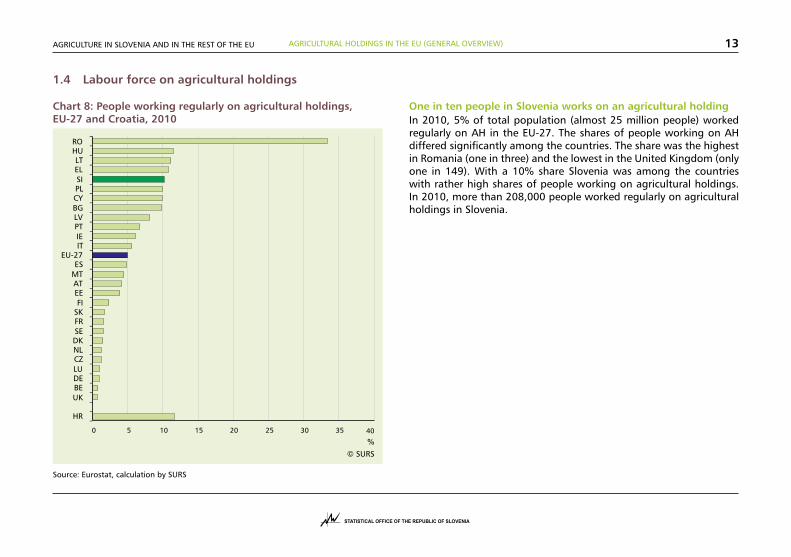
Chart 8: People working regularly on agricultural holdings, EU-27 and Croatia, 2010
Source: Eurostat, calculation by SURS
One in ten people in Slovenia works on an agricultural holding In 2010, 5% of total population (almost 25 million people) worked regularly on AH in the EU-27. The shares of people working on AH differed significantly among the countries. The share was the highest in Romania (one in three) and the lowest in the United Kingdom (only one in 149). With a 10% share Slovenia was among the countries with rather high shares of people working on agricultural holdings. In 2010, more than 208,000 people worked regularly on agricultural holdings in Slovenia.
AGRICULTURAL HOLDINGS IN THE EU (GENERAL OVERVIEW) 14 AGRICULTURE IN SLOVENIA AND IN THE REST OF THE EU
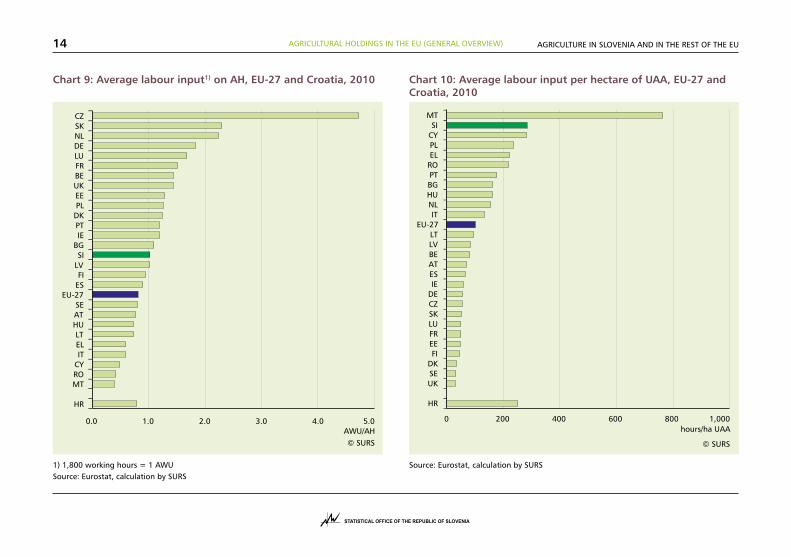
Chart 9: Average labour input1) on AH, EU-27 and Croatia, 2010
1) 1,800 working hours = 1 AWUSource: Eurostat, calculation by SURS
Chart 10: Average labour input per hectare of UAA, EU-27 and Croatia, 2010
Source: Eurostat, calculation by SURS
AGRICULTURAL HOLDINGS IN THE EU (GENERAL OVERVIEW) 15AGRICULTURE IN SLOVENIA AND IN THE REST OF THE EU
Total annual labour input on AH in Slovenia larger than the EU-27 averageTotal annual labour input on all AH in the EU-27 in 2010 was 9.8 million AWU. Average annual labour input per one AH in the EU-27 was 0.8 AWU or almost 1,500 hours. In Slovenia it was slightly higher: more than 1 AWU (or 1,848 hours) per AH. The highest average annual labour input per AH was recorded in the Czech Republic (4.7 AWU), but this country had the largest agricultural holdings. The lowest value was recorded in Malta (0.4 AWU); however, agricultural holdings in Malta were also the smallest in the EU.
Farmers in Slovenia spend on average more hours cultivating 1 hectare of UAA per year than farmers in the EU-27In addition to the size of the agricultural holding, the amount of work required by agricultural production depends on the farm type of the agricultural holding, equipment and natural conditions. For cultivating 1 hectare of UAA, farmers in the EU-27 spent on average 102 hours per year (from 766 hours in Malta to only 31 hours in the United Kingdom); farmers in Slovenia spent on average 286 hours per year.
AGRICULTURAL HOLDINGS IN THE EU (GENERAL OVERVIEW) 16 AGRICULTURE IN SLOVENIA AND IN THE REST OF THE EU
1.5 Economic size of agricultural holdings
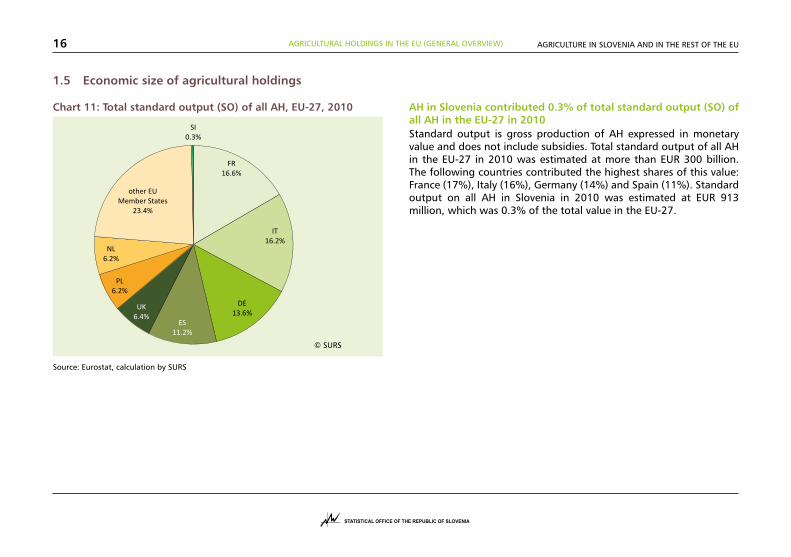
Chart 11: Total standard output (SO) of all AH, EU-27, 2010
Source: Eurostat, calculation by SURS
AH in Slovenia contributed 0.3% of total standard output (SO) of all AH in the EU-27 in 2010Standard output is gross production of AH expressed in monetary value and does not include subsidies. Total standard output of all AH in the EU-27 in 2010 was estimated at more than EUR 300 billion. The following countries contributed the highest shares of this value: France (17%), Italy (16%), Germany (14%) and Spain (11%). Standard output on all AH in Slovenia in 2010 was estimated at EUR 913 million, which was 0.3% of the total value in the EU-27.
AGRICULTURAL HOLDINGS IN THE EU (GENERAL OVERVIEW) 17AGRICULTURE IN SLOVENIA AND IN THE REST OF THE EU
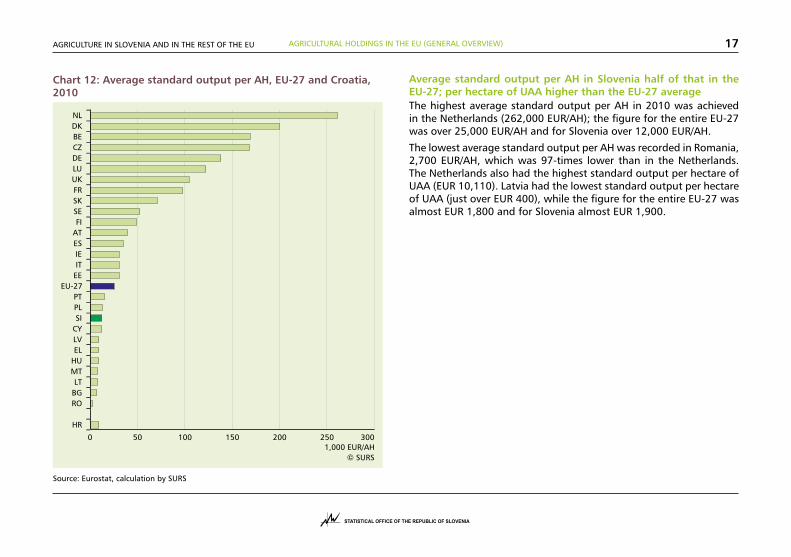
Chart 12: Average standard output per AH, EU-27 and Croatia, 2010
Source: Eurostat, calculation by SURS
Average standard output per AH in Slovenia half of that in the EU-27; per hectare of UAA higher than the EU-27 averageThe highest average standard output per AH in 2010 was achieved in the Netherlands (262,000 EUR/AH); the figure for the entire EU-27 was over 25,000 EUR/AH and for Slovenia over 12,000 EUR/AH.
The lowest average standard output per AH was recorded in Romania, 2,700 EUR/AH, which was 97-times lower than in the Netherlands. The Netherlands also had the highest standard output per hectare of UAA (EUR 10,110). Latvia had the lowest standard output per hectare of UAA (just over EUR 400), while the figure for the entire EU-27 was almost EUR 1,800 and for Slovenia almost EUR 1,900.
AGRICULTURAL HOLDINGS IN THE EU (GENERAL OVERVIEW) 18 AGRICULTURE IN SLOVENIA AND IN THE REST OF THE EU
1.6 Structure of agricultural output
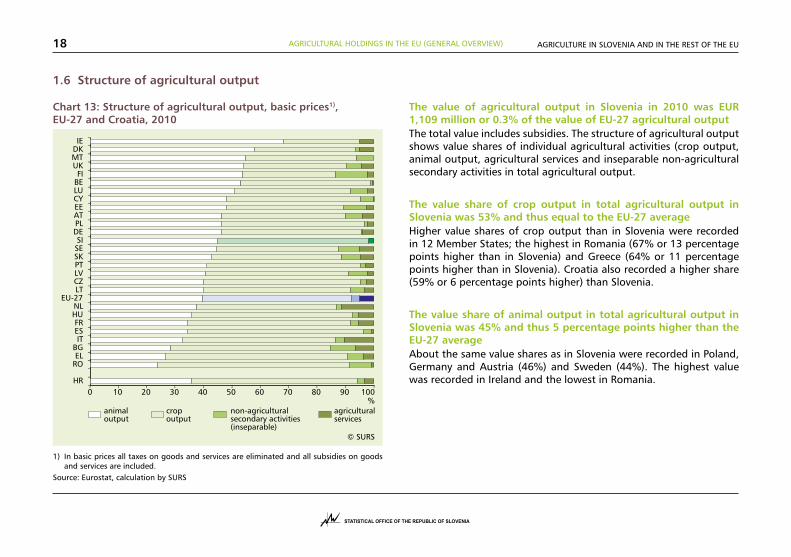
Chart 13: Structure of agricultural output, basic prices1), EU-27 and Croatia, 2010
1) In basic prices all taxes on goods and services are eliminated and all subsidies on goods and services are included.
Source: Eurostat, calculation by SURS
The value of agricultural output in Slovenia in 2010 was EUR 1,109 million or 0.3% of the value of EU-27 agricultural outputThe total value includes subsidies. The structure of agricultural output shows value shares of individual agricultural activities (crop output, animal output, agricultural services and inseparable non-agricultural secondary activities in total agricultural output.
The value share of crop output in total agricultural output in Slovenia was 53% and thus equal to the EU-27 averageHigher value shares of crop output than in Slovenia were recorded in 12 Member States; the highest in Romania (67% or 13 percentage points higher than in Slovenia) and Greece (64% or 11 percentage points higher than in Slovenia). Croatia also recorded a higher share (59% or 6 percentage points higher) than Slovenia.
The value share of animal output in total agricultural output in Slovenia was 45% and thus 5 percentage points higher than the EU-27 averageAbout the same value shares as in Slovenia were recorded in Poland, Germany and Austria (46%) and Sweden (44%). The highest value was recorded in Ireland and the lowest in Romania.
AGRICULTURAL HOLDINGS IN THE EU (GENERAL OVERVIEW) 19AGRICULTURE IN SLOVENIA AND IN THE REST OF THE EU
1.7 Standard output by main types of farming
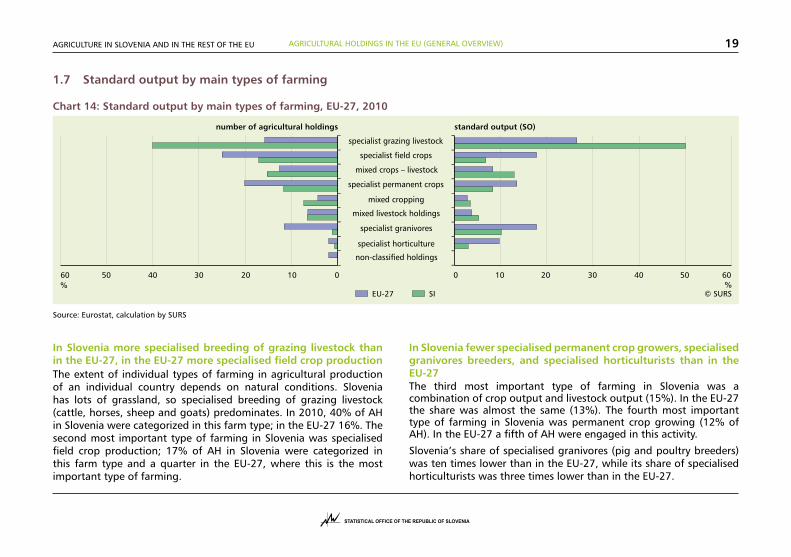
Chart 14: Standard output by main types of farming, EU-27, 2010
Source: Eurostat, calculation by SURS
In Slovenia fewer specialised permanent crop growers, specialised granivores breeders, and specialised horticulturists than in the EU-27 The third most important type of farming in Slovenia was a combination of crop output and livestock output (15%). In the EU-27 the share was almost the same (13%). The fourth most important type of farming in Slovenia was permanent crop growing (12% of AH). In the EU-27 a fifth of AH were engaged in this activity.
Slovenia’s share of specialised granivores (pig and poultry breeders) was ten times lower than in the EU-27, while its share of specialised horticulturists was three times lower than in the EU-27.
In Slovenia more specialised breeding of grazing livestock than in the EU-27, in the EU-27 more specialised field crop production The extent of individual types of farming in agricultural production of an individual country depends on natural conditions. Slovenia has lots of grassland, so specialised breeding of grazing livestock (cattle, horses, sheep and goats) predominates. In 2010, 40% of AH in Slovenia were categorized in this farm type; in the EU-27 16%. The second most important type of farming in Slovenia was specialised field crop production; 17% of AH in Slovenia were categorized in this farm type and a quarter in the EU-27, where this is the most important type of farming.
AGRICULTURAL HOLDINGS IN THE EU (GENERAL OVERVIEW) 20 AGRICULTURE IN SLOVENIA AND IN THE REST OF THE EU
1.8 Agricultural holdings by legal status
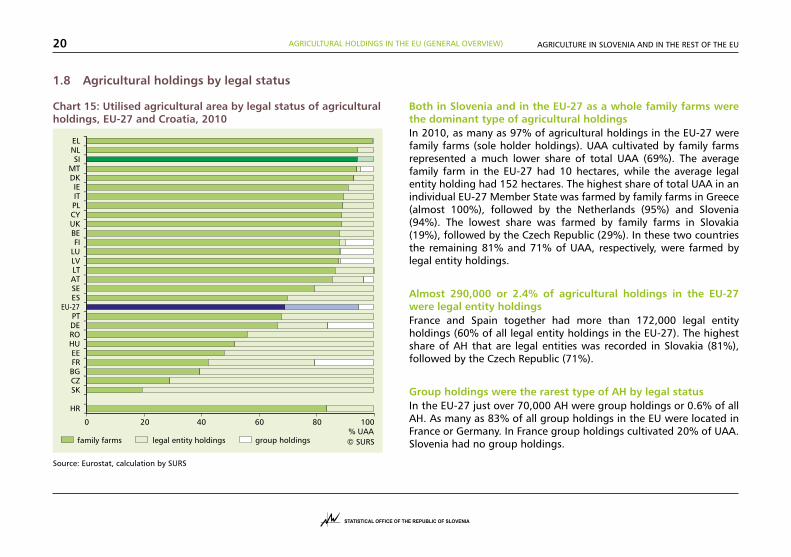
Both in Slovenia and in the EU-27 as a whole family farms were the dominant type of agricultural holdings In 2010, as many as 97% of agricultural holdings in the EU-27 were family farms (sole holder holdings). UAA cultivated by family farms represented a much lower share of total UAA (69%). The average family farm in the EU-27 had 10 hectares, while the average legal entity holding had 152 hectares. The highest share of total UAA in an individual EU-27 Member State was farmed by family farms in Greece (almost 100%), followed by the Netherlands (95%) and Slovenia (94%). The lowest share was farmed by family farms in Slovakia (19%), followed by the Czech Republic (29%). In these two countries the remaining 81% and 71% of UAA, respectively, were farmed by legal entity holdings.
Almost 290,000 or 2.4% of agricultural holdings in the EU-27 were legal entity holdingsFrance and Spain together had more than 172,000 legal entity holdings (60% of all legal entity holdings in the EU-27). The highest share of AH that are legal entities was recorded in Slovakia (81%), followed by the Czech Republic (71%).
Group holdings were the rarest type of AH by legal status In the EU-27 just over 70,000 AH were group holdings or 0.6% of all AH. As many as 83% of all group holdings in the EU were located in France or Germany. In France group holdings cultivated 20% of UAA. Slovenia had no group holdings.
Chart 15: Utilised agricultural area by legal status of agricultural holdings, EU-27 and Croatia, 2010
Source: Eurostat, calculation by SURS
AGRICULTURE IN SLOVENIA AND IN THE REST OF THE EU 21
2 LAND
2.1 Share of UAA and forest in total area
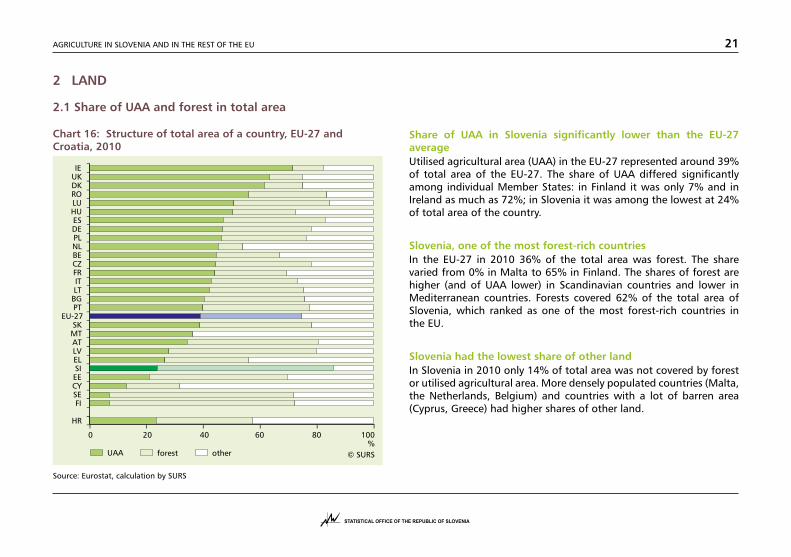
Chart 16: Structure of total area of a country, EU-27 and Croatia, 2010
Source: Eurostat, calculation by SURS
Share of UAA in Slovenia significantly lower than the EU-27 averageUtilised agricultural area (UAA) in the EU-27 represented around 39% of total area of the EU-27. The share of UAA differed significantly among individual Member States: in Finland it was only 7% and in Ireland as much as 72%; in Slovenia it was among the lowest at 24% of total area of the country.
Slovenia, one of the most forest-rich countries In the EU-27 in 2010 36% of the total area was forest. The share varied from 0% in Malta to 65% in Finland. The shares of forest are higher (and of UAA lower) in Scandinavian countries and lower in Mediterranean countries. Forests covered 62% of the total area of Slovenia, which ranked as one of the most forest-rich countries in the EU.
Slovenia had the lowest share of other landIn Slovenia in 2010 only 14% of total area was not covered by forest or utilised agricultural area. More densely populated countries (Malta, the Netherlands, Belgium) and countries with a lot of barren area (Cyprus, Greece) had higher shares of other land.
LAND22 AGRICULTURE IN SLOVENIA AND IN THE REST OF THE EU
2.2 Detailed structure of UAA
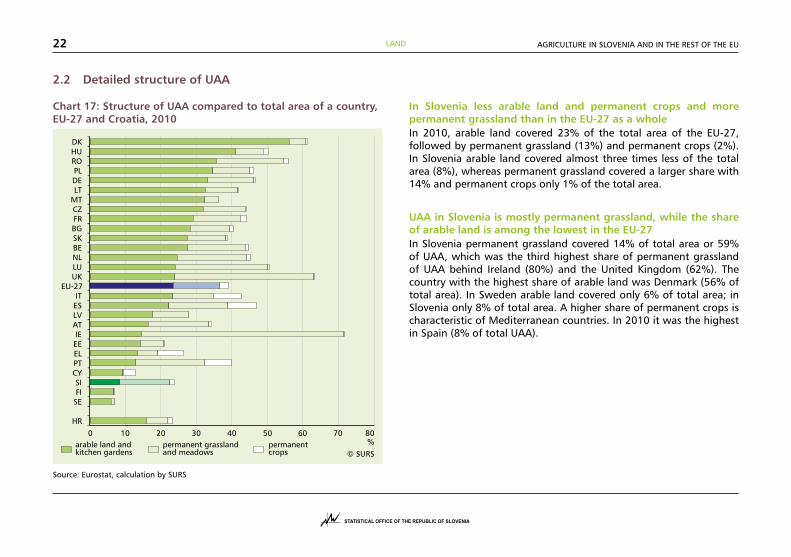
Chart 17: Structure of UAA compared to total area of a country, EU-27 and Croatia, 2010
Source: Eurostat, calculation by SURS
In Slovenia less arable land and permanent crops and more permanent grassland than in the EU-27 as a wholeIn 2010, arable land covered 23% of the total area of the EU-27, followed by permanent grassland (13%) and permanent crops (2%). In Slovenia arable land covered almost three times less of the total area (8%), whereas permanent grassland covered a larger share with 14% and permanent crops only 1% of the total area.
UAA in Slovenia is mostly permanent grassland, while the share of arable land is among the lowest in the EU-27In Slovenia permanent grassland covered 14% of total area or 59% of UAA, which was the third highest share of permanent grassland of UAA behind Ireland (80%) and the United Kingdom (62%). The country with the highest share of arable land was Denmark (56% of total area). In Sweden arable land covered only 6% of total area; in Slovenia only 8% of total area. A higher share of permanent crops is characteristic of Mediterranean countries. In 2010 it was the highest in Spain (8% of total UAA).
LAND 23AGRICULTURE IN SLOVENIA AND IN THE REST OF THE EU
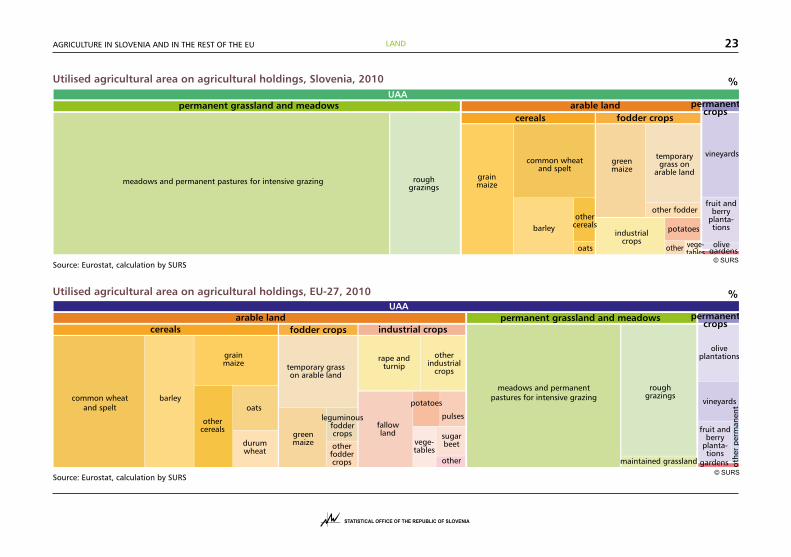
Utilised agricultural area on agricultural holdings, Slovenia, 2010 %
Source: Eurostat, calculation by SURS
Utilised agricultural area on agricultural holdings, EU-27, 2010 %
Source: Eurostat, calculation by SURS
© SURS
© SURS
LAND24 AGRICULTURE IN SLOVENIA AND IN THE REST OF THE EU
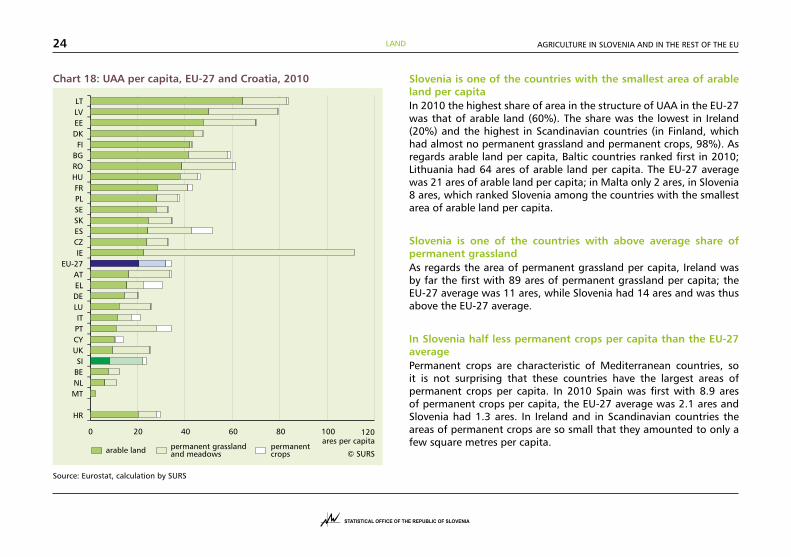
Chart 18: UAA per capita, EU-27 and Croatia, 2010
Source: Eurostat, calculation by SURS
Slovenia is one of the countries with the smallest area of arable land per capitaIn 2010 the highest share of area in the structure of UAA in the EU-27 was that of arable land (60%). The share was the lowest in Ireland (20%) and the highest in Scandinavian countries (in Finland, which had almost no permanent grassland and permanent crops, 98%). As regards arable land per capita, Baltic countries ranked first in 2010; Lithuania had 64 ares of arable land per capita. The EU-27 average was 21 ares of arable land per capita; in Malta only 2 ares, in Slovenia 8 ares, which ranked Slovenia among the countries with the smallest area of arable land per capita.
Slovenia is one of the countries with above average share of permanent grassland As regards the area of permanent grassland per capita, Ireland was by far the first with 89 ares of permanent grassland per capita; the EU-27 average was 11 ares, while Slovenia had 14 ares and was thus above the EU-27 average.
In Slovenia half less permanent crops per capita than the EU-27 averagePermanent crops are characteristic of Mediterranean countries, so it is not surprising that these countries have the largest areas of permanent crops per capita. In 2010 Spain was first with 8.9 ares of permanent crops per capita, the EU-27 average was 2.1 ares and Slovenia had 1.3 ares. In Ireland and in Scandinavian countries the areas of permanent crops are so small that they amounted to only a few square metres per capita.
LAND 25AGRICULTURE IN SLOVENIA AND IN THE REST OF THE EU
2.3 Arable land and kitchen gardens
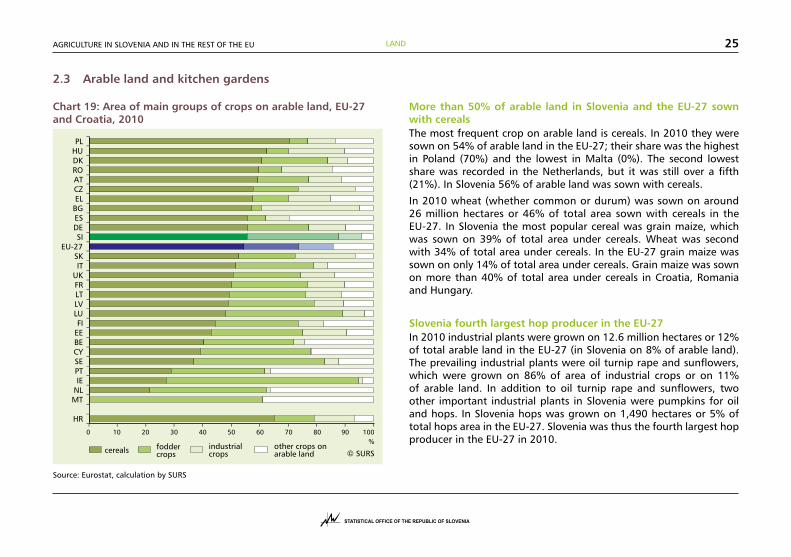
Chart 19: Area of main groups of crops on arable land, EU-27 and Croatia, 2010
Source: Eurostat, calculation by SURS
More than 50% of arable land in Slovenia and the EU-27 sown with cereals The most frequent crop on arable land is cereals. In 2010 they were sown on 54% of arable land in the EU-27; their share was the highest in Poland (70%) and the lowest in Malta (0%). The second lowest share was recorded in the Netherlands, but it was still over a fifth (21%). In Slovenia 56% of arable land was sown with cereals.
In 2010 wheat (whether common or durum) was sown on around 26 million hectares or 46% of total area sown with cereals in the EU-27. In Slovenia the most popular cereal was grain maize, which was sown on 39% of total area under cereals. Wheat was second with 34% of total area under cereals. In the EU-27 grain maize was sown on only 14% of total area under cereals. Grain maize was sown on more than 40% of total area under cereals in Croatia, Romania and Hungary.
Slovenia fourth largest hop producer in the EU-27In 2010 industrial plants were grown on 12.6 million hectares or 12% of total arable land in the EU-27 (in Slovenia on 8% of arable land). The prevailing industrial plants were oil turnip rape and sunflowers, which were grown on 86% of area of industrial crops or on 11% of arable land. In addition to oil turnip rape and sunflowers, two other important industrial plants in Slovenia were pumpkins for oil and hops. In Slovenia hops was grown on 1,490 hectares or 5% of total hops area in the EU-27. Slovenia was thus the fourth largest hop producer in the EU-27 in 2010.
LAND26 AGRICULTURE IN SLOVENIA AND IN THE REST OF THE EU
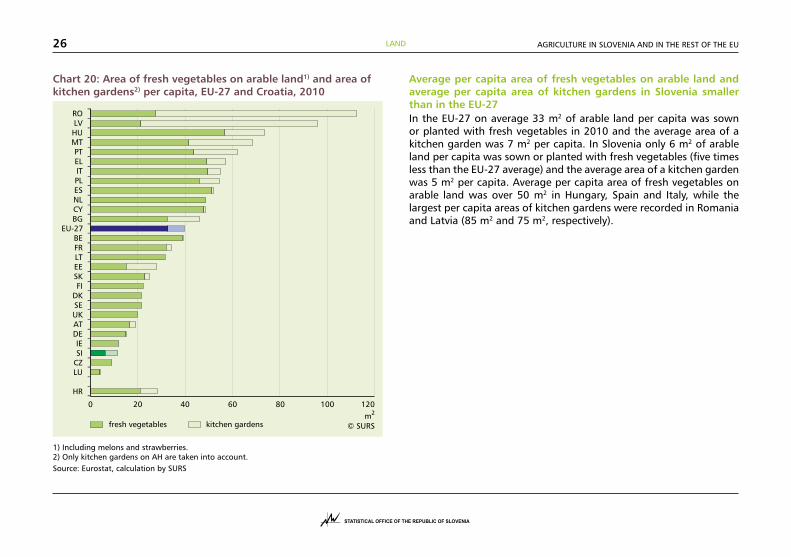
Chart 20: Area of fresh vegetables on arable land1) and area of kitchen gardens2) per capita, EU-27 and Croatia, 2010
1) Including melons and strawberries.2) Only kitchen gardens on AH are taken into account. Source: Eurostat, calculation by SURS
Average per capita area of fresh vegetables on arable land and average per capita area of kitchen gardens in Slovenia smaller than in the EU-27 In the EU-27 on average 33 m2 of arable land per capita was sown or planted with fresh vegetables in 2010 and the average area of a kitchen garden was 7 m2 per capita. In Slovenia only 6 m2 of arable land per capita was sown or planted with fresh vegetables (five times less than the EU-27 average) and the average area of a kitchen garden was 5 m2 per capita. Average per capita area of fresh vegetables on arable land was over 50 m2 in Hungary, Spain and Italy, while the largest per capita areas of kitchen gardens were recorded in Romania and Latvia (85 m2 and 75 m2, respectively).
LAND 27AGRICULTURE IN SLOVENIA AND IN THE REST OF THE EU
2.4 Permanent crops
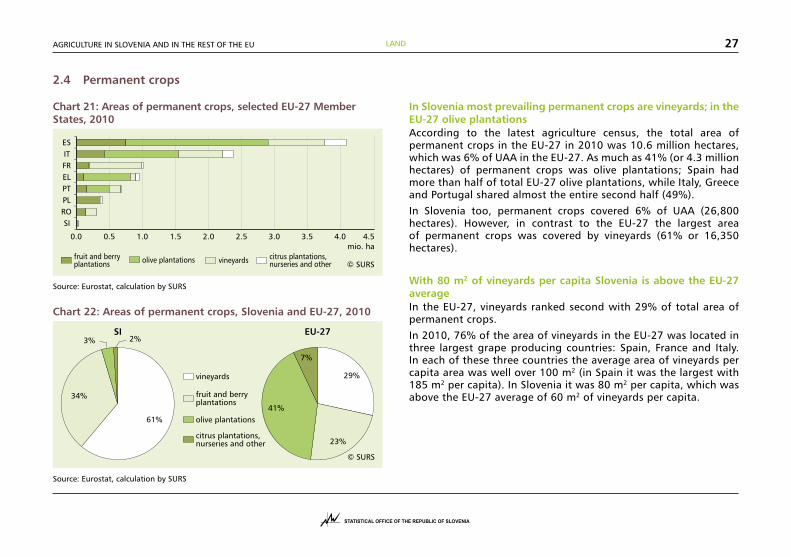
Chart 21: Areas of permanent crops, selected EU-27 Member States, 2010
Source: Eurostat, calculation by SURS
Chart 22: Areas of permanent crops, Slovenia and EU-27, 2010
Source: Eurostat, calculation by SURS
In Slovenia most prevailing permanent crops are vineyards; in the EU-27 olive plantations According to the latest agriculture census, the total area of permanent crops in the EU-27 in 2010 was 10.6 million hectares, which was 6% of UAA in the EU-27. As much as 41% (or 4.3 million hectares) of permanent crops was olive plantations; Spain had more than half of total EU-27 olive plantations, while Italy, Greece and Portugal shared almost the entire second half (49%).
In Slovenia too, permanent crops covered 6% of UAA (26,800 hectares). However, in contrast to the EU-27 the largest area of permanent crops was covered by vineyards (61% or 16,350 hectares).
With 80 m2 of vineyards per capita Slovenia is above the EU-27 averageIn the EU-27, vineyards ranked second with 29% of total area of permanent crops.
In 2010, 76% of the area of vineyards in the EU-27 was located in three largest grape producing countries: Spain, France and Italy. In each of these three countries the average area of vineyards per capita area was well over 100 m2 (in Spain it was the largest with 185 m2 per capita). In Slovenia it was 80 m2 per capita, which was above the EU-27 average of 60 m2 of vineyards per capita.
AGRICULTURE IN SLOVENIA AND IN THE REST OF THE EU28
3 CROP PRODUCTION
3.1 Crop output value as a share of agricultural output
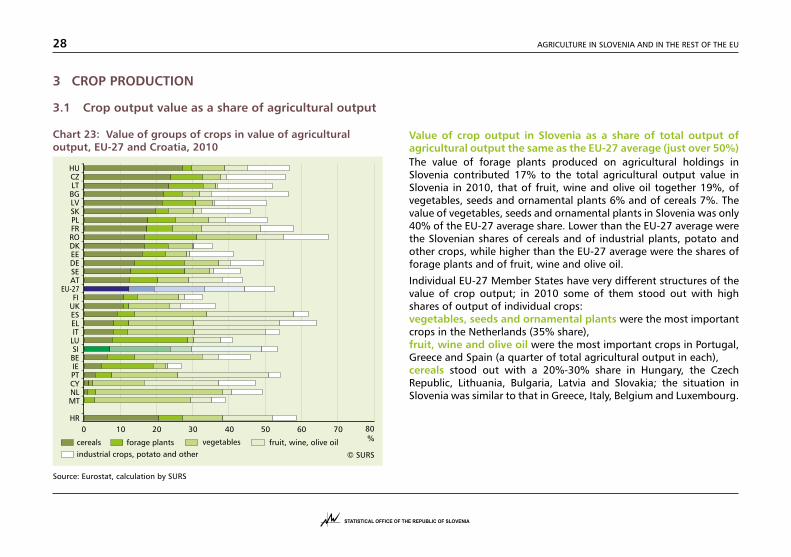
Chart 23: Value of groups of crops in value of agricultural output, EU-27 and Croatia, 2010
Source: Eurostat, calculation by SURS
Value of crop output in Slovenia as a share of total output of agricultural output the same as the EU-27 average (just over 50%) The value of forage plants produced on agricultural holdings in Slovenia contributed 17% to the total agricultural output value in Slovenia in 2010, that of fruit, wine and olive oil together 19%, of vegetables, seeds and ornamental plants 6% and of cereals 7%. The value of vegetables, seeds and ornamental plants in Slovenia was only 40% of the EU-27 average share. Lower than the EU-27 average were the Slovenian shares of cereals and of industrial plants, potato and other crops, while higher than the EU-27 average were the shares of forage plants and of fruit, wine and olive oil.
Individual EU-27 Member States have very different structures of the value of crop output; in 2010 some of them stood out with high shares of output of individual crops: vegetables, seeds and ornamental plants were the most important crops in the Netherlands (35% share), fruit, wine and olive oil were the most important crops in Portugal, Greece and Spain (a quarter of total agricultural output in each), cereals stood out with a 20%-30% share in Hungary, the Czech Republic, Lithuania, Bulgaria, Latvia and Slovakia; the situation in Slovenia was similar to that in Greece, Italy, Belgium and Luxembourg.
APPENDIXAGRICULTURE IN SLOVENIA AND IN THE REST OF THE EU
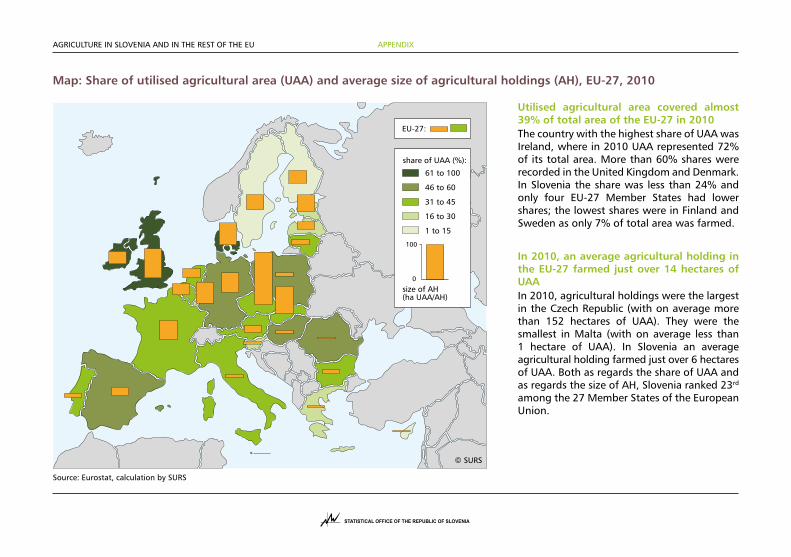
Map: Share of utilised agricultural area (UAA) and average size of agricultural holdings (AH), EU-27, 2010
Source: Eurostat, calculation by SURS
Utilised agricultural area covered almost 39% of total area of the EU-27 in 2010The country with the highest share of UAA was Ireland, where in 2010 UAA represented 72% of its total area. More than 60% shares were recorded in the United Kingdom and Denmark. In Slovenia the share was less than 24% and only four EU-27 Member States had lower shares; the lowest shares were in Finland and Sweden as only 7% of total area was farmed.
In 2010, an average agricultural holding in the EU-27 farmed just over 14 hectares of UAAIn 2010, agricultural holdings were the largest in the Czech Republic (with on average more than 152 hectares of UAA). They were the smallest in Malta (with on average less than 1 hectare of UAA). In Slovenia an average agricultural holding farmed just over 6 hectares of UAA. Both as regards the share of UAA and as regards the size of AH, Slovenia ranked 23rd among the 27 Member States of the European Union.
APPENDIX AGRICULTURE IN SLOVENIA AND IN THE REST OF THE EU
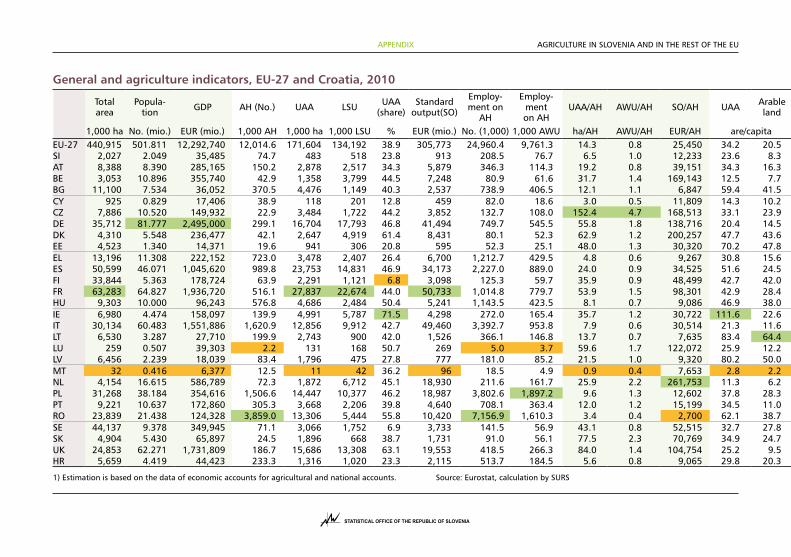
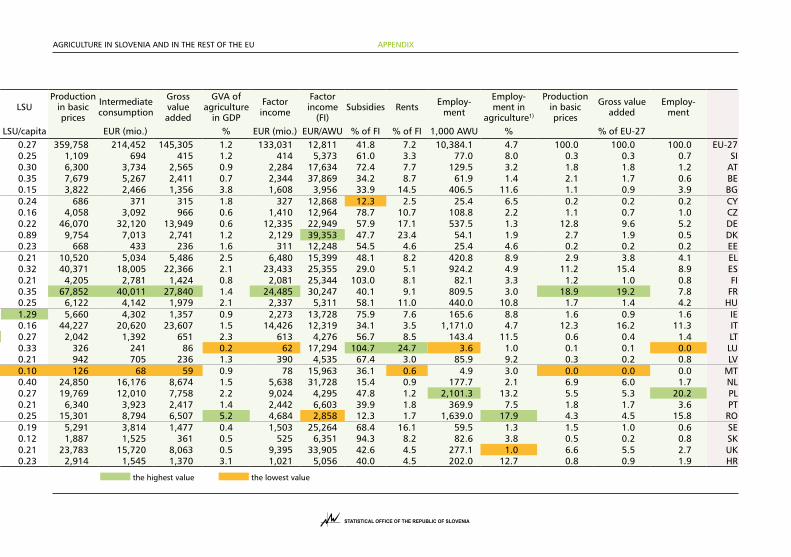
General and agriculture indicators, EU-27 and Croatia, 2010
Total area
Popula- tion GDP AH (No.) UAA LSU UAA
(share)Standard
output(SO)
Employ- ment on
AH
Employ- ment on AH
UAA/AH AWU/AH SO/AH UAA Arable land LSU
Production in basic prices
Intermediate consumption
Gross value added
GVA of agriculture
in GDP
Factor income
Factor income
(FI) Subsidies Rents Employ-
ment
Employ- ment in
agriculture1)
Production in basic prices
Gross value added
Employ- ment
1,000 ha No. (mio.) EUR (mio.) 1,000 AH 1,000 ha 1,000 LSU % EUR (mio.) No. (1,000) 1,000 AWU ha/AH AWU/AH EUR/AH are/capita LSU/capita EUR (mio.) % EUR (mio.) EUR/AWU % of FI % of FI 1,000 AWU % % of EU-27EU-27 440,915 501.811 12,292,740 12,014.6 171,604 134,192 38.9 305,773 24,960.4 9,761.3 14.3 0.8 25,450 34.2 20.5 0.27 359,758 214,452 145,305 1.2 133,031 12,811 41.8 7.2 10,384.1 4.7 100.0 100.0 100.0 EU-27SI 2,027 2.049 35,485 74.7 483 518 23.8 913 208.5 76.7 6.5 1.0 12,233 23.6 8.3 0.25 1,109 694 415 1.2 414 5,373 61.0 3.3 77.0 8.0 0.3 0.3 0.7 SIAT 8,388 8.390 285,165 150.2 2,878 2,517 34.3 5,879 346.3 114.3 19.2 0.8 39,151 34.3 16.3 0.30 6,300 3,734 2,565 0.9 2,284 17,634 72.4 7.7 129.5 3.2 1.8 1.8 1.2 ATBE 3,053 10.896 355,740 42.9 1,358 3,799 44.5 7,248 80.9 61.6 31.7 1.4 169,143 12.5 7.7 0.35 7,679 5,267 2,411 0.7 2,344 37,869 34.2 8.7 61.9 1.4 2.1 1.7 0.6 BEBG 11,100 7.534 36,052 370.5 4,476 1,149 40.3 2,537 738.9 406.5 12.1 1.1 6,847 59.4 41.5 0.15 3,822 2,466 1,356 3.8 1,608 3,956 33.9 14.5 406.5 11.6 1.1 0.9 3.9 BGCY 925 0.829 17,406 38.9 118 201 12.8 459 82.0 18.6 3.0 0.5 11,809 14.3 10.2 0.24 686 371 315 1.8 327 12,868 12.3 2.5 25.4 6.5 0.2 0.2 0.2 CYCZ 7,886 10.520 149,932 22.9 3,484 1,722 44.2 3,852 132.7 108.0 152.4 4.7 168,513 33.1 23.9 0.16 4,058 3,092 966 0.6 1,410 12,964 78.7 10.7 108.8 2.2 1.1 0.7 1.0 CZDE 35,712 81.777 2,495,000 299.1 16,704 17,793 46.8 41,494 749.7 545.5 55.8 1.8 138,716 20.4 14.5 0.22 46,070 32,120 13,949 0.6 12,335 22,949 57.9 17.1 537.5 1.3 12.8 9.6 5.2 DEDK 4,310 5.548 236,477 42.1 2,647 4,919 61.4 8,431 80.1 52.3 62.9 1.2 200,257 47.7 43.6 0.89 9,754 7,013 2,741 1.2 2,129 39,353 47.7 23.4 54.1 1.9 2.7 1.9 0.5 DKEE 4,523 1.340 14,371 19.6 941 306 20.8 595 52.3 25.1 48.0 1.3 30,320 70.2 47.8 0.23 668 433 236 1.6 311 12,248 54.5 4.6 25.4 4.6 0.2 0.2 0.2 EEEL 13,196 11.308 222,152 723.0 3,478 2,407 26.4 6,700 1,212.7 429.5 4.8 0.6 9,267 30.8 15.6 0.21 10,520 5,034 5,486 2.5 6,480 15,399 48.1 8.2 420.8 8.9 2.9 3.8 4.1 ELES 50,599 46.071 1,045,620 989.8 23,753 14,831 46.9 34,173 2,227.0 889.0 24.0 0.9 34,525 51.6 24.5 0.32 40,371 18,005 22,366 2.1 23,433 25,355 29.0 5.1 924.2 4.9 11.2 15.4 8.9 ESFI 33,844 5.363 178,724 63.9 2,291 1,121 6.8 3,098 125.3 59.7 35.9 0.9 48,499 42.7 42.0 0.21 4,205 2,781 1,424 0.8 2,081 25,344 103.0 8.1 82.1 3.3 1.2 1.0 0.8 FIFR 63,283 64.827 1,936,720 516.1 27,837 22,674 44.0 50,733 1,014.8 779.7 53.9 1.5 98,301 42.9 28.4 0.35 67,852 40,011 27,840 1.4 24,485 30,247 40.1 9.1 809.5 3.0 18.9 19.2 7.8 FRHU 9,303 10.000 96,243 576.8 4,686 2,484 50.4 5,241 1,143.5 423.5 8.1 0.7 9,086 46.9 38.0 0.25 6,122 4,142 1,979 2.1 2,337 5,311 58.1 11.0 440.0 10.8 1.7 1.4 4.2 HUIE 6,980 4.474 158,097 139.9 4,991 5,787 71.5 4,298 272.0 165.4 35.7 1.2 30,722 111.6 22.6 1.29 5,660 4,302 1,357 0.9 2,273 13,728 75.9 7.6 165.6 8.8 1.6 0.9 1.6 IEIT 30,134 60.483 1,551,886 1,620.9 12,856 9,912 42.7 49,460 3,392.7 953.8 7.9 0.6 30,514 21.3 11.6 0.16 44,227 20,620 23,607 1.5 14,426 12,319 34.1 3.5 1,171.0 4.7 12.3 16.2 11.3 ITLT 6,530 3.287 27,710 199.9 2,743 900 42.0 1,526 366.1 146.8 13.7 0.7 7,635 83.4 64.4 0.27 2,042 1,392 651 2.3 613 4,276 56.7 8.5 143.4 11.5 0.6 0.4 1.4 LTLU 259 0.507 39,303 2.2 131 168 50.7 269 5.0 3.7 59.6 1.7 122,072 25.9 12.2 0.33 326 241 86 0.2 62 17,294 104.7 24.7 3.6 1.0 0.1 0.1 0.0 LULV 6,456 2.239 18,039 83.4 1,796 475 27.8 777 181.0 85.2 21.5 1.0 9,320 80.2 50.0 0.21 942 705 236 1.3 390 4,535 67.4 3.0 85.9 9.2 0.3 0.2 0.8 LVMT 32 0.416 6,377 12.5 11 42 36.2 96 18.5 4.9 0.9 0.4 7,653 2.8 2.2 0.10 126 68 59 0.9 78 15,963 36.1 0.6 4.9 3.0 0.0 0.0 0.0 MTNL 4,154 16.615 586,789 72.3 1,872 6,712 45.1 18,930 211.6 161.7 25.9 2.2 261,753 11.3 6.2 0.40 24,850 16,176 8,674 1.5 5,638 31,728 15.4 0.9 177.7 2.1 6.9 6.0 1.7 NLPL 31,268 38.184 354,616 1,506.6 14,447 10,377 46.2 18,987 3,802.6 1,897.2 9.6 1.3 12,602 37.8 28.3 0.27 19,769 12,010 7,758 2.2 9,024 4,295 47.8 1.2 2,101.3 13.2 5.5 5.3 20.2 PLPT 9,221 10.637 172,860 305.3 3,668 2,206 39.8 4,640 708.1 363.4 12.0 1.2 15,199 34.5 11.0 0.21 6,340 3,923 2,417 1.4 2,442 6,603 39.9 1.8 369.9 7.5 1.8 1.7 3.6 PTRO 23,839 21.438 124,328 3,859.0 13,306 5,444 55.8 10,420 7,156.9 1,610.3 3.4 0.4 2,700 62.1 38.7 0.25 15,301 8,794 6,507 5.2 4,684 2,858 12.3 1.7 1,639.0 17.9 4.3 4.5 15.8 ROSE 44,137 9.378 349,945 71.1 3,066 1,752 6.9 3,733 141.5 56.9 43.1 0.8 52,515 32.7 27.8 0.19 5,291 3,814 1,477 0.4 1,503 25,264 68.4 16.1 59.5 1.3 1.5 1.0 0.6 SESK 4,904 5.430 65,897 24.5 1,896 668 38.7 1,731 91.0 56.1 77.5 2.3 70,769 34.9 24.7 0.12 1,887 1,525 361 0.5 525 6,351 94.3 8.2 82.6 3.8 0.5 0.2 0.8 SKUK 24,853 62.271 1,731,809 186.7 15,686 13,308 63.1 19,553 418.5 266.3 84.0 1.4 104,754 25.2 9.5 0.21 23,783 15,720 8,063 0.5 9,395 33,905 42.6 4.5 277.1 1.0 6.6 5.5 2.7 UKHR 5,659 4.419 44,423 233.3 1,316 1,020 23.3 2,115 513.7 184.5 5.6 0.8 9,065 29.8 20.3 0.23 2,914 1,545 1,370 3.1 1,021 5,056 40.0 4.5 202.0 12.7 0.8 0.9 1.9 HR
1) Estimation is based on the data of economic accounts for agricultural and national accounts. Source: Eurostat, calculation by SURS the highest value the lowest value
APPENDIXAGRICULTURE IN SLOVENIA AND IN THE REST OF THE EU
General and agriculture indicators, EU-27 and Croatia, 2010
Total area
Popula- tion GDP AH (No.) UAA LSU UAA
(share)Standard
output(SO)
Employ- ment on
AH
Employ- ment on AH
UAA/AH AWU/AH SO/AH UAA Arable land LSU
Production in basic prices
Intermediate consumption
Gross value added
GVA of agriculture
in GDP
Factor income
Factor income
(FI) Subsidies Rents Employ-
ment
Employ- ment in
agriculture1)
Production in basic prices
Gross value added
Employ- ment
1,000 ha No. (mio.) EUR (mio.) 1,000 AH 1,000 ha 1,000 LSU % EUR (mio.) No. (1,000) 1,000 AWU ha/AH AWU/AH EUR/AH are/capita LSU/capita EUR (mio.) % EUR (mio.) EUR/AWU % of FI % of FI 1,000 AWU % % of EU-27EU-27 440,915 501.811 12,292,740 12,014.6 171,604 134,192 38.9 305,773 24,960.4 9,761.3 14.3 0.8 25,450 34.2 20.5 0.27 359,758 214,452 145,305 1.2 133,031 12,811 41.8 7.2 10,384.1 4.7 100.0 100.0 100.0 EU-27SI 2,027 2.049 35,485 74.7 483 518 23.8 913 208.5 76.7 6.5 1.0 12,233 23.6 8.3 0.25 1,109 694 415 1.2 414 5,373 61.0 3.3 77.0 8.0 0.3 0.3 0.7 SIAT 8,388 8.390 285,165 150.2 2,878 2,517 34.3 5,879 346.3 114.3 19.2 0.8 39,151 34.3 16.3 0.30 6,300 3,734 2,565 0.9 2,284 17,634 72.4 7.7 129.5 3.2 1.8 1.8 1.2 ATBE 3,053 10.896 355,740 42.9 1,358 3,799 44.5 7,248 80.9 61.6 31.7 1.4 169,143 12.5 7.7 0.35 7,679 5,267 2,411 0.7 2,344 37,869 34.2 8.7 61.9 1.4 2.1 1.7 0.6 BEBG 11,100 7.534 36,052 370.5 4,476 1,149 40.3 2,537 738.9 406.5 12.1 1.1 6,847 59.4 41.5 0.15 3,822 2,466 1,356 3.8 1,608 3,956 33.9 14.5 406.5 11.6 1.1 0.9 3.9 BGCY 925 0.829 17,406 38.9 118 201 12.8 459 82.0 18.6 3.0 0.5 11,809 14.3 10.2 0.24 686 371 315 1.8 327 12,868 12.3 2.5 25.4 6.5 0.2 0.2 0.2 CYCZ 7,886 10.520 149,932 22.9 3,484 1,722 44.2 3,852 132.7 108.0 152.4 4.7 168,513 33.1 23.9 0.16 4,058 3,092 966 0.6 1,410 12,964 78.7 10.7 108.8 2.2 1.1 0.7 1.0 CZDE 35,712 81.777 2,495,000 299.1 16,704 17,793 46.8 41,494 749.7 545.5 55.8 1.8 138,716 20.4 14.5 0.22 46,070 32,120 13,949 0.6 12,335 22,949 57.9 17.1 537.5 1.3 12.8 9.6 5.2 DEDK 4,310 5.548 236,477 42.1 2,647 4,919 61.4 8,431 80.1 52.3 62.9 1.2 200,257 47.7 43.6 0.89 9,754 7,013 2,741 1.2 2,129 39,353 47.7 23.4 54.1 1.9 2.7 1.9 0.5 DKEE 4,523 1.340 14,371 19.6 941 306 20.8 595 52.3 25.1 48.0 1.3 30,320 70.2 47.8 0.23 668 433 236 1.6 311 12,248 54.5 4.6 25.4 4.6 0.2 0.2 0.2 EEEL 13,196 11.308 222,152 723.0 3,478 2,407 26.4 6,700 1,212.7 429.5 4.8 0.6 9,267 30.8 15.6 0.21 10,520 5,034 5,486 2.5 6,480 15,399 48.1 8.2 420.8 8.9 2.9 3.8 4.1 ELES 50,599 46.071 1,045,620 989.8 23,753 14,831 46.9 34,173 2,227.0 889.0 24.0 0.9 34,525 51.6 24.5 0.32 40,371 18,005 22,366 2.1 23,433 25,355 29.0 5.1 924.2 4.9 11.2 15.4 8.9 ESFI 33,844 5.363 178,724 63.9 2,291 1,121 6.8 3,098 125.3 59.7 35.9 0.9 48,499 42.7 42.0 0.21 4,205 2,781 1,424 0.8 2,081 25,344 103.0 8.1 82.1 3.3 1.2 1.0 0.8 FIFR 63,283 64.827 1,936,720 516.1 27,837 22,674 44.0 50,733 1,014.8 779.7 53.9 1.5 98,301 42.9 28.4 0.35 67,852 40,011 27,840 1.4 24,485 30,247 40.1 9.1 809.5 3.0 18.9 19.2 7.8 FRHU 9,303 10.000 96,243 576.8 4,686 2,484 50.4 5,241 1,143.5 423.5 8.1 0.7 9,086 46.9 38.0 0.25 6,122 4,142 1,979 2.1 2,337 5,311 58.1 11.0 440.0 10.8 1.7 1.4 4.2 HUIE 6,980 4.474 158,097 139.9 4,991 5,787 71.5 4,298 272.0 165.4 35.7 1.2 30,722 111.6 22.6 1.29 5,660 4,302 1,357 0.9 2,273 13,728 75.9 7.6 165.6 8.8 1.6 0.9 1.6 IEIT 30,134 60.483 1,551,886 1,620.9 12,856 9,912 42.7 49,460 3,392.7 953.8 7.9 0.6 30,514 21.3 11.6 0.16 44,227 20,620 23,607 1.5 14,426 12,319 34.1 3.5 1,171.0 4.7 12.3 16.2 11.3 ITLT 6,530 3.287 27,710 199.9 2,743 900 42.0 1,526 366.1 146.8 13.7 0.7 7,635 83.4 64.4 0.27 2,042 1,392 651 2.3 613 4,276 56.7 8.5 143.4 11.5 0.6 0.4 1.4 LTLU 259 0.507 39,303 2.2 131 168 50.7 269 5.0 3.7 59.6 1.7 122,072 25.9 12.2 0.33 326 241 86 0.2 62 17,294 104.7 24.7 3.6 1.0 0.1 0.1 0.0 LULV 6,456 2.239 18,039 83.4 1,796 475 27.8 777 181.0 85.2 21.5 1.0 9,320 80.2 50.0 0.21 942 705 236 1.3 390 4,535 67.4 3.0 85.9 9.2 0.3 0.2 0.8 LVMT 32 0.416 6,377 12.5 11 42 36.2 96 18.5 4.9 0.9 0.4 7,653 2.8 2.2 0.10 126 68 59 0.9 78 15,963 36.1 0.6 4.9 3.0 0.0 0.0 0.0 MTNL 4,154 16.615 586,789 72.3 1,872 6,712 45.1 18,930 211.6 161.7 25.9 2.2 261,753 11.3 6.2 0.40 24,850 16,176 8,674 1.5 5,638 31,728 15.4 0.9 177.7 2.1 6.9 6.0 1.7 NLPL 31,268 38.184 354,616 1,506.6 14,447 10,377 46.2 18,987 3,802.6 1,897.2 9.6 1.3 12,602 37.8 28.3 0.27 19,769 12,010 7,758 2.2 9,024 4,295 47.8 1.2 2,101.3 13.2 5.5 5.3 20.2 PLPT 9,221 10.637 172,860 305.3 3,668 2,206 39.8 4,640 708.1 363.4 12.0 1.2 15,199 34.5 11.0 0.21 6,340 3,923 2,417 1.4 2,442 6,603 39.9 1.8 369.9 7.5 1.8 1.7 3.6 PTRO 23,839 21.438 124,328 3,859.0 13,306 5,444 55.8 10,420 7,156.9 1,610.3 3.4 0.4 2,700 62.1 38.7 0.25 15,301 8,794 6,507 5.2 4,684 2,858 12.3 1.7 1,639.0 17.9 4.3 4.5 15.8 ROSE 44,137 9.378 349,945 71.1 3,066 1,752 6.9 3,733 141.5 56.9 43.1 0.8 52,515 32.7 27.8 0.19 5,291 3,814 1,477 0.4 1,503 25,264 68.4 16.1 59.5 1.3 1.5 1.0 0.6 SESK 4,904 5.430 65,897 24.5 1,896 668 38.7 1,731 91.0 56.1 77.5 2.3 70,769 34.9 24.7 0.12 1,887 1,525 361 0.5 525 6,351 94.3 8.2 82.6 3.8 0.5 0.2 0.8 SKUK 24,853 62.271 1,731,809 186.7 15,686 13,308 63.1 19,553 418.5 266.3 84.0 1.4 104,754 25.2 9.5 0.21 23,783 15,720 8,063 0.5 9,395 33,905 42.6 4.5 277.1 1.0 6.6 5.5 2.7 UKHR 5,659 4.419 44,423 233.3 1,316 1,020 23.3 2,115 513.7 184.5 5.6 0.8 9,065 29.8 20.3 0.23 2,914 1,545 1,370 3.1 1,021 5,056 40.0 4.5 202.0 12.7 0.8 0.9 1.9 HR
1) Estimation is based on the data of economic accounts for agricultural and national accounts. Source: Eurostat, calculation by SURS the highest value the lowest value
APPENDIX AGRICULTURE IN SLOVENIA AND IN THE REST OF THE EU
Share of Slovenian agriculture in EU-27 agriculture, 2010
Source: Eurostat, calculation by SURS
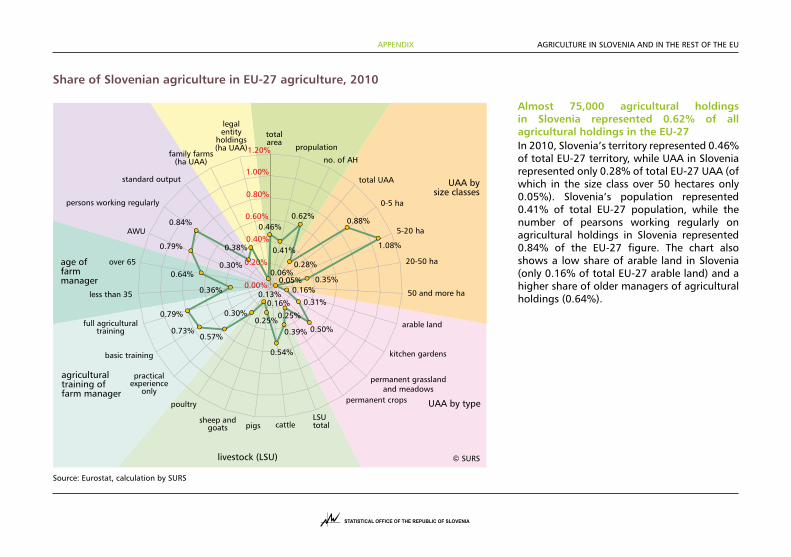
Almost 75,000 agricultural holdings in Slovenia represented 0.62% of all agricultural holdings in the EU-27In 2010, Slovenia’s territory represented 0.46% of total EU-27 territory, while UAA in Slovenia represented only 0.28% of total EU-27 UAA (of which in the size class over 50 hectares only 0.05%). Slovenia’s population represented 0.41% of total EU-27 population, while the number of pearsons working regularly on agricultural holdings in Slovenia represented 0.84% of the EU-27 figure. The chart also shows a low share of arable land in Slovenia (only 0.16% of total EU-27 arable land) and a higher share of older managers of agricultural holdings (0.64%).
CROP OUTPUT 29AGRICULTURE IN SLOVENIA AND IN THE REST OF THE EU
3.2 Yields of main crops
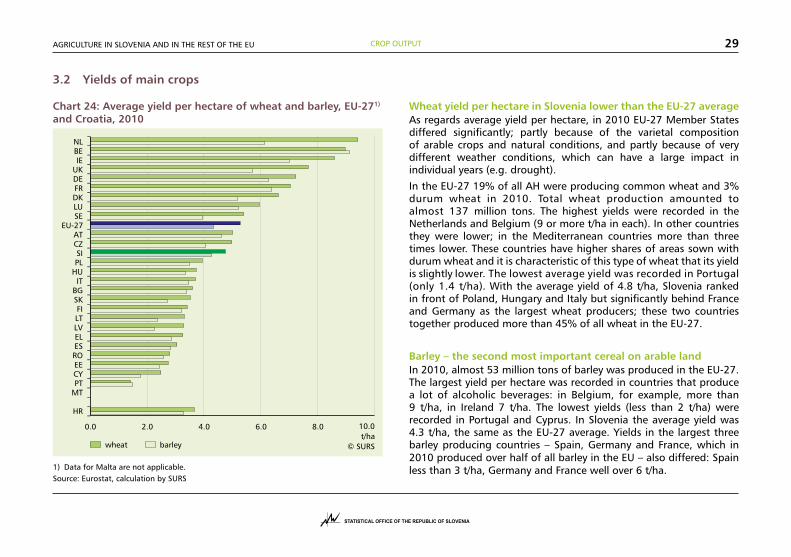
Chart 24: Average yield per hectare of wheat and barley, EU-271) and Croatia, 2010
1) Data for Malta are not applicable.Source: Eurostat, calculation by SURS
Wheat yield per hectare in Slovenia lower than the EU-27 averageAs regards average yield per hectare, in 2010 EU-27 Member States differed significantly; partly because of the varietal composition of arable crops and natural conditions, and partly because of very different weather conditions, which can have a large impact in individual years (e.g. drought).
In the EU-27 19% of all AH were producing common wheat and 3% durum wheat in 2010. Total wheat production amounted to almost 137 million tons. The highest yields were recorded in the Netherlands and Belgium (9 or more t/ha in each). In other countries they were lower; in the Mediterranean countries more than three times lower. These countries have higher shares of areas sown with durum wheat and it is characteristic of this type of wheat that its yield is slightly lower. The lowest average yield was recorded in Portugal (only 1.4 t/ha). With the average yield of 4.8 t/ha, Slovenia ranked in front of Poland, Hungary and Italy but significantly behind France and Germany as the largest wheat producers; these two countries together produced more than 45% of all wheat in the EU-27.
Barley – the second most important cereal on arable land In 2010, almost 53 million tons of barley was produced in the EU-27. The largest yield per hectare was recorded in countries that produce a lot of alcoholic beverages: in Belgium, for example, more than 9 t/ha, in Ireland 7 t/ha. The lowest yields (less than 2 t/ha) were recorded in Portugal and Cyprus. In Slovenia the average yield was 4.3 t/ha, the same as the EU-27 average. Yields in the largest three barley producing countries – Spain, Germany and France, which in 2010 produced over half of all barley in the EU – also differed: Spain less than 3 t/ha, Germany and France well over 6 t/ha.
CROP OUTPUT 30 AGRICULTURE IN SLOVENIA AND IN THE REST OF THE EU
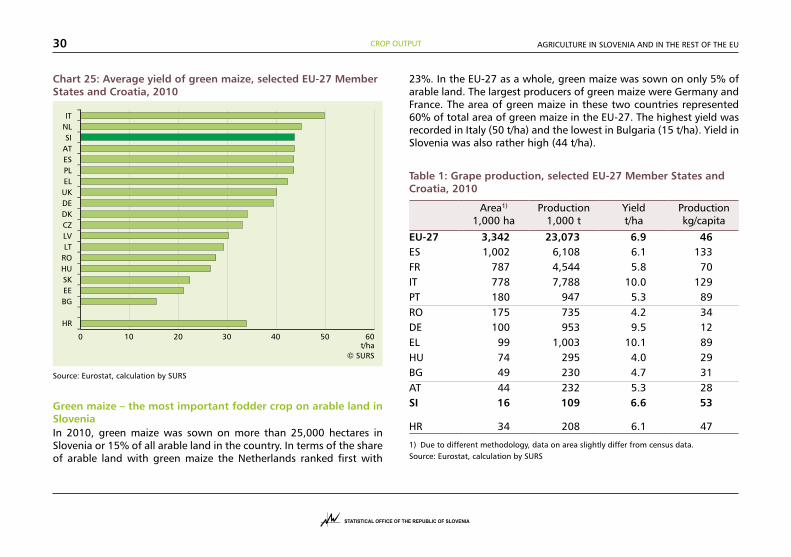
Chart 25: Average yield of green maize, selected EU-27 Member States and Croatia, 2010
Source: Eurostat, calculation by SURS
Green maize – the most important fodder crop on arable land in Slovenia In 2010, green maize was sown on more than 25,000 hectares in Slovenia or 15% of all arable land in the country. In terms of the share of arable land with green maize the Netherlands ranked first with
23%. In the EU-27 as a whole, green maize was sown on only 5% of arable land. The largest producers of green maize were Germany and France. The area of green maize in these two countries represented 60% of total area of green maize in the EU-27. The highest yield was recorded in Italy (50 t/ha) and the lowest in Bulgaria (15 t/ha). Yield in Slovenia was also rather high (44 t/ha).
Table 1: Grape production, selected EU-27 Member States and Croatia, 2010
Area1) 1,000 ha
Production 1,000 t
Yield t/ha
Production kg/capita
EU-27 3,342 23,073 6.9 46ES 1,002 6,108 6.1 133FR 787 4,544 5.8 70IT 778 7,788 10.0 129PT 180 947 5.3 89RO 175 735 4.2 34DE 100 953 9.5 12EL 99 1,003 10.1 89HU 74 295 4.0 29BG 49 230 4.7 31AT 44 232 5.3 28SI 16 109 6.6 53
HR 34 208 6.1 47
1) Due to different methodology, data on area slightly differ from census data.Source: Eurostat, calculation by SURS
CROP OUTPUT 31AGRICULTURE IN SLOVENIA AND IN THE REST OF THE EU
Grapes: yield in Slovenia (6.6 t/ha) just below the EU-27 average (6.9 t/ha) In 2010, more than three quarters of vineyards in the EU-27 belonged to three largest wine-producing Member States: Spain (over a million hectares), France and Italy (each over 750,000 hectares). The total area of vineyards in the EU-27 was over 3.3 million hectares. Grape production in these vineyards was estimated at more than 23 million tons, which is an average of 46 kilograms per person. Higher yields than the EU-27 average were recorded in Greece and Italy; in each over 10 tons per hectare. Most grapes per person were produced in Spain and Italy (in each around 130 kg/person), followed by Greece and Portugal (in each 89 kg/person) and France (70 kg/person). Slovenia produced 53 kg of grapes per person in 2010.
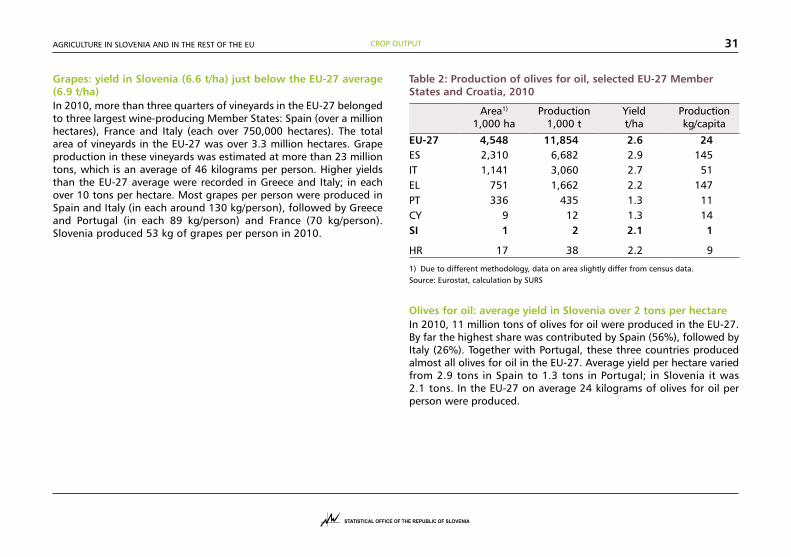
Table 2: Production of olives for oil, selected EU-27 Member States and Croatia, 2010
Area1)
1,000 haProduction
1,000 tYield t/ha
Production kg/capita
EU-27 4,548 11,854 2.6 24ES 2,310 6,682 2.9 145IT 1,141 3,060 2.7 51EL 751 1,662 2.2 147PT 336 435 1.3 11CY 9 12 1.3 14SI 1 2 2.1 1
HR 17 38 2.2 9
1) Due to different methodology, data on area slightly differ from census data.Source: Eurostat, calculation by SURS
Olives for oil: average yield in Slovenia over 2 tons per hectare In 2010, 11 million tons of olives for oil were produced in the EU-27. By far the highest share was contributed by Spain (56%), followed by Italy (26%). Together with Portugal, these three countries produced almost all olives for oil in the EU-27. Average yield per hectare varied from 2.9 tons in Spain to 1.3 tons in Portugal; in Slovenia it was 2.1 tons. In the EU-27 on average 24 kilograms of olives for oil per person were produced.
AGRICULTURE IN SLOVENIA AND IN THE REST OF THE EU32
4 LIVESTOCK PRODUCTION
4.1 Livestock output value as a share of total agricultural output value
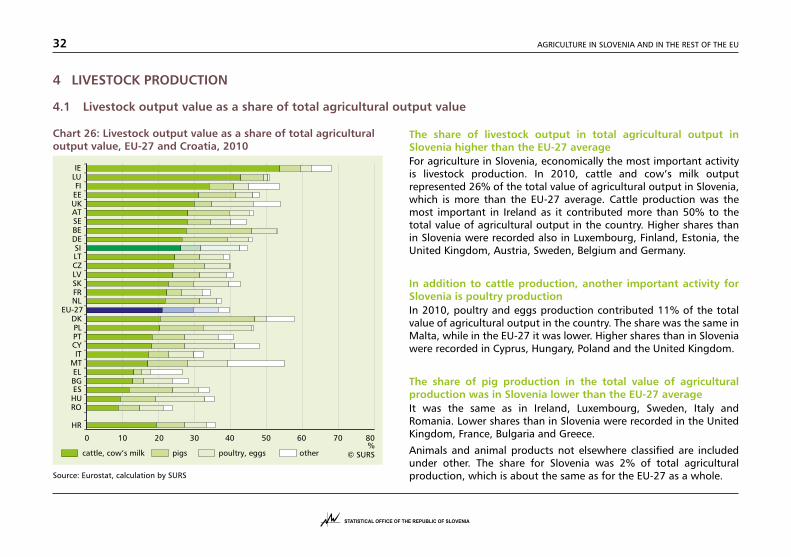
Chart 26: Livestock output value as a share of total agricultural output value, EU-27 and Croatia, 2010
Source: Eurostat, calculation by SURS
The share of livestock output in total agricultural output in Slovenia higher than the EU-27 averageFor agriculture in Slovenia, economically the most important activity is livestock production. In 2010, cattle and cow’s milk output represented 26% of the total value of agricultural output in Slovenia, which is more than the EU-27 average. Cattle production was the most important in Ireland as it contributed more than 50% to the total value of agricultural output in the country. Higher shares than in Slovenia were recorded also in Luxembourg, Finland, Estonia, the United Kingdom, Austria, Sweden, Belgium and Germany.
In addition to cattle production, another important activity for Slovenia is poultry productionIn 2010, poultry and eggs production contributed 11% of the total value of agricultural output in the country. The share was the same in Malta, while in the EU-27 it was lower. Higher shares than in Slovenia were recorded in Cyprus, Hungary, Poland and the United Kingdom.
The share of pig production in the total value of agricultural production was in Slovenia lower than the EU-27 averageIt was the same as in Ireland, Luxembourg, Sweden, Italy and Romania. Lower shares than in Slovenia were recorded in the United Kingdom, France, Bulgaria and Greece.
Animals and animal products not elsewhere classified are included under other. The share for Slovenia was 2% of total agricultural production, which is about the same as for the EU-27 as a whole.
LIVESTOCK OUTPUT 33AGRICULTURE IN SLOVENIA AND IN THE REST OF THE EU
4.2 Shares of livestock by species
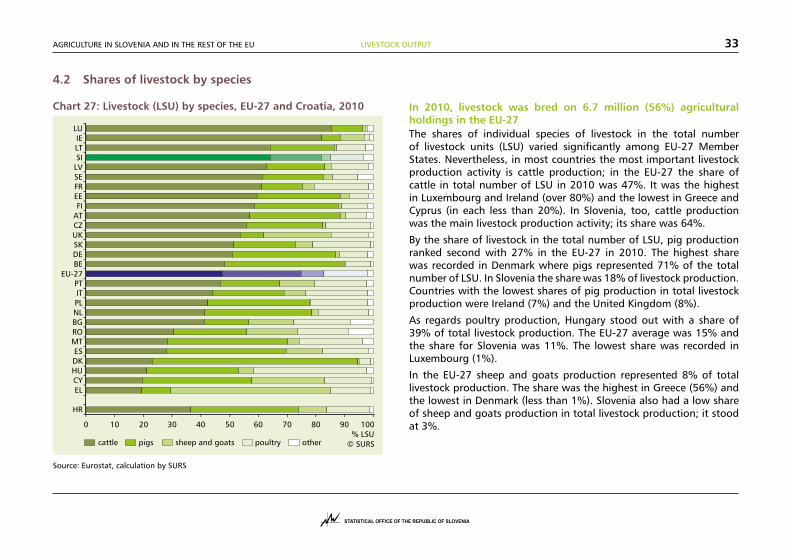
Chart 27: Livestock (LSU) by species, EU-27 and Croatia, 2010
Source: Eurostat, calculation by SURS
In 2010, livestock was bred on 6.7 million (56%) agricultural holdings in the EU-27 The shares of individual species of livestock in the total number of livestock units (LSU) varied significantly among EU-27 Member States. Nevertheless, in most countries the most important livestock production activity is cattle production; in the EU-27 the share of cattle in total number of LSU in 2010 was 47%. It was the highest in Luxembourg and Ireland (over 80%) and the lowest in Greece and Cyprus (in each less than 20%). In Slovenia, too, cattle production was the main livestock production activity; its share was 64%.
By the share of livestock in the total number of LSU, pig production ranked second with 27% in the EU-27 in 2010. The highest share was recorded in Denmark where pigs represented 71% of the total number of LSU. In Slovenia the share was 18% of livestock production. Countries with the lowest shares of pig production in total livestock production were Ireland (7%) and the United Kingdom (8%).
As regards poultry production, Hungary stood out with a share of 39% of total livestock production. The EU-27 average was 15% and the share for Slovenia was 11%. The lowest share was recorded in Luxembourg (1%).
In the EU-27 sheep and goats production represented 8% of total livestock production. The share was the highest in Greece (56%) and the lowest in Denmark (less than 1%). Slovenia also had a low share of sheep and goats production in total livestock production; it stood at 3%.
LIVESTOCK OUTPUT 34 AGRICULTURE IN SLOVENIA AND IN THE REST OF THE EU
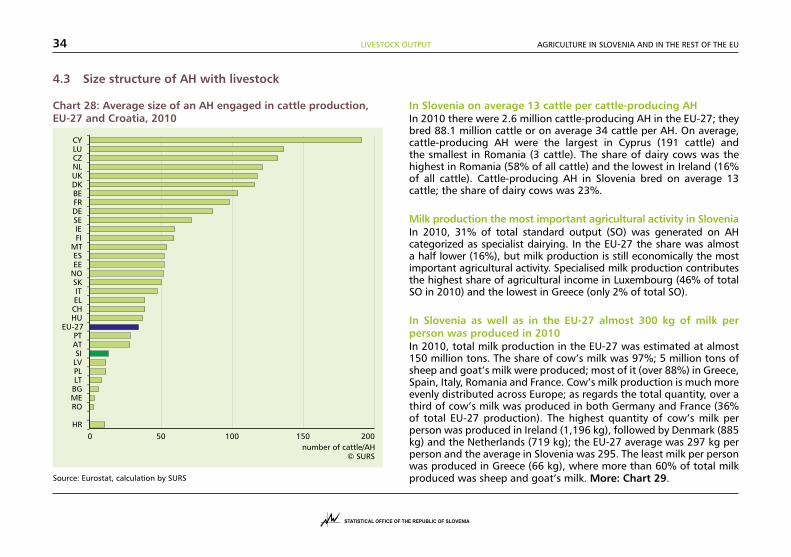
Chart 28: Average size of an AH engaged in cattle production, EU-27 and Croatia, 2010
Source: Eurostat, calculation by SURS
In Slovenia on average 13 cattle per cattle-producing AH In 2010 there were 2.6 million cattle-producing AH in the EU-27; they bred 88.1 million cattle or on average 34 cattle per AH. On average, cattle-producing AH were the largest in Cyprus (191 cattle) and the smallest in Romania (3 cattle). The share of dairy cows was the highest in Romania (58% of all cattle) and the lowest in Ireland (16% of all cattle). Cattle-producing AH in Slovenia bred on average 13 cattle; the share of dairy cows was 23%.
Milk production the most important agricultural activity in Slovenia In 2010, 31% of total standard output (SO) was generated on AH categorized as specialist dairying. In the EU-27 the share was almost a half lower (16%), but milk production is still economically the most important agricultural activity. Specialised milk production contributes the highest share of agricultural income in Luxembourg (46% of total SO in 2010) and the lowest in Greece (only 2% of total SO).
In Slovenia as well as in the EU-27 almost 300 kg of milk per person was produced in 2010 In 2010, total milk production in the EU-27 was estimated at almost 150 million tons. The share of cow’s milk was 97%; 5 million tons of sheep and goat’s milk were produced; most of it (over 88%) in Greece, Spain, Italy, Romania and France. Cow’s milk production is much more evenly distributed across Europe; as regards the total quantity, over a third of cow’s milk was produced in both Germany and France (36% of total EU-27 production). The highest quantity of cow’s milk per person was produced in Ireland (1,196 kg), followed by Denmark (885 kg) and the Netherlands (719 kg); the EU-27 average was 297 kg per person and the average in Slovenia was 295. The least milk per person was produced in Greece (66 kg), where more than 60% of total milk produced was sheep and goat’s milk. More: Chart 29.
4.3 Size structure of AH with livestock
LIVESTOCK OUTPUT 35AGRICULTURE IN SLOVENIA AND IN THE REST OF THE EU
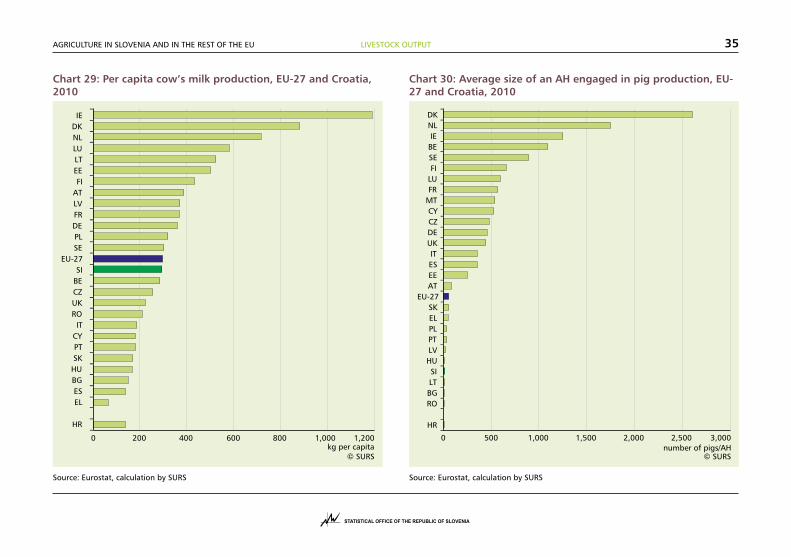
Chart 29: Per capita cow’s milk production, EU-27 and Croatia, 2010
Source: Eurostat, calculation by SURS
Chart 30: Average size of an AH engaged in pig production, EU-27 and Croatia, 2010
Source: Eurostat, calculation by SURS
LIVESTOCK OUTPUT 36 AGRICULTURE IN SLOVENIA AND IN THE REST OF THE EU
On average 14 pigs per pig-producing agricultural holding in SloveniaIn 2010 there were 2.8 million pig-producing AH in the EU-27, 60% of them (almost 1.7 million) in Romania. All pig-producing AH together bred around 152 million pigs, which is on average 55 pigs per AH. In Denmark pig-producing AH bred on average around 2,600 pigs and in Romania only 3 pigs. In 2010, 34% of all pigs in the EU-27 were produced in Germany and Spain. As regards the size of country by population, Denmark stood out with 237 pigs per 100 population. The EU-27 average was 30 and in Slovenia 19 pigs per 100 population.
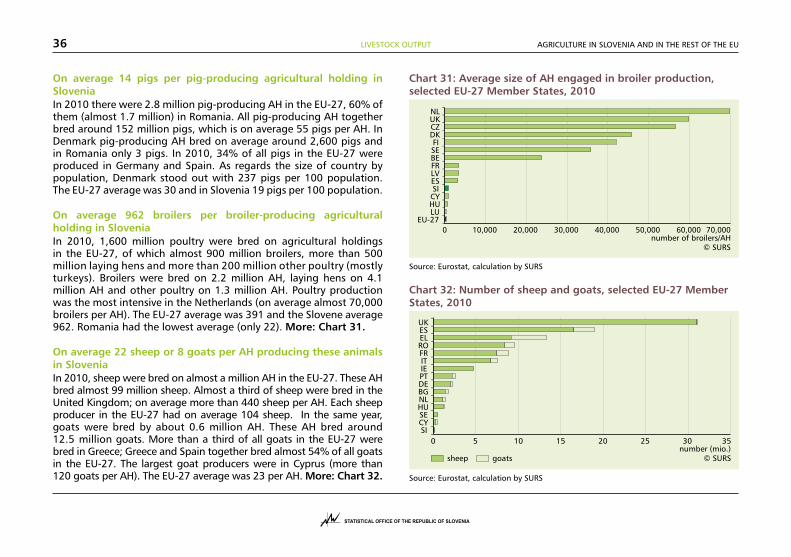
On average 962 broilers per broiler-producing agricultural holding in SloveniaIn 2010, 1,600 million poultry were bred on agricultural holdings in the EU-27, of which almost 900 million broilers, more than 500 million laying hens and more than 200 million other poultry (mostly turkeys). Broilers were bred on 2.2 million AH, laying hens on 4.1 million AH and other poultry on 1.3 million AH. Poultry production was the most intensive in the Netherlands (on average almost 70,000 broilers per AH). The EU-27 average was 391 and the Slovene average 962. Romania had the lowest average (only 22). More: Chart 31.
On average 22 sheep or 8 goats per AH producing these animals in SloveniaIn 2010, sheep were bred on almost a million AH in the EU-27. These AH bred almost 99 million sheep. Almost a third of sheep were bred in the United Kingdom; on average more than 440 sheep per AH. Each sheep producer in the EU-27 had on average 104 sheep. In the same year, goats were bred by about 0.6 million AH. These AH bred around 12.5 million goats. More than a third of all goats in the EU-27 were bred in Greece; Greece and Spain together bred almost 54% of all goats in the EU-27. The largest goat producers were in Cyprus (more than 120 goats per AH). The EU-27 average was 23 per AH. More: Chart 32.
Chart 31: Average size of AH engaged in broiler production, selected EU-27 Member States, 2010
Source: Eurostat, calculation by SURS
Chart 32: Number of sheep and goats, selected EU-27 Member States, 2010
Source: Eurostat, calculation by SURS
LIVESTOCK OUTPUT 37AGRICULTURE IN SLOVENIA AND IN THE REST OF THE EU
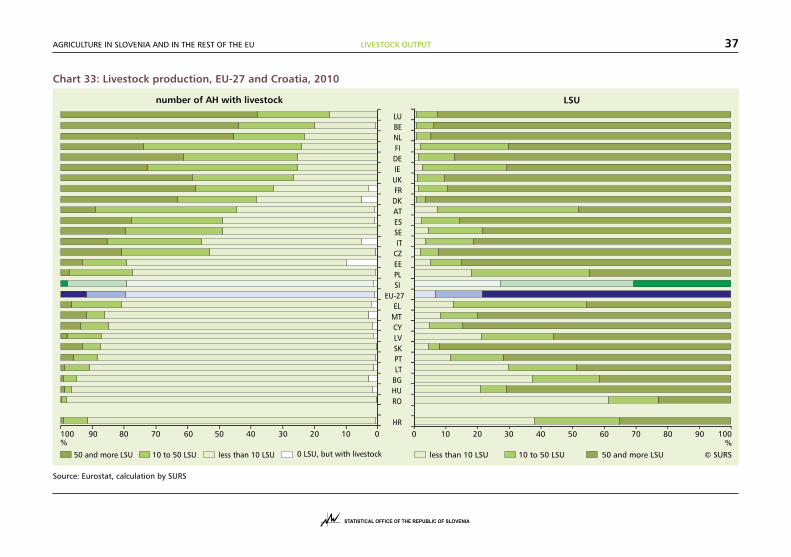
Chart 33: Livestock production, EU-27 and Croatia, 2010
Source: Eurostat, calculation by SURS
LIVESTOCK OUTPUT 38 AGRICULTURE IN SLOVENIA AND IN THE REST OF THE EU
In Slovenia almost 69% of all livestock was bred on AH with fewer than 50 LSU Small livestock-producing AH (with fewer than 10 LSU) bred 7% of all LSU in the EU-27. In Belgium, Denmark, the Netherlands and Luxembourg small livestock-producing AH bred less than 1% of all LSU in the country, while the share in Romania was over 61%. In Slovenia it was 27% and was thus the fourth highest in the EU-27 (behind Romania, Bulgaria and Lithuania).
On the largest livestock-producing AH (with 50 or more LSU) the situation was exactly the opposite; in Denmark, the Netherlands, Belgium and Luxembourg 93%–96% of total LSU in the countries were bred by these AH; the lowest shares of total national livestock production were recorded on large AH in Romania (23%) and Slovenia (31%).
As regards the share of the smallest livestock-producing AH, Slovenia is comparable to the EU-27 In 2010, the highest share of small livestock-producing AH (with fewer than 10 LSU) was recorded in Romania (98%), followed by Hungary with 95%. With 78%, Slovenia ranked around the middle of EU-27 Member States. In Belgium and Luxembourg fewer than 20% of livestock-producing AH had fewer than 10 LSU. The EU-27 average was 79%.
In Slovenia only 2% of livestock-producing AH are large (with 50 or more LSU)The highest shares of large livestock-producing AH were recorded in Luxembourg (62%) and Belgium (56%) and the lowest in Romania, Bulgaria and Hungary (less than 1%). The share in Slovenia was 2% of all livestock-producing AH.
AGRICULTURE IN SLOVENIA AND IN THE REST OF THE EU 39
5 REGULAR LABOUR FORCE ON AGRICULTURAL HOLDINGS
5.1 Number of persons working regularly on agricultural holdings
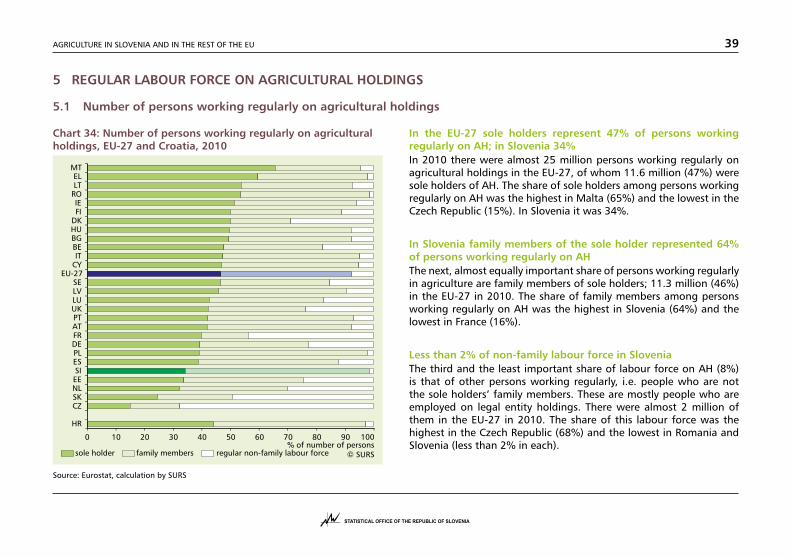
Chart 34: Number of persons working regularly on agricultural holdings, EU-27 and Croatia, 2010
Source: Eurostat, calculation by SURS
In the EU-27 sole holders represent 47% of persons working regularly on AH; in Slovenia 34%In 2010 there were almost 25 million persons working regularly on agricultural holdings in the EU-27, of whom 11.6 million (47%) were sole holders of AH. The share of sole holders among persons working regularly on AH was the highest in Malta (65%) and the lowest in the Czech Republic (15%). In Slovenia it was 34%.
In Slovenia family members of the sole holder represented 64% of persons working regularly on AH The next, almost equally important share of persons working regularly in agriculture are family members of sole holders; 11.3 million (46%) in the EU-27 in 2010. The share of family members among persons working regularly on AH was the highest in Slovenia (64%) and the lowest in France (16%).
Less than 2% of non-family labour force in Slovenia The third and the least important share of labour force on AH (8%) is that of other persons working regularly, i.e. people who are not the sole holders’ family members. These are mostly people who are employed on legal entity holdings. There were almost 2 million of them in the EU-27 in 2010. The share of this labour force was the highest in the Czech Republic (68%) and the lowest in Romania and Slovenia (less than 2% in each).
REGULAR LABOUR FORCE ON AGRICULTURAL HOLDINGS 40 AGRICULTURE IN SLOVENIA AND IN THE REST OF THE EU
5.2 Women in regular labour force on agricultural holdings
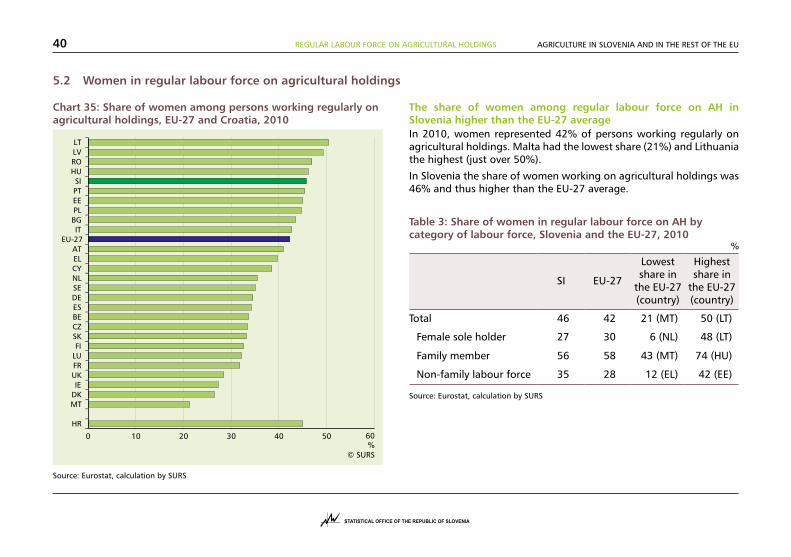
Chart 35: Share of women among persons working regularly on agricultural holdings, EU-27 and Croatia, 2010
Source: Eurostat, calculation by SURS
The share of women among regular labour force on AH in Slovenia higher than the EU-27 averageIn 2010, women represented 42% of persons working regularly on agricultural holdings. Malta had the lowest share (21%) and Lithuania the highest (just over 50%).
In Slovenia the share of women working on agricultural holdings was 46% and thus higher than the EU-27 average.
Table 3: Share of women in regular labour force on AH by category of labour force, Slovenia and the EU-27, 2010 %
SI EU-27
Lowest share in
the EU-27 (country)
Highest share in
the EU-27 (country)
Total 46 42 21 (MT) 50 (LT)
Female sole holder 27 30 6 (NL) 48 (LT)
Family member 56 58 43 (MT) 74 (HU)
Non-family labour force 35 28 12 (EL) 42 (EE)
Source: Eurostat, calculation by SURS
REGULAR LABOUR FORCE ON AGRICULTURAL HOLDINGS 41AGRICULTURE IN SLOVENIA AND IN THE REST OF THE EU
5.3 Labour input on agricultural holdings (AWU)
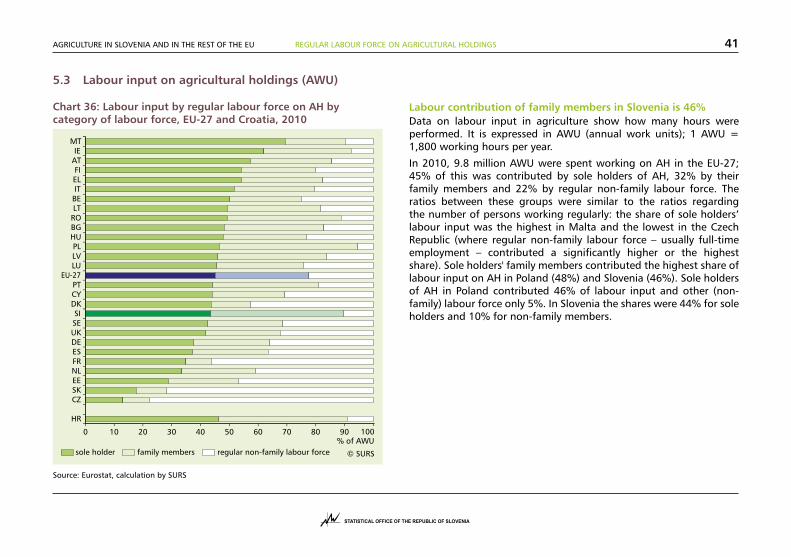
Chart 36: Labour input by regular labour force on AH by category of labour force, EU-27 and Croatia, 2010
Source: Eurostat, calculation by SURS
Labour contribution of family members in Slovenia is 46%Data on labour input in agriculture show how many hours were performed. It is expressed in AWU (annual work units); 1 AWU = 1,800 working hours per year.
In 2010, 9.8 million AWU were spent working on AH in the EU-27; 45% of this was contributed by sole holders of AH, 32% by their family members and 22% by regular non-family labour force. The ratios between these groups were similar to the ratios regarding the number of persons working regularly: the share of sole holders’ labour input was the highest in Malta and the lowest in the Czech Republic (where regular non-family labour force – usually full-time employment – contributed a significantly higher or the highest share). Sole holders' family members contributed the highest share of labour input on AH in Poland (48%) and Slovenia (46%). Sole holders of AH in Poland contributed 46% of labour input and other (non-family) labour force only 5%. In Slovenia the shares were 44% for sole holders and 10% for non-family members.
REGULAR LABOUR FORCE ON AGRICULTURAL HOLDINGS 42 AGRICULTURE IN SLOVENIA AND IN THE REST OF THE EU
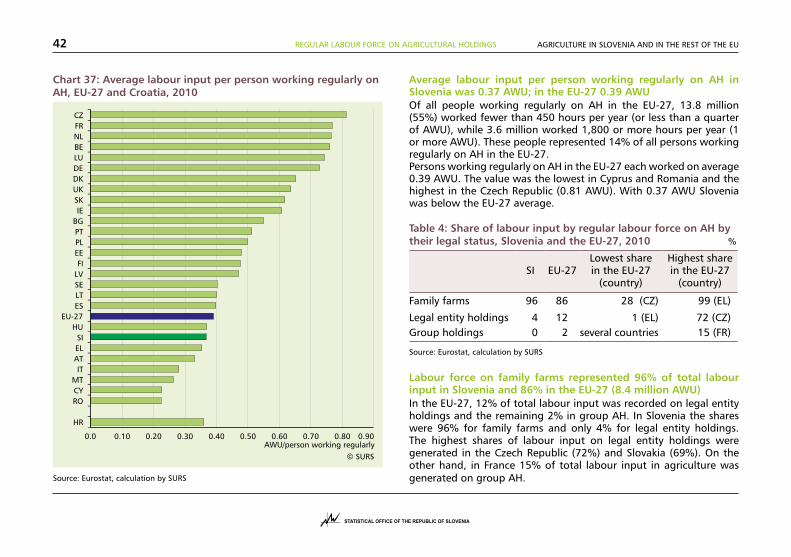
Chart 37: Average labour input per person working regularly on AH, EU-27 and Croatia, 2010
Source: Eurostat, calculation by SURS
Average labour input per person working regularly on AH in Slovenia was 0.37 AWU; in the EU-27 0.39 AWUOf all people working regularly on AH in the EU-27, 13.8 million (55%) worked fewer than 450 hours per year (or less than a quarter of AWU), while 3.6 million worked 1,800 or more hours per year (1 or more AWU). These people represented 14% of all persons working regularly on AH in the EU-27. Persons working regularly on AH in the EU-27 each worked on average 0.39 AWU. The value was the lowest in Cyprus and Romania and the highest in the Czech Republic (0.81 AWU). With 0.37 AWU Slovenia was below the EU-27 average.
Table 4: Share of labour input by regular labour force on AH by their legal status, Slovenia and the EU-27, 2010 %
SI EU-27Lowest share in the EU-27
(country)
Highest share in the EU-27
(country)
Family farms 96 86 28 (CZ) 99 (EL)
Legal entity holdings 4 12 1 (EL) 72 (CZ)Group holdings 0 2 several countries 15 (FR)
Source: Eurostat, calculation by SURS
Labour force on family farms represented 96% of total labour input in Slovenia and 86% in the EU-27 (8.4 million AWU)In the EU-27, 12% of total labour input was recorded on legal entity holdings and the remaining 2% in group AH. In Slovenia the shares were 96% for family farms and only 4% for legal entity holdings. The highest shares of labour input on legal entity holdings were generated in the Czech Republic (72%) and Slovakia (69%). On the other hand, in France 15% of total labour input in agriculture was generated on group AH.
REGULAR LABOUR FORCE ON AGRICULTURAL HOLDINGS 43AGRICULTURE IN SLOVENIA AND IN THE REST OF THE EU
5.4 Age and educational structure of managers of AH
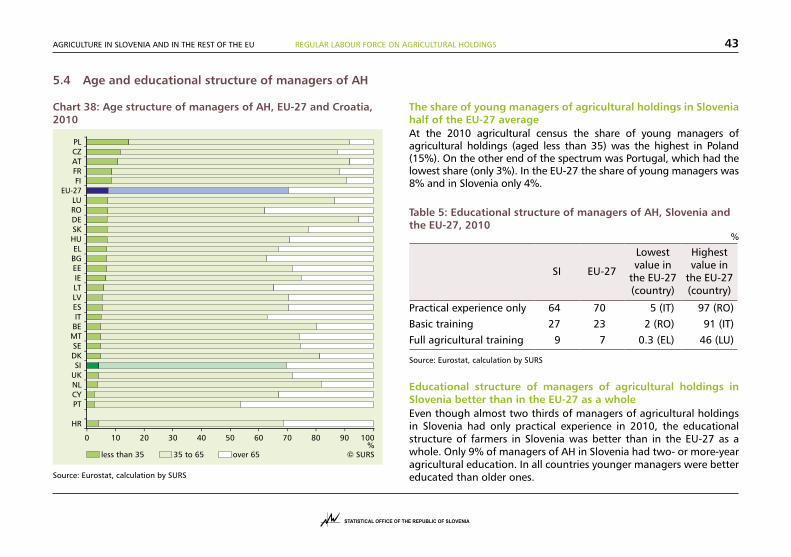
Chart 38: Age structure of managers of AH, EU-27 and Croatia, 2010
Source: Eurostat, calculation by SURS
The share of young managers of agricultural holdings in Slovenia half of the EU-27 averageAt the 2010 agricultural census the share of young managers of agricultural holdings (aged less than 35) was the highest in Poland (15%). On the other end of the spectrum was Portugal, which had the lowest share (only 3%). In the EU-27 the share of young managers was 8% and in Slovenia only 4%.
Table 5: Educational structure of managers of AH, Slovenia and the EU-27, 2010 %
SI EU-27
Lowest value in
the EU-27 (country)
Highest value in
the EU-27 (country)
Practical experience only 64 70 5 (IT) 97 (RO)
Basic training 27 23 2 (RO) 91 (IT)
Full agricultural training 9 7 0.3 (EL) 46 (LU)
Source: Eurostat, calculation by SURS
Educational structure of managers of agricultural holdings in Slovenia better than in the EU-27 as a wholeEven though almost two thirds of managers of agricultural holdings in Slovenia had only practical experience in 2010, the educational structure of farmers in Slovenia was better than in the EU-27 as a whole. Only 9% of managers of AH in Slovenia had two- or more-year agricultural education. In all countries younger managers were better educated than older ones.
REGULAR LABOUR FORCE ON AGRICULTURAL HOLDINGS 44 AGRICULTURE IN SLOVENIA AND IN THE REST OF THE EU
5.5 Factor income per employee in agriculture
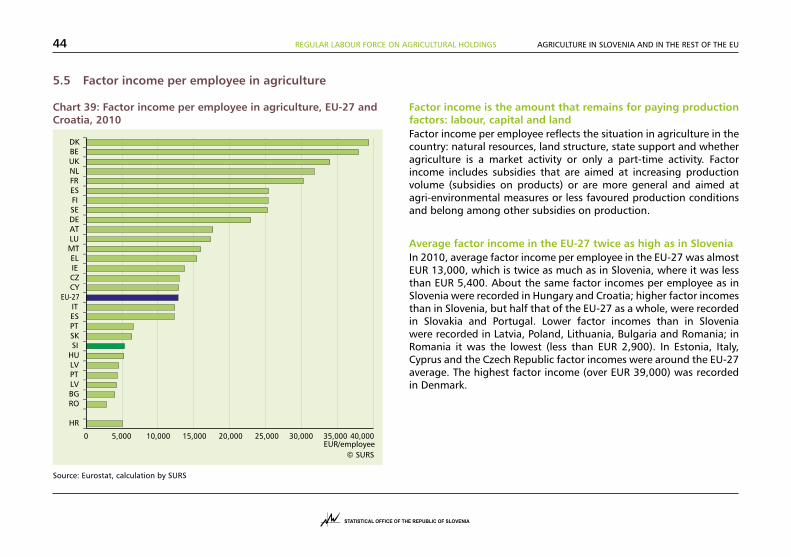
Chart 39: Factor income per employee in agriculture, EU-27 and Croatia, 2010
Source: Eurostat, calculation by SURS
Factor income is the amount that remains for paying production factors: labour, capital and land Factor income per employee reflects the situation in agriculture in the country: natural resources, land structure, state support and whether agriculture is a market activity or only a part-time activity. Factor income includes subsidies that are aimed at increasing production volume (subsidies on products) or are more general and aimed at agri-environmental measures or less favoured production conditions and belong among other subsidies on production.
Average factor income in the EU-27 twice as high as in SloveniaIn 2010, average factor income per employee in the EU-27 was almost EUR 13,000, which is twice as much as in Slovenia, where it was less than EUR 5,400. About the same factor incomes per employee as in Slovenia were recorded in Hungary and Croatia; higher factor incomes than in Slovenia, but half that of the EU-27 as a whole, were recorded in Slovakia and Portugal. Lower factor incomes than in Slovenia were recorded in Latvia, Poland, Lithuania, Bulgaria and Romania; in Romania it was the lowest (less than EUR 2,900). In Estonia, Italy, Cyprus and the Czech Republic factor incomes were around the EU-27 average. The highest factor income (over EUR 39,000) was recorded in Denmark.
REGULAR LABOUR FORCE ON AGRICULTURAL HOLDINGS 45AGRICULTURE IN SLOVENIA AND IN THE REST OF THE EU
5.6 Subsidies in agriculture
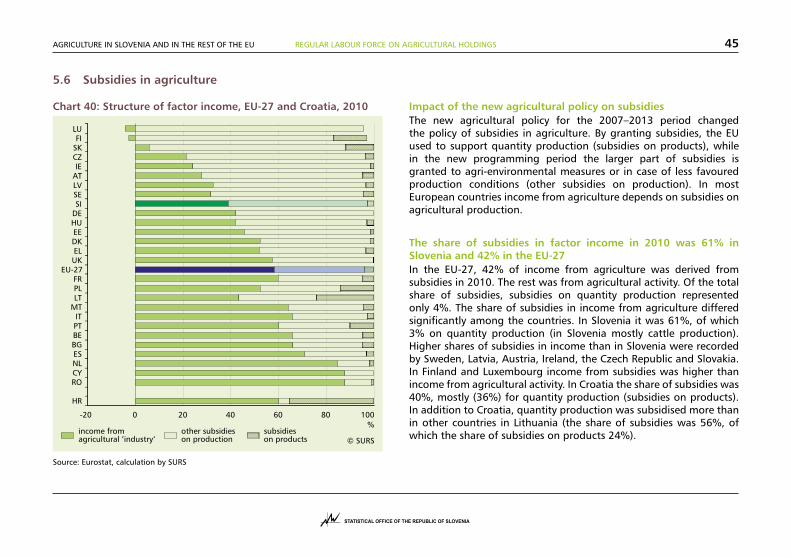
Chart 40: Structure of factor income, EU-27 and Croatia, 2010
Source: Eurostat, calculation by SURS
Impact of the new agricultural policy on subsidies The new agricultural policy for the 2007–2013 period changed the policy of subsidies in agriculture. By granting subsidies, the EU used to support quantity production (subsidies on products), while in the new programming period the larger part of subsidies is granted to agri-environmental measures or in case of less favoured production conditions (other subsidies on production). In most European countries income from agriculture depends on subsidies on agricultural production.
The share of subsidies in factor income in 2010 was 61% in Slovenia and 42% in the EU-27In the EU-27, 42% of income from agriculture was derived from subsidies in 2010. The rest was from agricultural activity. Of the total share of subsidies, subsidies on quantity production represented only 4%. The share of subsidies in income from agriculture differed significantly among the countries. In Slovenia it was 61%, of which 3% on quantity production (in Slovenia mostly cattle production). Higher shares of subsidies in income than in Slovenia were recorded by Sweden, Latvia, Austria, Ireland, the Czech Republic and Slovakia. In Finland and Luxembourg income from subsidies was higher than income from agricultural activity. In Croatia the share of subsidies was 40%, mostly (36%) for quantity production (subsidies on products). In addition to Croatia, quantity production was subsidised more than in other countries in Lithuania (the share of subsidies was 56%, of which the share of subsidies on products 24%).
AGRICULTURE IN SLOVENIA AND IN THE REST OF THE EU46
6 ORGANIC AGRICULTURE
6.1 Number of agricultural holdings with organic farming
Chart 41: Agricultural holdings with organic farming, EU-27 and Croatia, 2010
Source: Eurostat, calculation by SURS
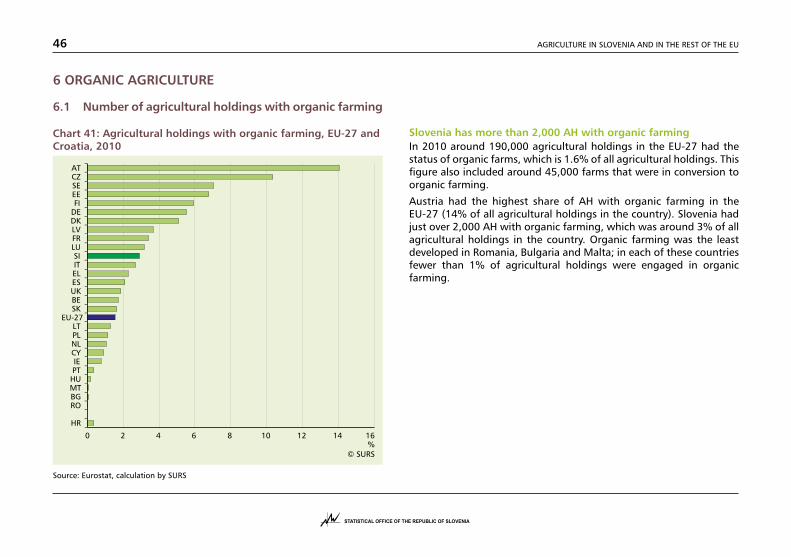
Slovenia has more than 2,000 AH with organic farming In 2010 around 190,000 agricultural holdings in the EU-27 had the status of organic farms, which is 1.6% of all agricultural holdings. This figure also included around 45,000 farms that were in conversion to organic farming.
Austria had the highest share of AH with organic farming in the EU-27 (14% of all agricultural holdings in the country). Slovenia had just over 2,000 AH with organic farming, which was around 3% of all agricultural holdings in the country. Organic farming was the least developed in Romania, Bulgaria and Malta; in each of these countries fewer than 1% of agricultural holdings were engaged in organic farming.
ORGANIC AGRICULTURE 47AGRICULTURE IN SLOVENIA AND IN THE REST OF THE EU
6.2 Organic area in total UAA
Chart 42: Organic area in total UAA, EU-27 and Croatia, 2010
Source: Eurostat, calculation by SURS
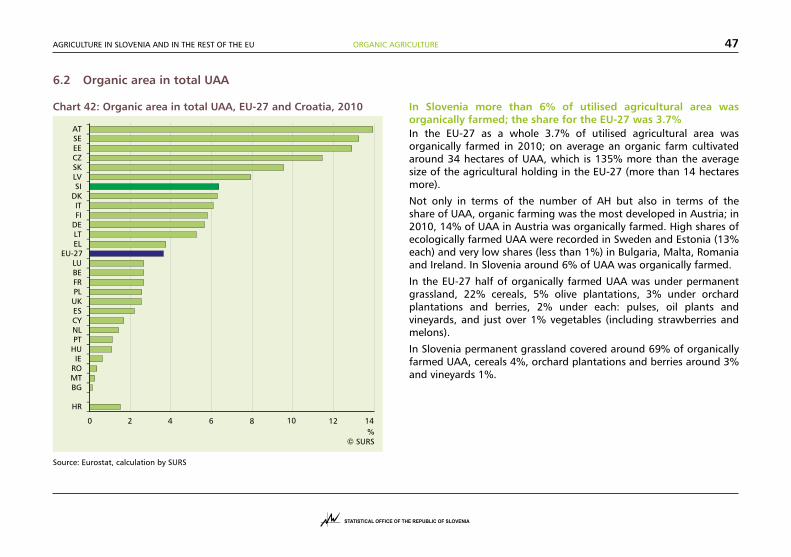
In Slovenia more than 6% of utilised agricultural area was organically farmed; the share for the EU-27 was 3.7%In the EU-27 as a whole 3.7% of utilised agricultural area was organically farmed in 2010; on average an organic farm cultivated around 34 hectares of UAA, which is 135% more than the average size of the agricultural holding in the EU-27 (more than 14 hectares more).
Not only in terms of the number of AH but also in terms of the share of UAA, organic farming was the most developed in Austria; in 2010, 14% of UAA in Austria was organically farmed. High shares of ecologically farmed UAA were recorded in Sweden and Estonia (13% each) and very low shares (less than 1%) in Bulgaria, Malta, Romania and Ireland. In Slovenia around 6% of UAA was organically farmed.
In the EU-27 half of organically farmed UAA was under permanent grassland, 22% cereals, 5% olive plantations, 3% under orchard plantations and berries, 2% under each: pulses, oil plants and vineyards, and just over 1% vegetables (including strawberries and melons).
In Slovenia permanent grassland covered around 69% of organically farmed UAA, cereals 4%, orchard plantations and berries around 3% and vineyards 1%.
ORGANIC AGRICULTURE 48 AGRICULTURE IN SLOVENIA AND IN THE REST OF THE EU
6.3 Organic livestock production
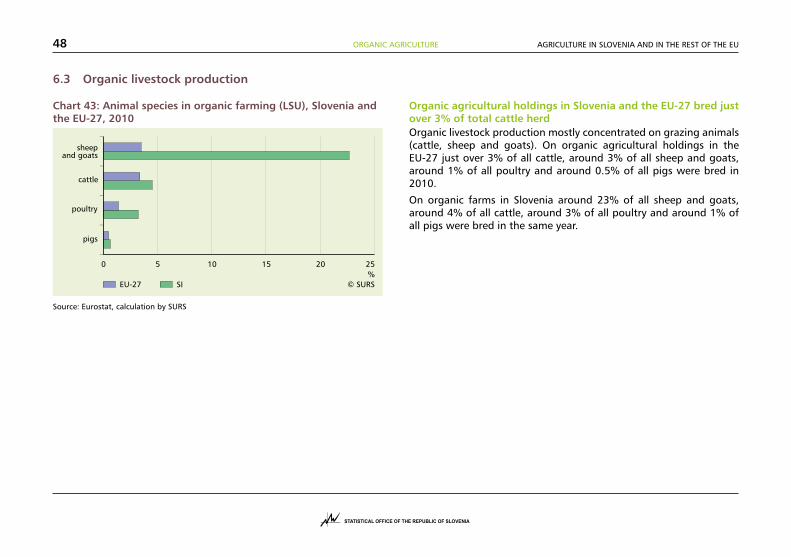
Chart 43: Animal species in organic farming (LSU), Slovenia and the EU-27, 2010
Source: Eurostat, calculation by SURS
Organic agricultural holdings in Slovenia and the EU-27 bred just over 3% of total cattle herd Organic livestock production mostly concentrated on grazing animals (cattle, sheep and goats). On organic agricultural holdings in the EU-27 just over 3% of all cattle, around 3% of all sheep and goats, around 1% of all poultry and around 0.5% of all pigs were bred in 2010.
On organic farms in Slovenia around 23% of all sheep and goats, around 4% of all cattle, around 3% of all poultry and around 1% of all pigs were bred in the same year.
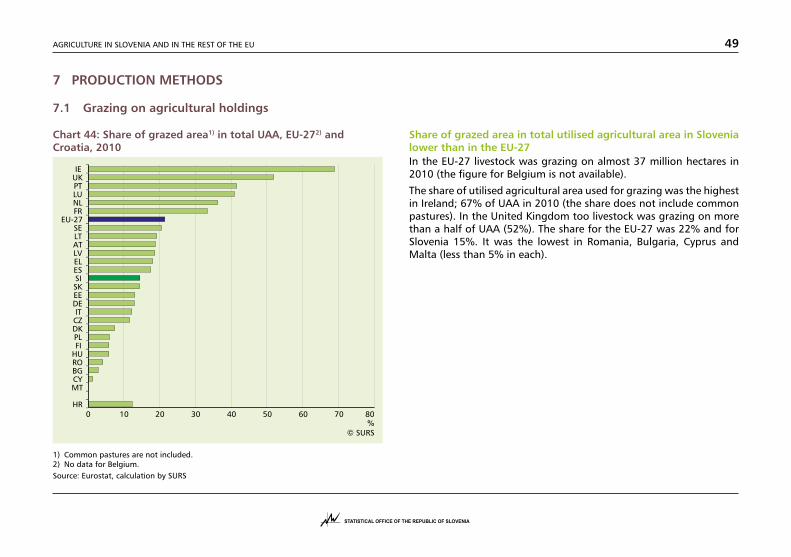
AGRICULTURE IN SLOVENIA AND IN THE REST OF THE EU 49
7 PRODUCTION METHODS
7.1 Grazing on agricultural holdings
Chart 44: Share of grazed area1) in total UAA, EU-272) and Croatia, 2010
1) Common pastures are not included.2) No data for Belgium.Source: Eurostat, calculation by SURS
Share of grazed area in total utilised agricultural area in Slovenia lower than in the EU-27 In the EU-27 livestock was grazing on almost 37 million hectares in 2010 (the figure for Belgium is not available).
The share of utilised agricultural area used for grazing was the highest in Ireland; 67% of UAA in 2010 (the share does not include common pastures). In the United Kingdom too livestock was grazing on more than a half of UAA (52%). The share for the EU-27 was 22% and for Slovenia 15%. It was the lowest in Romania, Bulgaria, Cyprus and Malta (less than 5% in each).
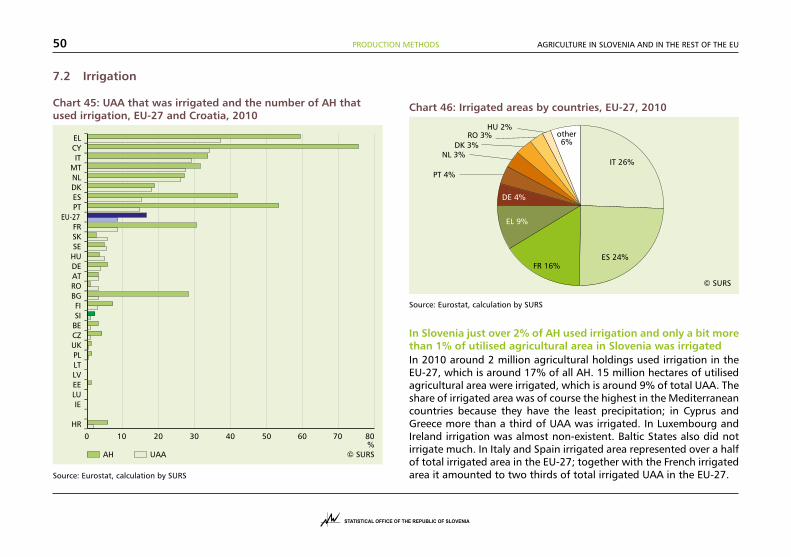
PRODUCTION METHODS 50 AGRICULTURE IN SLOVENIA AND IN THE REST OF THE EU
7.2 Irrigation
Chart 45: UAA that was irrigated and the number of AH that used irrigation, EU-27 and Croatia, 2010
Source: Eurostat, calculation by SURS
Chart 46: Irrigated areas by countries, EU-27, 2010
Source: Eurostat, calculation by SURS
In Slovenia just over 2% of AH used irrigation and only a bit more than 1% of utilised agricultural area in Slovenia was irrigated In 2010 around 2 million agricultural holdings used irrigation in the EU-27, which is around 17% of all AH. 15 million hectares of utilised agricultural area were irrigated, which is around 9% of total UAA. The share of irrigated area was of course the highest in the Mediterranean countries because they have the least precipitation; in Cyprus and Greece more than a third of UAA was irrigated. In Luxembourg and Ireland irrigation was almost non-existent. Baltic States also did not irrigate much. In Italy and Spain irrigated area represented over a half of total irrigated area in the EU-27; together with the French irrigated area it amounted to two thirds of total irrigated UAA in the EU-27.
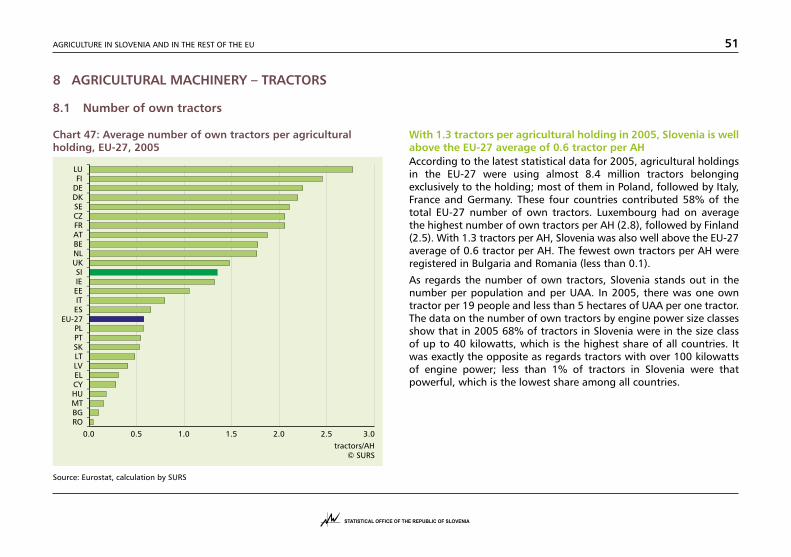
AGRICULTURE IN SLOVENIA AND IN THE REST OF THE EU 51
8 AGRICULTURAL MACHINERY – TRACTORS
8.1 Number of own tractors
Chart 47: Average number of own tractors per agricultural holding, EU-27, 2005
Source: Eurostat, calculation by SURS
With 1.3 tractors per agricultural holding in 2005, Slovenia is well above the EU-27 average of 0.6 tractor per AHAccording to the latest statistical data for 2005, agricultural holdings in the EU-27 were using almost 8.4 million tractors belonging exclusively to the holding; most of them in Poland, followed by Italy, France and Germany. These four countries contributed 58% of the total EU-27 number of own tractors. Luxembourg had on average the highest number of own tractors per AH (2.8), followed by Finland (2.5). With 1.3 tractors per AH, Slovenia was also well above the EU-27 average of 0.6 tractor per AH. The fewest own tractors per AH were registered in Bulgaria and Romania (less than 0.1).
As regards the number of own tractors, Slovenia stands out in the number per population and per UAA. In 2005, there was one own tractor per 19 people and less than 5 hectares of UAA per one tractor. The data on the number of own tractors by engine power size classes show that in 2005 68% of tractors in Slovenia were in the size class of up to 40 kilowatts, which is the highest share of all countries. It was exactly the opposite as regards tractors with over 100 kilowatts of engine power; less than 1% of tractors in Slovenia were that powerful, which is the lowest share among all countries.
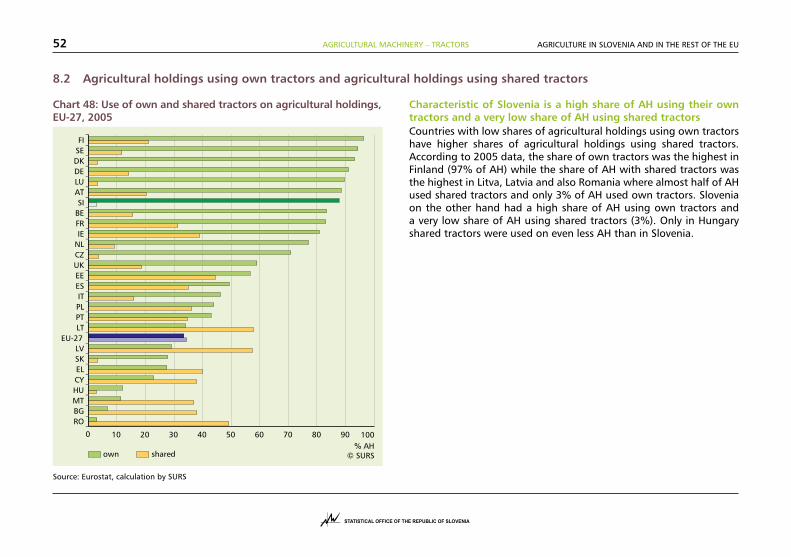
AGRICULTURAL MACHINERY – TRACTORS52 AGRICULTURE IN SLOVENIA AND IN THE REST OF THE EU
8.2 Agricultural holdings using own tractors and agricultural holdings using shared tractors
Chart 48: Use of own and shared tractors on agricultural holdings, EU-27, 2005
Source: Eurostat, calculation by SURS
Characteristic of Slovenia is a high share of AH using their own tractors and a very low share of AH using shared tractors Countries with low shares of agricultural holdings using own tractors have higher shares of agricultural holdings using shared tractors. According to 2005 data, the share of own tractors was the highest in Finland (97% of AH) while the share of AH with shared tractors was the highest in Litva, Latvia and also Romania where almost half of AH used shared tractors and only 3% of AH used own tractors. Slovenia on the other hand had a high share of AH using own tractors and a very low share of AH using shared tractors (3%). Only in Hungary shared tractors were used on even less AH than in Slovenia.
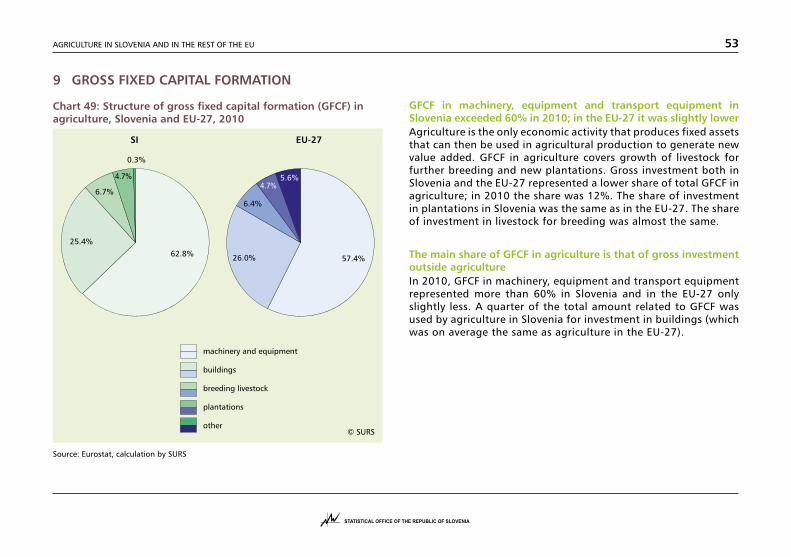
AGRICULTURE IN SLOVENIA AND IN THE REST OF THE EU 53
9 GROSS FIXED CAPITAL FORMATION
Chart 49: Structure of gross fixed capital formation (GFCF) in agriculture, Slovenia and EU-27, 2010
Source: Eurostat, calculation by SURS
GFCF in machinery, equipment and transport equipment in Slovenia exceeded 60% in 2010; in the EU-27 it was slightly lowerAgriculture is the only economic activity that produces fixed assets that can then be used in agricultural production to generate new value added. GFCF in agriculture covers growth of livestock for further breeding and new plantations. Gross investment both in Slovenia and the EU-27 represented a lower share of total GFCF in agriculture; in 2010 the share was 12%. The share of investment in plantations in Slovenia was the same as in the EU-27. The share of investment in livestock for breeding was almost the same.
The main share of GFCF in agriculture is that of gross investment outside agriculture In 2010, GFCF in machinery, equipment and transport equipment represented more than 60% in Slovenia and in the EU-27 only slightly less. A quarter of the total amount related to GFCF was used by agriculture in Slovenia for investment in buildings (which was on average the same as agriculture in the EU-27).
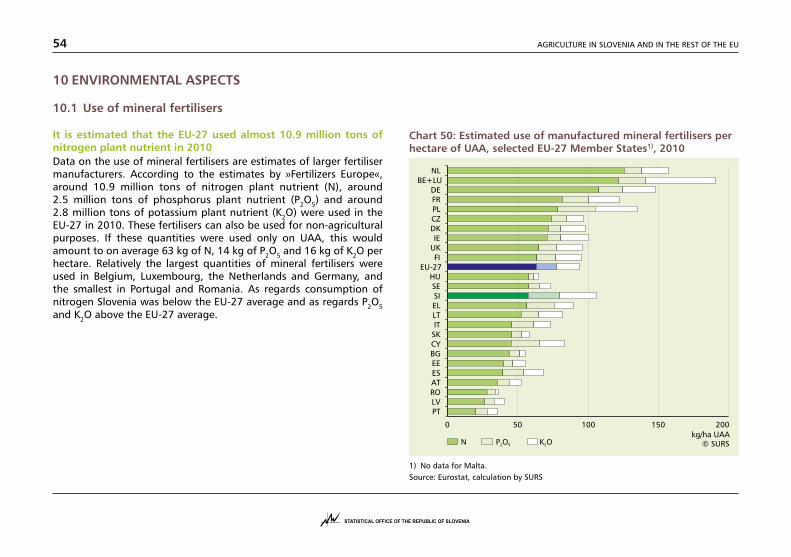
AGRICULTURE IN SLOVENIA AND IN THE REST OF THE EU54
10 ENVIRONMENTAL ASPECTS
10.1 Use of mineral fertilisers
It is estimated that the EU-27 used almost 10.9 million tons of nitrogen plant nutrient in 2010Data on the use of mineral fertilisers are estimates of larger fertiliser manufacturers. According to the estimates by »Fertilizers Europe«, around 10.9 million tons of nitrogen plant nutrient (N), around 2.5 million tons of phosphorus plant nutrient (P2O5) and around 2.8 million tons of potassium plant nutrient (K2O) were used in the EU-27 in 2010. These fertilisers can also be used for non-agricultural purposes. If these quantities were used only on UAA, this would amount to on average 63 kg of N, 14 kg of P2O5 and 16 kg of K2O per hectare. Relatively the largest quantities of mineral fertilisers were used in Belgium, Luxembourg, the Netherlands and Germany, and the smallest in Portugal and Romania. As regards consumption of nitrogen Slovenia was below the EU-27 average and as regards P2O5 and K2O above the EU-27 average.
Chart 50: Estimated use of manufactured mineral fertilisers per hectare of UAA, selected EU-27 Member States1), 2010
1) No data for Malta. Source: Eurostat, calculation by SURS
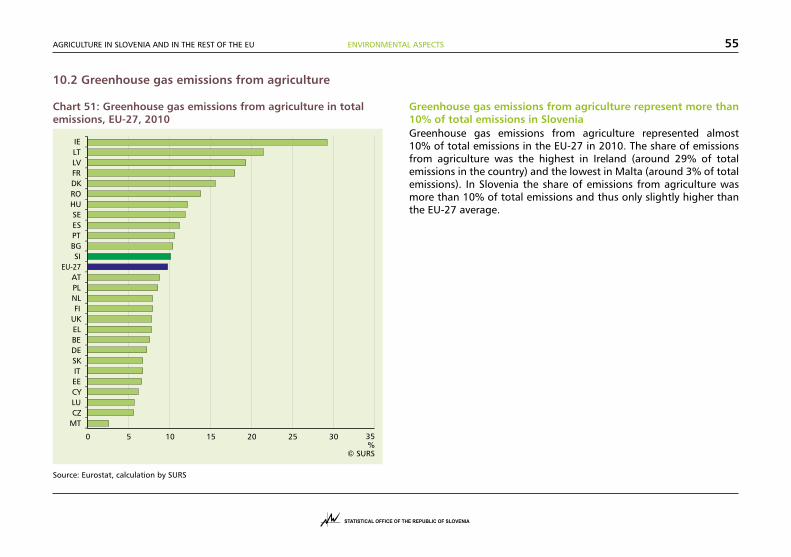
ENVIRONMENTAL ASPECTS 55AGRICULTURE IN SLOVENIA AND IN THE REST OF THE EU
10.2 Greenhouse gas emissions from agriculture
Chart 51: Greenhouse gas emissions from agriculture in total emissions, EU-27, 2010
Source: Eurostat, calculation by SURS
Greenhouse gas emissions from agriculture represent more than 10% of total emissions in SloveniaGreenhouse gas emissions from agriculture represented almost 10% of total emissions in the EU-27 in 2010. The share of emissions from agriculture was the highest in Ireland (around 29% of total emissions in the country) and the lowest in Malta (around 3% of total emissions). In Slovenia the share of emissions from agriculture was more than 10% of total emissions and thus only slightly higher than the EU-27 average.
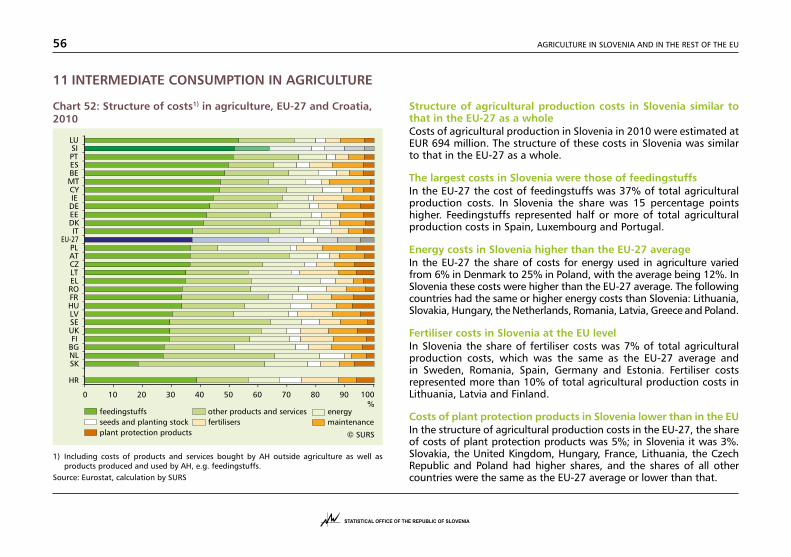
AGRICULTURE IN SLOVENIA AND IN THE REST OF THE EU56
11 INTERMEDIATE CONSUMPTION IN AGRICULTURE
Chart 52: Structure of costs1) in agriculture, EU-27 and Croatia, 2010
1) Including costs of products and services bought by AH outside agriculture as well as products produced and used by AH, e.g. feedingstuffs.
Source: Eurostat, calculation by SURS
Structure of agricultural production costs in Slovenia similar to that in the EU-27 as a wholeCosts of agricultural production in Slovenia in 2010 were estimated at EUR 694 million. The structure of these costs in Slovenia was similar to that in the EU-27 as a whole.
The largest costs in Slovenia were those of feedingstuffsIn the EU-27 the cost of feedingstuffs was 37% of total agricultural production costs. In Slovenia the share was 15 percentage points higher. Feedingstuffs represented half or more of total agricultural production costs in Spain, Luxembourg and Portugal.
Energy costs in Slovenia higher than the EU-27 averageIn the EU-27 the share of costs for energy used in agriculture varied from 6% in Denmark to 25% in Poland, with the average being 12%. In Slovenia these costs were higher than the EU-27 average. The following countries had the same or higher energy costs than Slovenia: Lithuania, Slovakia, Hungary, the Netherlands, Romania, Latvia, Greece and Poland.
Fertiliser costs in Slovenia at the EU level In Slovenia the share of fertiliser costs was 7% of total agricultural production costs, which was the same as the EU-27 average and in Sweden, Romania, Spain, Germany and Estonia. Fertiliser costs represented more than 10% of total agricultural production costs in Lithuania, Latvia and Finland.
Costs of plant protection products in Slovenia lower than in the EUIn the structure of agricultural production costs in the EU-27, the share of costs of plant protection products was 5%; in Slovenia it was 3%. Slovakia, the United Kingdom, Hungary, France, Lithuania, the Czech Republic and Poland had higher shares, and the shares of all other countries were the same as the EU-27 average or lower than that.