Embed Size (px)
Citation preview
Page 1/16
Economic Impact of Neem Coated Urea on IndianAgriculture: Evidence from a Benchmark StudyRamappa Kumsher Basavarajappa ( [email protected] )
Central Agricultural University https://orcid.org/0000-0001-6407-5026Vilas Jadhav
Agricultural Development and Rural Transformation Centre [ADRTC]A.V Manjunatha
Agricultural Development and Rural Transformation Centre [ADRTC]
Research Article
Keywords: Partial budgeting Technique, Impact of NCU on crop yield and income, Sustainable Agriculture.
Posted Date: June 11th, 2021
DOI: https://doi.org/10.21203/rs.3.rs-575502/v1
License: This work is licensed under a Creative Commons Attribution 4.0 International License. ReadFull License

Page 2/16
AbstractThe policy of mandatory production and distribution of Neem Coated Urea (NCU) from May 2015, with afocussed attention on improving the soil quality through a judicious use of fertilizers seems to be in the rightdirection, considering the bene�ts realized so far by the Indian farming community. In this article, authors havemade an attempt to explore the bene�ts recognized by the producers of six major crops such as paddy, maize,sugarcane, tur, jute and soybean across the six major states viz., Karnataka, Maharashtra, Madhya Pradesh,Bihar, Punjab and Assam with 2200 sample households. The reference period of the study was the immediateseason (Kharif 2015) post the NCU production. The results reveal that NCU use has contributed positively interms of increasing the yield levels of both main product and by-products with regard to almost all thereference crops under study. However, the extent varies from crop to crop, highest being in the case of soybean,followed by tur, maize, sugarcane, paddy and jute. While the net returns are highest in respect of tur, followedby paddy. As regards B:C ratio, tur tops the list subsequent to sugarcane, paddy, soybean, maize and jute.Moreover, NCU has helped reduce the cost of production by minimizing the cost of urea as well as of otherfertilizers and pesticides usage. Interestingly, the diversion of urea has stopped completely, post the productionand distribution of NCU. Hence, it is concluded that the application of NCU has a positive impact on Indianagriculture, by way of increasing yield levels & returns for the farming community. These results are in line withthe PM's vision of doubling farmers’ income by 2022 and Sustainable Development Goals of the Country.
1. IntroductionIt is a well-recognized fact that Indian agriculture sector growth was completely sluggish or say even declinedin the entire �rst half of the 20th century (Blyn, 1966; Bardhan, 1984) during the British colonial period, whereas,this prototype was reversed post-independence (1947). The introduction of major food grains such as cerealsand pulses registered a higher growth at 4.13 per cent during the �rst decade of independence i.e., 1951-52 to1960-61 (Bhaduri, 1973; Kurosaki, 1999). The expansion of net area sown and an increase in crop yields wereamong the major contributors to the food grain growth, although the growth rate of agricultural sector declinedduring the same period. On the other hand, India’s agricultural policy was mainly oriented to the institutionalreforms such as land reforms and promotion of farming through cooperatives. Subsequently, India focussedon promoting industrialization, especially post the second �ve-year plan (1956-57 to 1960-61), while largelyneglecting the agricultural sector.
During the mid-1960s, a consecutive two-year drought resulted in a large negative growth of agricultural sector,particularly in terms of food grain production and as a result, the country faced a serious shortage of foodgrains with many going without a single meal per day. Considering the contribution of the agricultural sector toGDP (about 50 per cent), its poor performance affected adversely the Indian economy as a whole, and even thepolitical regime itself. As a result, the country was forced to import as many as 10 million tons of food grains(mainly wheat), from abroad for two succeeding years. This serious economic crisis forced the Government ofIndia revisit its agricultural policy and accordingly, as a corrective measure, the government called for attentionto technological innovations and even decided to import new agricultural technologies from abroad. And itwas an opportune twist of fate for India that the mid 1960s was a phase when new seed- fertilizer technologydissemination started in the tropical developing world. In particular, it was fortunately found that wheat HighYield Varieties (HYVs) developed by CIMMYT in Mexico were found to be suitable to Indian climatic conditions,

Page 3/16
particularly North Indian states such as Punjab, Haryana, Uttar Pradesh and Madhya Pradesh. And as a result,the Government of India, was able to achieve food self-su�ciency within a short span of time, and today Indiais the highest food grain producer (285 million tons during 2018-19) in the world though with a few ups anddowns during drought years. In this context, chemical fertilizer played a signi�cant role in agriculturalproduction, particularly NPK fertilizers.
The application of chemical fertilizers has considerably improved the quantity and quality in terms of plantparameters such as, increasing grain yield, leaf area, plant growth, photosynthesis and ultimately, mainproduct and by-product yields. Thereby, chemical fertilizers have increased food availability, income and foodsecurity of the growing population of the nation today, but the impact of their long run application is a much-debated issue among environmentalists. Among fertilizers, urea is an essential plant nutrient being acomponent of amino acids, nucleic acids, nucleotides, chlorophyll, enzymes, and hormones. Nitrogen (N) is amajor plant nutrient directly in�uencing crop growth and improving grain yield and grain quality through highertilling, leaf area development, grain formation, grain �lling, and protein synthesis. Urea is one of the mostwidely used sources of nitrogen fertilizer in the world.
Fertiliser consumption in India has been increasing since the beginning of Green Revolution to till date.Global fertilizer consumption is likely to cross above 201 million tons by 2019, which is about 25 per centhigher than the previous recorded year (in 2008). Asia as a whole is the highest consumer of fertilizer in theworld, and depends on import of all three major nutrients. India ranks second in the world in terms of fertilizerconsumption and third highest in terms of irrigated area (36.80%). Presently, Indian fertilizer consumption hasjumped from less than a million tonne in the mid-1960s to 27 million tons in 2019-20. Since the 1970s, ureahas been a major source of nitrogen fertilizer, which is about 83 per cent of the total consumption. India hasemerged as the second largest consumer of urea in the world.
The consumption of urea has slightly increased from 16.95 million tons in 2014-15 to 17.63 million tons in2019-20. With a record urea production of 24.5 MT in 2015-16, its dominance as a major source of nitrogenfertilizer in India is likely to continue in the future as well (FAI, 2020). Further, fertilizer production recorded amixed growth over the previous year. The production of Urea and NP/NPKs has declined while, that of DAP andSSP has recorded an increase. The production of Urea and NP/NPKs has declined by 0.5% and 3.5%,respectively, during 2019 over 2018. Conversely, the production of DAP has recorded a sharp increase of 21.9per cent, followed by a moderate increase of 2.8 per cent in the case of SSP during the same period (FAI,Quarterly Statistical Bulletin, 2020).
Per hectare consumption of NPK accounts for 128.02 kg/ha in the India; moreover, NPK consumption ratiowhich was 6.10:2.46:1, during the period 2014-15 has increased to 7.23:2.9:1 in the year 2019, as against anideal NPK (Nitrogen-Phosphorus-Potassium) consumption ratio of 4:2:1. This con�rms that, a marginalimprovement in the consumption of fertilizer ratios since 2014-15 due to the introduction of Neem Coated Ureaby the Central Government with a view to improving soil health through checking an excessive use of urea, hasmade only a limited headway in the past �ve years. It shows that there is a further scope for changing theusage pattern of chemical fertilizers for improving soil health (Business line, 2019). Crops like, maize, wheatand rice (cereals) are the three main fertilizer-consuming crops with their consumption proportion beingrelatively the same (i.e., 14-16% each) (Patrick Heffer, 2010; Fageria et.al., 2003a). On the other hand, a rise in

Page 4/16
fertilizer consumption over the years along with the adoption of HYVs and the expansion of groundwaterirrigation facilities have resulted in highest food grain production in India. But the pattern of fertilizer useremains distorted with a growing imbalance in the use of chemical fertilizers, leading to nutrient de�ciencies insoils, and thereby de�ciency symptoms in plants. Further, there is a huge variation in fertilizer applicationacross various states in India (Agostini et.al., 2010; Burns, 2006; Neeteson et.al, 1999; Rahn, 2002).
Considering all the pros and cons of agricultural production, input requirements and urea related subsidyburden, the government of India took a decision to introduce Neem Coated urea (NCU) by recognizing itspotential bene�ts associated with NCU relative to NU. The Ministry of Agriculture and Farmers Welfare (MoA &FW), Government of India, included NCU in the Fertilizer Control Order (FCO) since July 2004, and subsequentlymade the production and distribution of NCU mandatory from 25th May, 2015. Further, the Government of Indialaunched a Soil Health Card Scheme (SHCS) on 19th February, 2015 with a focussed attention on improvingthe soil quality through a judicious use of fertilizers. Against this background, an attempt has been made bythe authors to address the following objectives as part of a benchmark study regarding the impact of NCU onproduction and productivity of major crops, and its associated bene�ts to the farming community:
1. To study the trends in usage and pricing of Normal Urea and Neem Coated Urea.
2. To analyse the adoption behaviour of Neem Coated Urea farmers.
3. To analyse the impact of Neem Coated Urea on yield levels of major crops and income of farmers.
2 Methodology2.1 Sampling and Data Base
In order to explore the impact of NCU on production, productivity and income across selected states of India,the study adopted a very relevant and detailed primary survey-based approach to the adoption of NCU. Thestudy covered six very important cropping systems: Paddy, Tur, Sugarcane, Maize, Soybean and Jute. Thestates included are Assam, Bihar, Karnataka, Maharashtra, Madhya Pradesh and Punjab. To make thecoverage exhaustive, a total of roughly 1200 sample farmers were surveyed. The reference period of the studywas Kharif season for the agriculture year 2015. Both irrigated and rainfed crops accounting for the highesturea consumption in each of the selected states were considered for the study. For each crop, two districtswere selected based on the area under the selected crop and their urea usage within the state. From eachdistrict, two taluks/tehsils were selected based on the same criterion. Within the selected taluks, two clusterscomprising three to four villages per cluster were selected for conducting the survey.
A total of 50 farmers from each taluk were selected adding up to 100 farmers from each district. Householdswere selected randomly for assessing the NCU fertilizer use and its impact on crop production. Further, thehouseholds were post-classi�ed in to two categories - NCU users and non-users (those using Normal Urea) -mainly to examine the impact of NCU, as compared to NU. Whereas, an adequate care was taken to ensurethat the selected crops were grown under chosen irrigated/un-irrigated conditions in the states. Thus, a total of200 (NCU/ Normal Urea) farmers for each crop were interviewed. The primary data was collected by using apretested structured questionnaire. An adequate care was taken in the selection of representative samples,based on the operational land holding size. The data related to production, import, consumption and prices of

Page 5/16
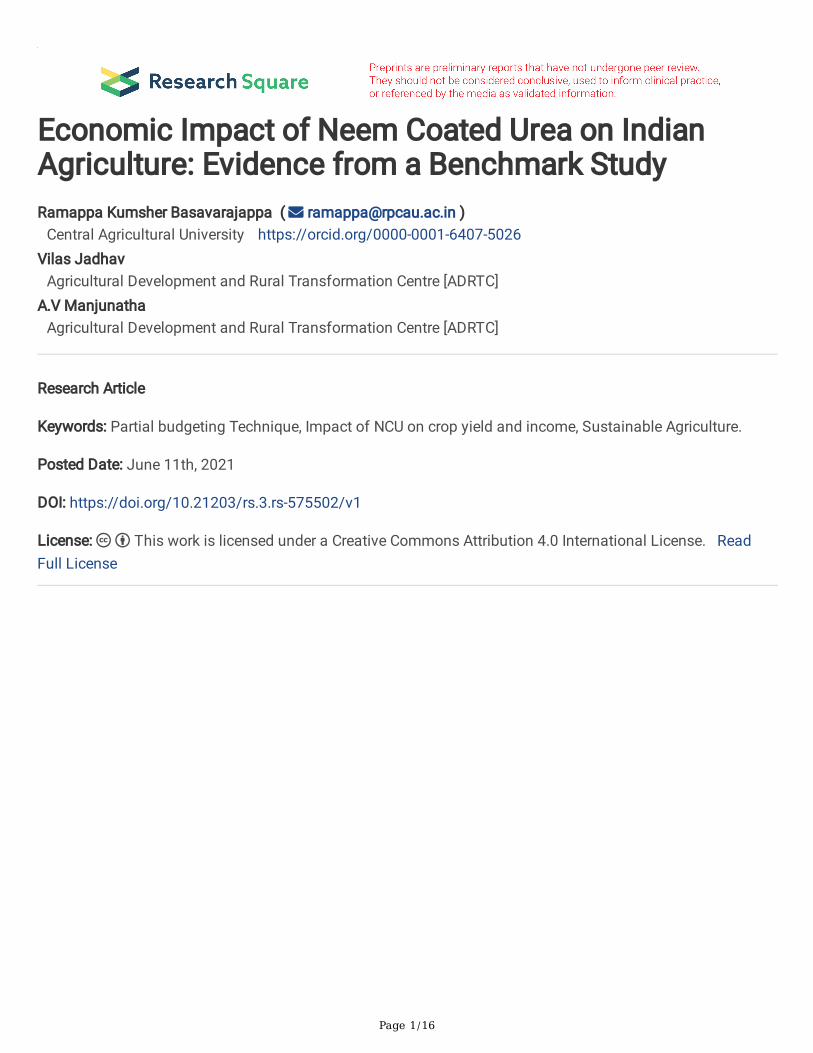
urea were also collected from various secondary sources such as, Directorate of economics and Statistics,Indiastat.com, Fertilizers Association of India, Department of Fertilizers (Ministry of Chemicals and Fertilizers),Government of India, and Department of agriculture, cooperation and farmers welfare etc. The details ofsample selection are presented in Table 1.
2.2 Analytical Tools and Techniques
The information gathered from both primary and secondary sources were analysed, using tabular analysis. Inaddition, CAGR, exponential functions, partial budgeting frame work and paired unequal sample‘t’ test (between NCU and Non-NCU farmers for the year 2015) were also used for observing the signi�cantdifferences between the two categories of farmers with respect to various indicators. A partial budgetingtechnique was employed for comparing the costs and returns related to NCU usage and the potential changesin crop production. Partial budget was divided into three main sections: (I) costs; (II) bene�ts; and (III) analysis.The analysis section included the net change in pro�ts and break-even analysis (Bene�t/Cost Ratio (BCR)).The possible changes occurring in the NCU intervention fell into four categories viz., added returns, reducedreturns, added costs, and reduced costs. As part of a partial budgeting, an attempt has been made to presentand discuss the comparative �gures of costs incurred and returns realized related to NCU usage.
3 Results And Discussion3.1 Trends in all India Urea Production, Import, Consumption, and Prices
To spot a pattern, trend analysis is the most common practice, hence, authors have adopted a trend analysisfor understanding the growth pattern in terms of production, import, consumption, and prices of urea at themacro level. This technique is often used in extracting an underlying behavioural pattern based on a time-series data, which remains partly or wholly hidden by noise. This method helps understand how, and why,things have changed are likely to change over time and an estimation has been done using a simple ormultiple regression analysis. Urea has a high nitrogen content (46%), can adapt to almost all types of land, andis widely used in the agricultural sector both as a fertilizer and animal feed additive and hence, urea is themost important nitrogenous fertilizer. Considering all these potential bene�ts, urea is the king of fertilizers.
The state-wise trends in consumption/sale of urea are presented in Table 2 and Figure 1. It is revealed fromTable 2 that the consumption of urea has increased from 8542.92 thousand MTs in 2006-07 to 11376.76thousand MTs in 2015-16 at the all India level with a growth rate of 2.94 per cent, and the growth isstatistically signi�cant at �ve per cent level. From among the selected states, Assam accounts for the highestgrowth rate (5.50%), followed by Madhya Pradesh (5.10%), Karnataka (2.92%), Maharashtra (2.13%), Punjab(1.92%), and Bihar for the least (1.81%), respectively. The percentage change over 2006-07 values to theexisting values also re�ects that the highest changeover has occurred in respect of Assam (102.10%), followedby Madhya Pradesh (68.85%), Karnataka (33.27%), Punjab (30.15%), Bihar (21.73%) and Maharashtra(15.86%). It is clear from the table that the changeover observed in consumption/ sales in the case of ureaamounts to 33.17 per cent (Table 2), at the aggregate level.
3.2 Socio-Economic Characteristics of the Sample Households

Page 6/16
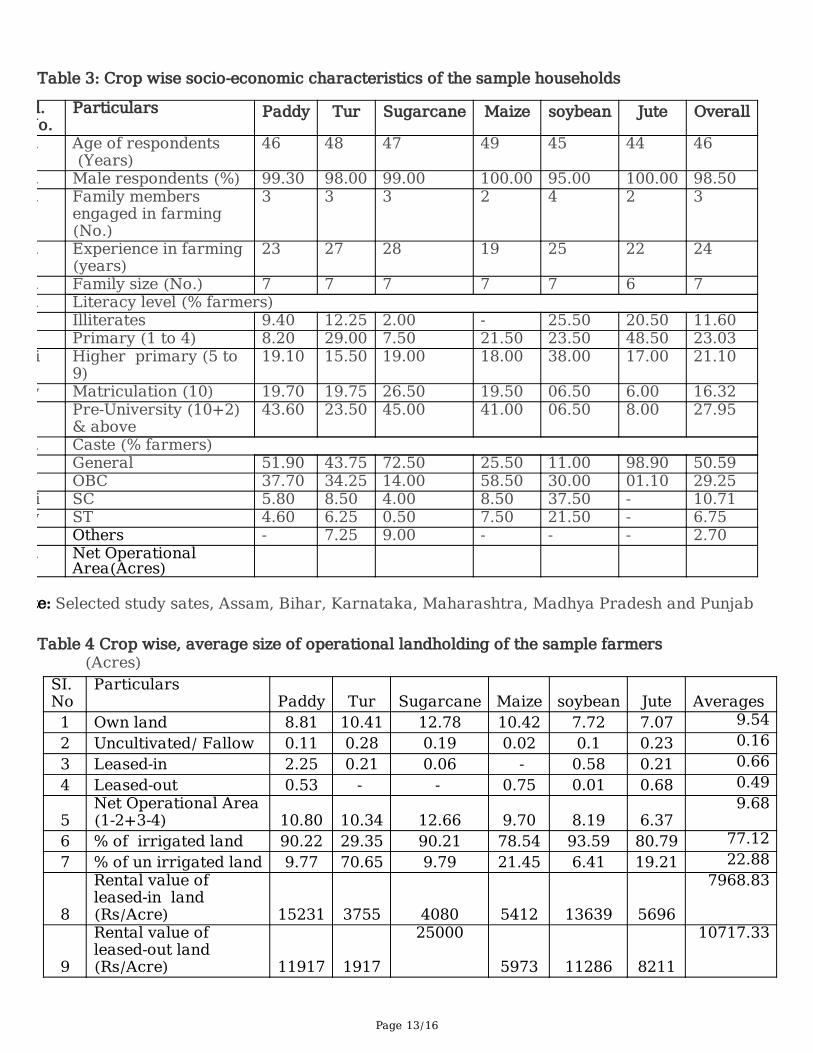
The general characteristics of the overall sample farmers are shown in Table 3. The table reveals widevariations in the socio-economic characteristics of farmers across the sample states in relation to differentcrops. The average age of sample farmers across all the states works out to 46 years with a majority of thembeing male respondents. On an average, the sample farmer family consists of seven members, out of which,three have been engaged in farming for last 24 years. These characteristics are relatively common for all therespondents growing different crops and across States. Coming to literacy level, a majority (28%) of them havecompleted Pre-University and above, followed by primary schooling (23%), higher primary (21%) andmatriculation (16%); however, about 12 per cent of them are found illiterates. Across crops, a majority (>60%)of the paddy, sugarcane and maize farmers have completed matriculation and above, while in respect of tur,soybean and jute, more than half of the farmers have studied up to higher primary level. At the aggregate, amajority of the sample farmers belong to general category (51%), followed by Other Backward Classes (OBCs)(29%), Scheduled Castes (11%) and Scheduled Tribes (7%) while in the case of maize, more than half of thefarmers (58%) belong to OBC category. The proportion remains relatively the same in respect of all the crops.
3.3 Average Size of Operational Landholding of the Sample Farmers
The details of operational land holdings of the sample farmers are presented in Table 4. The table reveals thatthe average net operational area in the study region is comparatively higher in the case of sugarcane farmers(12.6 acres), followed by paddy farmers (10.80 acres), and tur farmers (10.34 acres). The least net operationalarea (6.37 acres) is observed for jute farmers. While in respect of the remaining cases such as soybean andmaize, the net operational area works out to less than 10 acres. As usual, the highest operational land restswith large farmers only, in respect of all the sample crops, however, it is found to be as high as 27 acres in thecase of sugarcane farmers, followed by maize (20.80 acre) and tur farmers (19.25 acres). Overall, asubstantial proportion of the operational area is accounted for land owners (>7 acres) across all crops.Interestingly, the leased-in area seems to be highest in respect of paddy crop only (2.25 acres). Whereas theproportion is less than an acre/ household in respect of the rest of the crops. On the contrary, the leased-outarea constitutes less than an acre across crops. However, it is highest (0.75 acre) in respect of maize crop inBihar. Similarly, the proportion of uncultivated or fallow land is found to be negligible across sample farmers inthe study area. With regard to irrigation, in addition to the irrigated crops such as paddy and sugarcane,soybean also accounts for a major area (>90% each) under irrigation from among the sample crops, and theremaining area comes under rainfed conditions. Additionally, the area under maize and jute crops coveredunder irrigation also constitutes more than 72 per cent. Whereas, tur is majorly grown under rainfed conditionsboth in the states of Karnataka and Maharashtra and hence, the proportion of rainfed area constitutes more(71%) in the case of tur crop. However, about 29 per cent of the farmers grow tur under irrigated conditions aswell. It is noted that across categories of farmers, a higher proportion of irrigated land is accounted for bysmall farmers, followed by medium, and large farmers in respect of almost all the irrigated crops.
The average rental value of leased-in land amounts to a maximum of Rs.15,231/ acre for paddy, followed bysoybean (Rs.13,639/ acre) and jute (Rs. 5,696/ acre), while it is less than Rs. 5,000/ acre in the case of tur andsugarcane crops. At the same time, across categories, the rental value of leased-in land is highest(Rs.18,507/acre) for small farmers, followed by medium farmers (Rs. 14,810/ acre), in respect of paddy,whereas, it is medium farmers (Rs. 14,417/acre), followed by small farmers (Rs. 13,300/ acre) in the case ofsoybean crop. Relatively, the same situation prevails across other crops. On the other hand, the rental value of

Page 7/16
leased-out land is slightly less than the value of leased-in land in the sample area. Similar to the rental value ofleased-in land, the leased-out land value is highest in respect of paddy (Rs. 11,916/ acre), followed by soybean(Rs. 11,286/ acre). However, the leased-out land value of small farmers in the case of paddy is highest (Rs.20,294/ acre), as compared to the rental values of leased-in and leased-out land across all crops. Interestingly,no sample farmers are found engaged in leasing-in and leasing-out activities, in respect of maize andsugarcane crops, respectively.
3.4 Cropping Pattern Adopted by the Sample Farmers in the Study Area
Given the land resources, agricultural production and pro�tability can be increased through adoption of ascienti�c cropping pattern. The adoption of technology in respect of cropping system depends on manyfactors such as physical and socio-economic resources, available or made available, at a time, when they areneeded most. In this background, the cropping pattern followed by different categories of farm households hasbeen analyzed and results presented in Table 5.
Paddy-farmers across the states grow cereals as the major crops with a share of 68.95 per cent in the grosscropped area, followed by commercial crops (9.09%), horticultural and fodder crops (12.59%). Whereas, turfarmers across the states grow pulses as the major crops with a share of 35.74 per cent in the gross croppedarea, followed by oilseed (30.56%), horticultural and fodder crops (15.56%), cereal crops (9.20%) and oilseedcrops (8.33%). It reveals that the location-speci�c and farm-based cropping patterns have to be evolved with adue consideration given to the vital determinants such as land, topography, water availability, intensity andduration of sunlight, labour availability, cash or credit, power source and market demand. Among differentcrops cultivated by sugarcane farm households, commercial crops are the major crops with a share of 61.93per cent in the gross cropped area, followed by cereals, oilseeds and horticulture and fodder crops, with a shareof about 12 per cent each in the gross cropped area. Further, the small size of land holding does not preventthese farmers from growing perennial crops.
Maize-farmers across the states grow crops like paddy, maize and soybean. It is evident from the table thatcereal crops account for as high as 86.91 per cent of the gross cropped area, followed by oilseeds (about12%). Whereas, soybean farmers across the states grow crops like paddy, soybean and cotton as their majorcrops. Among them, oilseed crop alone accounts for as high as 76.94 per cent of the cropped area, followed bycotton as a commercial crop (18.82%) and the least (4.23%) in the case of cereal crops. It is a good practicefollowed by soybean farmers as part of being risk-averse and also from the view point of generating incomefrom other sources such as dairy-farming and cultivation of commercial crops such as pulses, cotton andcereals. However, in the case of jute farmers, jute apart, other crops are grown only for their subsistence. Thecropping pattern is dominated by jute and paddy, accounting for around 74.79 per cent and 18.94 per cent ofthe gross cropped area, respectively. Further, jute farmers are found to have devoted about 6.27 per cent ofGCA for vegetable production.
3.5 Impact of NCU on Production and Marketing of Reference Crops
During the reference period (Kharif 2015), both NU and NCU were available in the market across the study areabefore the government made mandatory the production (100%) and distribution of NCU throughout thecountry. Therefore, an effort was made by the study to compare the impact of NU and NCU on the production

Page 8/16
and productivity of reference crops across states in India. The details of the impact of NCU on production andmarketing of reference crops are presented in Table 6. A perusal of the table reveals that out of the samplecrops, the average main product yield of soybean was highest in the case of NCU users (5.32 quintals/acre), ascompared to NU users (3.86 quintals/acre), accounting for a statistically signi�cant increase in the yield levelsat 37.82 per cent, followed by tur (33.68%) and maize (7.99%). This is due to the presence of neem content inurea, which slows down the release of nitrogen, as a result, 'N' is available to plants for a longer period, ascompared to NU and concomitantly reduces the frequency of application and consumption of urea fertilizer.These results also conform to the study �ndings of John et.al., (1989), who found a signi�cant increase ingrain yield of rice based on their successive �eld experiments. Similarly, in terms of by-product yield, theincrease in yield amounts to 23.31 per cent, as compared to that of tur crop in the context of NU application,followed by soybean (11.14%). This increase in yield is found to be statistically signi�cant. In the cases ofpaddy and sugarcane, the prices of the main product appear to be relatively the same with regard to NCU andNU. The per cent change over post NCU application in place of NU varies within two per cent, whereas, inrespect of tur, jute, maize and soybean crops, the prices seem to have decreased to the tune of 2.38, 0.53, 2.50and 12.35 per cent, respectively, which could be due to market imperfections. Similarly, in the case of by-product price, the per cent change in respect of NCU, as compared to NU, amounts to 16.57 per cent in the caseof sugarcane, followed by soybean (9.81 %) and paddy (8.98 %). The increase in the price of sugarcane by-product from Rs.356/ bundle (without NCU) to Rs. 415/ bundle (with NCU) might be attributed to theapplication of NCU, in addition to many other factors. Further, a majority of the farmers also have reported anincrease in the quality of both the main product and by-product yields, post NCU application. With respect tostatistical signi�cance, most of the prices of reference crops appear to be non-signi�cant. Depending upon theprices of both the main product and by-product, the value of main product and by-product of tur crop show anincrease of 32.23 per cent and 38.15 per cent, respectively, post the adoption of NCU in place of NU at theaggregate level, and is found statistically signi�cant at one per cent level for the values of main product andnon-signi�cant for by-product.
3.6 Impact of NCU Use on the Component-Wise Cost of Reference Crops
The details of the impact of NCU on the input costs of reference crops across the sample states are presentedin Table 7. To assess the impact of NCU usage on input costs, parameters such as the cost of pest anddisease control, the cost of weed management, the cost of NCU or NU, and the cost of other fertilizers wereconsidered. Table 7 reveals a comparative picture of the input costs of NCU and NU using farmers. A perusalof the table reveals that the total cost of the selected inputs has increased for NCU users (Rs.3,833/acre), ascompared to NU users (Rs.2,192/acre), to the extent of 74.86 per cent in respect of tur crop, followed by maize(14.30%) and paddy (4.48%), while in contrast, crops like jute and soybean show a decline in per cent change,at the aggregate level. Whereas, the cost illustrates a decreasing scenario in respect of all the parameters,excepting the cost of other fertilizers for paddy and soybean farmers, respectively. An increasing trend in thecost of pest and diseases control, weed management, and other fertilizers can be seen in respect of tur (6.65%,40.24% ,67.72%) and sugarcane (22.49%, 0.49%, 4.83%), respectively. In terms of disparity, the decreasingtrend in the cost of NCU/ NU works out to 0.19, 16.78, 15.34, and 3.50 per cent for paddy, jute, sugarcane andsoybean, respectively.
3.7 Economic Feasibility of NCU Use for Reference Crops Using Partial Budgeting Technique

Page 9/16
An economic feasibility analysis of NCU use, often with and without NCU, approach has been used foridentifying and assessing the costs and bene�ts as part of an evaluation of the current situation, moremeaningfully. The difference between the costs and bene�ts is the net incremental bene�t arising from NCUusage. However, a before and after approach has not been used in this framework on account of changes inproduction that would have occurred due to regular developments, along with NCU usage. While assessing thebene�ts and costs of NCU usage, only incremental net bene�ts need to be considered, with the reducedbene�ts treated as costs. The bene�ts foregone need to be taken as a cost component of NCU usage. Thereby,only incremental value could be attributed to NCU. Hence, a partial budget technique has been used forassessing the incremental income based on a small change in farm business post NCU application. In thepresent article, a partial budgeting framework has been estimated for variables such as additional income,reduced costs, reduced income and additional costs, following a small change in NCU use vis-a-vis NU. Thebudget indicates whether the change has increased/ decreased/ no change in the net income with theadoption of NCU. Also, the partial budget compares both the positive and negative effects of a change withNCU use in relation to NU, or an incremental income accruing from reference crops.
The impact of NCU, based on a partial budgeting technique, considering added and reduced costs with NCUapplication for reference crops is estimated and presented in Table 8. It can be seen from the table that there isa positive impact of the economic feasibility of NCU use on reference crops. The variables considered forestimating a partial budgeting framework in the study include the cost of pest and disease control, cost ofweed management, cost of NCU/NU, and the cost of other fertilizers. In the table, only cost and returns arehighlighted. At the aggregate level, the added costs with NCU application appear to be as high as Rs. 1,685.87per acre in the case of maize, followed by tur (Rs. 1,300/acre) and soybean (Rs. 1,141/acre), respectively.
It is exceptional to note that the reduced returns have been reported highest in the case of sugarcane (Rs.5,749/acre), followed by soybean (Rs. 3,942/acre) and maize (Rs. 1,965/acre). Instead, added returns both interms of the main product and by-product yields are noticed in respect of tur (Rs. 16,558 per acre) and paddyproducers (Rs. 2,943/acre) only because of the adoption of NCU in place of NU. Whereas, reduced costs withNCU application are observed for almost all the sample crops with varying amounts. However, the reducedcosts are found to be highest in the case of paddy (Rs. 227/acre), followed by sugarcane (Rs. 149/acre) andmaize (Rs. 84/acre). This is the positive impact of NCU adoption in lieu of NU, in addition to other favourablefactors. Using the same information, the bene�t-cost ratio has been arrived at and presented in the same table.It is very much interesting to note that the BC ratio is more than 10 in respect of tur and sugarcane crops,meaning that, for every one rupee of investment on NCU application, there has been a rise in returns to theextent of Rs. 10. As regards paddy and soybean, the ratio works out to more than three per cent, while it is least(<1%) in the case of maize. These results illustrate that the application of NCU has had a positive impact interms of both increased yield and income due to reduced costs for the farmers.
3.8. Diversion of Urea for Other than Agricultural Purposes
Based on the study, what can be inferred is that a majority of the farmers have used normal urea in smallerproportions as a feed to cattle and �shes, mixing with milk to enhance fat content, distilling local alcohol etc. However, the usage of urea has been completely stopped, post the introduction of NCU.

Page 10/16
4. ConclusionsRecognizing the various positive bene�ts of NCU and its impact on the environment, the Union Government ofIndia has made mandatory the production and distribution of NCU (100%) across the country from May 2015.The aim of the policy is to control an excess use of urea in agriculture, besides preventing the diversion ofsubsidized urea towards industrial purposes. The results reveal that the aim of the policy seems to havematerialized, as the diversion of urea has completely stopped post the introduction of NCU. In addition, boththe main product and by-product yield levels of all the reference crops have increased, and farmers havereaped the positive externalities of NCU in terms of increased outputs, reduced costs (in terms of pest anddisease control), and thereby increased returns. These bene�ts might not be related to NCU usage alone, assome other favourable reasons might have contributed to the same as well. However, the usage of NCU relativeto NU has not been impressive due to the ignorance of farmers about the potential bene�ts of NCU over NUand its application. Hence, there is a need for spreading awareness among farmers regarding the NCU usageand its bene�ts through trainings, organizing demonstrations etc. It is very di�cult to realize all the potentialbene�ts associated NCU use within a limited period (as the study was limited to Kharif 2015). Hence, this canbe treated as a baseline survey, which can be repeated after a few years so as to have a better picture of NCU.Nevertheless, any efforts towards reducing the cost of production and increasing the returns to the farmingcommunity, needs to be promoted to realise our Prime Minister's dream of doubling the farmers’ income by2022.
DeclarationsAuthors would like to express heartfelt thanks to all the o�cials of Centre and State/s (Ministry andDepartment of Agriculture), and all the participating AERCs and their team, for their immense support, activeinvolvement, and cooperation, during the period of study.
The authors declare no competing interests.
ReferencesAgostini, F., Tei, F., Silgram, M., Farneselli, M., Benincasa, P., & Aller, M. F (2010): “Decreasing nitrate leaching invegetable crops with better N management. In Genetic engineering, biofertilisation, soil quality and organicfarming,” Springer (pp. 147-200).
Biswas, A. K., and Subba Rao, A (2015): “Enhancing Nitrogen Use E�ciency - Challenges and Options,”. Apaper submitted to Ministry of Agriculture, Government of India by the Indian Institute for Soil Science (IISS),Bhopal.
Bhaduri, A (1973): “A study in agricultural backwardness under semi-feudalism”, The economic journal,83(329), 120-137.
Blyn, G (1966): “Agricultural trends in India,1891-1947, output, availability, and productivity. University ofPennsylvania Press, Book 374 pages,

Page 11/16
Burns, I.G (2006): “Assessing N fertiliser requirements and the reliability of different recommendation system,”Acta Hort. 700:35–48.
Dordrecht and Bardhan, P.K (1984): “Land, Labor and Rural Poverty: Essays in Development Economics,”Oxford University Press.
Fageria, N.K., and Baligar, V.C (2003a): “Fertility management of tropical acid soils for sustainable cropproduction,” In Handbook of Soil Acidity, Z. Rengel, Ed., pp. 359-385. Marcel Dekker, New York.
FAO (2005): “Fertilizer Use by Crop in India,” Land and Plant Nutrition Management Service, Land and WaterDevelopment Division, Food and Agriculture Organization, United Nations, Rome.
John, P.S., Buresh, R.J., Pandey, R.K., Prasad, R. and Chua, T.T (1989): “Nitrogen-15 balances for urea and neemcoated urea applied to lowland rice following two cowpea cropping systems,” Plant and Soil journal, 120(2),pp.233-241.
Kurosaki, T (1999: “Agriculture in India and Pakistan- Productivity and Crop Mix”, Economic and PoliticalWeekly, 34 (52), December 25, A160-A168.
Neeteson, J.J., Booij, R., Whitmore, A.P (1999) “A review on sustainable nitrogen management in intensivevegetable production systems,” Acta Hort.506:17–26.
Heffer, P (2009): “Assessment of fertilizer use by crop at the global level,” http://www. Fertilizer, org, 2006/07-2007/08.
Singh S and Y.S Shivay (2003): “Coating of Prilled Urea with Eco-friendly Neem (Azadirachta indica A. Juss.)formulations for e�cient nitrogen use in hybrid rice,” Acta Agronomica Hungarica, 51(1), pp. 53–59.
TablesTable 1: State wise, crop coverage and sample size
Page 12/16
SI. No./ Region Crops Irrigated/un irrigated Sample Farmers Total
South Karnataka1 Paddy Irrigated 200 4002 Tur Un-Irrigated 200West Maharashtra3 Sugarcane Irrigated 200 4004 Tur Un-Irrigated 200Central Madhya Pradesh5 Paddy Irrigated 200 4006 Soybean Un-Irrigated 200East Bihar7 Paddy Irrigated 200 4008 Maize Un-Irrigated 200North Punjab9 Paddy Irrigated 200 200North-east Assam10 Paddy Irrigated 200 40011 Jute Un-Irrigated 200All India Irrigated 1200 2200
Un-Irrigated 1000
Source: Primary data
Table 2: Trends in all India urea production, import, consumption and prices (lakh MT)
Years Assam Bihar Karnataka Maharashtra MP Punjab All India2006 194.10 1598.10 1097.58 1985.00 1297.00 2371.14 8542.92
2007 195.41 1851.72 1253.63 2131.00 1425.00 2646.44 9503.20
2008 223.48 1794.82 1281.99 2258.00 1371.00 2576.90 9506.19
2009 251.31 1701.11 1377.07 2289.00 1603.00 2445.76 9667.25
2010 256.61 1691.21 1427.71 2538.00 1669.00 2720.44 10302.97
2011 304.61 1811.51 1444.80 2481.00 1788.00 2825.70 10655.62
2012 278.93 2095.96 1446.32 2332.00 1856.00 2842.97 10852.18
2013 281.51 1870.64 1479.20 2655.00 2224.00 2619.32 11129.67
2014 299.53 1940.41 1532.60 2572.00 2017.00 2734.26 11095.80
2015 392.39 1945.52 1462.80 2300.00 2190.00 3086.05 11376.76
CAGR 5.50** 1.81** 2.92*** 2.13*** 5.10*** 1.92** 2.94***
% change over from 2006-07 to2015-16
102.10 21.73 33.27 15.86 68.85 30.15 33.17
Note: * Indicates percentage change over 2006-07 to 2015-16
Page 13/16
Table 3: Crop wise socio-economic characteristics of the sample households
l.No.
Particulars Paddy Tur Sugarcane Maize soybean Jute Overall
. Age of respondents (Years)
46 48 47 49 45 44 46
. Male respondents (%) 99.30 98.00 99.00 100.00 95.00 100.00 98.50
. Family membersengaged in farming(No.)
3 3 3 2 4 2 3
. Experience in farming(years)
23 27 28 19 25 22 24
. Family size (No.) 7 7 7 7 7 6 7
. Literacy level (% farmers)Illiterates 9.40 12.25 2.00 - 25.50 20.50 11.60Primary (1 to 4) 8.20 29.00 7.50 21.50 23.50 48.50 23.03
i Higher primary (5 to9)
19.10 15.50 19.00 18.00 38.00 17.00 21.10
v Matriculation (10) 19.70 19.75 26.50 19.50 06.50 6.00 16.32Pre-University (10+2)& above
43.60 23.50 45.00 41.00 06.50 8.00 27.95
. Caste (% farmers)General 51.90 43.75 72.50 25.50 11.00 98.90 50.59OBC 37.70 34.25 14.00 58.50 30.00 01.10 29.25
i SC 5.80 8.50 4.00 8.50 37.50 - 10.71v ST 4.60 6.25 0.50 7.50 21.50 - 6.75
Others - 7.25 9.00 - - - 2.70. Net Operational
Area(Acres)
te: Selected study sates, Assam, Bihar, Karnataka, Maharashtra, Madhya Pradesh and Punjab
Table 4 Crop wise, average size of operational landholding of the sample farmers (Acres)
SI.No
ParticularsPaddy Tur Sugarcane Maize soybean Jute Averages
1 Own land 8.81 10.41 12.78 10.42 7.72 7.07 9.542 Uncultivated/ Fallow 0.11 0.28 0.19 0.02 0.1 0.23 0.163 Leased-in 2.25 0.21 0.06 - 0.58 0.21 0.664 Leased-out 0.53 - - 0.75 0.01 0.68 0.49
5Net Operational Area(1-2+3-4) 10.80 10.34 12.66 9.70 8.19 6.37
9.68
6 % of irrigated land 90.22 29.35 90.21 78.54 93.59 80.79 77.127 % of un irrigated land 9.77 70.65 9.79 21.45 6.41 19.21 22.88
8
Rental value ofleased-in land(Rs/Acre) 15231 3755 4080 5412 13639 5696
7968.83
9
Rental value ofleased-out land(Rs/Acre) 11917 1917
25000
5973 11286 8211
10717.33

Page 14/16
Note: Selected study sates, Assam, Bihar, Karnataka, Maharashtra, Madhya Pradesh andPunjab
Table 5 Crop wise, Cropping Pattern adopted by the sample farmers in the study area (%) SI. No Particulars Paddy Tur Sugarcane Maize soybean Jute
I Cereals 1. Paddy 68.95 9.20 12.90 19.01 4.23 18.942. Maize 5.34 67.90 3. Basmati 4.72
Sub Total 79.01 9.20 12.90 86.91 4.23 18.94II Pulses 4. Redgram (Tur) 33.25 1.07 5. Pulses (other than tur) 2.49 6. Sub Total 0.00 35.74 1.07 0.00 0.00 0.00III Oilseeds 7. Soya bean 20.00 12.03 12.93 76.94 8. Other Oilseeds 10.56
Sub Total 0.00 30.56 12.03 12.93 76.94 0.00IV Commercial Crops 9. Sugarcane 2.07 59.40 10. Cotton 7.02 8.33 2.53 18.82 11. Jute 74.79
Sub Total 9.09 8.33 61.93 0.00 18.82 74.79V Horticultural and fodder crops
12. Onion 3.56 6.02 13. Vegetables 1.14 6.00 6.2714. Fodder 7.23 15. Others 4.22 12.00
Sub Total 12.59 15.56 12.02 0.00 0.00 6.27VI Gross cropped area (%) 101 99 100 100 100 100
Table 6: Impact of NCU on production and marketing of reference crops (Quintals/Acre)

Page 15/16
Particulars Paddy Tur Jute Maize Sugarcane Soybean
NCU NU NCU NU NCU NU NCU NU NCU NU NCU NU
Mainproductyield(quintal)
22.52 20.90***
(7.75)
3.5 2.62Ns
(33.58)
8.86 8.60***
(3.02)
25.25 23.38**
(7.99)
539 513 ***(5.06)
5.32 3.86***
(37.82)
By-productYield(quintal)
32.41 31.59Ns
(2.59)
2.38 1.93*
(23.31)
3.10 3.10NS
(0.00)
16.32 16.31Ns
(0.06)
0.8 0.8 Ns(0.00)
7.98 7.18*
(11.14)
Price ofmainproduct(Rs/quintal)
1373 1365***
(0.58)
8217 8418Ns
(-2.38)
2044 2055Ns
(-0.53)
1049 1076Ns
(-2.50)
221 216 **(2.31)
3151 3595**
(-12.35)
Price ofby-product(Rs/quintal)
182 167**
(8.98)
431 489***
(-11.86)
250 250Ns
(0.00)
152 145Ns
(4.82)
415 356 Ns(16.57)
179 163**
(9.81)
Value ofmainproduct(Rs)
31740 29326Ns
(8.23)
29645 22419Ns
(32.23)
18110 17673**
(2.47)
26487 25157**
(5.28)
119231 110912**
(7.50)
16763 13877***
(20.80)
Value ofby-product(Rs)
4094 3305Ns
(23.87)
1032 747***
(38.15)
775 775NS
(0.00)
2481 2365*
(4.90)
343 297 NS(15.48)
1428 1170***
(22.05)
Note: ***, ** & * indicate 1, 5 and 10 per cent levels of Significance, respectively; Figures in parentheses indicate percentage change
Table 7: Impact of NCU use on the component-wise cost of reference crops (Values in Rs/Acre)
Particulars Paddy Tur Jute Maize Sugarcane Soybean
NCU NU NCU NU NCU NU NCU NU NCU NU NCU NUCost of pest and disease control
1362 1453**(-6.26)
1090 1022***(6.65)
127 123**(3.25)
268 344Ns(-22.09)
501 409 Ns(22.49)
689 817**(-15.66)
Cost of weedmanagement
569 601***(-5.32)
453 323***(40.24)
1211 1212Ns(-0.08)
213 221Ns(-3.61)
607 604 NS(0.49)
443 486*(-8.84)
Cost of NCU/ NormalUrea
510 511***(-0.19)
279 233Ns(19.74)
243 292***(-16.78)
848 807**(5.08)
1451 1714***
(-15.34)
110 114***(-3.50)
Cost of otherfertilizers
5666 5194*(9.08)
2011 1199Ns(67.72)
1201 1210Ns(-0.74)
11794 10109*(16.66)
5900 5628***
(4.83)
1215 1209NS(0.49)
Total Cost 8107 7759***(4.48)
3833 2192***(74.86)
2782 2837**(-1.93)
13123 11481**(14.30)
8459 8355 **(1.24)
2457 2626***(-6.43)
Note: ***, ** & * indicate 1, 5 and 10 per cent level of Significance, respectively; Figures in parentheses indicate the percentage change

Page 16/16
Table 8: Economic feasibility of NCU use for reference crops (partial budgeting framework)(Rs/Acre)
Particulars Paddy Tur Jute Maize Sugarcane Soybean
Added cost 739.33 1300 0 1685.87 585 1141
Reduced cost 226.61 3 62 83.67 149 16
Added return 2942.69 16558 - - - -
Reduced return - 321 554 1964.83 5,749 3942
B:C Ratio 4.28 10.21 1.21 10.11 3.46
Figures
Figure 1
All India urea production, imports, consumption and prices