Embed Size (px)
Citation preview

Agriculture, Ecosystems and Environment 216 (2016) 34–43
Effects on the composition and structural properties of the humifiedorganic matter of soil in sugarcane strawburning: A chronosequencestudy in the Brazilian Cerrado of Goiás State
Celeste Queiroz Rossia, Marcos Gervasio Pereirab,*, Andrés Calderín Garcíaa,Ricardo Luis Louro Berbarab, Paulo Roberto Gazollac, Adriano Perind,Antonio Paz Gonzáleze
a Postdoctoral Course in Agronomy (Soil Science, CPGA-CS), CNPq fellowship recipient, Rural Federal University of Rio de Janeiro (UFRRJ), BR 465 km 7,Seropédica, RJ 23890-000, BrazilbDepartment of Soils at UFRRJ, CNPq fellowship recipient, BrazilcAGRODEFESA, Av Circular466, Qd 87, Lt. 2, Setor Pedro Ludovico, Goiânia, GO, Brazild Instituto Federal Goiano, BrazileCathedratic Professor at Coruña University, Campus of A Coruña, cod 15071, La Coruña, Spain
A R T I C L E I N F O
Article history:Received 6 March 2015Received in revised form 3 September 2015Accepted 19 September 2015Available online xxx
Keywords:Humic acidsSoil burningSoil organic matterSpectroscopic characterization
A B S T R A C T
The heating of soil organic matter after burning events can significantly change the composition andstructure of humified organic matter. The impact of burning on the amount and quality of SOM dependson fire intensity, recurrence, the type of vegetation, soil texture and the local climate. The present studyidentified the composition and structural properties of humic acids (HA) extracted from a sandy loamtextured Latossolo Vermelho (Oxisol) managed with the pre-harvest burning of sugarcane straw forchronosequences of 1, 5,10 and 20 years in Rio Verde, Goiás (GO). Soil samples were collected at depths of0–0.05, 0.05–0.10, 0.10–0.20 and 0.20–0.30 m. To obtain a reference of natural conditions, soil was alsosampled in adjacent areas covered with native vegetation and Pasture grass. The HA samples from soilunder different burning conditions and areas (Cerrado and Pasture grass) were analyzed using chemical-spectroscopic characterization and the chemiometric technique. The greatest modifications in HAcomposition after burning occurred in the most superficial soil layers. At a depth of 0.0–0.05 m, the mainchanges observed were a decrease in mean C and N levels and enrichment in O, irrespective of the lengthof time that burning practices had been adopted. Additionally, in the most superficial layer, theultraviolet-visible spectroscopy assay showed that burning enhanced the aromatic properties (<E4/E6) ofHA, and FTIR spectroscopy coupled with PCA confirmed that the top soil layer shows higher variations inthe functional groups as a function of burning. The PCA analysis of 13C NMR spectra also showed thatstronger aromatic properties were found in the most superficial layer, and the PCA of FTIR spectrareinforced the result by grouping HAs in these layers and thereby indicated that the most intense changesoccurred in the 0.0–0.05 m layer. The most intense disturbances produced by sugarcane burning on thecomposition and structure of humified organic matter occurred in the most superficial layer. Thecombined use of the methods adopted was efficient and, along with the chemiometric techniques,consisted of useful tools that can support the development of procedures to study phenomena such asburning.
ã 2015 Elsevier B.V. All rights reserved.
Contents lists available at ScienceDirect
Agriculture, Ecosystems and Environment
journa l homepage : www.e l sev ier .com/ loca te /agee
* Corresponding author.E-mail addresses: [email protected] (C.Q. Rossi),
[email protected] (M.G. Pereira), [email protected] (A.C. García),[email protected] (R.L.L. Berbara), [email protected] (P.R. Gazolla), [email protected] (A. Perin), [email protected] (A.P. González).
http://dx.doi.org/10.1016/j.agee.2015.09.0220167-8809/ã 2015 Elsevier B.V. All rights reserved.
1. Introduction
The final products of biomass combustion are water, CO2 andminerals contained in the ash. Total biomass oxidation depends ona number of conditions to ensure adequate oxygen supply duringcombustion. This is not observed in nature, where incompletecombustion yields a number of compounds, such as carbonmonoxide, methane and a wide variety of pyrolysis products,

0 10 20 30 40
Y 1
Y 5
Y 10
Y 20
cerr ado
pasture
Years
Are
as
cerrado pa stur e soybea n sugarcane
Fig. 1. Land use history in the study area. Areas cropped with sugarcane weremanaged with pre-harvesting burning for 1 (Y1), 5 (Y5),10 (Y10) and 20 (Y20) years.
C.Q. Rossi et al. / Agriculture, Ecosystems and Environment 216 (2016) 34–43 35
including hydrocarbons and organic matter fractions. In additionto producing a substantial amount of different organic compounds,natural fire modifies other compounds through heating (González-Pérez et al., 2004).
The impact of fire on the amount and quality of soil organicmatter (SOM) depends mainly on its intensity and recurrence,vegetation type, soil texture and local climate (González-Pérezet al., 2004; Knicker, 2007; Satín et al., 2008; Vergnoux et al., 2011;Granged et al., 2011). In general, SOM heating can considerablyincrease the aromaticity of the remaining organic matter to thedetriment of carboxyl and aliphatic groups (Almendros et al.,1992). The structures formed are derived from carbon hydrates,lipids, alkylated macromolecules and peptides. As these structuresare more recalcitrant, they are not readily humified and can beextracted as the humic fraction (Vergnoux et al., 2011).
Dry soil is an efficient insulator, and the effects of fire are usuallyrestricted to the upper centimeters of the soil (Debano et al., 1998),which receives only a small fraction of the heat produced. Thetemperatures attained in the different soil layers, the heatexposure time and the soil stability determine the nature andintensity of the changes in the chemical and physical attributes ofthe soil.
In the short term, moderate fire becomes a mineralization agentbecause the ashes produced contain high levels of P, K and Ca,which increases the nutrient availability for plant growth,especially in layers up to 0.05 m (Coutinho, 1990; Kauffmanet al., 1994; Rheinheimer et al., 2003; González-Pérez et al., 2004).In addition, vegetation fire can affect SOM stocks and quality(Roscoe et al., 2000; Knicker et al., 2005).
Pre-harvest sugarcane straw burning can compromise themaintenance of SOM levels by reducing the incorporation of crudeorganic matter and promoting mineralization of existing organicmatter. Moreover, given that soil remains bare for a long period oftime, erosion is accelerated and physicochemical attributes areaffected (Molina, 1995; Mendoza, 1996).
The effect of burning suppression and maintenance ofsugarcane straw on soil increases SOM levels as reported by Blair(2000) and Noble et al. (2003) in Australia, Dominy et al. (2002) inSouth Africa and Villegas et al. (1998) in Cuba. Studies conducted inBrazil found similar results in very clayey and medium-texturedsoil (Orlando Filho et al., 1998) but not in very sandy soil (Ball-Coelho et al., 1993).
The chemical and spectroscopic techniques applied to soilorganic matter, particularly humic substances, permit acquisitionof important information on the structural characteristics andproperties of these compounds in addition to monitoring thesefeatures throughout events and phenomena of soil (Cunha, 2005).Recent studies on soil organic carbon are based on thespectrophotometric analysis of soil humic substances, particularlyhumic acid, which allows the most detailed investigations becauseit is easier to extract, exhibits a close relationship with soil identityand especially because of its capacity to express soil trans-formations including changes caused by degrading managementpractices (Fontana et al., 2006).
The present study aimed to identify the composition andchemical properties of humified SOM through spectrophotometryand chemometric determination of humic acids extracted fromLatossolo Vermelho (Oxisol) and under a sugarcane crop chronose-quence, a Pasture area and a natural Cerrado in Goiás.
2. Material and methods
2.1. Study area description
The study was performed using Latossolo Vermelho (Oxisol)(Embrapa, 2006) with a sandy loam texture in Rio Verde, Goias
state, and managed with the pre-harvest burning of sugarcanestraw for chronosequences of 1, 5,10 and 20 years (areas 1Y, 5Y, 10Yand 20Y, respectively). The soil samples were collected at depths of0–0.05, 0.05–0.10, 0.10–0.20 and 0.20–0.30 m. The adjacent areas,which were covered by native Cerrado vegetation and Pasturegrass, were also sampled to serve as a reference of the natural soilconditions. The history of soil use in the last 40 years is described inFig. 1.
Areas cropped with sugarcane received 500 kg ha�1of 5–30–20 NPK at the initiation of planting and 500 kg ha�1of 18–00–27 NPK at ratoon. Area 10Y was first renewed in 2010, and area 20Ywas renewed on February 2, 2000 and after the 2010 crop season.In the 2009/2010 season, the sugarcane yield was 113 Mg ha�1 inY1, 111 in 5Y, 85 in Y10 and 96 in Y20. Area Y20 received annualinputs of 60 m3ha�1 of vinasse (N = 0.03, P = 29, K = 225, Ca = 70,Mg = 87, in mg L�1; pH (H2O) = 3.5).
The humic acids (HA) were isolated and purified as recom-mended by the International Humic Substance Society- IHSS(Swift, 1996). The soil samples were pretreated with 0.1 mol L�1
HCl and extracted in 0.1 mol L�1NaOH at 1:10 (v/v) soil:solventratio. The humic acids were precipitated using decreasing pH (1.0–1.5) with 6 mol L�1 HCl. This procedure was performed twice. Thehumic acids were then treated with 0.1 mol L�1 HCl and 0.3 mol L�1
HF and then dialyzed with deionized water until a negative testagainst AgNO3 was obtained, followed by freeze-drying. The totalorganic carbon (TOC) was determined in samples with 200–400 gof total carbon and using a Carlo Erba automatic C��N analyzer (EA1108, Milan, Italy) coupled to a Delta Plus continuous-flow isotoperatio-mass spectrometer (Finnigan Mat, Bremen, Germany).
2.2. Elemental composition of humic acids
Determination of C, H, N and S in the humic acid samples wasconducted using a Flash EA1112 Elemental Analyzer (ThermoFin-nigan) at the University of Coruña. The samples were weighed in9 � 5 mm tin capsules using an MX5 Microbalance (Mettler Toledo,1 mg resolution) and analyzed by spontaneous combustion in aquartz tube containing Cu/WO3 and maintained at 1020 �C.Sulfanilamide and BBot were used as standards for C, H, N and Squantification. The C, H and N levels (in percentage) were correctedto a dry ash-free base using data from thermogravimetric analysisand according to the equation: %corrected = %original � 100/(100 � %humidity � %ash). The oxygen level was obtained bysubtracting the corrected level of the other elements: %O = (100 � %C � %H � %N). The atomic ratios were calculated usingthe formulas: H/C = (%H/1)/(%C/12); O/C = (%O/16)/(%C/12); O/H = (%O/16)/(%H/1) and C/N = (%C/12)/(%N/14).

36 C.Q. Rossi et al. / Agriculture, Ecosystems and Environment 216 (2016) 34–43
2.3. Ultraviolet–vis spectroscopy (UV–vis) and E4/E6 ratio
The UV–vis spectra were obtained in a Zuzi 4418 spectropho-tometer at the University of Coruña (UDC). The samples wereexamined in the UV region (200–380 nm) and visible light (380–600 nm). The spectra were recorded at 25 �C with an opticalconstant of 1 cm and in a solution of 2 mg HA in 10 mL of0.05 mol L�1 NaHCO3. The E4/E6 ratio (ratio of optical density at465 nm and 665 nm) was also calculated.
2.4. Fourier transform infrared spectroscopy (FTIR)
The FTIR spectra between 400 and 4000 cm�1 (4 cm�1
resolution) were obtained in a Bruker vector 22 spectrophotometerat the Servizo de apoio á investigación (SAI) of the University ofCoruña. The Mid-IR transmittance was obtained from samplesembedded in KBr pellets. In this regard, 2 mg of freeze-dried HAwas mixed with 200 mg of KBr and ground in an agate mortar andpressed in 13 mm pellet molds under an applied load of 10 Mg andusing a hydraulic press.
2.5. Carbon-13 nuclear magnetic resonance (13C NMR)
A Bruker AV500 spectrometer equipped with a dual cryoprobefor 1H and 13C was used to perform the 13C NMR spectroscopy at the
Table 1Total organic carbon (TOC),Elemental composition of humic acids extracted from soil i
System Soil Humic acids
%TOC % C % H % N
0.0–0.05 mY1 1.72b 49.01b 5.26a 3.49a
Y5 4.08a 48.95b 4.58c 3.49a
Y10 2.75b 47.42d 3.72e 3.19b
Y20 2.68b 49.22a 4.30d 3.38a
Median 2.68 48.98 4.44 3.43
Error 0.83 0.41 0.31 0.07
Cerrado 4.23a 47.74c 4.49c 3.40a
Pasture 4.12a 47.37d 4.88b 3.45a
0.05–0.10 mY1 2.11b 52.15a 4.32c 3.82a
Y5 4.15a 51.81b 4.54b 3.76a
Y10 2.52b 52.11a 4.07d 3.54b
Y20 2.70b 51.29c 4.24c 3.56b
Median 2.77 51.96 4.28 3.66
Error 0.76 0.19 0.09 0.07
Cerrado 4.18a 51.31c 4.63b 3.75a
Pasture 3.65a 47.49d 4.81a 3.55b
0.10–0.20 mY1 2.26b 50.86b 4.74b 3.79b
Y5 2.78b 51.11a 4.76b 3.79b
Y10 2.08b 50.76c 3.97e 3.34c
Y20 1.57b 49.42c 4.39d 3.43c
Median 2.12 50.53 4.56 3.61
Error 0.43 0.37 0.18 0.11
Cerrado 2.00b 50.68b 4.59c 4.09a
Pasture 4.08a 41.38d 5.25a 3.00d
0.20–0.30 mY1 1.69b 51.06b 4.44c 3.86c
Y5 1.66b 49.45d 4.70b 4.08b
Y10 1.62b 50.70c 3.95a 3.45d
Y20 1.96b 46.62e 4.23d 3.44d
Median 1.72 50.07 4.33 3.65
Error 0.13 1.00 0.15 0.15
Cerrado 1.79b 58.46a 5.18a 4.84a
Pasture 3.03a 50.41c 5.14a 3.92c
Y1, Y5, Y10 and Y20: 1, 5, 10 and 20 years under sugarcane-burning management. Soil
Servizo de apoio á investigación (SAI) at the University of Coruña.The humic acids were solubilized into an alkaline solution(0.1 mol L�1 NaOH prepared with D2O). A power gated decouplingpulse sequence with a 45 degree pulse for 13C was used. Theacquisition time was 1.09 s in conjunction with 1 s of relaxationdelay and producing 20,000–40,000 scans per sample (12–24 h).
For each treatment, the relative intensity of each band and theproportion of aliphaticity and aromaticity (in percent) werecalculated based on the respective spectral range and accordingto Stevenson (1994):
Aliphaticity ð%Þ ¼ area of the aliphatic C signals ð0 � 100Þarea of the C signals
� 100%
Aromaticity ð%Þ ¼ area of the aromatic Csignals ð110 � 160ppmÞarea of the Csignals ð0 � 160ppmÞ
� 100%
2.6. Statistical analysis of spectral data from elemental composition,FTIR and 13C NMR
Samples of TOC and the elemental composition were confirmedby the Lilliefors test and homocedasticity by the Cochran &
n areas managed with sugarcanechronosequences in a Cerrado area in Goiás.
% O H/C O/C O/H C/N
42.24d 1.30a 0.60ns 0.50b 16.40c
42.98c 1.10b 0.70ns 0.60b 16.40c
45.67a 0.90c 0.70ns 0.80a 17.30a
43.10c 1.00c 0.70ns 0.60b 17.00b
43.04 1.05 0.70 0.60 16.700.74 0.08 0.02 0.06 0.2244.37b 1.10b 0.70ns 0.60b 16.40c
44.30b 1.20a 0.70ns 0.60b 16.00d
39.71e 1.00b 0.60ns 0.60ns 15.90d
39.89d 1.10a 0.60ns 0.50ns 16.10c
40.28c 0.90b 0.60ns 0.60ns 17.20a
40.91b 1.00b 0.60ns 0.60ns 16.80b
40.08 1.00 0.60 0.60 16.400.26 0.04 0.00 0.06 0.3040.31c 1.10a 0.60ns 0.50ns 16.00d
44.15a 1.20a 0.70ns 0.60ns 15.60e
40.61d 1.10b 0.60b 0.50ns 15.70d
40.34e 1.10b 0.60b 0.50ns 15.70d
41.93c 0.90c 0.60b 0.70ns 17.70a
42.76b 1.10b 0.60b 0.60ns 16.80b
41.27 1.10 0.60 0.55 16.250.56 0.05 0.00 0.04 0.4840.64d 1.10b 0.60b 0.60ns 14.50e50.37a 1.50a 0.90a 0.60ns 16.10c
40.64c 1.00b 0.60a 0.60a 15.40c
41.77b 1.10a 0.60a 0.60a 14.10e
41.90b 0.90b 0.60a 0.70a 17.10a
45.71a 1.10a 0.70a 0.70a 15.80b
41.83 1.05 0.60 0.65 15.601.10 0.04 0.02 0.02 0.6131.52d 1.10a 0.40b 0.40b 14.10e
40.53c 1.20a 0.60a 0.50b 15.00d
from natural Cerrado and Pasture areas was sampled as a reference.

C.Q. Rossi et al. / Agriculture, Ecosystems and Environment 216 (2016) 34–43 37
Bartlett’s test; the results were analyzed in a completelyrandomized design with 6 areas (1-, 5-, 10- and 20-year oldsugarcane crop, Cerrado vegetation and forage grass), and 6repetitions for each parameter were evaluated up to a depth of0.3 m. The F-test (ANOVA), followed by Scott-Knott for multiplecomparisons, was applied using the SAEG 9.0 (Sistema de AnálisesEstatísticas e Genéticas—UFV) statistical package. The errorprobability was set at 0.05.
The Statgraphics1 Centurion XVI package (StatPoint Technolo-gies, Inc.) was used to perform the Principal Component Analyses(PCA) using data on the humic acid elemental composition. TheUnscrambler1 X 10.3 package (Camo Software AS Inc., Oslo,Norway) was used to perform Principal Component Analysis (PCA)using data on the FTIR and 13C NMR spectra.
For 13C NMR spectrometrical data, the integrated regions ofeach carbon type were loaded as a function of carbon structure (0–45 ppm for the aliphatic groups, 45–60 ppm for the N-aliphatic andmethoxyl, 60–110 ppm for the O-aliphatic, 110–140 ppm for the C-aromatic, 140–160 ppm for the O-aromatic, 160–185 ppm for thecarboxyl and 185–230 ppm for the carbonyl). The regions assumednon-integrated were assigned a value of zero. The data weretranformed using the equation
ffiffiffiffiffiffiffiffiffiffiffiffiffiffiffiffin þ 1ð Þp
, where n is the integrationvalue obtained in the spectra and then loaded in the computationalpackage to produce a 24 �10 matrix (scores:integration region/loading: type of carbon structure). The matrix was then analyzedby PCA (maximum of 7 PCs) using the cross validation method andNIPALS algorithm (non-linear iterative partial least squares). Thenumber of aromatic and aliphatic structures was calculated (inpercent) based on their location in the PCA graphs produced in Bi-plot (loadings:scores).
For FTIR, a 16 � 1915 (scores:loading) matrix was created usingonly the spectra of the HA samples of soil managed with sugarcanestraw burning. After loading and normalization, FTIR data weresubjected to PCA with a maximum number of 7 principalcomponents (PC) and using the cross validation methods andNIPALS algorithm (non-linear iterative partial least squares).
3. Results and discussion
3.1. Elemental composition of humic acids
The elemental composition of humic acids free of moisture andash and their atomic ratios are shown in Table 1. The carbonproportion in HA, except in the Y20 area (at 0.20–0.30 m), showed asmall variation as a function of burning management time in thefour evaluated soil layers. However, the carbon content was lowerat 0.0–0.05 m than in the deeper layers. When comparing the mean
Fig. 2. PCA plot for elemental composition of the humic acids.
HA carbon content in the burned areas at the different depths tothe respective controls (Cerrado and Pasture grass), a slightincrease in depth was observed at a depth of 0.0–0.05 m. In the0.05–0.10 m and 0.10–0.20 m layers, the mean carbon content wassimilar to that of HA in the Cerrado area, but in the deepest layer, itwas similar to that quantified in the Pasture grass area.
The hydrogen content was specific for each HA and did notchange with the burning management time at the different soillayers. However, the mean HA nitrogen content in the top layer(0.0–0.05 m) was smaller than in the other depths.
Regarding TOC, a decrease was observed for soil carbon wherethe fire was applied with respect to both the Cerrado and Pasturesoils. Interestingly, soils with a burning application for five yearshad the lowest losses of TOC. Other studies have shown that theapplication of burning causes TOC losses in soil (Chen andShrestha, 2012; Badía-Villas et al., 2014).
The principal component analysis (PCA) confirmed the findingsregarding the elemental composition (Fig. 2). With a totalexplained variability of 61.34%, the PCA plot showed HA separationinto two groups in component PC-1. The region of positive PC-1values grouped HA from the surface layers (0.0–0.05 and 0.05–0.10 m), whereas HA from deeper layers were positioned in theregion of negative values. The PCA showed that the top soil HA ismore associated with parameters from elemental composition butnot HA from the deepest layers.
The PCA confirmed that the highest changes occurred in themost superficial layers. In particular, HA in the 0.0–0.05 m layershowed a close relationship with carbon, oxygen, the C/N ratio andnitrogen levels. In the 0.05–0.10 m layer, HA showed a narrowrelationship with hydrogen content and the O/C and the H/C ratio.
The results indicate that at 0.0–0.05 m, sugarcane burningdecreased the mean HA carbon and nitrogen levels and increasedthe HA oxygen, thereby increasing the O/C and C/N ratio.
The reported HA elemental composition and atomic ratio wereobtained under specific management conditions and are similar tothose reported in other studies (Fontana et al., 2010; Assis 2008;Crespo 2011). Although studies on this issue are scarce, changes inHA composition as a function of sugarcane burning have beenobserved in other conditions. For instance, González-Pérez et al.(2004) report that burning events caused carbon loss by over 50%in Humic Cambisol (Inceptsol) up to a depth of 0.10 m, and carbonloss was also detected in North American soils subjected to burningpractices for 10 years. Moreover, Yustiawati et al. (2014) found thatthe H/C ratio in HA from burned soil is lower than in HA fromunburned soil. Despite these findings, the effects reported in otherstudies were not detected in the present investigation.
3.2. UV–vis spectroscopy
The UV–vis spectra of the HA samples decreased with anincrease in wavelength (Fig. 3). In soil samples from sugarcaneareas, the highest absorption was detected in the 300–600 nmrange and a shoulder was observed at 350–400 nm. However, thispattern was not observed in HA from Cerrado and Pasture areas.The identified pattern of the UV–vis spectra may be associatedwith the elemental composition (Fig. 3) and the E4/E6 ratio of HA atthe different layers and management systems (Table 2). Accordingto Schnitzer (1985), the increase in light absorption in the UV–visspectra is related to the increase in aromatic condensation ofhumic substances, C content and molecular mass. Compared to HAfrom Cerrado and Pasture areas, the HA from areas with strawburning showed higher light absorption as a result of the aromaticnature of carbon and as indicated by the E4/E6 ratio (Table 2).
HA isolated from soil under burned sugarcane for 1, 5 and 20years (Y1, Y5, Y10 and Y20) at 0.0–0.05 m showed increasedabsorbance because of the increase in the higher levels of aromatic

Fig. 3. UV–visible spectra of humic acids extracted from soil under a pre-harvest sugarcane straw burning chronosequence in a Cerrado area in Goiás.Soil from naturalCerrado and Pasture areas was sampled as reference. (A) 0–0.05 m; (B) 0.05–0.10 m; (C) 0.10–0.20 m; (D) 0.20–0.30 m.
38 C.Q. Rossi et al. / Agriculture, Ecosystems and Environment 216 (2016) 34–43
hydrocarbons (<E4/E6). The higher absorbance of HA isolated fromY1, Y5 andY10 at 0.05–0.10 m was a consequence of C incorpo-ration, whereas in HA isolated from Y20, this pattern is explainedby the increase in the content of aromatic hydrocarbons (<E4/E6).At 0.10–0.20 m, the increase in absorbance by HA from Y1, Y5, Y10and Y20 results from an increase in C content. At 0.20–0.30 m, thehighest absorbance is related to the dominance of aromatic C in HAfrom sugarcane areas.
In general, the more pronounced differences in the E4/E6 ratio ofHA from burned (Y1, Y5, Y10 and Y20) and control (cerrado andPasture grass) areas were found in the 0.0–0.05 m layer. Combinedwith the spectral behavior of HA from the different samples, thisresult is in accordance with the elemental analysis that showed alower H/C ratio in HA from burned soil, which is related to thehigher aromaticity of this humic fraction in the top soil.
Similar to the present study, others have applied the UV–vistechnique to investigate the E4/E6 ratio in SOM. In HA sampled inthe Amazonian region, Cunha (2005) found an E4/E6 ratio of 4.0 insoil from crops and forests affected by anthropogenic factors and aratio of 6.0 in forest areas without anthropogenic impact. Fontana
Table 2The E4/E6 ratio of humic acids extracted from soil under chronosequence ofsugarcane straw burning, Cerrado and pasture areas in Goiás.
Systems Depth (m)
0.0–0.05 0.05–0.10 0.10–0.20 0.20–0.30
Y1 5.24 5.06 5.56 4.83Y5 5.71 6.28 7.30 7.16Y10 4.87 4.69 5.36 5.66Y20 3.47 4.73 4.93 5.47Cerrado 6.09 6.55 7.13 6.10Pasture 5.15 4.98 5.62 5.81
Y1, Y5, Y10 and Y20: 1, 5, 10 and 20 years under sugarcane-burning management.Soil from natural Cerrado and Pasture areas was sampled as a reference.
et al. (2010) also found a higher E4/E6 ratio in forests compared tosugarcane areas submitted to burning practices for 50 years andPasture areas. In a Pinus forest, Tinoco et al. (2006) observed alower E4/E6 ratio in soil in burned areas because the fire promotesmolecular condensation, which results in lower E4/E6 ratios. Inaddition, Crespo (2011) showed that the E4/E6 ratio is higher in thetopsoil of burned areas (0.0–0.02 m).
3.3. Fourier transform infrared spectroscopy (FTIR)
Fig. 4 shows the FTIR spectra of HA from burned and referenceareas organized according to soil depth. The FTIR spectra indicatethe occurrence of the same functional groups, irrespective of thesampling site. The spectral bands did not indicate visible differ-ences associated with specific functional groups for any of thestudied conditions.
However, the spectral range was similar to that reported in anumber of studies (Dick et al., 2008; Czycza, 2009; Dias et al., 2009;Dobbss et al., 2009; Fontana et al., 2010; Crespo, 2011). Wide bands,typical of HA spectra, were observed in the 3440–3380 cm�1 rangeand correspond to O��H stretching of the phenolic groups, thecontribution of aliphatic OH groups and NH from several functionalgroups (Vergnoux et al., 2011). The 3000–2800 cm�1 range, whichindicates the level of humic substance saturation, exhibits twobands: one at 2925 cm�1 and the other at 2855 cm�1. These bandscorrespond to the asymmetrical and symmetrical C��H stretch ofCH2 and CH3, respectively (Baes and Bloom, 1989; Niemeyer et al.,1992). A signal at 2360 cm�1 was observed in the Y20 samplescollected at 0.0–0.05 m, Y1 and Pasture at 0.05–0.10 m and athigher intensity in the Pasture at 0.10–0.20 m. Narimoto (2006)attributed this band to the vibration of the carboxyl group (COOH).In the 1720–1600 cm�1 range, two other bands were identified andcorresponded to the C¼O stretch of carboxyl, aldehyde and ketonegroups, and the other band (ca. 1627 cm�1) represented several
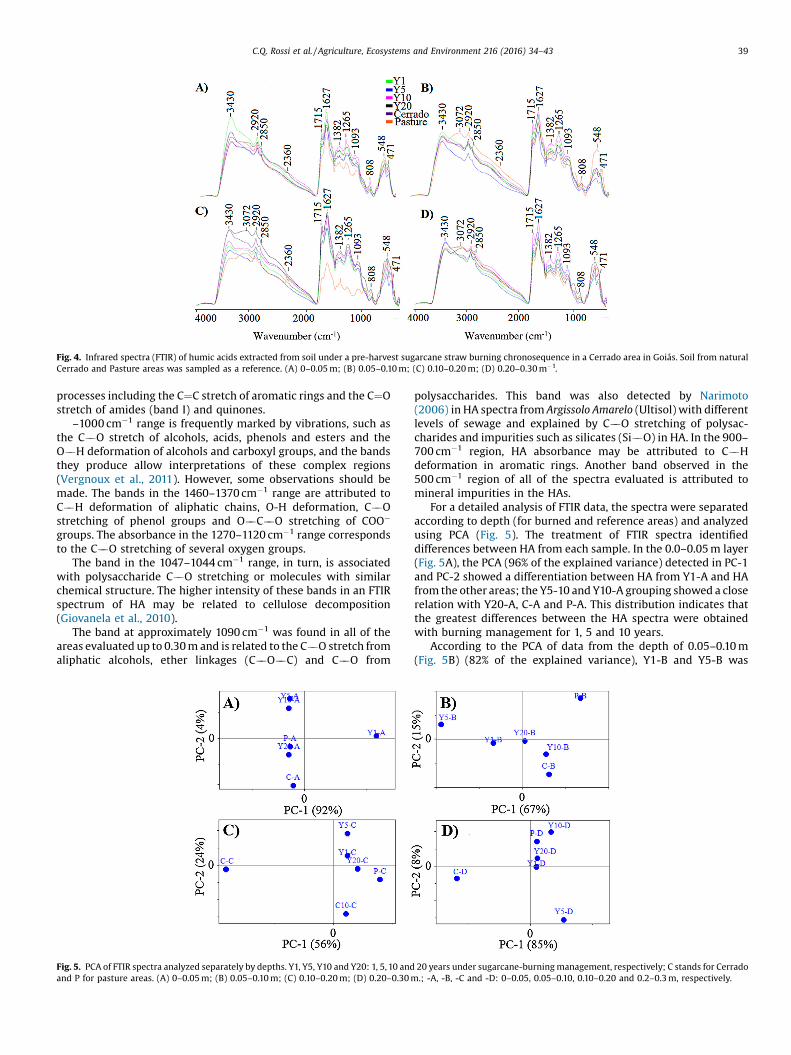
Fig. 4. Infrared spectra (FTIR) of humic acids extracted from soil under a pre-harvest sugarcane straw burning chronosequence in a Cerrado area in Goiás. Soil from naturalCerrado and Pasture areas was sampled as a reference. (A) 0–0.05 m; (B) 0.05–0.10 m; (C) 0.10–0.20 m; (D) 0.20–0.30 m�1.
C.Q. Rossi et al. / Agriculture, Ecosystems and Environment 216 (2016) 34–43 39
processes including the C¼C stretch of aromatic rings and the C¼Ostretch of amides (band I) and quinones.
–1000 cm�1 range is frequently marked by vibrations, such asthe C��O stretch of alcohols, acids, phenols and esters and theO��H deformation of alcohols and carboxyl groups, and the bandsthey produce allow interpretations of these complex regions(Vergnoux et al., 2011). However, some observations should bemade. The bands in the 1460–1370 cm�1 range are attributed toC��H deformation of aliphatic chains, O-H deformation, C��Ostretching of phenol groups and O��C��O stretching of COO�
groups. The absorbance in the 1270–1120 cm�1 range correspondsto the C��O stretching of several oxygen groups.
The band in the 1047–1044 cm�1 range, in turn, is associatedwith polysaccharide C��O stretching or molecules with similarchemical structure. The higher intensity of these bands in an FTIRspectrum of HA may be related to cellulose decomposition(Giovanela et al., 2010).
The band at approximately 1090 cm�1 was found in all of theareas evaluated up to 0.30 m and is related to the C��O stretch fromaliphatic alcohols, ether linkages (C��O��C) and C��O from
Fig. 5. PCA of FTIR spectra analyzed separately by depths. Y1, Y5, Y10 and Y20: 1, 5, 10 andand P for pasture areas. (A) 0–0.05 m; (B) 0.05–0.10 m; (C) 0.10–0.20 m; (D) 0.20–0.30 m
polysaccharides. This band was also detected by Narimoto(2006) in HA spectra from Argissolo Amarelo (Ultisol) with differentlevels of sewage and explained by C��O stretching of polysac-charides and impurities such as silicates (Si��O) in HA. In the 900–700 cm�1 region, HA absorbance may be attributed to C��Hdeformation in aromatic rings. Another band observed in the500 cm�1 region of all of the spectra evaluated is attributed tomineral impurities in the HAs.
For a detailed analysis of FTIR data, the spectra were separatedaccording to depth (for burned and reference areas) and analyzedusing PCA (Fig. 5). The treatment of FTIR spectra identifieddifferences between HA from each sample. In the 0.0–0.05 m layer(Fig. 5A), the PCA (96% of the explained variance) detected in PC-1and PC-2 showed a differentiation between HA from Y1-A and HAfrom the other areas; the Y5-10 and Y10-A grouping showed a closerelation with Y20-A, C-A and P-A. This distribution indicates thatthe greatest differences between the HA spectra were obtainedwith burning management for 1, 5 and 10 years.
According to the PCA of data from the depth of 0.05–0.10 m(Fig. 5B) (82% of the explained variance), Y1-B and Y5-B was
20 years under sugarcane-burning management, respectively; C stands for Cerrado.; -A, -B, -C and -D: 0–0.05, 0.05–0.10, 0.10–0.20 and 0.2–0.3 m, respectively.

40 C.Q. Rossi et al. / Agriculture, Ecosystems and Environment 216 (2016) 34–43
separated from the other samples, which indicated differences inthe HA spectral characteristics. For data of 0.10–0.20 m (Fig. 5C),the PCA (80% of explained variance) indicated no differencesamong HA from the burned areas (i.e., between these areas) andthat of the Pasture area. This indicates that at this depth, FTIRspectra did not indicate changes in functional groups caused byburning. At the depth of 0.20–0.30 m, the PCA showed the samedistribution previously reported (Fig. 5D) (93% of the explainedvariance).
The greater changes in FTIR spectra were detected in the mostsuperficial layers (0.0–0.05 m and 0.05–0.10 m), and after 20 yearsof burning management, the HA in the top soil was different fromHA in the reference areas. The chemometric treatment of the FTIRspectra therefore allowed confirmation of the results of theelemental composition analysis. The main changes in the contentof the elements and atomic ratios were detected in the two mostsuperficial layers.
3.4. Carbon 13 nuclear magnetic resonance spectroscopy (13C NMR)
Table 3 shows the frequency of the functional groups associatedwith the bands representing the aliphatic (0–45 ppm), N-aliphaticand methoxyl (45–60 ppm), O-aliphatic (60–110 ppm), C-aromatic(110–140 ppm), O N-aromatic (140–160 ppm), carboxyl (160–185 ppm) and carbonyl groups (185–230 ppm). The signatures ofthe HA spectra are similar to those reported for other areas(Canellas et al., 2007; Dick et al., 2008; Spaccini and Piccolo, 2009;Crespo, 2011; Aguiar et al., 2012). The main signals were associatedwith aliphatic carbon at 22, 28 and 30 ppm, which can beattributed to end-methyl groups, aliphatic methylenes and longalkyl chains of varied origin (such as fatty acids, fats, cutin andother aliphatic biopolymers), respectively (Cunha, 2005). Lower-
Table 3Distribution (%) of carbon compounds, aliphaticity index (Aliph) and aromaticity index
Area Chemical shift (ppm)
0–45 46–60 60–90 90–110 110–140
CAlk-H,R CAlk-O,N CAlk-O CAlk-di-O CAr-H,R
0.0–0.05 mY1 33.6 9.3 6.5
Y5 14.5 10.9 11.8 19.1
Y10 4.6 3.7 6.5 34.3
Y20 10.3 6.5 2.8 14.0
Cerrado 18.0 1.8 6.3 1.8 13.5
Pasture 30.4 5.9 11.8 10.8
0.05–0.10 mY1 7.4 2.5 13.1 30.3
Y5 9.4 8.5 15.1 25.5
Y10 3.2 1.6 5.6 21.4
Y20 22.4 5.1 11.2 9.2
Cerrado 20.9 2.6 0.0 7.0
Pasture 15.8 21.8 5.9 12.9
0.10–0.20 mY1 18.5 4.6 1.9 1.9 29.6
Y5 34.7 9.2 1.0 18.4
Y10 27.1 11.8 14.1 1.2
Y20 13.4 7.2 25.8 5.2 20.6
Cerrado 33.0 1.9 13.2 4.7 5.7
Pasture 22.6 0.9 18.3 36.5
0.20–0.30 mY1 11.8 2.0 12.7 0.0 47.1
Y5 38.5 3.4 32.5 6.8
Y10 35.0 5.1 4.3
Y20 10.3 10.3 3.4 17.2
Cerrado 17.1 1.9 17.1 3.8 17.1
Pasture 12.9 12.3 8.0 16.6
Y1, Y5, Y10 and Y20: 1, 5, 10 and 20 years under sugarcane-burning management, resp
intensity signals (56 ppm) attributed to C-methoxyl overlap the N-C-alkyl signal, which exhibits a chemical shift between 46 and67 ppm (Preston, 1996). These signals likely result from theincorporation of lignin and similar components into the soil (Pérezet al., 2004; Cunha, 2005). The signal of some samples is observedin the 72–75 ppm region, which indicates the overlappingresonance of carbons (C2, C3 and C5) in the pyranose structureof cellulose and hemicellulose (Aguiar et al., 2012) or maycorrespond to carbon atoms of the polysaccharide rings (Giovanelaet al., 2010). Different signals in the 65–110 ppm region areattributed to monomeric units of oligosaccharide and polysaccha-ride chains of plant tissues (Spaccini and Piccolo, 2009). Aresonance in the 130 ppm region is associated with the occurrenceof aromatic and unsaturated carbons, whereas resonance at152 ppm is related to carbons bonded to phenols and otheraromatic compounds that contain C, O and S. Considering themethoxyl (55 ppm) and phenolic (152 ppm) signals, lignins areassumed to be the predominant aromatic structure (Xiaoli et al.,2007). At approximately 176 ppm, the spectra showed signals withsimilar intensity, indicating a high content of functional carboxylgroups, amide carbon and ester of vegetal and microbial origin. Firelikely increases the proportion of aromatic compounds in humicsubstances of the superficial soil layers (Baldock and Smernik,2002; Knicker, 2007). This pattern was detected in the presentstudy at 0.0–0.05 m, where the contribution of aromatic com-pounds increased with burning management up to a period of 10years. At 0.05–0.10 m, an inverse pattern was observed with ahigher contribution of aromatic components, but in the otherlayers (0.10–0.20 and 0.20–0.30), the aliphatic componentscontributed more. The reference areas showed higher homogenei-ty in signal distribution with C-alkyl and O-alkyl content 70%higher in the Cerrado and 50% higher in the Pasture areas than in
(Arom) of humic acids.
140–160 160–185 185–230 Aliph AromCAr-O,N CCOO/NCO (H,R) CCO
29.0 21.5 86.8 13.21.8 41.8 64.1 35.9
50.9 30.2 69.853.3 13.1 58.3 41.751.4 7.2 67.4 32.6
4.9 34.3 2.0 75.4 24.6
0.8 44.3 1.6 42.4 57.61.9 39.6 54.7 45.31.6 58.7 7.9 31.0 69.02.0 43.9 6.1 77.6 22.4
67.0 2.6 77.1 22.91.0 29.7 12.9 75.9 24.1
38.9 4.6 47.5 52.534.7 2.0 71.0 29.035.3 10.6 97.8 2.226.8 1.0 71.4 28.641.5 90.3 9.721.7 53.3 46.7
2.0 24.5 35.1 64.91.7 17.1 97.9 2.1
53.8 1.7 100.0 0.058.6 58.3 41.7
1.9 41.0 67.7 32.349.1 1.2 66.7 33.3
ectively.

Fig. 7. Frequency (%) of aromatic and aliphatic structures in humic acids (HA) fromdifferent soil layers, calculated according to their distribution in PCA plots of 13CNMR spectra.
C.Q. Rossi et al. / Agriculture, Ecosystems and Environment 216 (2016) 34–43 41
areas under sugarcane straw burning. This result indicates thatorganic matter in the reference areas is less humified than in areasfrequently managed with burning (Table 3).
The pattern described by Crespo (2011) differs from the resultspresented in the present study and shows that HA in burned soil,especially in the most affected layer (0.0–0.02 m), is more similarto the most humified organic matter than unburned soil samples,which supports the theory that humic acids become morearomatic with decomposition.
In the 0.0–0.05 m layer, which is most susceptible to fire, thecontent of the carboxyl groups increased, especially in the Y20area. The advance in the humification process increases thecontent of carboxyl aromatic groups, whereas O-aromatic andmethoxyl groups decreased because they are components of lignin,which declines with SOM transformations (Leinweber et al., 1993).
Canellas et al. (2007) reported that the main effect of sugarcanestraw preservation on SOM is the significant increase in C levels,which is attributed to aromatic compounds and/or alkenes thatshow a chemical shift between 110 and 150 ppm. They report thatin the 0.0–0.10 and 0.10–0.20 m layers, C content increased up tofour times compared to the burned sugarcane areas. They alsofound that a lower content of C atoms was attributed to carboxylgroups in crude sugarcane areas (a chemical shift between 165 and200 ppm including the absorption of ketones, esters and amides).
The increase in C-alkyl content in the decomposed matter canbe attributed to the selective preservation of the most recalcitrantmaterials, which resist biological activity (Theng et al., 1992;Canellas et al., 2007). The presence of carbohydrate C may indicatemicrobial degradation of other C sources or the occurrence ofaromatic biopolymers such as lignin. The results obtained by FTIRspectroscopy and 13C NMR show that sugarcane management withstraw burning practices affects the structural properties of the HAfraction of SOM and thereby affects C humification. As indicated byFTIR spectroscopy, fire affected the shape of some bands of HAspectra, which is related to the chemical environment of therespective functional groups. This was corroborated because 13CNMR showed that the most affected C structures were CAlq-di-O
(90–110 ppm), CAr-O (140–160 ppm) and CC¼O (180–230 ppm).
3.5. Statistical treatment of spectral data obtained by FTIR and 13CNMR
The PCA plots grouped 13C NMR spectra of HA according to theintegration of each region (Fig. 6). Two components explained 78%of spectral variance (PC-1: 59%; PC-2: 19%). Likewise, in theanalysis of the functional groups (Table 3), the PCA confirmed thatCAlq-H,R (0–45 ppm) and CAr-H,R (110–140 ppm), the structures thatdetermine aromatic and aliphatic properties, respectively, were
Fig. 6. PCA plot of 13C-NMR spectra in the integration regions. Y1, Y5, Y10 and Y20: 1, 5Cerrado and P for pasture areas. (A) 0–0.05 m; (B) 0.05–0.10 m; (C) 0.10–0.20 m; (D) 0.20
most affected by sugarcane straw burning. A total of 58% of HAsshowed aromatic properties, and 41% showed aliphatic character-istics (Fig. 6). Neither burning management time nor soil depthaffected group formation.
The PCA plot permitted detection of the amount of HAs withhigher aromaticity in relation to the depth evaluated (Fig. 7). Thehighest content of HAs with aromatic characteristics was found inthe most superficial layers (0.0–0.05 m and 0.05–0.10 m), whichconfirmed that the effects of fire on HA structure are more severe inthe top soil layers. This occurs because aromatic structures aremore resistant to soil heating by sugarcane straw burning.Irrespective of the length of time of the burning practices, from0.10 m to the deeper layers, the impact of fire on the aromatic-aliphatic properties of HAs seems to be lower.
The spectra obtained using FTIR were also subjected to PCA(Fig. 8), which allowed a better understanding of the burningeffects on HA structure. The PCA graph shows that two groupsexplain 97% of the data variance (PC-1: 95%; PC-2: 2%). Theseparation between spectra from 0.0–0.05 m HA and HA fromother layers is clear, irrespective of the length of time underburning management. As previously discussed, the differences inthe bands and intensity of the FTIR spectra are related to thechemical environment and functional groups.
The significant difference between HAs at 0.0–0.05 m and in theother layers reinforces the strong effects of fire on HA structure andproperties (especially aromaticity) at this depth, irrespective of thelength of time burning practices had been adopted.
, 10 and 20 years under sugarcane-burning management, respectively; C stands for–0.30 m.; -A, -B, -C and -D: 0–0.05, 0.05–0.10, 0.10–0.20 and 0.2–0.3 m, respectively.

Fig. 8. PCA from FTIR spectra. Y1, Y5, Y10 and Y20: 1, 5, 10 and 20 years under sugarcane-burning management, respectively; C stands for Cerrado and P for pasture areas. (A)0–0.05 m; (B) 0.05–0.10 m; (C) 0.10–0.20 m; (D) 0.20–0.30 m.; -A, -B, -C and -D: 0-0.05, 0.05–0.10, 0.10–0.20 and 0.2–0.3 m, respectively.
42 C.Q. Rossi et al. / Agriculture, Ecosystems and Environment 216 (2016) 34–43
4. Conclusions
Sugarcane crop management with pre-harvest straw burningcan affect both the chemical composition and structural propertiesof soil HA, especially in the most superficial layers. At 0.0–005 m,HA composition is characterized by decreased mean levels of C andN and enrichment of O. Aromaticity is the structural property thatindicates the effects of fire on HAs, and although this propertyincreased in burned areas in the 00.0–0.05 and 0.05–0.10 m layers,the highest high-intensity HA content was observed in the mostsuperficial layer (0–0.05 m), irrespective of the length of time ofthe burning practices.
The present study is important in assessing the impacts of pre-harvest sugarcane straw burning management on humified SOMbecause it combines spectrometric and chemiometric techniques,which represent a study procedure that can be used as amethodological basis to monitor phenomena such as soil burningmanagement.
Acknowledgements
We are grateful for the support provided by CPGA-CS/UFRRJ,PROEX, CNPq, CAPES, the Federal Institute of Goiás—Campus RioVerde, the Power Station and the University of Coruña.
Appendix A. Supplementary data
Supplementary data associated with this article can be found, inthe online version, at http://dx.doi.org/10.1016/j.agee.2015.09.022.
References
Aguiar, N.O., Olivares, F.L., Novotny, E.H., Dobbss, L.B., Balmori, D.M., Santos-Júnior, L.G., Chagas, J.G., Façanha, A.R., Canellas, L.P., 2012. Bioactivity of Humic acidsisolated from vermicomposts at different maturation stages. Plant Soil 372,161–174.
Almendros, G., González-Vila, F.J., Martin, F., Frund, R.L., udemann, H.-D., 1992. Solidstate NMR studies of fire-induced changes in the structure of humic substances.Sci. Total Environ. 117–118, 63–74.
Assis, C.P., 2008. Matéria orgânica de Latossolos Húmicos: análise térmica eespectroscópica, efeito do uso e correção química. Tese de Doutorado.Universidade Federal de Viçosa 88 pp.
Badía-Villas, D., González-Pérez, J.A., Aznar, J.M., Arjona-Gracia, B., Martí-Dalmau,C., 2014. Changes in water repellency, aggregation and organic matter of amollic horizon burned in laboratory: Soil depth affected by fire. Geoderma 213,400–407.
Baes, A.U., Bloom, P.R., 1989. Diffuse reflectance and transmission fourier transforminfrared (DRIFT) spectrocopy of humic and fulvic acids. Soil Sci. Am. J. 53, 695–700.
Baldock, J.A., Smernik, R.J., 2002. Chemical composition and bioavailability ofthermally altered Pinus resinosa (Red pine) wood. Org. Geochem. 33,1093–1109.
Ball-Coelho, B., Tiessen, H., Stewart, J.W.B., Salcedo, I.H., Sampaio, V.S.B., 1993.Residue management effects on sugarcane yield and soil properties inNortheastern Brazil. Agron. J. 85, 1004–1008.
Blair, N., 2000. Impact of cultivation and sugar-cane green trash management oncarbon fractions and aggregate stability for a Chromic Luvisol in Queensland,Australia. Soil Till. Res. 55, 183–191.
Canellas, L.P., Baldotto, M.A., Busato, J.G., Marciano, C.R., Menezes, S.C., Silva, N.M.,Rumjanek, V.M., Velloso, A.C.X., Simões, M.L., Martin-Neto, L., 2007. Estoque equalidade da matéria orgânica de um solo cultivado com cana-de-açúcar porlongo tempo. R. Bras. Ci. Solo 31, 331–340.
Chen, H.Y., Shrestha, B.M., 2012. Stand age, fire and clearcutting affect soil organiccarbon and aggregation of mineral soils in boreal forests. Soil Biol. Biochem. 50,149–157.
Coutinho, L.M., 1990. O Cerrado e a ecologia do fogo. Ciência Hoje 12, 22–30.Crespo, M.P., 2011. Impacto do fogo na matéria orgânica do solo—Caracterização
estrutural. Tese de Doutorado. Universidade de Aveiro 77 pp.Cunha, T.J.F., 2005. Ácidos húmicos de solos escuros da Amazônia: Terra Preta de
Índio. Tese de Doutorado. Universidade Federal Rural do Rio de Janeiro 118 pp.Czycza, R.V., 2009. Quantidade e qualidade da matéria orgânica do solo em sistemas
de colheita com e sem queima da cana-de-açúcar. Dissertação de Mestrado.Universidade de São 92 pp.
Debano, L.F., Neary, D.G., Folliott, P.F., 1998. Fire’s Effects on Ecosystems. John Wiley& Sons Inc., New York 333 pp.
Dias, B.O., Silva, C.A., Mercês, M.B.S., Bettiol, W., Guerreiro, M.C., Belizário, M.H.,2009. Infravermelho na caracterização de ácidos húmicos de Latossolo sobefeito de uso contínuo de lodo de esgoto. R. Bras. Ci. Solo 33, 885–894.
Dick, D.P., Barros, L.S., Inda Junior, A.V., Knicker, H., 2008. Estudo comparativo damatéria orgânica de diferentes classes de solos de altitude do sul do Brasil portécnicas convencionais e espectroscópicas. R. Bras. Ci. Solo 32, 2289–2296.
Dobbss, L.B., Rumjaneck, V.M., Baldotto, M.A., Velloso, A.C.X., Canellasm, L.P., 2009.Caracterização química e espectroscópica de ácidos húmicos e fúlvicos isoladosda camada superficial de Latossolos brasileiros. R. Bras. Ci. Solo 33, 51–63.
Dominy, C.S., Haynes, R.J., Van Antwerpen, R., 2002. Loss of soil organic matter andrelated soil properties under long-term sugarcane production on twocontrasting soils. Biol. Fert. Soils 36, 350–356.
Empresa Brasileira de Pesquisa Agropecuária (Embrapa)–Centro Nacional dePesquisa de Solos. 2006. Sistema brasileiro de classificação de solos 2a ed.Embrapa Solos, Rio de Janeiro, 306 pp.
Fontana, A., Brito, R.J., Pereira, M.G., Loss, A., Benites, V.M., 2010. Caracterização desubstâncias húmicas da camada superficial do solo sob diferentes coberturasvegetais. Magistra 22, 49–56.
Fontana, A., Pereira, M.G., Loss, A., Cunha, T.J.F., Salton, J.C., 2006. Atributos defertilidade e frações húmicas de um Latossolo Vermelho no Cerrado. Pesq.Agropec. Bras. 41, 847–853.
Giovanela, M., Crespo, J.S., Antunes, M., Adamatti, D.S., Fernandes, A.N., Barison, A.,Silva, C.W.P., Guégan, R., Motelica-Heino, M., Sierra, M.M.D., 2010. Chemical andspectroscopic characterization of humic acids extracted from the bottomsediments of a Brazilian subtropical microbasin. J. Mol. Struct. 981, 111–119.
González-Pérez, J.A., González-Vila, F.J., Almendros, G., Knicker, H., 2004. The effectof fire on soil organic matter—a review. Environ. Int. 30, 855–870.
Granged, A.J.P., Zavala, L.M., Jordán, A., Bárcenas-Noreno, G., 2011. Post-fireevolution of soil properties and vegetation cover in a Mediterranean heathlandafter experimental burning: a 3-year study. Geoderma 164, 85–94.
Kauffman, J.B., Cummings, D.L., Ward, D.E., 1994. Relationships of fire, biomass andnutritional dynamics along vegetation gradient in the Brazilian Cerrado. J. Ecol.82, 519–531.
Knicker, H., 2007. How does fire affect the nature and stability of soil organicnitrogen and carbon? A review. Biogeochemistry 85, 91–118.
Knicker, H., González-Vila, F.J., Polvillo, O., González, J.A., Almendros, G., 2005.Wildfire induced alterations of the chemical composition of humic material in aDystric Xerochrept under a Mediterranean pine forest (Pinus pinaster Aiton). SoilBiol. Biochem. 37, 701–718.

C.Q. Rossi et al. / Agriculture, Ecosystems and Environment 216 (2016) 34–43 43
Leinweber, P., Fründ, R., Reuter, G., 1993. A 13C-NMR study on the formation of soilorganic matter from grass residues. Z. Pflanzenernähr Bodenk 156, 415–420.
Mendoza, H.N.S., 1996. Efeitos de sistemas de colheita dos canaviais sobrepropriedades químicas e biológicas em solo de tabuleiro no Espírito Santo.Dissertação de Mestrado. Universidade Federal Rural do Rio de Janeiro 112 pp.
Molina, R.M., 1995. A torta de filtro e o bagaço no comportamento da biota,propriedades físicas e produtividade de um solo cultivado em cana-de-açúcar.Tese de Doutorado. Universidade Federal Rural do Rio de Janeiro 96 pp.
Narimoto, K.M., 2006. Técnicas espectroscópicas aplicadas à análise da matériaorgânica do solos em pomares de citros sob adição de lodo de esgoto.Dissertação de Mestrado. Universidade de São Paulo 112 pp.
Niemeyer, J., Chen, Y., Bollag, J.M., 1992. Characterization of humic acids, composts,and peat by diffuse reflectance fourier transform infrared spectroscopy. Soil Sci.Soc. Am. J. 56, 135–140.
Noble, A.D., Moody, P., Berthelsen, S., 2003. Influence of changed management ofsugarcane on some soil structural properties in the humid wet tropics of northQueensland. Aust. J. Agric. Res. 41, 1133–1144.
Orlando Filho, J., Rosseto, R., Muraoka, T., Zotelli, H.B., 1998. Efeitos do sistema dedespalha (cana crua x cana queimada) sobre algumas propriedades do solo.STAB-Açúcar. Álcool Subprodutos 16, 30–34.
Pérez, M.G., Martin-Neto, L., Saab, S.C., Novotny, E.H., Milori, D.M.B.P., Bagnato, V.S.,Colnago, L.A., Melo, W.J., Knicker, H., 2004. Characterization of humic acids froma Brazilian Oxisol under different tillage systems by EPR, 13C NMR, FTIR andfluorescence spectroscopy. Geoderma 118, 181–190.
Preston, C.M., 1996. Applications of NMR to soil organic matter analysis: history andprospects. Soil Sci. 161, 144–166.
Rheinheimer, D.S., Anghinoni, I., Conte, E., 2003. Sorção de fósforo em função do teorinicial e de sistemas de manejo de solos. R. Bras. Ci. Solo 27, 41–49.
Roscoe, R., Buurman, P., Velthorst, E.J., Pereira, J.A.A., 2000. Effects of fire on soilorganic matter in a Cerrado sensu-stricto from Southeast Brazil as revealed bychanges in d13C. Geoderma 95, 141–160.
Satín, C., González-Pérez, M., Otero, X.L., Vidal-Torrado, P., Macías, F., Álvarez, M.A.,2008. Characterization of humic substances in salt marsh soils under sea rush(Juncus maritimus). Estuar. Coast Shelf S. 79, 541–548.
Schnitzer, M., 1985. Nature of nitrogen in humic substances. In: Aiken, G.R.,Mcknight, D.M., Wershaw, R.L., Maccarthy, P. (Eds.), Humic Substances in Soil,Sediment, and Water. Wiley-Interscience, pp. 303–325.
Spaccini, R., Piccolo, A., 2009. Molecular characteristics of humic acids extractedfrom compost at increasing maturity stages. Soil Biol. Biochem. 41, 1164–1172.
Stevenson, F.J., 1994. Humus Chemistry: Genesis, Composition, Reactions. J. Wiley,New York pp. 496.
Swift, R.S.,1996. Organic matter characterization. In: Sparks, D.L., Page, A.L., Helmke,P.A., Loeppert, R.H., Soltanpour, P.N., Tabatabai, M.A., Johnston, C.T., Sumner, M.E.(Eds.). Methods of soil analysis. Madison: Soil Science Society of America:American Society of Agronomy (Soil Science Society of America Book Series, 5).Part 3. Chemical methods. pp. 1011–1020.
Theng, B.G.K., Tate, K.R., Becker-Heidmann, P., 1992. Towards establishing the age,location and identity of the inert soil organic matter of spodosol. Z.Pflanzenernähr Bodenk 155, 181–184.
Tinoco, P., Almendros, G., Sanz, J., González-Vásquez, R., González-Vila, F.J., 2006.Molecular descriptors of the effect off fire on soils under pine forest in twocontinental Mediterranean soils. Organic Geochem. 37, 1995–2018.
Vergnoux, A., Di Rocco, R., Domeizel, M., Guiliano, M., Doumenq, P., Théraulaz, F.,2011. Effects of forest fires on water extractable organic matter and humicsubstances from Mediterranean soils: UV–vis and fluorescence spectroscopyapproaches. Geoderma 160, 434–443.
Villegas, R., Chang, R.M., Gonzáles, M., 1998. Sostenibilidad del agroecosistema yevolución de características biogeoquímicas en estudios de larga duración concaña de azúcar. Cuba Caña 2, 11–17.
Xiaoli, C., Shimaoka, T., Xiaoyan, C., Qiang, G., Youcai, Z., 2007. Spectroscopic studiesof the progress of humification processes in humic substances extracted fromrefuse in a landfill. Chemosphere 69, 1446–1453.
Yustiawati, Y.K., Kurasaki, M., Saito, T., Hosokawa, T., Suhaemi, M., 2014. Effects offorest fire on characteristics of humic acid, extracted from peat soil in CentralKalimantan, Indonesia. Environ. Sci. Pollut. R. 22, 2384–2395.