Embed Size (px)
Citation preview

Agricultural Transformation in Zambia: Alternative Institutional Models for Accelerating Agricultural
Productivity Growth and Commercialization
by
Antony Chapoto, Steven Haggblade, Munguzwe Hichaambwa, Stephen Kabwe, Steven Longabaugh, Nicholas Sitko,
and David Tschirley
Working Paper 64 June 2012
ii
Agricultural Transformation in Zambia: Alternative Institutional Models for Accelerating Agricultural Productivity
Growth, and Commercialization
by
Antony Chapoto, Steven Haggblade, Munguzwe Hichaambwa, Stephen Kabwe, Steven Longabaugh, Nicholas Sitko, and David Tschirley
Working Paper No. 64
June 2012
Indaba Agricultural Policy Research Institute (IAPRI) 26A Middleway, Kabulonga,
Lusaka, Zambia
Chapoto is associate professor and Sitko assistant professor, International Development, in the Department of Agricultural, Food, and Resource Economics at Michigan State University and are currently on long-term assignment with the Indaba Agricultural Policy Research Institute in Lusaka, Zambia; Haggblade and Tschirley are professors, and Longabaugh is specialist, all in International Development, Department of Agricultural, Food, and Resource Economics, Michigan State University; Hichaambwa is a senior research associate and Kabwe is a research associate at the Indaba Agricultural Policy Research Institute, Lusaka.

iii
ACKNOWLEDGMENTS
The Indaba Agricultural Policy Research Institute is a non-profit company limited by guarantee and collaboratively works with public and private stakeholders. IAPRI exists to carry out agricultural policy research and outreach, serving the agricultural sector in Zambia so as to contribute to sustainable pro-poor agricultural development. We wish to acknowledge the financial and substantive support of the Swedish International Development Agency (Sida) and the United States Agency for International Development (USAID) in Lusaka. We further would like to acknowledge the technical and capacity building support from Michigan State University and its researchers, and Patricia Johannes for her formatting and editorial assistance. Any views expressed or remaining errors are solely the responsibility of the authors. Comments and questions should be directed to: The Executive Director Indaba Agricultural Policy Research Institute 26A Middleway, Kabulonga, Lusaka. Telephone: +260 211 261194; Telefax +260 211 261199; Email: kabaghec@iconnect. zm .

iv
INDABA AGRICULTURAL POLICY RESEARCH INSTITUTE TEAM MEMBERS
The Zambia-based Indaba Agricultural Policy Research Institute research team is comprised of William Burke, Antony Chapoto, Rhoda Mofya Mukuka, Munguzwe Hichaambwa, T. S. Jayne, Chance Kabaghe, Stephen Kabwe, Auckland Kuteya, Mary Lubungu, Nicole Mason, Brian Mulenga, Arthur Shipekesa, Nicholas Sitko, and Solomon Tembo. Michigan State University-based researchers associated with IAPRI are Margaret Beaver, Eric Crawford, Steven Haggblade, Chewe Nkonde, Melinda Smale, and David Tschirley.

v
EXECUTIVE SUMMARY
This paper traces the trajectories of successful commercial smallholders operating under differing sets of market institutions. Analysis focuses on maize, cotton, and horticulture, three widely marketed crops with strikingly different market institutions. Maize receives intensive government input and marketing support. In contrast, cotton relies primarily on private contract farming schemes, while horticulture enjoys no large-scale institutional support from either the public or private sectors. Using a mix of quantitative and qualitative methods, the analysis aims to identify personal characteristics and institutional factors that enable smallholder transitions to high-productivity commercial agriculture. The study concludes that only a small minority of smallholder farmers succeed in transitioning to high-productivity, high-volume commercial agriculture. Only about 20% of cotton farmers and less than 5% of maize and horticulture farmers succeed as top-tier commercial growers. Two pathways predominate among successful commercial smallholders. The low road, exemplified by cotton production, traces a gradual upward trajectory beginning with low value output and low cash input costs. Given widespread input lending from ginning companies, cotton provides an entry point for large numbers of poor but disciplined farmers with little nonfarm income. The best managers grow their cotton business slowly over time. Although low value crops such as cotton and maize cap farm earnings at modest levels, successful farmers use cotton revenues to finance asset accumulation, area expansion, entry into higher-input agriculture, and education for their children, thus opening new pathways to high-wage nonfarm employment for the next generation. The high road, exemplified by horticulture production, involves a steeper, more difficult but more rapid ascent focusing on high value products with commensurately high cash input requirements. Small initial savings finance inputs for very small horticulture plots. Successful farmers accumulate savings and increase their scale over time. After 15-20 years, the best attain high income themselves, accumulate savings that enable them to withstand periodic setbacks, and ensure their children’s future through heavy investment in education. Highly disciplined cash management and accumulation proves essential in order to finance inputs, hire labor, and cushion shocks from erratic rainfall, disease, and price swings. As a result, financial institutions, particularly for savings, provide critical support to successful smallholder commercialization.


vii
CONTENTS
ACKNOWLEDGMENTS ....................................................................................................... iii
EXECUTIVE SUMMARY .......................................................................................................v LIST OF TABLES ................................................................................................................... ix LIST OF FIGURES ................................................................................................................. ix ACRONYMS .............................................................................................................................x 1. INTRODUCTION ................................................................................................................1 2. DATA AND METHODS .....................................................................................................3 3. CONTRASTING INSTITUTIONAL ENVIRONMENTS ..................................................5 3.1. Maize .............................................................................................................................5 3.2. Cotton ............................................................................................................................7 3.3. Horticulture ...................................................................................................................8 4. A PROFILE OF COMMERCIAL SMALLHOLDERS .......................................................9 4.1. Farm Production ............................................................................................................9 4.2. Commercialization ......................................................................................................10 4.3. Farm Productivity ........................................................................................................12 4.4. Geographic Concentration ...........................................................................................14 4.5. Factors Affecting Successful Commercialization .......................................................16
4.5.1. Farm Assets .......................................................................................................16 4.5.2. Location ............................................................................................................16 4.5.3. Management ......................................................................................................18
5. LIFE HISTORIES OF SUCCESSFUL COMMERCIAL SMALLHOLDERS .................19 5.1. Alternate Trajectories to High-productivity, Commercial Agriculture ........................19 5.1.1. No Road ............................................................................................................19 5.1.2. Low Road ..........................................................................................................20 5.1.3. High Road .........................................................................................................22 5.2. Initial Endowments ..........................................................................................................23 5.3. Investment Strategies of Successful Commercial Smallholders .................................25 5.4. Rebounding from Setbacks .........................................................................................28 5.5. Common Characteristics of Successful Commercial Smallholders ............................29 5.5.1. Discipline ..........................................................................................................29 5.5.2. Treat Farming as a Business .............................................................................29 5.5.3. Good Managers .................................................................................................29 5.5.4. Invest in their Children .....................................................................................30 6. INSTITUTIONS .................................................................................................................31

viii
6.1. Institutions Affecting Farm Productivity ....................................................................31 6.1.1. Land ..................................................................................................................31 6.1.2. Input Credit .......................................................................................................31 6.1.3. Savings Institutions ...........................................................................................32 6.1.4. Management ......................................................................................................32
6.2. Markets ........................................................................................................................33 7. CONCLUSIONS.................................................................................................................34 REFERENCES ........................................................................................................................37

ix
LIST OF TABLES
TABLE PAGE 1. Alternate Institutional Models for Agricultural Commercialization ..................................3 2. Concentration of Marketed Sales .....................................................................................10 3. Poverty Trends in Zambia ................................................................................................10 4. Characteristics of Commercial Smallholders ...................................................................11 5. Productivity Differences across Seller Groups .................................................................12 6. Fertilizer Sources among Maize-growing Households ....................................................13 7. Crop Values and Input Costs ............................................................................................14 8. Probit Estimates of Determinants of Top Commercial Maize, Cotton, and Horticulture
Farmers .............................................................................................................................17 9. Cotton Sales Outlets .........................................................................................................20 10. Tillage Systems among Maize and Cotton-growing Households ....................................21 11. Composition of Horticulture Products, by Seller Group ..................................................22 12. Shifting Strategies of Commercial Smallholders .............................................................26 13. Shifting Strategies of Top Commercial Maize Sellers .....................................................27 14. Shifting Cropping Strategies of Top Commercial Cotton Farmers ..................................28 15. Educational Investments by Commercial Smallholder Farmers ......................................30 16. Maize Sales Outlets ..........................................................................................................33
LIST OF FIGURES
FIGURE PAGE 1. Trends in Cotton and Maize Production .............................................................................6 2. Population Distribution in Zambia .....................................................................................9 3. Geographic Distribution of Maize, Cotton, and Horticulture Sales .................................14 4. Geographic Distribution of Vegetable Sales to the Lusaka Market, 2008-2011 ..............15 5. Setback and Rebound .......................................................................................................19 6. Age Distribution at Start-up for Commercial Smallholders .............................................24 7. Percent of Smallholder Farmers Selling Maize, Cotton, and Horticulture .......................25 8. Price of Cotton Relative to the Price of Maize .................................................................26

x
ACRONYMS
CCS Cooperative Credit Scheme CSO Zambia’s Central Statistical Office FAOSTAT Food and Agricultural Organization Online Statistical Database FRA Food Reserve Agency FSP/FISP The Fertilizer Support Programme and its successor, the Farmer Input
Support Programme IAPRI Indaba Agricultural Policy Research Institute LINTCO Lint Company of Zambia MACO Ministry of Agriculture and Cooperatives, Zambia MCB Maize Control Board MSU Michigan State University NAMBOARD National Agricultural Marketing Board USAID United States Agency for International Development

1
1. INTRODUCTION
The process of agricultural transformation involves a shift from low-productivity, subsistence farming to high-productivity, commercial agriculture. These changes in agriculture, in turn, trigger sweeping structural changes that ripple through the broader economy. At the macro level, agricultural transitions pave the way for economic diversification into services and manufacturing. At the household level, commercialization enables agricultural specialization as well as diversification into nonfarm activities. Spatially, agricultural productivity growth and commercialization contribute to increasing geographic concentration of population and economic activity in urban centers. The widely varying institutional contexts within which agricultural transitions unfold help to shape agricultural trajectories, with consequently important implications for rural households and the macro economy. Rising agricultural productivity provides the initial spark enabling this broad structural transformation (Timmer 1988). Productivity gains in agriculture permit the release of labor and capital from agriculture for investment in manufacturing and services. Simultaneously, agricultural productivity gains give rise to farm surpluses that enable commercialization and, in turn, permit household specialization and movement to high-value products and high value added activities. As per capita income increases in agriculture, farmers diversify their consumption into nonfoods, increasing rural purchasing power and demand for nonfarm goods and services (Mellor and Lele 1973). An increasingly commercial agriculture sector demands purchased inputs of fertilizer, pumps, improved seeds, fuel, transport, processing, and repair services (Johnston and Kilby 1975). Both sources of increased agricultural purchasing power stimulate demand-led economic diversification into manufacturing and services (Haggblade, Hazell, and Dorosh 2007). Because of economies of scale in production, infrastructure, and power supply, many of these nonfarm businesses cluster in rural towns and urban centers (Renkow 2007; World Bank 2009). As a result, agricultural productivity gains and associated agricultural commercialization contribute directly to broad sectoral and spatial transformations. Commercialization and agricultural productivity advance hand in hand during this transition. Productivity gains enable farmers to generate surpluses for sale and reduce unit production costs. Market access provides the conduit for monetizing productivity gains, permitting household specialization, and kick starting the structural transformation process. Yet one component without the other will not suffice. Productivity gains without markets lead to temporary production surges and price collapses. Markets without increased farm productivity remain moribund, with farm households unable to generate surpluses for sale at competitive prices. As a result, two sets of institutions become crucial for stimulating agricultural growth – those that affect farm productivity and those governing market development. In practice, substantial variations in the structure of farmer organizations, in the political power of farm and agribusiness lobbies, and in governments’ propensity to intervene in agricultural markets give rise to a wide variety of leading actors and institutional arrangements driving successful agricultural growth trajectories (Mosher 1965; World Bank 2008; Haggblade and Hazell 2010). Some governments prefer public management of agricultural input and output markets (Kherallah et al. 2002). Others supply public goods such as research, roads, and regulatory frameworks and then let private agribusinesses manage market transactions. Over time, agricultural policies and institutions change – sometimes abruptly (Jayne et al. 2002). Therefore, emerging commercial farmers must continuously adjust to changing circumstances as they navigate the pathway to higher productivity commercial agriculture.

2
To understand how differing institutional frameworks influence farmer opportunities and agricultural trajectories, this paper examines three commercial crops with widely different institutional support systems. Zambia’s maize, cotton, and horticulture farmers all enjoy large commercial markets. However, market structures, credit systems, extension support, and government policies all differ markedly. By tracing smallholder transitions within each commodity subsector, this paper aims to understand the processes under way and to compare alternative institutional models for increasing agricultural productivity and commercialization. Using a mix of quantitative and qualitative methods, the analysis aims to identify personal characteristics and institutional factors that enable smallholder transitions to high-productivity commercial agriculture. In doing so, the paper traces two broad agricultural pathways out of poverty: a low road, involving a two-generation transition via low-value but well-structured markets, and a more restrictive high road, which offers a steeper ascent, enabling prosperity within a single generation, but requiring commensurately higher levels of financing, management, and risk.

3
2. DATA AND METHODS
This paper focuses on three widely marketed crops with contrasting institutional support systems (Table 1). Maize, the dominant food crop in Zambia, has received intensive government input and marketing support since the 1930s. In contrast, cotton, the country’s largest cash crop, relies primarily on privately financed contract farming schemes. Two large private ginning companies and half a dozen smaller competitors supply inputs on credit to smallholder cotton farmer as well as a guaranteed market for outputs. Horticulture production for domestic markets offers the largest high-value agricultural market in Zambia. However, unlike cotton and maize, no large-scale institutional support system exists. Instead, a battery of small- and medium-scale farmers finance their own inputs, organize transport, and negotiate markets with private traders and brokers. Despite strikingly different market institutions, all three commercial systems have grown rapidly over the past decades. This paper compares access and performance by successful commercial farmers operating under each of these three differing institutional systems, using both quantitative and qualitative methods. Quantitative analysis of commercial maize, cotton, and horticulture farming revolves around three nationally representative household surveys conducted in 2001, 2004, and 2008 by Zambia’s Central Statistical Office (CSO) in conjunction with the Ministry of Agriculture and Livestock and Michigan State University. This supplemental post-harvest survey provides representative coverage of Zambia’s 1.6 million small- and medium-scale farm households, defined as those farming less than 20 hectares of land. The survey covered the 1999/00, 2002/03 and 2006/07 crop years, collecting information on household cropping patterns, landholdings, assets, crop output, livestock production, and marketed sales. Of the 6,845 households interviewed in 2001, 5,342 were successfully re-interviewed in 2004 and 4,284 in 2008. As a result, these surveys provide a panel data set of about 4,300 households that enables assessment of variations over time in production and sales behavior. These data permit quantification of spatial differences in production and marketing, concentration of marketed sales across farms, key characteristics of commercial and non-commercial smallholder households, and movement over a seven-year time span in and out of commercial production. Table 1. Alternate Institutional Models for Agricultural Commercialization
Source: Authors.
Key institutional support
Input supply Output marketing
Maize publicFertilizer Support Programme (FSP)
Food Reserve Agency (FRA)
Cotton privateinput credits from
ginneriescontract sales to
ginneries
Horticulture noneindividual farmers self finance inputs
farmers, assembly traders and private
brokers manage marketing

4
To supplement and contextualize the themes emerging from this quantitative analysis, the study team conducted a set of qualitative field interviews with 90 commercial maize, cotton, and horticulture farmers operating in three different regions of Zambia. These qualitative interviews enabled the team to trace the full life histories of individual farmers. Moving well beyond the seven-year window provided by the panel survey, these life history interviews explored initial endowments, start-up conditions, and the evolution of production and commercial strategies over time, including multi-generational dimensions of smallholder trajectories from the parents of current farm household heads through to their children. The qualitative interviews began in Mumbwa District, 140 kilometers west of Lusaka, in a region where large numbers of smallholder farmers grow and market all three crops. There, our team interviewed 45 farmers, targeting equal numbers of cotton, maize, and horticulture farmers during the months of September and October 2011. Local agricultural extension officers helped the team to identify successful commercial farmers growing each of the three crops. Then, in February 2012, the team traveled to the horticultural production zones surrounding the capital city of Lusaka, in peri-urban Lusaka West and in nearby Chongwe District, 40 kilometers east of Lusaka, where an unusually high density of horticulture farmers grow produce for the Lusaka market (see Figure 3). Because our team members have been monitoring the Soweto wholesale vegetable market in Lusaka three times a week over the past six years, they were able to identify a cohort of 25 regular commercial smallholders supplying the Lusaka market and trace them back to their farms to conduct life history interviews. Following the Chongwe field interviews, during the second week of February 2012, the team travelled to Eastern Province of Zambia, home to the highest density of cotton farming in Zambia (see Figure 3), to conduct interviews with 20 successful commercial cotton farmers. Buyers for the two major cotton companies helped the team to identify successful cotton farmers in the zones around Lundazi, Chipata, and Katete. These qualitative field interviews aim to provide a more organic understanding of the life histories of commercial smallholders, the institutional and individual factors enabling some to scale up commercial operations successfully, and the influence this may have on household livelihood strategies and welfare trajectories.

5
3. CONTRASTING INSTITUTIONAL ENVIRONMENTS
Very different institutional structures have shaped the commercial growth of maize, cotton, and horticulture. Both maize and cotton marketing began under the direct control of government parastatals during the two and a half decades of heavy government involvement in agricultural markets in the early post-independence years from 1964 through about 1990. Large recurring deficits among the parastatals forced a subsequent period of liberalization during the structural adjustment decade of the 1990s (Hill and McPherson 2004). For maize markets, this liberalization proved transitory, with government resuming large-scale involvement in maize input and output markets beginning in the early 2000s. Cotton marketing, however, has remained in private sector hands since liberalization in the early 1990s. In contrast, horticulture crops have not experienced direct government marketing controls, probably because of their much higher value, compared to cotton and maize, their higher input cost, and perishability. As a result, private farmers, brokers, traders, and retailers have consistently organized Zambia’s commercial horticulture markets. The following overview examines these differing institutional landscapes in greater detail.
3.1. Maize Maize, the country’s principal food staple, has been highly politicized and heavily subsidized since the 1930s. Beginning in 1936, British colonial authorities established a Maize Control Board (MCB) to facilitate control of food prices and bulk procurement for the urban mining centers of Northern Rhodesia. The MCB became the government’s instrument for subsidizing commercial maize production and controlling urban markets through a system of internal and export quotas. At independence in 1964, the MCB became the National Agricultural Marketing Board (NAMBOARD), which guaranteed input supply and output markets for maize. From 1974/75, NAMBOARD procured maize at a fixed pan-territorial price (Wood et al. 1990). Through a growing network of farmer cooperatives, the government supplied subsidized fertilizer and seeds on credit as well as a guaranteed market outlet for maize. Subsidy schemes promoted animal traction, tractor plowing, and subsidized maize inputs throughout Zambia (Wood et al. 1990; Kokwe 1997). To support these efforts, the government established a Cooperative Credit Scheme (CCS) and an Agricultural Finance Company, which later became the Lima Bank, for purposes of financing the agricultural sector on subsidized terms. Most of their lending focused on maize (MACO 2004). Recurring heavy losses led to the de facto bankruptcy of Zambia’s many parastatals by the late 1980s. At NAMBOARD alone, losses accounted for 16% of government spending by the early 1990s (Howard and Mungoma 1996). Under heavy donor pressure, structural adjustment loans during the 1990s mandated liberalization of Zambia’s agricultural markets (Smale and Jayne 2010). With the abolition of NAMBOARD in 1990, maize became the province of private traders and cooperative societies. At the same time, the volumes of subsidized fertilizer distributed to government channels diminished steadily as donor support withdrew. Rising fertilizer prices, coupled with the removal of subsidized pan-territorial NAMBOARD prices, led to a sharp contraction in maize profitability at the farm level. As a result, maize production fell perceptibly as farmers, particularly in northern Zambia, reverted to production of alternate food crops such as cassava, groundnuts, and sweet potatoes, while commercial farmers in central and eastern Zambia increasingly turned to cotton (Zulu et al. 2000). The CCS and Lima Bank folded up their operations at the same time, leaving a vacuum in agricultural financing since the mid-1990s (MACO 2004).

6
However, government absence from Zambia’s maize markets proved short-lived. Beginning in the early 2000s, after a decade-long absence, the Zambian government resumed active trading in maize markets. In 2003, Zambia’s newly created Food Reserve Agency (FRA) began making large-scale maize purchases at a pan-territorial price. Increasingly large government purchases have coincided with growing domestic stocks and direct government control over export markets (Mwanaumo et al. 2005). In recent years, the FRA has paid roughly a 30% premium over the prevailing market price (Mason and Myers 2011). Despite the high cost to Zambia’s Treasury, the FRA’s presence in Zambia’s maize market has grown since its inception, culminating in the 2010/11 crop year with the purchase of 880,000 tons of maize, amounting to over 80% of smallholder maize sales (Mason 2011). The resumption of state activity in maize markets has not been solely confined to output markets. The Zambian government likewise resumed large-scale distribution of subsidized fertilizer to registered farmer cooperatives through the Fertilizer Support Programme and its successor, the Farmer Input Support Programme (FSP/FISP). Since the mid-2000s, FSP and FRA expenses have accounted for 50% to 70% of government spending on agriculture (Govereh, Jayne, and Chapoto 2008; Tembo et al. 2009). In total, subsidized fertilizer accounts for one third of all the fertilizer used by maize producers in Zambia. The resumption of fertilizer subsidies and large-scale government maize purchases at subsidized prices has helped to stimulate a resurgence in smallholder maize production since the mid-2000s (Figure 1). Figure 1. Trends in Maize and Cotton Production in Zambia (Tons)
Source: Cotton Board of Zambia and FAOSTAT.
0
500,000
1,000,000
1,500,000
2,000,000
2,500,000
3,000,000
3,500,000
0
50,000
100,000
150,000
200,000
250,000
1985 1990 1995 2000 2005 2010 2015
Cotton (left axis) Maize (right axis)

7
3.2. Cotton Like maize, Zambia’s cotton market remained under tight parastatal control during the early independence years. From its formation in 1977 until its demise in 1994, the Lint Company of Zambia (LINTCO) managed all facets of cotton production and marketing in Zambia. At planting time, LINTCO provided certified seed, pesticides, sprayers, and extension support to farmers. At harvest, LINTCO purchased all cotton at a fixed price. Although LINTCO did succeed in initiating commercial cotton production in Zambia, like NAMBOARD, it incurred heavy recurrent losses, which forced the government to disband the company and sell off all of the corporation’s assets. Two private ginning companies purchased the LINTCO assets. London-based Lonrho purchased the ginneries in central and southern Zambia, while South Africa’s Clark Cotton purchased LINTCO’s equipment and facilities in the east, leading to a duopoly in the early years of privatization. Unlike maize, cotton marketing has remained fully privatized since liberalization in 1994, despite several significant boom and bust periods. A recent review traces five distinct phases since the privatization of LINTCO in 1994.
“During the post-reform boom (1995-1998), the sector remained heavily concentrated and expanded rapidly on an entirely private and unregulated basis; the first crash (1999-2000) was marked by a severe credit default crisis, brought on in part by the entry of new, small ginners and cotton buyers committed more to trading cotton than to promoting its production. The credit default crisis was resolved during the second boom, (2000-2005) entirely through private innovation by the two leading companies to reduce credit default; during this phase, government became increasingly involved in the sector, but their activities are best characterized as adjuncts to the fundamental private sector dynamic, and achieved mixed results. Additionally, larger and better-financed ginners entered; by the end of this period, the sector was becoming recognizably less concentrated than at any time since reform. Several factors brought on the second crash (2006-2007): a sharp appreciation of the kwacha, unhelpful public statements by government in the midst of mounting conflict between farmers and ginners, and the weight of additional firms in the sector, all of which lead to another serious credit default crisis and plummeting production. By the end of this period, still more companies had entered the sector, bringing the total to at least 11. Production recovered somewhat in 2008 but remained essentially flat in 2009” (Tschirley and Kabwe 2010).
Since 2009, a sixth phase has emerged as rising world cotton prices have resulted in strong incentives to grow cotton. As a result, Zambia’s cotton production has resumed its upward trajectory (Figure 1). Between 2008 and 2012, the number of farmers growing cotton has roughly doubled, from about 100,000 to over 200,000. In 2012, Zambia’s cotton sector retains its two market leaders, Dunavant (formerly Lonrho) and Cargill (formerly Clark) as well as half dozen smaller players. The industry leaders supply input packs on credit to their farmers, as do some of the smaller competitors. The larger companies also provide regular extension services and training at critical periods during the cropping season. In return, the farmers contract to sell all of their cotton production to their parent ginnery. The ginneries deduct input costs and interest charges at harvest time, remitting the net profit in cash or bank transfer to their farmers. Because of this outgrower relationship, cotton farmers require no cash to finance input purchases. However, cotton production requires careful management, including timely planting, prompt weeding, regular insect monitoring, repeated spraying throughout the season, and multiple rounds of hand picking to ensure fiber length and quality.

8
Cotton companies monitor performance of their contract farmers and quickly weed out nonperformers. For this reason, commercial cotton production – unlike maize and horticulture – remains accessible to cash-poor but disciplined smallholder farmers so long as they have sufficient family labor to manage production.
3.3. Horticulture Horticulture markets remain the province of independent private traders and farmers. Currently, a large network of farmers, private input dealers, wholesale traders, and private retailers manage Zambia’s horticulture trade. They concentrate primarily in central Zambia and in the Copperbelt, in close proximity to the urban markets along the line of rail. Three main products – tomato, rape, and cabbage – account for about 75% of smallholder sales of horticulture products. The largest commercial smallholders concentrate on tomatoes, the highest valued horticulture crop, but also one of the most difficult to grow. Rape (kale) and cabbage serve as common entry-level commercial horticulture crops. Horticulture farmers generally sell their produce through urban wholesale markets. In most wholesale markets, a network of private brokers control access and facilitate farmer offloading in return for a commission. City councils and marketeer cooperatives manage the urban wholesale market infrastructure, although disputes over market fees and access have erupted periodically in recent years. Open-air markets and street vendors dominate horticulture retail markets in Zambia and account for over 90% of all fresh produce marketed. Currently, supermarkets handle only about 5% of horticulture retailing. Although supermarkets retain large urban retail shares for many dry goods, horticulture products remain largely the province of the traditional marketing system (Hichaambwa and Tschirley 2006; Tschirley and Hichaambwa 2010). Unlike cotton, individual horticulture farmers must finance their input purchases and coordinate marketing. Heavy disease pressure during the rainy season necessitates the use of fungicides and insecticides or investment in dry season irrigation equipment. For entry-level horticulture farmers, technical support remains largely the domain of informal farmer-to-farmer networks. However, high-volume producers often consult with input dealers and with the handful of large private agribusiness firms that have emerged to sell hybrid seedlings to large- and medium-scale horticulture producers. Price volatility coupled with product perishability make horticulture marketing risky, while high values make it lucrative.

9
4. A PROFILE OF COMMERCIAL SMALLHOLDERS
4.1. Farm Production Roughly, 70% of the labor force in Zambia works in agriculture, where there are approximately 1.6 million small-scale farms and about 1,000 large farms. This farming population clusters in two principal areas: in central Zambia, along line of rail running from Victoria Falls in the south to the Copperbelt in the north, and in the eastern part of Zambia bordering Malawi and Mozambique (Figure 2). Nationally, maize is Zambia’s most widely grown crop and primary food staple, accounting for about half of national calorie consumption (Zulu, Jayne, and Beaver 2006)). In 2007, three-fourths of Zambian farmers grew maize, mostly for their own consumption. About one-third of maize growers – or 25% of smallholder farm households – also sold maize (Table 2). Roughly, 40% of Zambian farm households grow horticulture products such as tomato, rape, and cabbage. Of these, about half produce surpluses for sale in domestic horticulture markets. Production of cotton, the country’s largest export crop, is more concentrated. In 2007, at a time when falling cotton prices had eroded away price incentives, only about 10% of smallholder farmers produced cotton, all of it for sale to local ginneries who then export lint to international markets. Since then, with the strong recovery in world cotton prices in 2011, the major ginning companies indicate that the number of cotton growers in Zambia has roughly doubled.
Figure 2. Population Distribution in Zambia
Source: Landscan gridded population database of 2008.

10
Table 2. Concentration of Marketed Sales, 2007
Source: Central Statistical Office, Supplemental Farm Household Survey 2008.
Efforts to use agriculture as a vehicle for widespread poverty reduction have proven spotty at best in Zambia. Rural poverty rates have remained stagnant for over a decade, hovering around 78%. Meanwhile, urban poverty rates have declined over the past decade. Currently, as a result, rural poverty rates exceed those in urban areas by a factor of three (Table 3).
4.2. Commercialization As these persistently high levels of rural poverty suggest, successful agricultural commercialization remains highly concentrated among a small segment of rural households. For both maize and horticulture, less than 5% of growing households account for half of all marketed sales (Table 2). Cotton production and sales, in contrast, are distributed more evenly across a much larger proportion of producers. About 20% of cotton growers account for the top half of sales (Table 2). Because cotton farmers receive inputs on credit from the ginneries, even households without large financial resources can aspire to become commercial cotton producers. As a cotton farmer from Mumbwa told us, “I am able to grow 10 hectares of cotton because I don’t need to have money for inputs as the outgrower company provides all I need on credit, including extension advice.” High-volume commercial smallholders – those accounting for the top 50% of sales – share several common characteristics. The top 5% of maize and horticulture growers and the top 20% of cotton growers that account for half of all sales are mostly male-headed farms with a larger asset base and higher per capita incomes than average smallholder farmers (Table 4).
Farm category Maize Cotton HorticultureAll farms
Growers 76 9 38Sellers 26 9 18
Sales distribution among growing householdsTop half of sales 3 20 1Bottom half of sales 36 80 46Growers with no sales 62 0 53Total growers 100 100 100
Percent of Small and Medium Farms
Table 3. Poverty Trends in Zambia (Percent Population below the Poverty Line)
Source: Central Statistical Office (2011).
1991 1993 1996 1998 2004 2006 2010Rural 88 92 82 83 78 80 78Urban 49 45 46 56 53 34 28All Zambia 70 74 69 73 68 64 61

11
Table 4. Characteristics of Commercial Smallholder Households in Zambia, 2007
Source: Central Statistical Office, Supplemental Farm Household Survey 2008.
Female-Farm assets headed
kg*per capita
kg*per hh
Household size
owned (ha/hh)
cultivated (ha/capita)
Cattle per hh
per capita(USD) Total Crop Livestock Nonfarm households
Head of household
Household maximum
MaizeTop half of sales 1,664 11,091 7.9 13.5 0.9 12.1 301 841 498 81 236 10% 8.1 10.0Bottom half of sales 167 856 6.1 4.1 0.4 2.2 52 250 121 15 100 18% 6.2 8.1Growers with no sales 0 0 5.8 3.2 0.3 1.7 52 171 78 19 62 26% 5.0 7.2Total maize growers 105 609 6.0 3.7 0.3 2.1 59 218 105 19 80 23% 5.5 7.6
CottonTop half of sales 319 1,918 7.5 6.7 0.6 5.9 77 325 219 40 58 5% 5.5 8.0Bottom half of sales 95 486 6.2 3.5 0.4 2.5 24 136 90 14 28 17% 4.8 6.7Total cotton growers 141 778 6.5 4.1 0.5 3.2 35 174 116 19 34 14% 4.9 7.0
HorticultureTop half of sales 942 7,564 8.3 10.3 0.6 4.7 210 1,389 1,193 41 149 12% 6.2 7.9Bottom half of sales 31 167 6.6 4.0 0.3 2.6 41 221 113 20 76 16% 6.1 8.1Growers with no sales 0 0 5.7 2.9 0.3 1.3 31 187 93 7 73 22% 5.3 7.1Total horticulture growers 24 156 6.2 3.4 0.3 2.0 37 215 114 14 75 19% 5.7 7.6
* horticulture sales in US dollars
Farm sizeSales Assets Income per capita (US dollars) Education

12
These highly commercial smallholders hold larger stocks of land and agricultural equipment than average small farmers do. They have more family labor and higher levels of education. Despite larger families, they earn total per capita incomes two to four times those of average farm families. Cotton farmers are the poorest group among the high-volume commercial smallholders. Despite equivalent crop income, they earn less than half as much nonfarm income as maize and horticulture farmers. This relative shortage of nonfarm earnings may explain their attraction to cotton farming, which requires no self-financing of purchased inputs. Maize and horticulture farmers, in contrast, require large sources of cash income to finance input purchases.
4.3. Farm Productivity Increased productivity goes hand in hand with agricultural commercialization. The most commercially oriented maize farmers attain maize yields of three tons per hectare, compared to roughly two tons for the bottom half of sellers and only one ton for the non-sellers (Table 4). Similarly, the top selling cotton farmers achieve yields roughly double those of the bottom half. Among horticulture producers, the productivity differential is even more startling, at roughly 10:1. Unlike low-value crops such as cotton and maize, for which farm-gate prices are roughly equivalent across farms, the most productive horticulture farmers typically receive higher prices due to higher quality produce. Moreover, the best horticulture farmers tilt their product mix towards high value crops such as tomatoes. As a result, average horticulture farmers produce per hectare crop values two to three times higher than those achieved by cotton and maize farmers. Among the top tier commercial sellers, farmers specializing in horticulture earn per hectare revenues over ten times higher than top tier cotton and maize growers (Table 5). Table 5. Productivity Differences Across Seller Groups in Zambia, 2007
Source: Central Statistical Office, Supplemental Farm Household Survey 2008.n. a. = not applicable
Seller category Areaplanted
(ha/crop)yield
(kg/ha)value
(USD/ha)fertilizer (kg/ha)
hybrid seed
MaizeTop half of sales 4.8 3,393 571 247 97%Bottom half of sales 1.1 2,074 413 175 56%Growers with no sales 0.8 1,161 197 64 31%Total maize growers 1.0 1,547 285 109 41%
CottonTop half of sales 1.5 1,581 481 2 n.a.Bottom half of sales 0.8 822 179 0 n.a.Total cotton growers 0.9 975 240 0 n.a.
HorticultureTop half of sales 0.6 n.a. 6,974 0 n.a.Bottom half of sales 0.2 n.a. 683 0 n.a.Growers with no sales 0.0 n.a. 79 0 n.a.Total horticulture growers 0.1 n.a. 731 0 n.a.
Output Productivity Input Use

13
Land productivity differentials of this magnitude stem from a combination of higher input use, higher-value crop mixes, and better management practices. Commercial maize growers increase yields by using hybrid seeds and mineral fertilizer. Because soil nitrogen often limits maize productivity, maize farmers benefit most from the application of mineral fertilizers. For that reason, the commercial maize farmers apply four times as much mineral fertilizer as average farmers (Table 5). About 30% of their fertilizer comes from subsidized FSP/FISP sources (Table 6). In contrast, cotton farmers use standard input packs provided on loan by the cotton ginneries. Therefore, yield differentials among cotton farms stem primarily from superior farm management practices. Early land preparation, early planting, careful weeding and pest control, long-term build-up of soil organic material, and the adoption of minimum tillage systems that enable water harvesting during the sporadic rainfall common in the semi-arid cotton belt all emerge as critical variables in raising per hectare cotton yields (Haggblade and Tembo 2003). Horticulture farmers apply all three tools for raising land productivity. They select a high-value crop mix. They apply expensive inputs, including improved seeds, hybrid seedlings, pesticides, fungicides, fertilizer, and irrigation water. In comparison with cotton input costs of $30 per hectare and maize input costs of $300 per hectare, horticulture farmers apply inputs costing $400 to $4,400 per hectare, all financed from personal income sources (Table 7). Successful horticulture farming likewise requires exceptional management, including rigorously precise agronomic practices, careful pest management and disease control, assiduous labor management to ensure product quality, and strong financial management. For those who succeed, the result is higher returns per hectare than those earned in commercial cotton and maize production. Table 6. Fertilizer Sources among Maize-growing Households in Zambia, 2008
Source: Central Statistical Office, Supplemental Farm Household Survey 2008.
Fertilizer acquisition sources Non-(tons) (percent) Top half Bottom half sellers
Cash purchasesprivate traders 77,300 57% 706 135 89cooperatives 6,194 5% 6 18 6
Government subdized programsFertilizer Support Programme (FSP) 43,600 32% 292 95 46Programme Against Malnutrition (PAM) 865 1% 1 2 1
Credit purchasesoutgrower schemes 5,787 4% 14 3 21trade credit 270 0% 0 1 0
Barter and gifts 1,152 1% 3 2 2Total 135,169 100% 1,021 256 166
National Fertilizer Fertilizer Use Among Maize-GrowingDistribution, 2007/08 Households (kg/hh)
Maize sellers

14
Table 7. Crop Values and Input Costs in 2011 Prices (US Dollars per Hectare)
Source: Maize and cotton yields from Table 5, input costs from Haggblade, Kabwe, and Plerhoples (2011), horticulture budgets from field interviews.
4.4. Geographic Concentration Commercial cotton and maize production spreads out across the semi-arid central and southern parts of Zambia. While maize is grown throughout Zambia, cotton is most heavily concentrated in eastern Zambia (Figure 3). Figure 3. Geographic Distribution of Maize, Cotton and Horticulture Sales
Source: Post Harvest Survey of 2008.
Farmer categoriesInput costs
($/ha)Yield
(kg/ha)Output value
($/ha)Maize
Top 50% of sales 261 3,393 625Bottom 50% of sales 202 2,074 382
CottonTop 50% of sales 28 1,581 1,012Bottom 50% of sales 27 822 526
HorticultureRape (kale) 400 n.a. 1,600Tomato, from seeds 1,600 n.a. 7,000Tomato, hybrid seedlings 4,400 n.a. 14,000

15
In contrast, commercial horticulture production tends to concentrate in close proximity to major urban centers and along major transport routes leading to them. Weekly monitoring of Lusaka’s largest wholesale market confirms that highly perishable products, such as tomatoes and rape, come primarily from nearby. Distance to market averages about 44 kilometers for rape and 69 kilometers for tomatoes (Tschirley and Hichaambwa 2010). Less perishable products, such as onions, come from much further afield (Figure 4). Figure 4. Geographic Distribution of Vegetable Sales to the Lusaka Market, 2008-2011
Source: FSRP Soweto Market Monitoring.

16
In fact, imports account for over half of all onions supplied to the Lusaka market (Tschirley and Hichaambwa 2010). Thus, location is a key variable governing farmer access to high-value horticulture markets.
4.5. Factors Affecting Successful Commercialization The quantitative data from our national panel survey allow us to formally explore factors associated with successful commercialization. Using these data, we estimate the probability of becoming a top-tier commercial producer as a function of several categories of exogenous variables. We have estimated these relationships use two definitions of top-tier commercial smallholders: those accounting for the top 50% of sales and the top quintile of producers. Given similar outcomes, we report here only the results for the commercial farmers accounting for the top 50% of sales of each commodity. As explanatory variables, we have included demographic characteristics of the household head, social capital, asset endowments, location, and management skills. By pooling panel data from the three survey years, we are able to estimate Probit regressions including lagged asset variables to test propositions about the importance of asset endowments for commercial production. The results of these regressions, reported in Table 8, suggest several general conclusions.
4.5.1. Farm Assets
The characteristics of top-tier commercial farmers of low-value crops, such as cotton and maize, differ significantly from those who succeed in horticulture. The most successful cotton and maize farmers are more likely to be male-headed and well educated. Commercial success with these two low-value crops likewise depends heavily on endowments and accumulation of productive assets such as land and the cattle and farm equipment required to manage large holdings. Among the top commercial horticulture farmers, land holdings are not statistically significant. Indeed, many we interviewed started small. Because horticulture production generates higher per-hectare earnings than cotton or maize, horticulture producers can become affluent on relatively small land holdings. 4.5.2. Location
Horticulture producers require access to water and markets. Not surprisingly, successful horticulture growers are most likely to be found in districts nearby the major cities of Lusaka, Kitwe, and Chipata. For maize producers, the negative and statistically significant coefficient on distance to an FRA depot suggests that proximity to an FRA buying station increases the likelihood of commercial success. The migration variable, measured by years living in the current rural locality, proves significantly negative only for horticulture production, suggesting that horticulture producers are more likely to relocate to find suitable sites endowed with water and market access. Indeed, our qualitative interviews reinforce this notion of mobility among successful horticulture producers.

17
Table 8. Probit Estimates of the Determinants of Top Commercial Maize, Cotton, and Horticulture Farmers
Source: Probit regressions using national farm household surveys from 2001, 2004, and 2008. Standard errors are listed in parentheses. Significance levels: *** p<0. 01, ** p<0. 05, * p<0. 1 Small livestock: sum of pigs, goats, and sheep. Farm equipment: households owning a harrow, cultivator, disk plow, scotch cart, or spray pump.
Explanatory variablesHorticulture Cotton Maize
Household demographic characteristicsMale headed household -0.0017 0.0896** 0.0134***
(0.0025) (0.0379) (0.0034)
Age of household head (years) -0.0001** -0.0009 0.0001(0.0001) (0.0011) (0.0001)
Education of household head (years) 0.0004* 0.0094** 0.0017***(0.0002) (0.0042) (0.0004)
Social capital and migrationHousehold social ties to headman -0.0013 -0.0332 -0.0053*
(0.0017) (0.0278) (0.0032)
Years living in settlement -0.0002** -0.0006 0.0001(0.0001) (0.0012) (0.0001)
Assets, lagged (prior survey year)Landholding size (ha) 0.0001 0.0240*** 0.0037***
(0.0001) (0.0048) (0.0004)
Cattle owned (number) 0 0.0045*** 0.0001**0.0000 (0.0015) (0.0001)
Small livestock owned (number) 0 0.0013 0.0002(0.0001) (0.0019) (0.0002)
Own water pump (yes=1) 0.0388 -0.1676*** 0.0063(0.0236) (0.0386) (0.0111)
Farm equipment owned (yes=1) 0.0062 0.1097*** 0.0271***(0.0043) (0.0391) (0.0074)
Own a vehicle (yes=1) 0.0115 0.2859* 0.0544**(0.0101) (0.1509) (0.0212)
LocationProximity to major cities (=1 for districts 0.0060* 0.0236 0.0004 contiguous to Lusaka, Kitwe or Chipata) (0.0033) (0.0357) (0.0039)
Distance to vehicular transport (km) -0.0001 -0.0032* -0.0001(0.0001) (0.0018) (0.0002)
Distance to FRA depot (km) -0.0002**(0.0001)
Management skillsPlot management (production function 0.0941*** 0.0096*** residuals) (0.0134) (0.0009)
Years growing cotton 0.0257***(0.0056)
Number of observations 4,025 1,032 7,036
Probit Regressions for Sellers Accounting for the Top 50% of Sales, Marginal Effects

18
4.5.3. Management
Our qualitative interviews repeatedly highlighted the importance of management skills. To test this proposition formally, we have used plot-level information on inputs and outputs for cotton and maize to estimate production functions with purchased inputs, land preparation methods, weed management, and rainfall as explanatory variables. The residuals from these production functions have been used in these Probits as a proxy for management skills of individual farmers. In both maize and cotton production, these residuals are strongly positive. With cotton farming, number of years as a cotton farmer reinforces the notion that management skills affect commercial success. Unfortunately, these national survey data do not provide the plot-level details required to formally assess the importance of management skills on successful commercial horticulture production. However, our qualitative interviews leave little room for doubt about their importance. Overall, these results suggest clear differences between low-value cotton and maize commercialization and high-value horticulture. In particular, they highlight the importance of male labor, large land holdings, cattle, and farm assets to successful maize and cotton commercialization. However, the short seven-year window available from the panel survey does not reveal how successful households managed to accumulate these assets in the first place. For that, we must turn to the qualitative life histories for illumination.

19
5. LIFE HISTORIES OF SUCCESSFUL COMMERCIAL SMALLHOLDERS
The following discussion draws primarily on our qualitative life history interviews with successful maize, cotton, and horticulture farmers. It summarizes their main observations about how differing endowments, decisions, and institutional frameworks affected their livelihood trajectories and enabled them to become successful commercial smallholders.
5.1. Alternate Trajectories to High-productivity, Commercial Agriculture Our interviews suggest that three routes are available to rural households seeking an agricultural pathway out of poverty. Conceptualize a mountain, whose altitude represents productivity per unit of family labor. At the bottom of the mountain, rural households mired in poverty seek feasible pathways upwards. In general, they follow one of three broad trajectories. 5.1.1. No Road
Some rural households remain stuck at the foot of the mountain, finding no traction in farming and no access to pathways leading upwards. Through good fortune or good weather, they may experience periodic upswings in farm productivity and welfare. However, if they are unable to invest surpluses in assets that will sustain them during setbacks (drought years, pest infestations, and diseases), they rapidly revert to their prior low-productivity status in subsequent years (Figure 5b-Setback). The rich literature on poverty traps identifies a litany of geographic, individual, and institutional factors that conspire to prevent sustained upward trajectories for some households (Barrett and McPeak 2006; Carter and Barrett 2006). This paper does not delve into the predicaments confronting this group. Rather, it focuses on farm households that manage to gain a foothold onto one of two feasible pathways up the mountain.
Figure 5. Alternative Consequences of Agricultural Shocks
Source: Authors.
Time
Revenue
a) Recovery
b) Setback

20
To chart an agricultural pathway out of poverty, successful rural households seek to raise the productivity of family labor. Higher labor productivity is necessary for raising per capita incomes, enabling households to free children from farm labor obligations, deploy oxen or hired labor in their stead, and finance school fees, livestock and financial savings that enable households to survive downturns in agricultural production cycles and markets. Farm households can increase family labor productivity through intensification (either higher input use, better management or a move to high-value commodities) as well as through mechanization and expansion of cultivated area. The most successful commercial smallholders seek to raise labor productivity in both ways, by increasing the value of output per hectare as well as by expanding cultivated area (Table 5). 5.1.2. Low Road
The low road traces a slow, gradual pathway up the mountain, often requiring two generations. Exemplified by cotton production, the low road involves low value farm output and low cash input costs. Given widespread input lending from ginning companies, cotton provides an entry point for large numbers of poor farmers with little nonfarm income. The ginning companies likewise provide extension support as well as highly localized pick-up points for collecting the cotton crop (Table 9). However, cotton production requires careful management, including timely planting, prompt weeding, regular insect monitoring, repeated spraying throughout the season, and multiple rounds of hand picking to ensure fiber length and quality. Given the stringent management demands for cotton production, only the most disciplined smallholders succeed in raising cotton productivity and production sufficiently over time to accumulate savings. Those who prepare their land and plant early, carefully manage weeds and pests, and have sufficient harvesting labor succeed in raising productivity and incomes. Yet agronomic management skills alone are not sufficient for commercial success with low-value field crops. Financial management is equally important. Because annual crops such as cotton (and maize) result in a single lump-sum cash payment, successful cotton production requires careful budgeting, cash management, and financial savings. Successful cotton farmers must be good financial managers as well as good farmers. Underlining the importance of both skill sets, one cotton farmer told us, “I plan for my farming business and make sure to plant early.” The best managers grow their cotton business slowly over time. Although low value crops such as cotton cap farm earnings at modest levels, successful farmers use cotton revenues to finance entry into higher-input agriculture and to educate their children, thus opening new pathways to high-wage nonfarm employment for the next generation. Most of the successful cotton farmers we interviewed insist that their children not work in the fields, but that they go to school instead. As one farmer told us, “Cotton is the only crop that allows me to educate my children.”
Table 9. Cotton Sales Outlets
Source: Central Statistical Office, Supplemental Farm Household Survey 2008.
DistanceCotton outgrower other total (km)
Top half of sales 99% 1% 100% 1.9Bottom half of sales 97% 3% 100% 1.4Total cotton growers 98% 2% 100% 1.5
Sales Outlet

21
Currently, cotton farming offers the largest on-ramp to the low road up the mountain. In the 2011/12 season, over 200,000 Zambian farmers grew cotton. Given this scale, it currently serves as the largest filter for upward mobility in the agricultural system, widely accessible to even the very poor but highly demanding and unforgiving of mismanagement or indiscipline. Cotton provides poor but disciplined farmers a chance to audition and try out commercial farming. Top-tier cotton farmers farm only one-third as much land as top-tier maize farmers (Table 5). As a result, over 20% of the top cotton farmers are able to manage their cotton fields with family labor and hand hoes (Table 10). Because of the long time it takes poor households to scale up production, the low road typically requires two generations. Parents are able to attain modest levels of welfare, far enough above the poverty line that they are able to free their child from farm work, finance schooling, and acquire assets that will cushion them against setbacks. By dint of disciplined management and investments in education, they position their children to take the next major step up the mountain. Commercial maize production, in contrast, does not generally provide a feasible on-ramp for the poor. Although maize, like cotton, is a low-value annual crop, unlike cotton, commercial maize production imposes high input costs for fertilizer and seeds. Even with a 50% government subsidy on FSP fertilizer, maize input packages require up-front cash expenses of $150 per hectare, compared to zero for cotton inputs widely available on loan. Moreover, because of its sensitivity to moisture stress, rain fed maize production involves higher production risk than cotton during drought years. For a variety of reasons, the majority of fertilizer input subsidies and FRA price subsidies are captured by the top 5% of Zambian maize farmers (Jayne et al. 2011; Mason et al. 2011). For the majority of rural Zambians, who farm less than two hectares of land, maize production is an unlikely candidate for lifting them from semi-subsistence to commercial levels of production. Although maize does not offer an on-ramp for the very poor, it does offer a an optional low road for households wealthy enough to finance the high input costs and influential enough to get paid on time by the FRA or with sufficient resources to await long delays in payment. Mid-career farmers with significant nonfarm savings or successful cotton and horticulture farmers sometimes shift into commercial maize production, particularly when they believe they can capture large government subsidies. Table 10. Tillage Systems among Maize and Cotton-growing Households (Percent of Plots)
Source: Central Statistical Office, Supplemental Farm Household Survey 2008.
Seller category Totalhh labor hired labor own cattle hired own hired plots
MaizeTop half of sales 6 10 67 11 4 2 100Bottom half of sales 43 13 23 19 0 2 100Growers with no sales 52 5 16 25 0 2 100Total maize growers 47 8 20 22 1 2 100
CottonTop half of sales 21 3 58 17 0 1 100Bottom half of sales 45 4 22 29 0 1 100Total cotton growers 40 4 30 26 0 1 100
Hand hoe Animal traction Tractor plowing

22
5.1.3. High Road
The high road offers a more rapid, but steeper and more difficult ascent. Farmers with the requisite management skills can become truly prosperous within one generation. Exemplified by horticulture production, the high road involves high value farm commodities with commensurately high cash input requirements. Access to the high road depends first on geographic location. Farmers within a 50 to 100 kilometer radius of the major urban markets and with year-round access to water are potentially able to enter horticulture markets. Although inputs costs are very high, horticulture production is scalable. Many of the most prosperous farmers we interviewed started with very small plots, 20 meters by 20 meters, which they watered with buckets. They used savings, often earned through informal nonfarm work, to finance the first batch of inputs for these very small initial plots. Successful farmers accumulated savings from their horticulture production and increased their scale over time. The median horticulture farmers we interviewed in Chongwe District started with 0.25 hectares of total land under cultivation and advanced over time to 4 hectares. Most horticulture farmers start by growing rape (kale) because of its low input costs and short time to first harvest. Rape farmers are able to generate revenue within six weeks after planting. Well managed, the crop can be harvested every two weeks thereafter for several months. Those who succeed with rape move into higher value horticulture products, especially tomatoes. As a result, top-tier horticulture farmers earn three-fourths of their revenue from tomatoes (Table 11). One horticulture farmer explained his transition this way. “Rape helped me start my business. Now I have graduated into tomato and I diversify to minimize danger from price collapses. But the September planted tomato is my diamond mine.” Only a small subset of farmers possesses the skills to navigate successfully to the top tier of tomato producers. Disease problems, perishability, and wide price fluctuations make tomato a highly demanding and risky crop. As one farmer lamented in describing his failed attempt to transition from rape production into tomatoes, “Tomato is a crop that can make you very rich . . . or very poor!” Successful horticulture farmers invest early in irrigation pumps, pipes, and if electricity permits, boreholes. Some manage sophisticated drip irrigation systems while others use flood irrigation. Small, intermittent horticulture producers face enormous day-to-day price volatility. One farmer ruefully summarized the price risk facing low-volume producers by relating the following experience: “My broker called me on Monday to tell me that pumpkin leaves were selling at a record high price on the Soweto market. So on Tuesday I picked 20 bags and delivered them to the market very early on Wednesday morning. By then, the price had collapsed and I lost everything.” Table 11. Composition of Horticulture Products, by Seller Group
Source: Central Statistical Office, Supplemental Farm Household Survey 2008.
Category of horticulture farmers tomato rape cabbage onion other veg fruits totalTop half of sales 74% 9% 3% 1% 5% 8% 100%Bottom half of sales 34% 29% 12% 4% 11% 10% 100%Total horticulture sellers 54% 19% 7% 3% 8% 9% 100%
Value of Sales, by Product

23
Ironically, price risk falls dramatically as horticulture farmers scale up production. The high-volume horticulture producers grow tomatoes year round and market multiple times every week. As a result, they typically do not worry about price variation. They gain on the days when prices spike and lose on days when the prices dip. Highly disciplined cash management and cash accumulation proves essential to successful horticulture farming. Horticulture farmers require $400 to $4,400 per hectare to finance inputs, hire labor, and transport their produce to markets. On top of these input requirements, they require significant financial savings to cushion their business from the inevitable shocks arising from erratic rainfall, disease, and price swings. They risk losing their entire investment in one season and being driven from the horticulture business if adequate savings are not maintained. The horticulture farmers we interviewed repeatedly emphasized the need to maintain bank savings or an explicit cash cushion. One highly successful horticulture farmer maintains that he never lets his bank balance fall below 200 million Kwacha ($40,000). Another put it this way, “If I make 5 million Kwacha ($1,000), I must put 1 million ($200) in the bank.” The financial cushion enables them to recover from setbacks (Figure 5a-Recovery). For them, financial institutions, particularly for savings, provide critical support for ensuring generally upward trajectories as commercial smallholders. After 15-20 years, the best horticulture farmers attain high income for themselves and their family. They accumulate productive assets as well as savings that enable them to withstand periodic setbacks. And they ensure their children’s future through heavy investment in education. One proud horticulture farmer we interviewed told us that his horticulture income had enabled him to marry ten wives. In addition, he insisted that he has sent all of his 27 children to school.
5.2. Initial Endowments The smallholders we interviewed began commercial farming at a range of different ages (Figure 6). To simplify a complex set of alternatives, it is easiest to consider two general cohorts of commercial smallholders: young adults, who begin farming right away as their first major occupation, and middle-age entrants into farming, who typically transit first via nonfarm occupations. Roughly, two-thirds of the successful commercial smallholders we interviewed began commercial farming as young farmers, under the age of 25. Nearly 20% began as teenagers while about half began farming on their own in their early 20s, usually after short stints as wage laborers or in low-skill nonfarm employment where they earned their start-up capital. The remaining one-third began commercial farming after the age of 26, following ten or more years in nonfarm occupations. Half of this group, or 15% of the commercial smallholders we interviewed, began farming in middle age, after the age of 30. In most cases, these late entrants began commercial farming as a second career after long-term employment as salaried workers in the mines, in parastatals, or in private industry. Some returned to their home villages to begin their commercial farming careers. However, many moved to new locations, usually in pursuit of available land.

24
Figure 6. Age of Farm Start-up among Successful Commercial Smallholders (Percent of Farmers, by Age)
Source: Life history interviews with 90 commercial smallholders. Successfully navigating Zambia’s land allocation and administration systems is an important shared attribute of successful smallholder farmers, both for acquiring initial land to begin farming and acquiring additional land for expansion. Broadly speaking, land in Zambia is regulated through two parallel systems of administration. On the one hand, there is state land, on which leasehold titles of various durations are permitted. State land, as the name suggests, is administered by the central government through the Ministry of Lands. On the other hand, there is customary land, on which farmers can only obtain usufruct rights. Customary land is administered locally by customary authorities, such as chiefs and headmen. In Zambia, the majority of smallholder land is under customary control. As a result, successfully navigating the customary land system is a critical component of most smallholder commercialization pathways. Both the young farmers and the mid-career start-ups relied overwhelmingly on communal land allocations from customary authorities. Of the 90 farmers we interviewed, all began farming on customary land. The young farmers typically began in their home village, on family land. As their commercial farming business expanded, some of the most successful moved to neighboring constituencies to obtain expanded land allocations. One of the highly successful horticulture farmers we interviewed began farming on a small corner of his father’s farm before moving to a neighboring headman for additional land. Then, after two decades building up a highly profitable horticulture business, he purchased a 400-hectare leasehold farm on state land in Chibombo, 150 kilometers from his home. Generally, the top-tier commercial smallholders considered themselves businessmen rather than farmers. In the same way that a businessman moves when the job market requires, these commercial farmers demonstrate a willingness to relocate if necessary to obtain adequate land holdings. While our respondents acquired their initial land endowments in broadly similar ways, sources of initial start-up financing for purchased inputs varied. The young farmers relied on family loans, casual nonfarm employment or self-employment, and trading to finance the purchase of seed, fertilizer, and other inputs for very small plots during their first farming season. The mid-career farmers, in contrast, had accumulated savings from their non-farm
0
0.02
0.04
0.06
0.08
0.1
0.12
0.14
0.16
15 20 25 30 35 40 45 50

25
careers which they invested in inputs and farming assets. Some of the oldest farmers, who began farming in the 1980s, received loans from the Lima Bank or other government-sponsored agricultural lending schemes. One retired parastatal employee reported launching his mid-career commercial farming career with a commercial bank loan. For households entering farming from the 1990s onwards, formal bank lending has been largely unavailable.
5.3. Investment Strategies of Successful Commercial Smallholders At any given time, most commercial smallholders concentrate primarily on a single commercial crop. Among the top-tier sellers, less than 10% sell multiple crops in high volumes (Figure 7). Although many grow maize in addition to their cash crop, maize often serves primarily as currency to pay laborers and to feed their families. Nonetheless, like good businessmen and women, successful smallholders shift in and out of profitable lines as market conditions change. Figure 7. Percent of Smallholder Farmers Selling Maize, Cotton, and Horticulture, 2007 a. Percentages of All Smallholder Households
b. Percentage of the 70,000 Smallholder Households Accounting for the Top 50% of Maize, Cotton, and Horticulture Sales
Source: Central Statistical Office, Supplemental Farm Household Survey 2008.
0.5%
Maize sellers
Cotton sellers
Horticulture sellers
5%
19%2%
5%
10%
2%
0%
Top maize sellers
Top cotton sellers
Top horticulture sellers
41%
46%4%
2%
7%
0.5%

26
Table 12. Shifting Strategies of Commercial Smallholders
Source: Life history interviews with 90 commercial smallholders.
Farmers who succeed in horticulture typically retain their focus on fresh produce, given the profitability of horticulture production. Of the successful commercial horticulture farmers we interviewed, roughly 90% who began in horticulture remain selling primarily horticulture products today (Table 12). A few have used their horticulture earnings to finance large-scale commercial maize production in 2011 in anticipation of large price subsidies from the FRA during an election year. Notably, most of them indicated that they would not produce maize for sale were it not for the government subsidies. In contrast, farmers growing low-value crops such as cotton and maize often shift from one commercial crop to another in response to changing price incentives. Ten to twenty percent of the farmers we interviewed have parlayed their maize and cotton earnings into horticulture production (Table 12). Given that the horticulture option is only available to a restricted geographic subset of farmers, the majority of farmers starting with cotton or maize have shifted back and forth over time between these two low-value crops, driven by wide swings in relative prices. Over the past decade alone, the price of cotton relative to the price of maize has ranged between 1 and 3.5 (Figure 8). Figure 8. Price of Cotton Relative to the Price of Maize (Pc/Pm)
Source: Cotton Board of Zambia and Agricultural Marketing Information Centre.
Start-upcrop maize cotton horticulture other total
maize 43% 33% 24% 0% 100%cotton 25% 63% 13% 0% 100%
horticulture 12% 0% 88% 0% 100%other 0% 100% 0% 0% 100%
Current commercial crop
0
0.5
1
1.5
2
2.5
3
3.5
4
2000 2002 2004 2006 2008 2010 2012
27
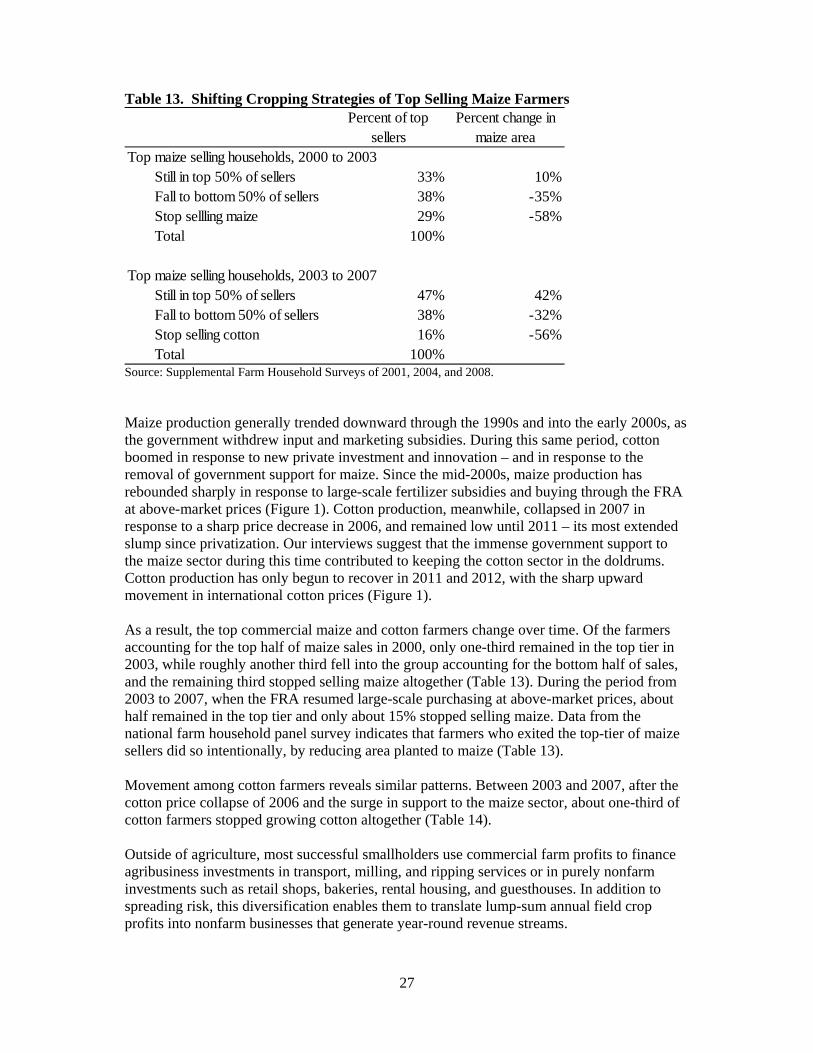
Table 13. Shifting Cropping Strategies of Top Selling Maize Farmers
Source: Supplemental Farm Household Surveys of 2001, 2004, and 2008. Maize production generally trended downward through the 1990s and into the early 2000s, as the government withdrew input and marketing subsidies. During this same period, cotton boomed in response to new private investment and innovation – and in response to the removal of government support for maize. Since the mid-2000s, maize production has rebounded sharply in response to large-scale fertilizer subsidies and buying through the FRA at above-market prices (Figure 1). Cotton production, meanwhile, collapsed in 2007 in response to a sharp price decrease in 2006, and remained low until 2011 – its most extended slump since privatization. Our interviews suggest that the immense government support to the maize sector during this time contributed to keeping the cotton sector in the doldrums. Cotton production has only begun to recover in 2011 and 2012, with the sharp upward movement in international cotton prices (Figure 1). As a result, the top commercial maize and cotton farmers change over time. Of the farmers accounting for the top half of maize sales in 2000, only one-third remained in the top tier in 2003, while roughly another third fell into the group accounting for the bottom half of sales, and the remaining third stopped selling maize altogether (Table 13). During the period from 2003 to 2007, when the FRA resumed large-scale purchasing at above-market prices, about half remained in the top tier and only about 15% stopped selling maize. Data from the national farm household panel survey indicates that farmers who exited the top-tier of maize sellers did so intentionally, by reducing area planted to maize (Table 13). Movement among cotton farmers reveals similar patterns. Between 2003 and 2007, after the cotton price collapse of 2006 and the surge in support to the maize sector, about one-third of cotton farmers stopped growing cotton altogether (Table 14). Outside of agriculture, most successful smallholders use commercial farm profits to finance agribusiness investments in transport, milling, and ripping services or in purely nonfarm investments such as retail shops, bakeries, rental housing, and guesthouses. In addition to spreading risk, this diversification enables them to translate lump-sum annual field crop profits into nonfarm businesses that generate year-round revenue streams.
Percent of top sellers
Percent change in maize area
Top maize selling households, 2000 to 2003Still in top 50% of sellers 33% 10%Fall to bottom 50% of sellers 38% -35%Stop sellling maize 29% -58%Total 100%
Top maize selling households, 2003 to 2007Still in top 50% of sellers 47% 42%Fall to bottom 50% of sellers 38% -32%Stop selling cotton 16% -56%Total 100%
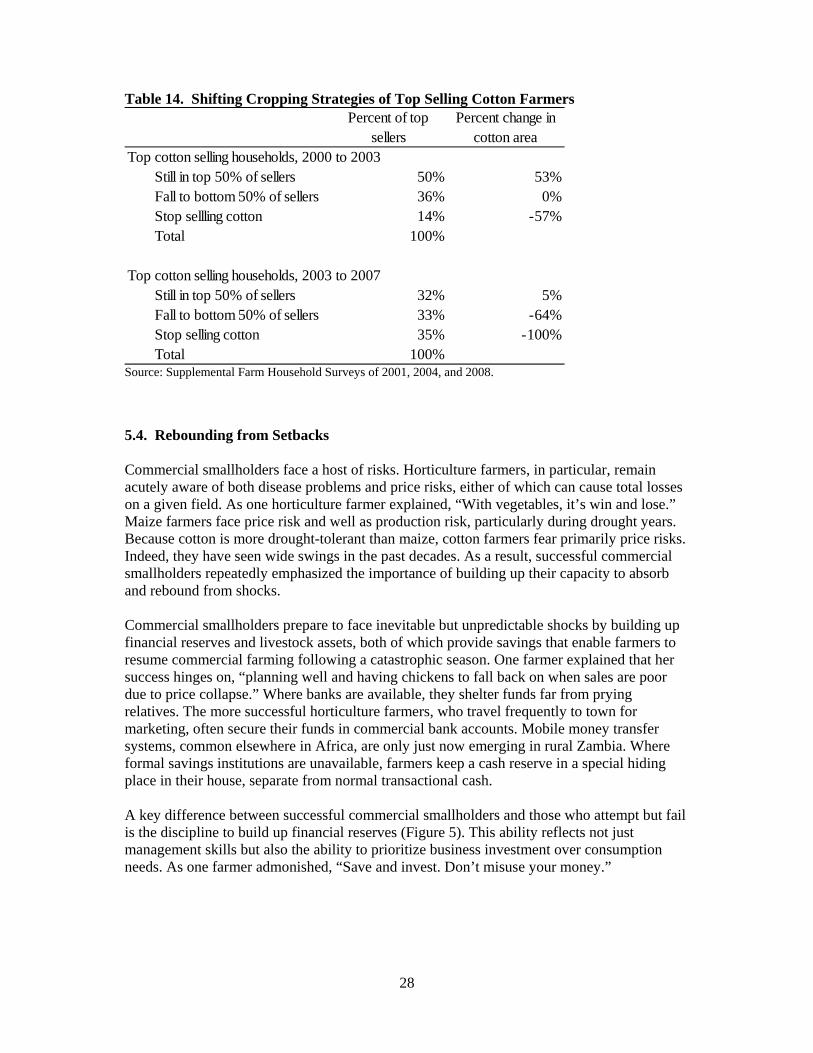
28
Table 14. Shifting Cropping Strategies of Top Selling Cotton Farmers
Source: Supplemental Farm Household Surveys of 2001, 2004, and 2008.
5.4. Rebounding from Setbacks Commercial smallholders face a host of risks. Horticulture farmers, in particular, remain acutely aware of both disease problems and price risks, either of which can cause total losses on a given field. As one horticulture farmer explained, “With vegetables, it’s win and lose.” Maize farmers face price risk and well as production risk, particularly during drought years. Because cotton is more drought-tolerant than maize, cotton farmers fear primarily price risks. Indeed, they have seen wide swings in the past decades. As a result, successful commercial smallholders repeatedly emphasized the importance of building up their capacity to absorb and rebound from shocks. Commercial smallholders prepare to face inevitable but unpredictable shocks by building up financial reserves and livestock assets, both of which provide savings that enable farmers to resume commercial farming following a catastrophic season. One farmer explained that her success hinges on, “planning well and having chickens to fall back on when sales are poor due to price collapse.” Where banks are available, they shelter funds far from prying relatives. The more successful horticulture farmers, who travel frequently to town for marketing, often secure their funds in commercial bank accounts. Mobile money transfer systems, common elsewhere in Africa, are only just now emerging in rural Zambia. Where formal savings institutions are unavailable, farmers keep a cash reserve in a special hiding place in their house, separate from normal transactional cash. A key difference between successful commercial smallholders and those who attempt but fail is the discipline to build up financial reserves (Figure 5). This ability reflects not just management skills but also the ability to prioritize business investment over consumption needs. As one farmer admonished, “Save and invest. Don’t misuse your money.”
Percent of top sellers
Percent change in cotton area
Top cotton selling households, 2000 to 2003Still in top 50% of sellers 50% 53%Fall to bottom 50% of sellers 36% 0%Stop sellling cotton 14% -57%Total 100%
Top cotton selling households, 2003 to 2007Still in top 50% of sellers 32% 5%Fall to bottom 50% of sellers 33% -64%Stop selling cotton 35% -100%Total 100%

29
5.5. Common Characteristics of Successful Commercial Smallholders In concluding our interviews, we asked each of our respondents what characteristics have enabled them to succeed as commercial farmers and, in contrast, why so many others failed. In response, they identified four major distinguishing traits. 5.5.1. Discipline
The importance of hard work and discipline came through repeatedly. Successful farmers described themselves as “hard working,” “God-fearing,” and “serious.” In contrast, many considered their unsuccessful neighbors to be “lazy.” As one said, “Some farmers are playful, womanizing and drinking too much. They do not succeed in farming.” Another farmer elaborated, “They drink too much beer and do not budget.” The successful commercial smallholders have the discipline to defer consumption and instead invest in their business. 5.5.2. Treat Farming as a Business
Most commercial smallholders explicitly stated that they consider farming a business. This translates in a willingness to shift from less profitable crops to profitable ones, or a willingness to move to a location that is more promising if land availability, electricity, or market access dictate. This business-like attitude, combined with the willpower to defer immediate consumption, translates into a strong propensity to invest in their farming business. 5.5.3. Good Managers
Successful commercial smallholders require strong management skills, for supervising crop production, labor, and finances. Horticulture and cotton, in particular, demand precise agronomics and careful farm management. However, good agronomic practices are not sufficient. Successful commercial farming also requires the ability to manage and supervise hired labor. Poor spraying or crop harvesting can reduce crop quality and revenue. The successful farmers live and work in their fields and keep a close watch on their workers. Most handle critical activities such as spraying themselves, or delegate it only to long-time, trusted employees. As one told us, “You have to be in the fields.” Absentee farming rarely ends well. Finally, they must manage their finances assiduously. Farmers repeatedly emphasized the importance of budgets and planning. One farmer said simply, “I sit down to plan.” Another said, “I do budgeting.” Asking about farmers who fail, we learned, “They don’t make a plan.” While horticulture provides a steady flow of revenue throughout most of the year, cotton and maize do not. Therefore, farmers of annual crops must very carefully budget these lump-sum revenues to make provision for expenses arising throughout the year. Diversification into bakeries, retailing, and real estate offer other ways in which they maintain a steady cash flow for expenses as they come due during the year.

30
5.5.4. Invest in their Children
All but one of the farmers we interviewed hired labor specifically to enable their children to go to school. Data from Zambia’s national farm household surveys underline this propensity. The top-tier commercial smallholders clearly invest more in their children’s education than others do (Table 15). Part of their long-term business plan involves launching their children on successful non-farm trajectories. We heard many variants of the following refrain, “I want my children to be teachers or shop owners or maybe vice president.” Table 15. Educational Investments by Smallholder Farmers in Zambia
Source: Supplemental farm household surveys of 2004 and 2008.
Farmer category
Percentage of school-age children
in school
Children's educational attainment as percent
of expectedMaize
Top half of sales 78 67Bottom half of sales 70 59Growers with no sales 64 53
CottonTop half of sales 70 59Bottom half of sales 61 48
HorticultureTop half of sales 76 65Bottom half of sales 70 58Growers with no sales 65 54

31
6. INSTITUTIONS
6.1. Institutions Affecting Farm Productivity 6.1.1. Land
For historical reasons, Zambia operates a dual set of land allocation systems: a customary tenure system managed by tribal elders and headmen and a system of leasehold state lands managed by the central government’s Ministry of Lands. Over time, population growth in the customary areas is leading to land pressure and land fragmentation. This increases the difficulty in obtaining contiguous land allocations of sufficient scale to support commercial farming. The farmers we interviewed confront this problem by moving to areas where land is available, or in one case, by purchasing a leasehold farm. Ultimately, customary land authorities will need to devise systems for consolidating land holdings and transferring use rights in blocks of sufficient scale to permit commercial farming. Increasingly, commercialized smallholders are transferring their customary usufruct rights to leasehold tenure systems as permitted under the 1995 Land Act. In the meantime, commercial smallholders rely on inheritance and mobility to ensure access to land. Over time, as farmers move to high-value agriculture – such as horticulture, poultry, and dairy production – land requirements fall. Therefore, land constraints affect primarily the low-road farmers trying to scale up cultivated area sufficiently to generate a prosperous existence from low-value crops such as cotton and maize. Even under smallholdings, commercial smallholders will face increasing need to access valuable forms of collateral, such as land. The 1995 Land Act may help to facilitate this transition. 6.1.2. Input Credit
Commercial agriculture requires purchased inputs ranging from $30 per hectare for cotton to $300 per hectare for maize and as much $4,400 per hectare for horticulture. Zambia’s formal credit system virtually stopped lending to agriculture for a decade or more following the structural adjustment reforms of the late 1980s. As a result, successful farmers instead finance inputs from nonfarm earnings, family loans, or contract farming schemes. Contract farming schemes – for cotton, sugar cane, tobacco and, for a time, paprika – all provide input credit to farmers for specialized crops with limited local markets. Where single buyers can prevent side selling, these systems work well (Dorward, Kydd, and Poulton 1998; Tschirley et al. 2009). With the proliferation of cotton companies in recent years, side selling has surfaced as a problem, which the Cotton Board and ginners have organized to police. Clearly, one key attraction of cotton is the absence of any cash requirements for input financing. Maize, in contrast, is a low-value, high-input crop. For that reason, poor farmers are rarely able to launch commercial farming careers as maize farmers. Instead, the poor transit first via cotton and then move to maize during years when prices make this attractive. Well-off rural households, who can afford to pay high mineral fertilizer and seed prices, are able to consider commercial maize production. They must also have the financial capacity to wait for delayed payments by the FRA. During our field interviews in February 2012, some of the farmers we interviewed had not received payment from the FRA and, therefore, could not purchase

32
inputs this season. As one farmer told us, “With cotton you get paid in cash at harvest time. But when selling maize to the FRA you must wait long. Sometimes you can even die.” Horticulture farmers face enormous input costs by comparison, and they do so primarily using reinvested profits from their farming businesses. Given scalability, they build up horticulture production slowly over time. Their key cash input constraint occurs during the first year of crop production. After that, farmers must manage their cash flows, financial savings, and nonfarm investments in ways that ensure the ability to self-finance farm inputs while maintaining a cash reserve to weather adverse harvests or prices. Cash management skills are indeed central today to successful commercial farming in Zambia. 6.1.3. Savings Institutions
The financial capacity to absorb shocks, recover, and reconstitute production following a catastrophic loss represents one of the defining characteristics of successful commercial smallholders. Farmers who build up a financial cushion or fungible livestock assets are able to rebound and rebuild in the aftermath of a major drought, disease infestation, or precipitous price fall (Figure 5). Institutions that support both forms of savings help to advance prospects for successful smallholder commercialization. Control of contagious livestock diseases is a public good that helps to shelter assets of vulnerable as well as currently prosperous farm households. For financial savings, formal banks provide secure savings for the most successful horticulture farmers, who make regular marketing forays into towns. However, the more remote cotton and maize farmers must, instead, rely on hiding cash in their mattress or around their homestead. The recent emergence of mobile money transfer and savings schemes in Zambia offers potentially important vehicles for farmers to secure the financial savings necessary to their commercial survival. 6.1.4. Management Discipline and good management separate the successful commercial smallholders from those who fail. Specific training and mentoring can help to build the required management skills in crop agronomics, labor, and financial management. Currently, the cotton companies offer the most widely available support system. They explicitly recruit disciplined farmers into their groups then monitor performance and quickly weed out nonperformers. They form groups with lead farmers and chairmen and provide training for service providers as well as regular agronomic extension advice at critical periods during the cropping season. They promote the best performing managers to higher and higher levels of responsibility. The system is built to filter out weak performers and assist the better performers to advance. In horticulture, similar agronomic support is available, though only at very high levels, especially for the successful farmers who are able to purchase hybrid plants from the handful of sophisticated agribusiness enterprises that provide seedlings and inputs, and who help these farmers diagnose problems and provide necessary chemical sprays. Maize farmers rely on the government extension service. In some locations, the Conservation Farming Unit has helped improve agronomic management of smallholder maize and cotton farmers, though funding was limited before 2006. Apart from the contract growing schemes, farmers must generally learn for themselves through hard experience how to manage their farms and farm finances.

33
6.2. Markets Horticulture markets have always remained the province of private sector brokers, traders, and farmers. In cotton markets, private ginning companies have, likewise, managed domestic cotton markets since the dissolution of agricultural parastatals in the early 1990s. These private markets, however, require public support. Urban wholesale markets for horticulture products generally have deplorable infrastructure and inadequate zoning. Consequently, farmers sustain heavy losses, particularly during the rainy season. Ongoing discussions between market brokers, city governments, and town planners aim to help provide the public zoning and infrastructure required to facilitate continued rapid growth of the sector. In cotton markets, too, recent problems with side selling have motivated industry collaboration with government, resulting in the promulgation of a new cotton act regulating contract farming and providing penalties and a framework for managing contract disputes. In cotton markets, too, recent problems with side selling have motivated industry collaboration with government, resulting in the enactment of the 2005 Cotton Act. Under the Act, the recently constituted Cotton Board provides for cotton inspectors to help regulate side selling and enforce input supply contracts. In maize markets, government’s Food Reserve Agency (FRA) has gained increasing market share since the mid 2000s. By 2007, the Food Reserve Agency purchased 60% of maize sold made by the top-tier commercial smallholders (Table 16). The FRA generally pays a premium above market prices, as much 40% or 50% higher in some areas according to the farmers we interviewed. This price premium results in the transfer of large payments to the generally well-off rural households who supply the bulk of maize to the FRA. However, insufficient financing during the 2011 buying season has resulted in long payment delays. As of January 24, 2012, two months after most farmers began planting, local newspapers reported that the FRA was still 198 billion kwacha (approximately US$ 39.6 million) in arrears to farmers from the previous marketing season (Zambia Daily Mail January 24, 2012). Only the most affluent farmers can afford payment delays of this magnitude and duration. Table 16. Maize Sales Outlets
Source: Central Statistical Office, Supplemental Farm Household Survey 2008.
Maize growing Distance tohouseholds FRA FRA via coop coop trader miller household other total seller (km)
Volume of maize sales (kg/household)Top half of sales 5,144 1,570 55 2,494 1,171 561 63 11,058 20Bottom half of sales 267 108 16 325 30 97 11 855 8Growers with no sales 0 0 0 0 0 0 0 0 n.aTotal maize growers 619 213 19 482 113 131 15 1,591 9
Share of maize sales, by sales outletTop half of sales 47% 14% 0% 23% 11% 5% 1% 100% n.aBottom half of sales 31% 13% 2% 38% 4% 11% 1% 100% n.aGrowers with no sales 0% 0% 0% 0% 0% 0% 0% 0% n.aTotal maize growers 39% 13% 1% 30% 7% 8% 1% 100% n.a
Sales Outlets

34
7. CONCLUSIONS
Many are called, but few are chosen. Although a majority of Zambians work in agriculture, only a small minority of smallholders succeed in transitioning to high-productivity, high-value commercial agriculture. Only about 20% of cotton farmers and less than 5% of maize and horticulture farmers succeed as top-tier commercial growers. Among those who succeed as commercial smallholders, two pathways predominate. The low road, exemplified by cotton production, involves low value output and low cash input costs. Given widespread input lending and extension support from ginning companies, cotton provides an entry point for large numbers of poor but disciplined farmers with little nonfarm income. The best managers grow their cotton business over time. Although low value crops such as cotton (and maize) cap farm earnings at modest levels, successful farmers use cotton revenues to finance entry into higher-input agriculture and to educate their children, thus opening new pathways to high-wage nonfarm employment for the next generation. The high road, exemplified by horticulture production, involves high value products with commensurately high cash input requirements. Small initial savings finance inputs for very small horticulture plots. Successful farmers accumulate savings and increase their scale over time. After 15-20 years, the best attain high incomes, accumulate savings that enable them to withstand periodic setbacks and ensure their children’s future through heavy investment in education. At a personal level, successful commercial farming requires highly disciplined management of crop agronomics, hired labor, and finances. Among the three groups we studied, only the cotton farmers enjoyed systematic extension support aimed at building up these requisite skills. The major ginners provide regular agronomic support to their farmers through cotton schools, lead farmers, and training of specialized service providers. They emphasize farmer recruitment, youth leadership training, and development of management skills through a system of lead farmers, sub-leaders, and deliberate mentoring. By combining performance bonuses with gradual promotion and demotion, they systematically cultivate and groom the best managers for positions of increasing responsibility. Individual farmers then transfer these skills to other arenas, making the cotton schools important incubators for successful commercial farmers and agribusiness entrepreneurs. Careful cash management and savings prove essential for financing inputs, hiring labor, and cushioning commercial smallholders against shocks from erratic rainfall, episodic disease outbreaks, and unpredictable price swings. As a result, financial institutions, particularly for savings, provide critical support for successful smallholder commercialization. Improved access to savings mechanisms would allow more to succeed as commercial smallholders. From a policy perspective, cotton provides a very broad on-ramp and horticulture a narrower but very steep on-ramp to the roadways out of poverty – both at little cost to the government budget. Cotton helps farmers with little start-up capital who are geographically disadvantaged. Horticulture provides opportunities to farmers who are geographically lucky enough to live near surface water and urban centers. Meanwhile, maize provides a broad low road up the mountain, but no on-ramp for the poor. At enormous cost to the public treasury, maize production offers a profitable alternative for well-established farmers with sufficient land, cattle, and equipment to farm large blocks of land in a low-value crop. In 2011, the Zambian government spent $100 million on maize procurement alone. Investment of some of these funds on public goods such as improved market infrastructure for urban horticulture

35
markets, a stronger Cotton Board, and cotton research could generate significant payoffs. Clearly, Zambia’s past policies of lavish spending on maize have not succeeded in reducing rural poverty. Less expensive and more effective alternatives in cotton and horticulture may generate higher payoffs by expanding available agricultural pathways out of poverty for commercial smallholder farmers.


37
REFERENCES
Agricultural Marketing Information Center. Various Years. Lusaka: Government of Zambia. Barrett, C. and J. McPeak. 2006. Poverty Traps and Safety Nets. In Poverty, Inequality and
Development: Essays in Honor of Erik Thorbecke, ed. A. de Janvry and R. Kanbur. New York: Springer.
Carter, Michael and Christopher Barrett. 2006. The Economics of Poverty Traps and
Persistent Poverty: An Asset-based Approach. Journal of Development Studies 42.2: 178-99.
Central Statistical Office. 2011. Living Conditions Monitoring Survey. Lusaka, Zambia:
Government of Zambia. Cotton Board of Zambia. Various Reports. Lusaka: Government of Zambia. CSO/FSRP (Central Statistical Office and Food Security Research Project). 2008.
Supplemental Farm Household Surveys of 2008. Lusaka: FSRP and Government of Zambia.
CSO/FSRP. Several years. Supplemental Farm Household Surveys of 2001, 2004, and 2008.
Lusaka: FSRP and Government of Zambia. Dorward, A., J. Kydd, and C. Poulton. 1998. Smallholder Cash Crop Production under
Market Liberalisation: A New Institutional Economics Perspective. Wallingford: CAB International.
FAOSTAT. Various Years. Rome: FAO. FSRP. Various Years. Soweto Market Monitoring. Lusaka: FSRP. Govereh, J., T.S. Jayne, and A. Chapoto. 2008. Assessment of Alternative Maize Trade and
Market Policy Interventions in Zambia. Food Security Research Project Working Paper No. 33. Lusaka: FSRP.
Haggblade, Steven, Peter B.R. Hazell, and Paul A. Dorosh. 2007. Sectoral Growth Linkages
between Agriculture and the Rural Nonfarm Economy. In Transforming the Rural Nonfarm Economy: Opportunities and Threats in the Developing World, ed. Steven Haggblade, Peter B.R. Hazell, and Thomas Reardon. Baltimore: Johns Hopkins University Press.
Haggblade, Steven and Peter B.R. Hazell. 2010. Successes in African Agriculture: Lessons
for the Future. Baltimore: Johns Hopkins University Press. Haggblade, Steven, Stephen Kabwe, and Christina Plerhoples. 2011. Productivity Impact of
Conservation Farming on Smallholder Cotton Farmers in Zambia. Food Security Research Project Working Paper No. 47. Lusaka: FSRP.

38
Haggblade, S and G. Tembo. 2003. Development, Diffusion and Impact of Conservation Farming in Zambia. Food Security Research Project Working Paper No. 8. Lusaka, Zambia: FSRP.
Hichaambwa, Munguzwe and David Tschirley. 2006. Zambia Horticultural Rapid Appraisal:
Understanding the Domestic Value Chains of Fresh Fruits and Vegetables. Food Security Research Project Working Paper No. 17. Lusaka: FSRP.
Hill, Catharine B. and Malcolm F. McPherson. 2004. Promoting and Sustaining Economic
Reform in Zambia. Cambridge, MA: Harvard University Press. Howard, J.A. and C. Mungoma. 1996. Zambia’s Stop-and-go Revolution: The Impact of
Policies and Organizations on the Development and Spread of Maize Technology. MSU International Development Working Paper No. 61. East Lansing: Michigan State University.
Jayne, T.S., J. Govereh, A. Mwanaumo, and J.K. Nyoro. 2002. False Promise or False
Premise? The Experience of Food and Input Market Reform in Eastern and Southern Africa. World Development 30.11:1967-1985.
Jayne, T.S., Nicole Mason, William Burke, Arthur Shipekesa, Antony Chapoto, and Chance
Kabaghe. 2011. Mountains of Maize, Persistent Poverty. Food Security Research Project Policy Synthesis No. 48. Lusaka: FSRP.
Johnston, B.F. and P. Kilby. 1975. Agriculture and Structural Transformation: Economic
Strategies in Late-Developing Countries. London: Oxford University Press. Kherallah, Mylène, Christopher Delgado, Eleni Gabre-Madhin, Nicholas Minot, and Michael
Johnson. 2002. Reforming Agricultural Markets in Africa. Baltimore: Johns Hopkins University Press.
Kokwe, Gun Mickels. 1997. Maize, Markets and Livelihoods: State Intervention and Agrarian Change in Luapula Province Zambia, 1950 to 1995. Helsinki: University of Helsinki.
Landscan. 2008. Gridded Population Data Base of 2008. Oak Ridge, TN: Oak Ridge National
Laboratory. Ministry of Agriculture and Cooperatives (MACO). 2004. National Agricultural Policy:
2004-2015. Lusaka: MACO. Mason, Nicole. 2011. Smallholder Behavioral Responses to Marketing Board Activities in a
Dual Channel Marketing System: The Case of Maize in Zambia. Ph.D. dissertation, Michigan State University.
Mason, Nicole M., William J. Burke, Arthur Shipekesa, and T.S. Jayne. 2011. The 2011
Surplus in Smallholder Maize Production in Zambia: Drivers, Beneficiaries, and Implications for Agricultural and Poverty Reduction Policies. Food Security Research Project Working Paper No. 58. Lusaka, Zambia: FSRP.

39
Mason, Nicole M. and Robert J. Myers. 2011. The Effects of the Food Reserve Agency on Maize Market Prices in Zambia: Are There Threshold Nonlinearities? Food Security Research Project Working Paper No. 60. Lusaka, Zambia: FSRP.
Mellor, J.W. and U.J. Lele. 1973. Growth Linkages of the New Food Grain Technologies.
Indian Journal of Agricultural Economics 18.1:35-55. Mosher, Arthur. 1966. Getting Agriculture Moving. New York: Agricultural Development
Council. Mwanaumo, Anthony, T.S Jayne, Ballard Zulu, Julius Shawa, Green Mbozi, Steven
Haggblade, and Misheck Nyembe. 2005. Zambia’s 2005 Maize Import and Marketing Experiences: Lessons and Implications. Policy Synthesis No.11. Lusaka: FSRP.
Renkow, Mitch. 2007. Cities, Towns and the Rural Nonfarm Economy. In Transforming the
Rural Nonfarm Economy: Opportunities and Threats in the Developing World, ed. Steven Haggblade, Peter B.R. Hazell, and Thomas Reardon. Baltimore: Johns Hopkins University Press.
Smale, Melinda and Jayne, T.S. 2010. ‘Seeds of Success’ in Retrospect: Hybrid Maize in
Eastern and Southern Africa. In Successes in African Agriculture: Lessons for the Future, ed. Steven Haggblade and Peter B.R. Hazell. Baltimore: Johns Hopkins University Press.
Tembo, Gelson, Antony Chapoto, Thomas Jayne, and Michael Weber. 2009. Fostering
Agricultural Market Development in Zambia. Food Security Research Project Working Paper No. 40. Lusaka: FSRP.
Timmer, Peter. 1988. The Agricultural Transformation. In Handbook of Development
Economics, Volume I., ed. H. Chenery and T.N. Srinivasan. Amsterdam: Elsevier Science Publishers.
Tschirley, David L., Isaac Minde, and Duncan H. Boughton. 2009. Contract Farming in Sub-
Saharan Africa: Lessons from Cotton on What Works and under What Conditions. ReSAKSS Issue Brief No. 7. Pretoria, South Africa: ReSAKSS.
Tschirley, David and Munguzwe, Hichaambwa. 2010. The Structure and Behavior of
Vegetable Markets Serving Lusaka. Food Security Research Project Working Paper No. 46. Lusaka: FSRP.
Tschirley, David and Stephen Kabwe. 2010. A Case Study of Regulation in Zambia’s Cotton
Sector. Food Security Research Project Working Paper No. 45. Lusaka: FSRP. Wood, Adrian P., Stuart A. Kean, John Tl Milimo, and Dennis Michael Warren, editors.
1990. The Dynamics of Agricultural Policy Reform in Zambia. Ames, IA: Iowa State University Press.
World Bank. 2008. Agriculture for Development: World Development Report 2008.
Washington, D.C.: The World Bank.

40
World Bank. 2009. Reshaping Economic Geography: World Development Report 2009. Washington, D.C.: The World Bank.
Zambia Daily Mail. January 24, 2012. FRA Exports 379,000 Tonnes of Maize to SADC,
COMESA. Zulu, Ballard, J.J. Nijhoff, T.S. Jayne, and Asfaw Negassa. 2000. Is the Glass Half-empty Or
Half-full? An Analysis of Agricultural Production Trends in Zambia. Working Paper No. 3. Lusaka: FSRP.
Zulu, B., T.S. Jayne, and M. Beaver. 2006. Smallholder Household Maize Production and
Marketing Behavior in Zambia. FSRP Working Paper No. 17. Lusaka: FSRP.