Embed Size (px)
Citation preview
Economics and Sociology Occasional Paper No. 1702
AGRICULTURAL SELF SUFFICIENCY IN LATIN AMERICA
by
Douglas H. Graham
and
Namatie Traore
March, 1990
A¢cultural Finance Program Department of Agricultural Economics
and Rural Sociology
The Ohio State University 2120 Fyffe Road
Columbus, Ohio 43210..1099
Abstract
Agricultural self sufficiency in Latin America experienced a decline in cereal products from the early 1970s onwards despite cereal self sufficiency policies in many countries. The growth in per capita income leading to an increase in the demand for livestock products largely explains this since feed grains (corn) had to be imported to service the livestock sectors meeting this demand. Food grains (wheat) were also imported to service the growth in cereal demand in urban centers. These two factors overwhelmed the rising per capita production of cereal products in many countries to produce a decline in cereal self sufficiency.
I. Introduction
SELF SUFFICIENCY IN LATIN AMERICA
by
Douglas H. Graham and Namatie Traore
The profile of agricultural self sufficiency in Latin America can be summarized by
periods, products, and selected sets of countries over the past 25 years. Three periods stand
out in the ensuing analysis. The first period refers to the decade of the 1960s, a time of
continuing import substitution policies for industrialization and sporadic effort$ at
agricultural development in a world environment in which trade in agricultural products was
less extensive compared to later periods. Generally, Latin American countries recorded
reasonably high levels of self sufficiency in both cereal and livestock products at this time.
The second period, the 1970s, recorded rapid changes in the international
environment derived from the post 1973 oil crisis, the rise in cereal prices in world
commodity markets (from 1973 through 1975), and the rapid growth in foreign debt
financing to this region supporting high consumption levels of food and feed grains up to
1980, This period saw the incorporation of more focused self sufficiency drives in selected
product lines such as rice and wheat to offset the price rise in world commodity markets.
However, the continuing rise in per capita income, fueled by international debt finance in
the face of energy induced balance of payments deficits, led to a rise in cereal imports in
the form of wheat for human consumption in urban areas and feed grains to service
domestic livestock production to meet the growing demand for livestock products.
1
2
The third period (1981-85) coincides with the onset of the world recession, the
contraction of foreign debt and the downscaling of previous self sufficiency drives as fiscal
constraints prevented the continued subsidization of domestic production of cereal products
at the same level as in the 1970s. Nevertheless, the decline in the growth of per capita
income during this period also led to a decline in the demand for higher income elastic
livestock products and therefore a reduction in the imports of feed grains to service the
livestock sector. The rise or decline of self sufficiency in cereal products in this most recent
period is largely derived from the relative effect of these two forces. The principal finding
that emerges from this anlaysis is that cereal product self sufficiency declines substantially
for most Latin American countries from the 1970s onwards despite the existence of
numerous self sufficiency drives for cereal products during this same period. The factors
that led to this result form the basis of this chapter.
This chapter draws upon the food balance data of the FAO to document the trends
in agricultural self sufficiency in Latin America and selected sets of countries within this
region over a 25 year period (1961-85). Both cereal products (rice, com, wheat, etc.) and
the aggregate of livestock products (beef, swine, poultry, and other minor livestock activities)
receive attention, however the former will be emphasized in the analysis.
Finally, a word is necessary on the data used in the analysis. The FAO annual food
balance data on trade, production and consumption was drawn upon for this work.
Furthermore this annual series for a twenty-five year period (1961-85) was converted to a
single measure, i.e. cereal equivalent units of production or consumption. As Rask states
in his chapter in this volume,:
3
" ... a simple counting of calories or units of protein is not sufficient since units of calories or protein from livestock products often require a substantially greater input of agricultural production resources than do these same units from plant products. Since cereals are the basic food building blocks, either consumed directly as food (i.e. rice, wheat) or converted to livestock products (wheat, com), a concept of cereal equivalents was developed to serve as a measure of food consumption levels."
Therefore grains were given a cereal equivalent value of 1.0 while livestock products
were scaled from 1.2 for dairy products to 3.2 for poultry up to 11.7 for beef products to
reflect the quantity of grain necessary to produce a unit of product. All the measures of
consumption, production, and self sufficiency (i.e. the ratio of production over consumption)
used in the following tables are expressed in cereal equivalent units of measure.
II. Trends in Cereal and Livestock Self SuMciency: Latin America
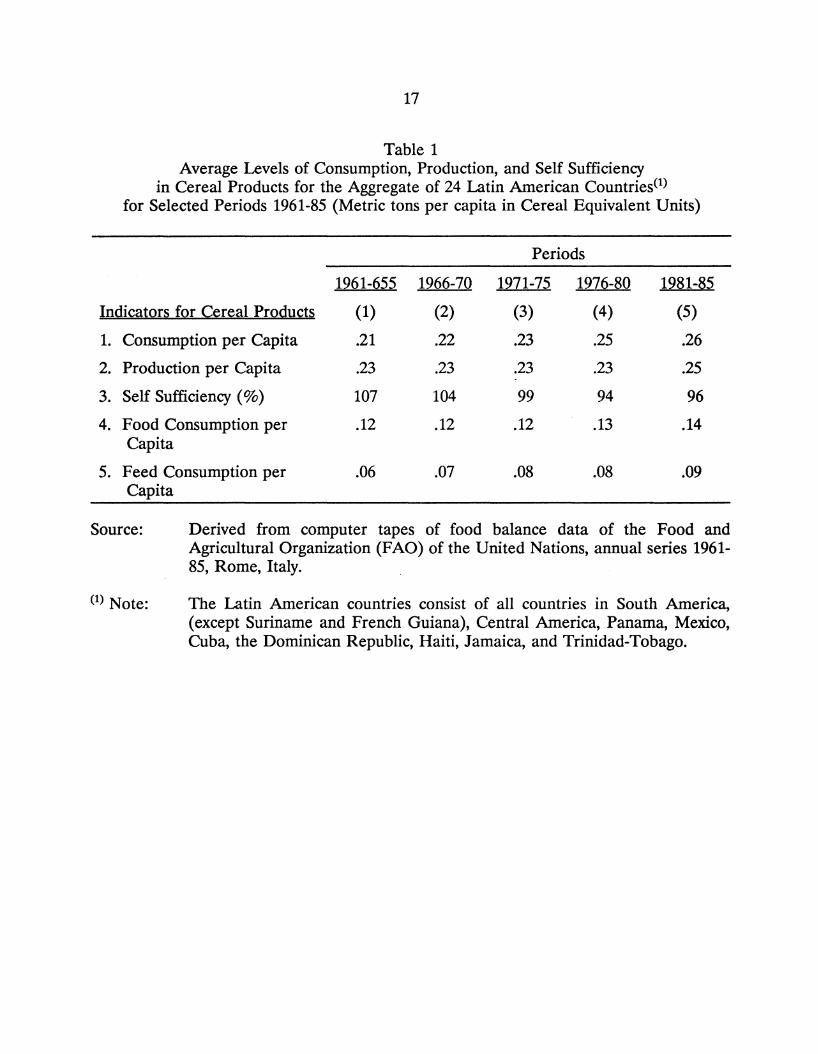
Aggregate data on production and self sufficiency for the 24 Latin American
countries covered by the FAO data are shown in Table 1. Despite continuing rapid
population growth throughout most of this period, cereal production per capita maintained
a relatively constant average level for the 1961-85 period. Cereal production of .23 metric
tons per capita per year represents (in cereal equivalent units) 507lbs per person per year.
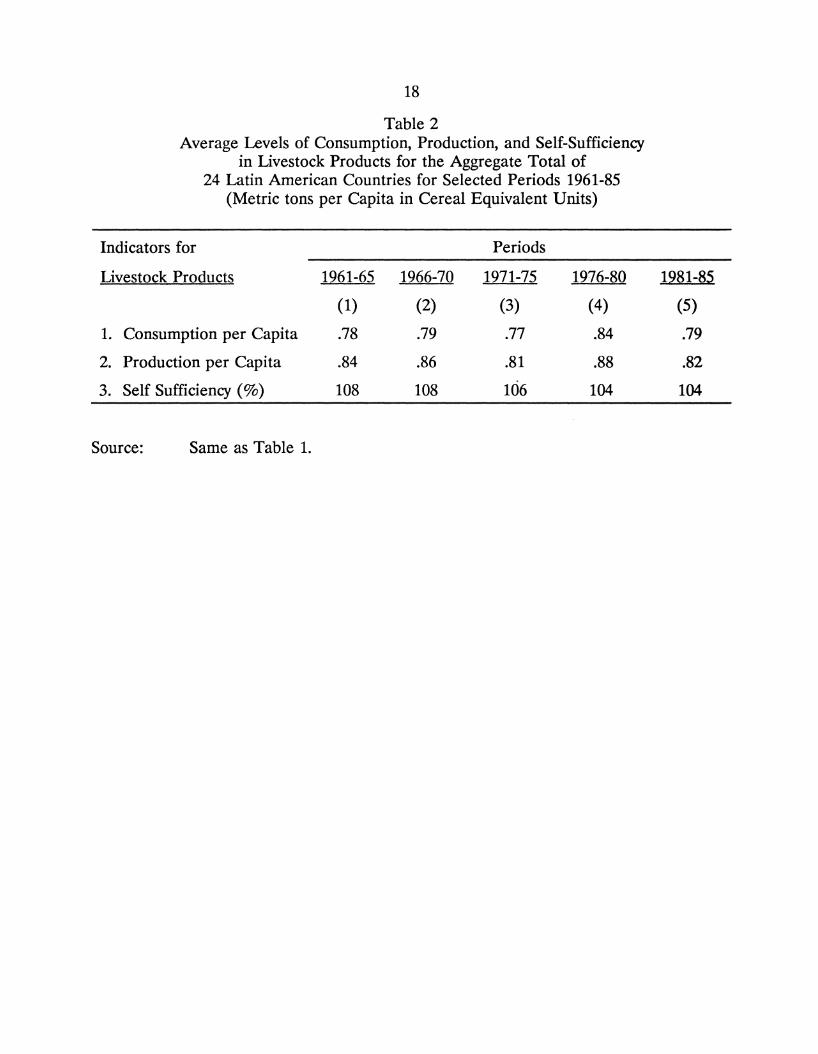
Livestock product output per capita ranged between .81 and .88 metric tons per person per
year (i.e. 1,785 and 1,940 lbs. cereal equivalent lbs per person, per year). This latter
measure is the grain equivalent (in feed) to produce the livestock products (on a per capita
basis). There was a rise in this grain equivalent production in the late 1970s in Table 2 and
a decline during the recession years of the early 1980s. This is not surprising since with
4
declining income one would expect to see a decline in the highly income elastic demand for
livestock products.
The self sufficiency measures reflect the discrepancy between production and
consumption (with adjustment for stocks). This measure indicates that Latin America as a
whole was more than self sufficient in cereal products in the 1960s (i.e. the region was a net
exporter). However a declining trend emerged in the 1970s (when most self sufficiency
drives were launched) and rose slightly in the early 1980s.
Livestock self sufficiency in Table 2, on the other hand, was consistently above one
indicating the region as a whole is a net exporter of livestock products. Livestock self
sufficiency indicators usually fluctuate within a narrow range of five to ten percent of
complete self sufficiency for most regions of the world. These products are expensive,
frequently perishable and form a small part of the diet of populations in lesser developed
countries~ Therefore countries do not engage in substantial imports of these products. Such
is not the case for cereal products. Here self sufficiency can decline to much lower levels
(as will be seen shortly). Finally it should be emphasized that several countries in Latin
America exhibit a strong comparative advantage in livestock products (Argentina, Uruguay,
and Paraguay among others) so that it is not surprising to see the average for the region as
a whole register a net export position.
Finally the relatively more rapid increase of feed consumption per capita compared
to per capita food consumption over this period can be seen in Table 1. Growth in the
demand for livestock products lies behind this trend. Livestock products are far more
income elastic than cereal products used for food. Hence growth in per capita income will
5
lead to a proportionately greater increase in the demand for livestock products over cereal
food products. This in turn generates a relatively stronger demand for feed grains (primarily
corn) over food grains (wheat and rice). This fact will clearly influence the analysis of
cereal self sufficiency throughout this chapter.
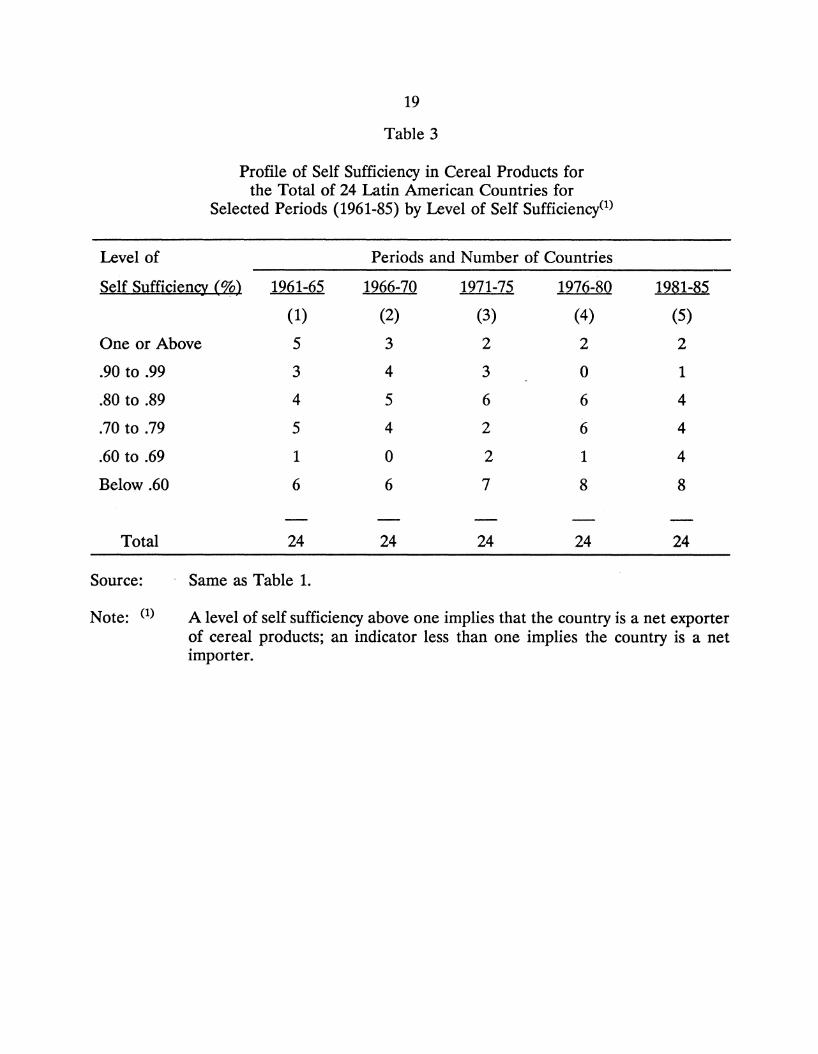
In Tables 3 and 4 the broad profile of self sufficiency for both cereal and livestock
products are highlighted. The range for self sufficiency indicators is much wider for cereal
than for livestock products. Furthermore the trend of declining self sufficiency is evident
in cereal products (Table 3). During the early 1960s eight Latin American countries
registered 90 percent or more self sufficiency (including the net export position above one).
By the late seventies this number had fallen to only three countries. On the other hand, the
number of countries below 70 percent self sufficiency increased from seven (in the period
1961~65) to 12 countries (by 1981-85).
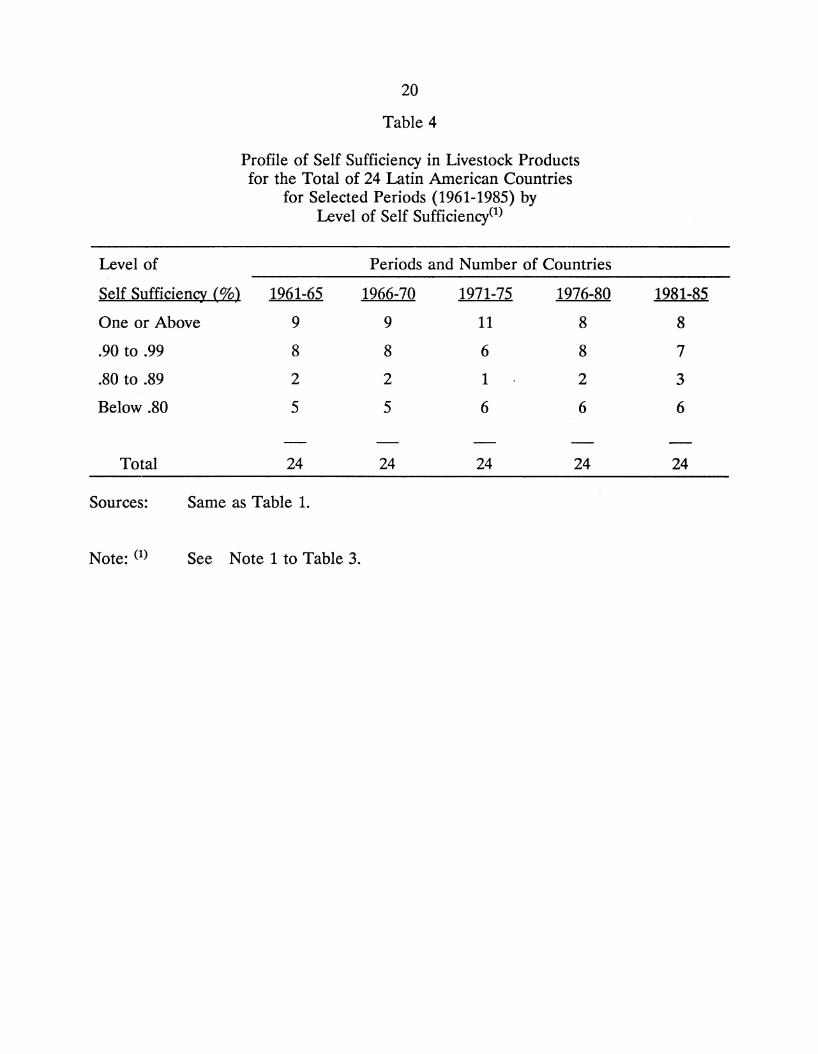
The profile of self sufficiency for most countries in livestock prodm;ts in Table 4 falls
within a much narrower band, records a much larger number of countries in a net export
position and exhibits much greater stability over time. The number of countries registering
one or above on the self-sufficiency index remained relatively stable from the beginning
period to the end. Only the early 1970s reflects a break with these patterns with a rise in
the number of net exporters which in turn fell back to the longer run stable profile in the
ensuing two periods. This relatively stable pattern of self sufficiency in livestock products
makes it less interesting to investigate than the more striking profile of decline recorded
for cereal products for many Latin American countries. Hence in the remainder of this
6
chapter we will focus on the factors behind the declining trend of self sufficiency in cereal
products.
The data in Table 5 indicates that declining cereal output per capita is not the
principal reason for this decline in self sufficiency. This and the remaining tables will be
restricted to the 20 Latin American countries that have a substantial agricultural sector and
therefore were most likely to be concerned with self sufficiency issues. Anywhere from eight
to ten countries recorded positive increases in cereal output per capita in each of the four
periods in Table 5 from 1966 through 1985. The number· of countries recording negative
growth in cereal output per capita actually declined from seven in the 1966-70 period to only
five in the final period (1981-85). Yet despite this promising production record, the number
of countries recording positive increases in cereal self-sufficiency generally declined
throughout the entire period.
The explanation for this lies in the rapid increase in both food and feed imports
(especially the latter) derived from the growth in per capita income (up to 1980). This
growth in income generated a demand for livestock products which in turn generated an
increase in feed grain imports to service the expansion of domestic livestock activities to
meet this demand. Norman Rask's article in this chapter sets forth the world-wide
documentation of this phenomenon reducing the tendency of cereal self sufficiency in
rapidly growing middle income countries. Many of the Latin American countries are
precisely the growing middle income countries during this period that reflect this pattern.
III. The Historical Profile for Cereal Self Sufficiency: Country Specific Trends
7
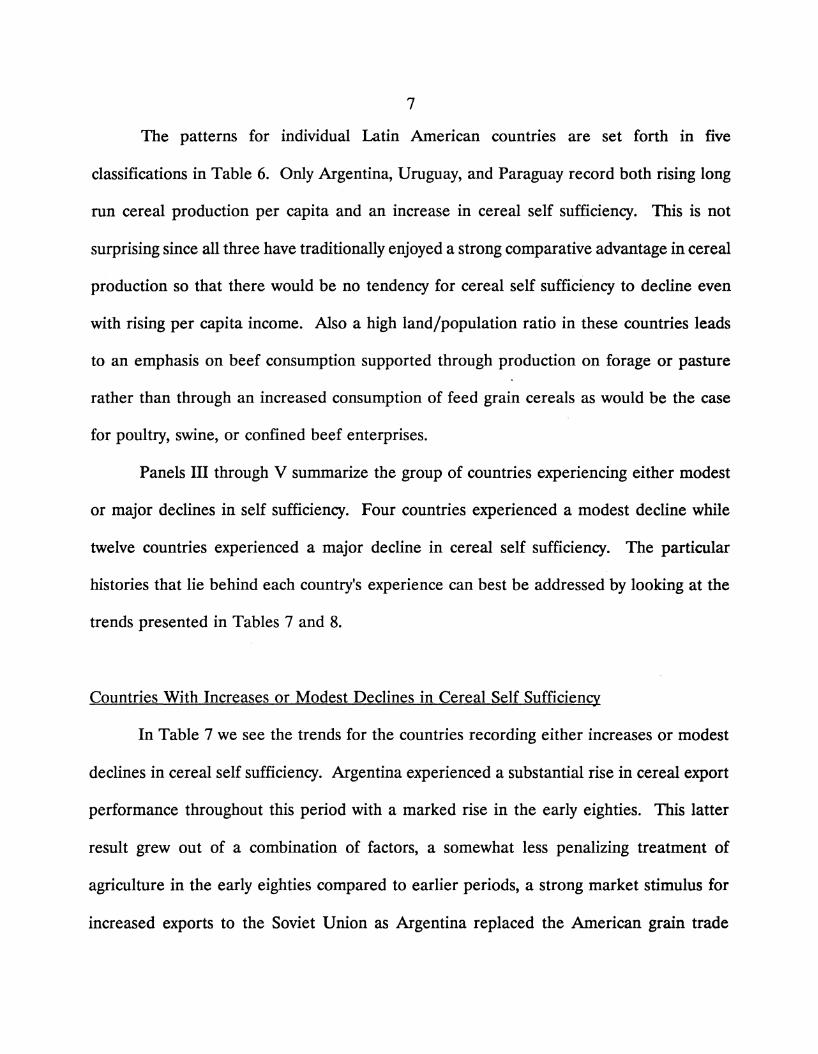
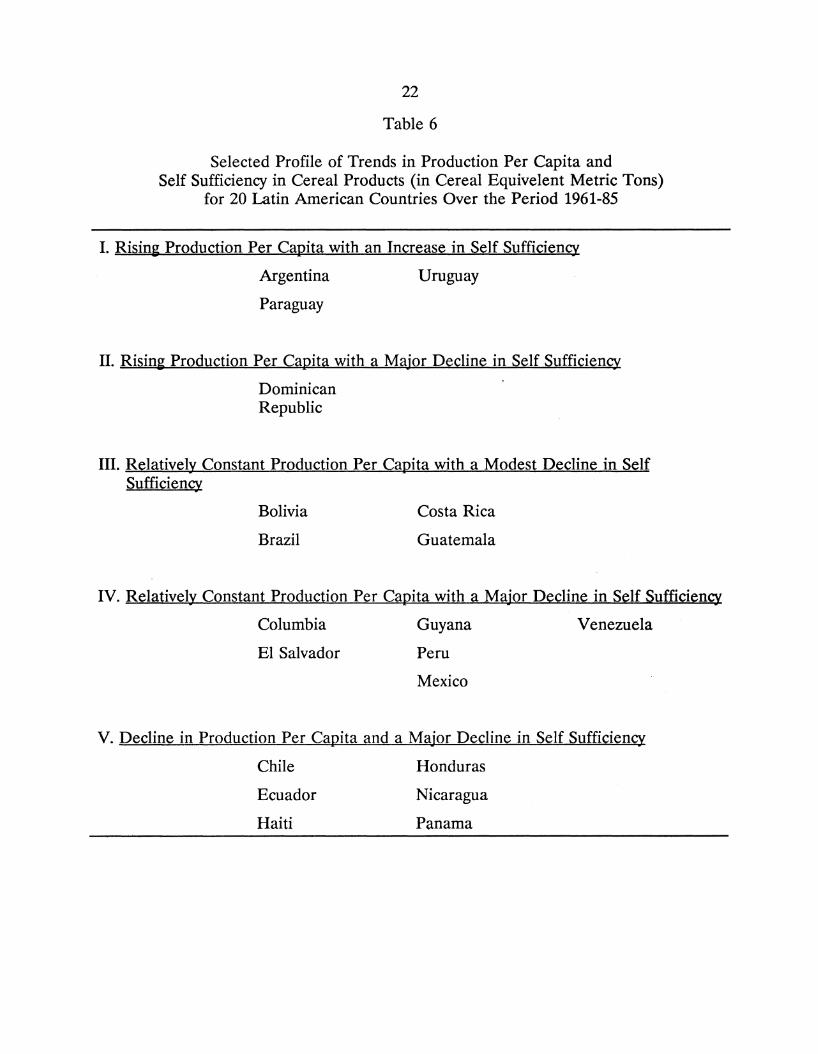
The patterns for individual Latin American countries are set forth in five
classifications in Table 6. Only Argentina, Uruguay, and Paraguay record both rising long
run cereal production per capita and an increase in cereal self sufficiency. This is not
surprising since all three have traditionally enjoyed a strong comparative advantage in cereal
production so that there would be no tendency for cereal self sufficiency to decline even
with rising per capita income. Also a high land/population ratio in these countries leads
to an emphasis on beef consumption supported through production on forage or pasture
rather than through an increased consumption of feed grain cereals as would be the case
for poultry, swine, or confined beef enterprises.
Panels III through V summarize the group of countries experiencing either modest
or major declines in self sufficiency. Four countries experienced a modest decline while
twelve countries experienced a major decline in cereal self sufficiency. The particular
histories that lie behind each country's experience can best be addressed by looking at the
trends presented in Tables 7 and 8.
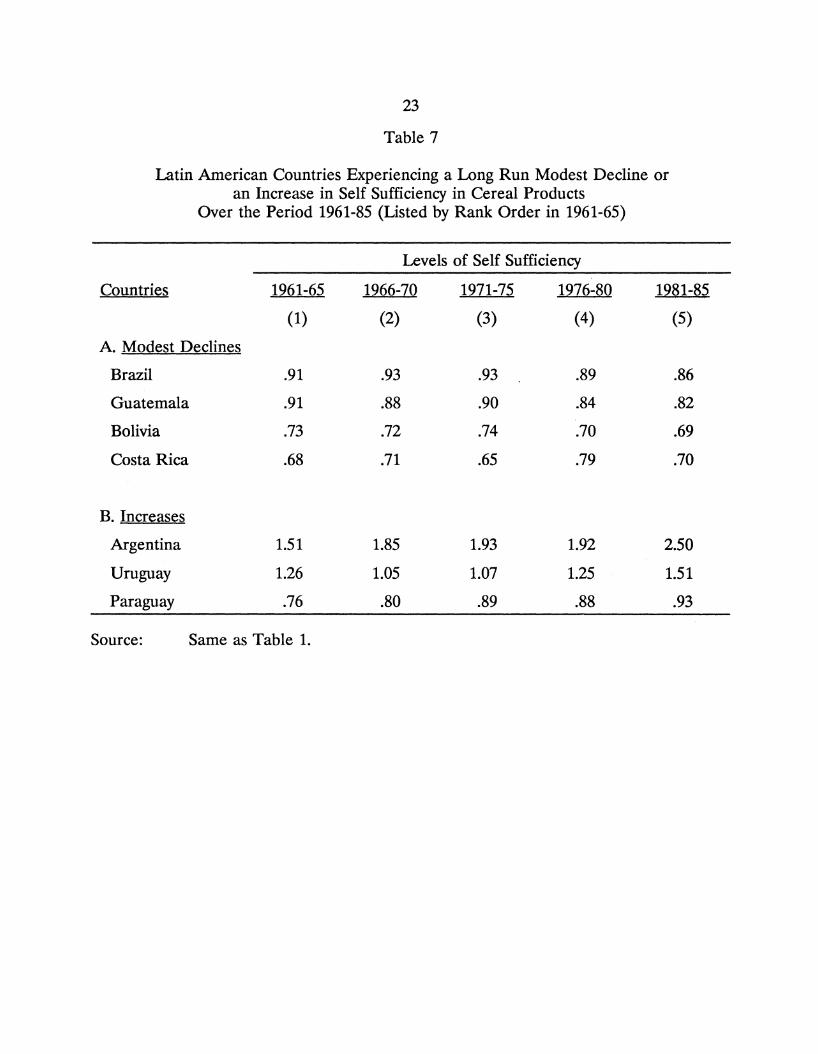
Countries With Increases or Modest Declines in Cereal Self Sufficiency
In Table 7 we see the trends for the countries recording either increases or modest
declines in cereal self sufficiency. Argentina experienced a substantial rise in cereal export
performance throughout this period with a marked rise in the early eighties. This latter
result grew out of a combination of factors, a somewhat less penalizing treatment of
agriculture in the early eighties compared to earlier periods, a strong market stimulus for
increased exports to the Soviet Union as Argentina replaced the American grain trade
8
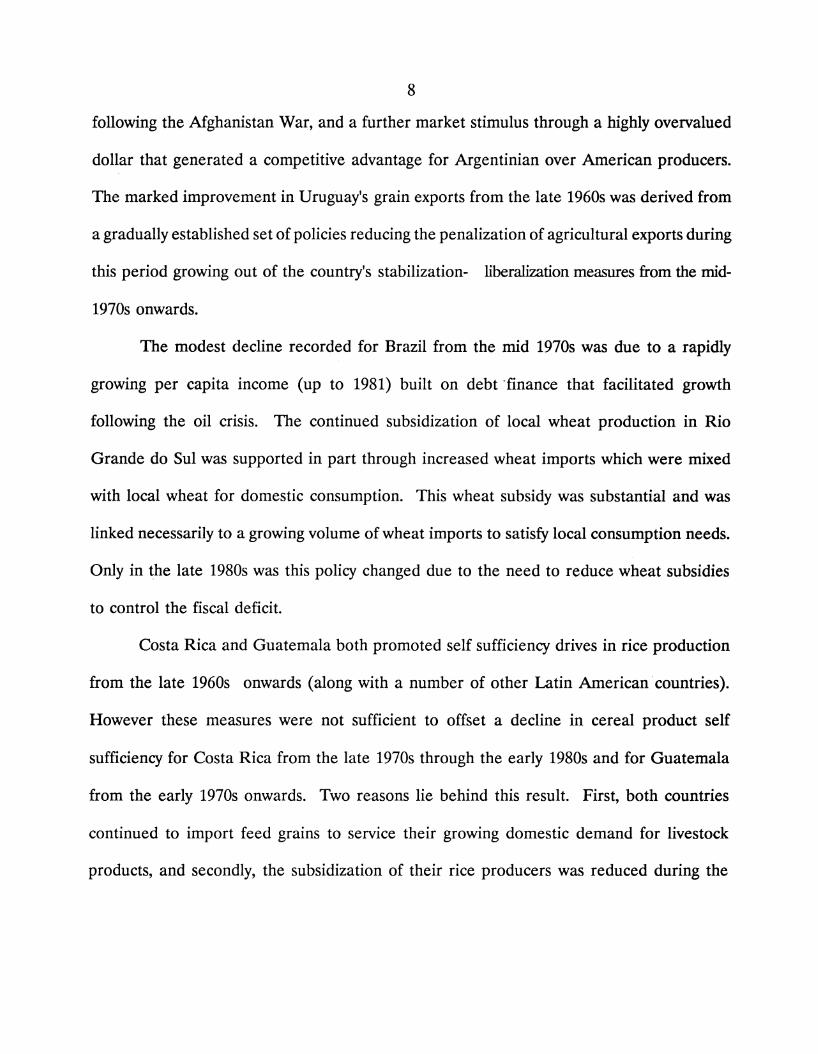
following the Mghanistan War, and a further market stimulus through a highly overvalued
dollar that generated a competitive advantage for Argentinian over American producers.
The marked improvement in Uruguay's grain exports from the late 1960s was derived from
a gradually established set of policies reducing the penalization of agricultural exports during
this period growing out of the country's stabilization- liberalization measures from the mid-
1970s onwards.
The modest decline recorded for Brazil from the mid 1970s was due to a rapidly
growing per capita income (up to 1981) built on debt ·finance that facilitated growth
following the oil crisis. The continued subsidization of local wheat production in Rio
Grande do Sui was supported in part through increased wheat imports which were mixed
with local wheat for domestic consumption. This wheat subsidy was substantial and was
linked necessarily to a growing volume of wheat imports to satisfy local consumption needs.
Only in the late 1980s was this policy changed due to the need to reduce wheat subsidies
to control the fiscal deficit.
Costa Rica and Guatemala both promoted self sufficiency drives in rice production
from the late 1960s onwards (along with a number of other Latin American countries).
However these measures were not sufficient to offset a decline in cereal product self
sufficiency for Costa Rica from the late 1970s through the early 1980s and for Guatemala
from the early 1970s onwards. Two reasons lie behind this result. First, both countries
continued to import feed grains to service their growing domestic demand for livestock
products, and secondly, the subsidization of their rice producers was reduced during the
9
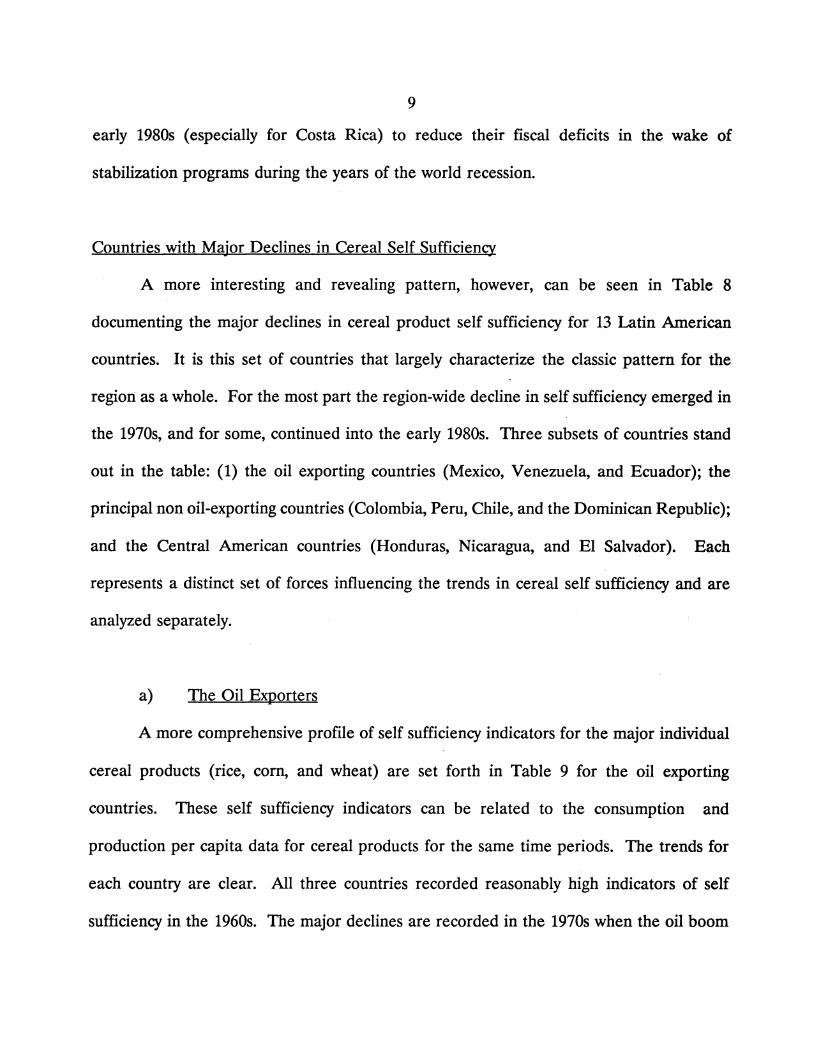
early 1980s (especially for Costa Rica) to reduce their fiscal deficits in the wake of
stabilization programs during the years of the world recession.
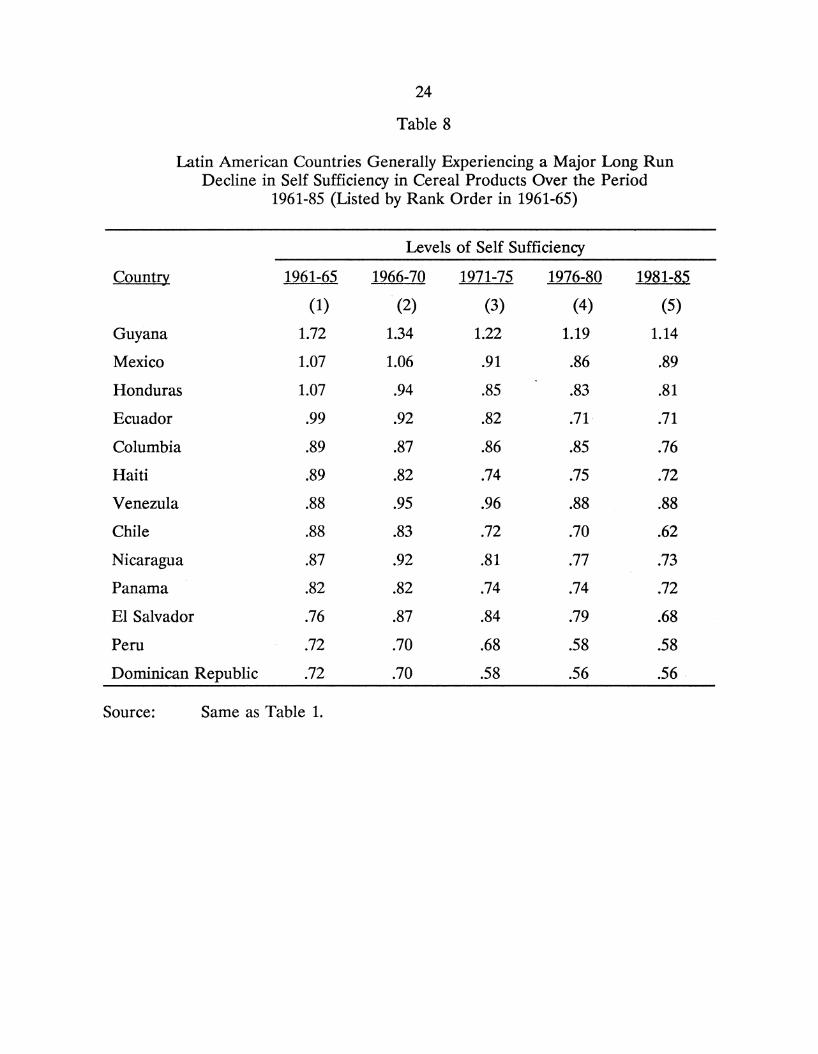
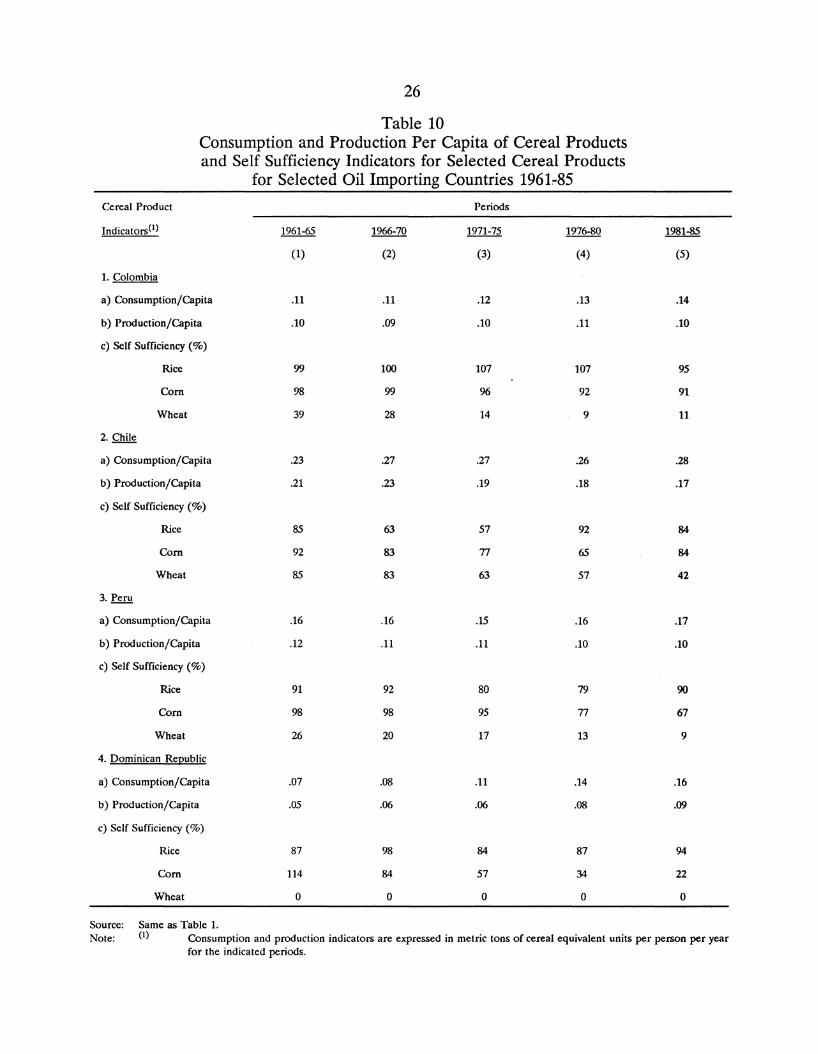
Countries with Major Declines in Cereal Self Sufficiency
A more interesting and revealing pattern, however, can be seen in Table 8
documenting the major declines in cereal product self sufficiency for 13 Latin American
countries. It is this set of countries that largely characterize the classic pattern for the
region as a whole. For the most part the region-wide decline in self sufficiency emerged in
the 1970s, and for some, continued into the early 1980s. Three subsets of countries stand
out in the table: (1) the oil exporting countries (Mexico, Venezuela, and Ecuador); the
principal non oil-exporting countries (Colombia, Peru, Chile, and the Dominican Republic);
and the Central American countries (Honduras, Nicaragua, and El Salvador). Each
represents a distinct set of forces influencing the trends in cereal self sufficiency and are
analyzed separately.
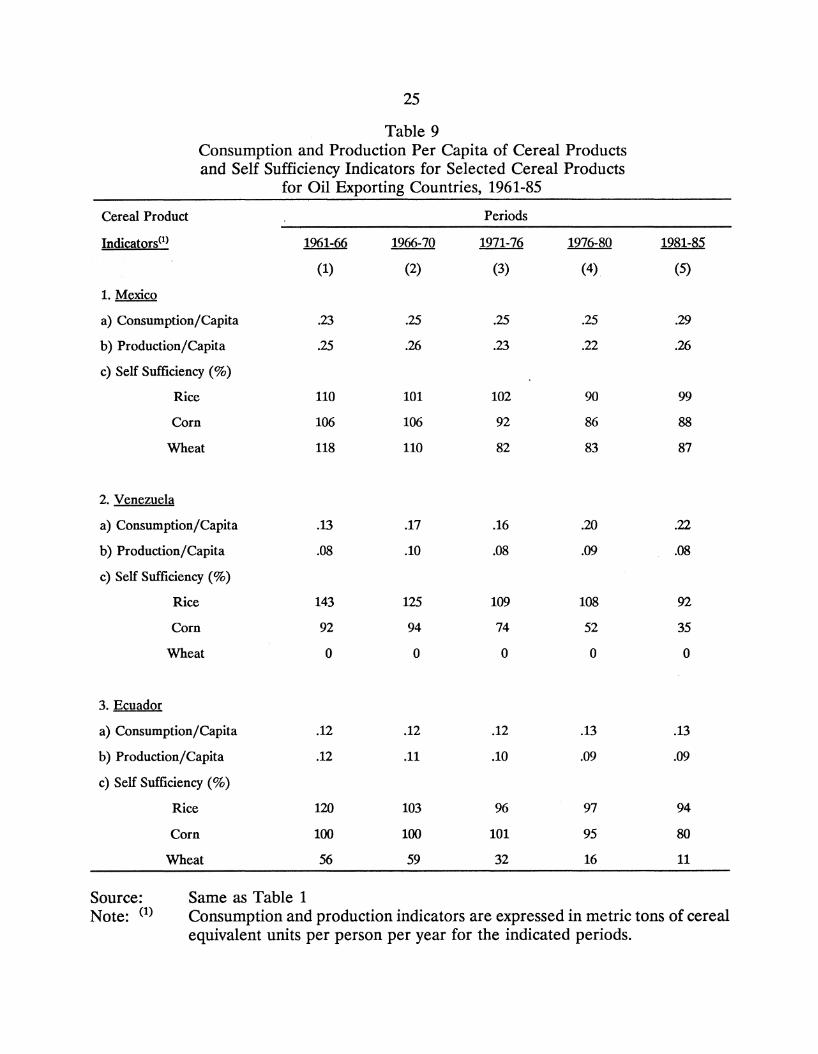
a) The Oil Exporters
A more comprehensive profile of self sufficiency indicators for the major individual
cereal products (rice, corn, and wheat) are set forth in Table 9 for the oil exporting
countries. These self sufficiency indicators can be related to the consumption and
production per capita data for cereal products for the same time periods. The trends for
each country are clear. All three countries recorded reasonably high indicators of self
sufficiency in the 1960s. The major declines are recorded in the 1970s when the oil boom
10
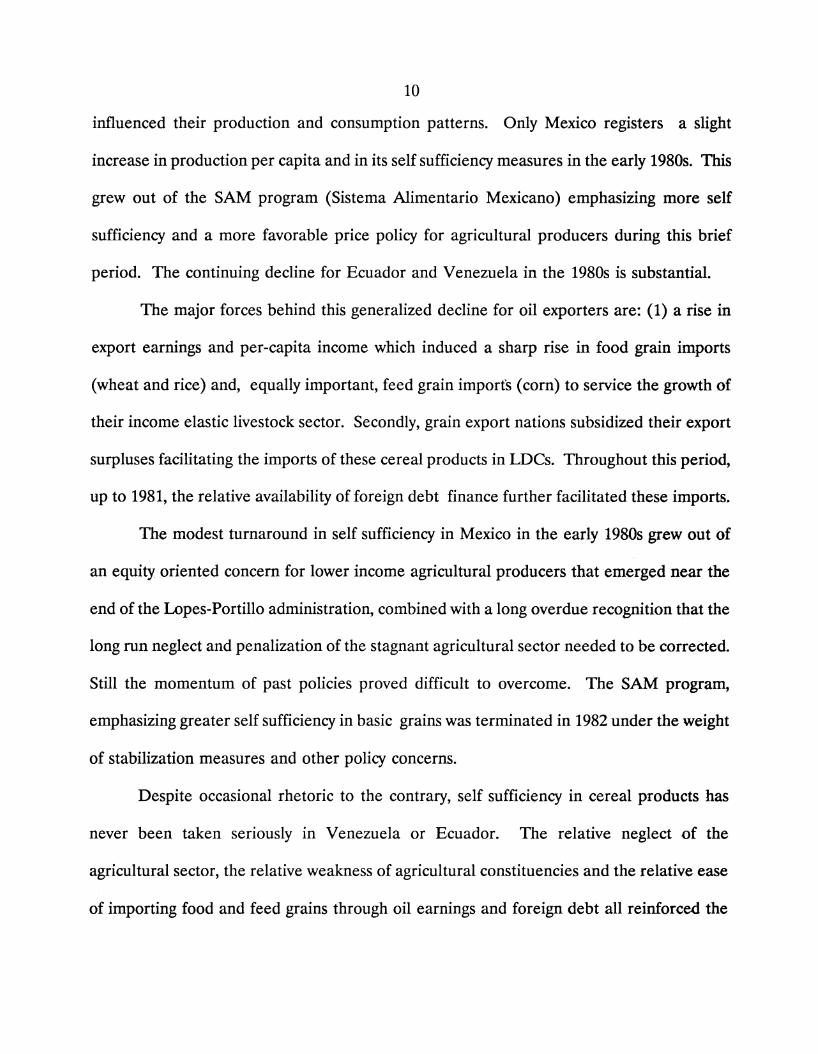
influenced their production and consumption patterns. Only Mexico registers a slight
increase in production per capita and in its self sufficiency measures in the early 1980s. This
grew out of the SAM program (Sistema Alimentario Mexicano) emphasizing more self
sufficiency and a more favorable price policy for agricultural producers during this brief
period. The continuing decline for Ecuador and Venezuela in the 1980s is substantial.
The major forces behind this generalized decline for oil exporters are: (1) a rise in
export earnings and per-capita income which induced a sharp rise in food grain imports
(wheat and rice) and, equally important, feed grain imports (com) to service the growth of
their income elastic livestock sector. Secondly, grain export nations subsidized their export
surpluses facilitating the imports of these cereal products in LDCs. Throughout this period,
up to 1981, the relative availability of foreign debt finance further facilitated these imports.
The modest turnaround in self sufficiency in Mexico in the early 1980s grew out of
an equity oriented concern for lower income agricultural producers that emerged near the
end of the Lopes-Portillo administration, combined with a long overdue recognition that the
long run neglect and penalization of the stagnant agricultural sector needed to be corrected.
Still the momentum of past policies proved difficult to overcome. The SAM program,
emphasizing greater self sufficiency in basic grains was terminated in 1982 under the weight
of stabilization measures and other policy concerns.
Despite occasional rhetoric to the contrary, self sufficiency in cereal products has
never been taken seriously in Venezuela or Ecuador. The relative neglect of the
agricultural sector, the relative weakness of agricultural constituencies and the relative ease
of importing food and feed grains through oil earnings and foreign debt all reinforced the

Missing Pages

Missing Pages
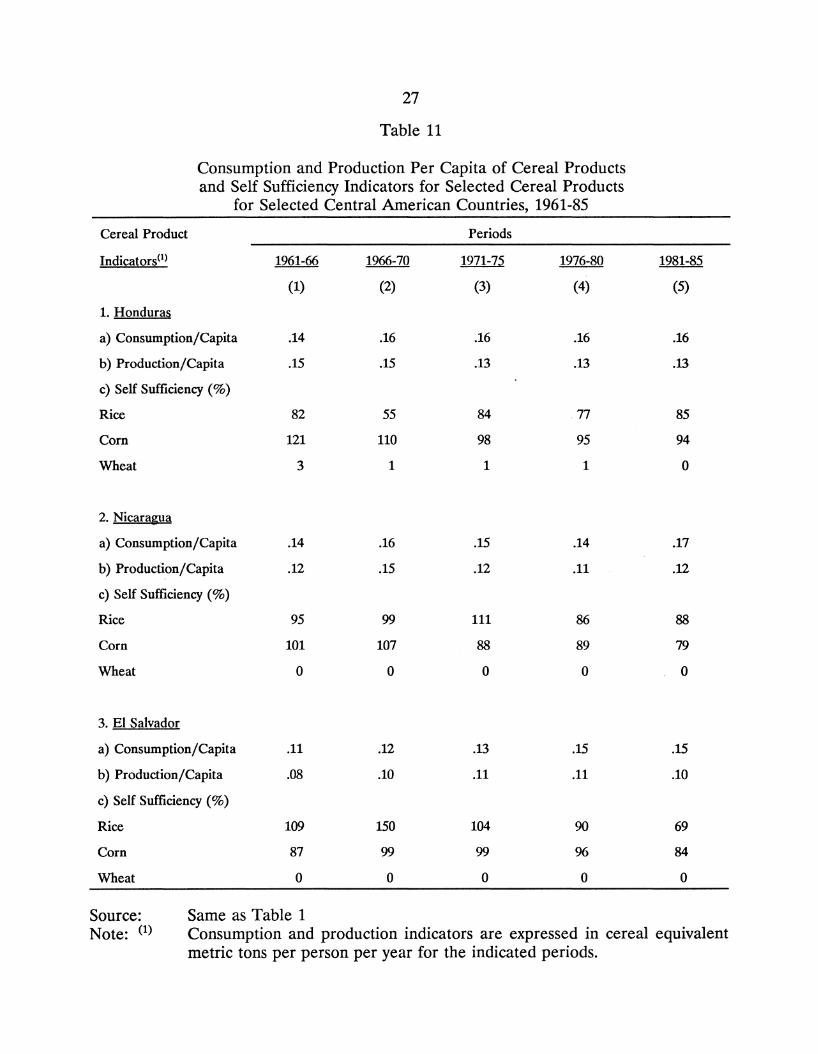
13
sufficiency (in all three countries) and rice self sufficiency in El Salvador and Nicaragua
from the late sixties onwards in the former and the early seventies onwards in the later. It
should be mentioned in passing that neither Guatemala nor Costa Rica experienced major
declines in cereal self sufficiency hence they are excluded from this analysis. The declines
in El Salvador and Nicaragua clearly reflect the growing environment of insurrection in the
countryside and the lack of any self sustained policy promoting the fortunes of domestic
basic grain production from the early 1970s onwards. While Honduras did not suffer from
civil insurrection, its agricultural sector has not received sufficient attention in the basic
grains sector to forestall a decline in overall cereal self sufficiency.
IV. Asia vs. Latin America
Finally this analysis is drawn to a close in Table 12 by comparing the production per
capita and· self sufficiency indicators for the 20 Latin American countries with important
agricultural sectors (set forth in Table 7 and 8) and 12 east, southeast, and south Asian
countries over the past two decades. Of interest here is that a far greater proportion of the
Asian countries recorded a more impressive record in production and self sufficiency
performance than the Latin American countries in the 1976-85 period. These results
highlight the greater concerns that these Asian countries have placed on the performance
of their agricultural sectors compared to Latin America. The peasant based rice cultures
in Asian societies have ranked higher in the policy priorities of their country's development
programs than have the cereal producing sectors in Latin America. The implicit taxation
of agricultural producers through adverse internal terms of trade has been far more
14
pronounced in Latin America. At the same time agricultural research has produced more
visible returns in the Asian setting through the green revolution in cereal products than it
has in Latin America. In summary the policy regimes in these Asian countries have been
more conducive to agricultural growth and growing cereal self sufficiency.
V. Summary and Conclusions
In this chapter the ·major trends in cereal and livestock self sufficiency was
documented in Latin America along with the consumption and production trends that
shaped these results. Livestock product self sufficiency fluctuated within a much narrower
band of near self sufficiency and remained relatively stable over time. Cereal self
sufficiency, on the other hand, fluctuated over a much wider interval and declined over time
for a substantial number of countries in the region, in spite of sporadic self sufficiency
programs for many of these countries.
In the decade of the 1960s most countries recorded their highest levels of self
sufficiency in cereal products. In the early 1970s the first marked decline in cereal self
sufficiency appeared. By the late 1970s this declining trend was accentuated. Finally during
the world recession years of the early 1980s a number of countries slightly reversed this
trend, however the overall levels of cereal self sufficiency by the mid-1980s were still
considerably below the levels established in the 1960s.
This declining trend in cereal self sufficiency is to be expected in a region
experiencing a growth in per capita incomes. This growth induces a proportionately greater
demand for income elastic livestock products over cereal products. This carries implications
15
for cereal self sufficiency. Since growth in the domestic supply of feed grains is usually
insufficient to service the expansion of the livestock sector to meet this demand, countries
typically have to import feed grains (primarily corn) to service the expansion of the livestock
sector to meet this income elastic demand for livestock products. The decade of the 1970s
registered continuing growth in per capita income in most Latin American countries. The
growth in imports was serviced through the stimulus of oil export earnings for oil exporting
countries like Mexico, Venezuela, and Ecuador, and through the supply of a growing volume
of foreign debt financing available for other countries up to 1981. The decline in oil exports
and the high level of foreign debt in the early 1980s changed this scenario with a
corresponding decline in per capita growth, cereal imports and, as a result, a slight rise of
local self sufficiency in cereal products was recorded.
Self sufficiency programs were launched in many Latin American countries precisely
at the time when their self sufficiency levels were declining in the 1970s. These programs
were largely a response to the high grain prices in world markets in 1974-5. Some, however,
had a longer history such as the import substitution programs for wheat in Mexico and
Brazil. Most self sufficiency drives in the 1970s, however, emphasized rice production. This
was a crop that was dominated by large scale producers (in contrast to Asia). Thus these
producers (and processors) could organize into a potent constituency to pressure their
governments to subsidize their generally high cost production for the local market. It is not
surprising, therefore, to note that rice self sufficiency suffered least during the era of
generalized decline in overall cereal self sufficiency. Also the fact that rice is not a widely
traded cereal in world markets (in contrast to co~n and wheat) created an additional
16
argument to focus self sufficiency efforts on this cereal product. However by the 1980s the
fiscal deficits supporting these producers had to be curtailed in a number of countries in the
face of macroeconomic stabilization programs.
Corn is the one cereal that received the least attention in agricultural research,
extension, and development programs. No doubt this was due to its being a classic small
producer, peasant activity which implied a weak political constituency in agricultural policy
circles. It was precisely corn that experienced the most severe decline in self sufficiency
throughout this period for practically all Latin American countries. The absence of any
productivity enhancing effort in this area (and the ready availability of corn products through
world trade) meant that the rise in demand for feed grains to service a growing livestock
sector could be easily serviced through imports, thereby lowering overall cereal self
sufficiency substantially. Also the agricultural export drives in the 1970s in such countries
as Brazil further exacerbated this decline with the shift of land from corn to soybean
production.
In summary, Latin America recorded a long run decline in cereal products in spite
of self sufficiency drives in selected cereal crop lines (especially rice). The momentum of
growth reinforced this decline through the rise of feed grain imports. While selective self
sufficiency drives may continue in limited areas, there is no reason to believe that the
generalized trend in recent decades won't continue in the future.
17
Table 1 Average Levels of Consumption, Production, and Self Sufficiency
in Cereal Products for the Aggregate of 24 Latin American Countries<1)
for Selected Periods 1961-85 (Metric tons per capita in Cereal Equivalent Units)
Periods
19{21-!255 1966-70 1211-75 1976-80 1281-85
Indicator~ fQr Cereal PrQdu't~ (1) (2) (3) (4) (5)
1. Consumption per Capita .21 .22 .23 .25 .26
2. Production per Capita .23 .23 .23 .23 .25
3. Self Sufficiency (%) 107 104 99 94 96
4. Food Consumption per .12 .12 .12 .13 .14 Capita
5. Feed Consumption per .06 .07 .08 .08 .09 Capita
Source: Derived from computer tapes of food balance data of the Food and Agricultural Organization (FAO) of the United Nations, annual series 1961-85, Rome, Italy.
(t) Note: The Latin American countries consist of all countries in South America, (except Suriname and French Guiana), Central America, Panama, Mexico, Cuba, the Dominican Republic, Haiti, Jamaica, and Trinidad-Tobago.
18
Table 2 Average Levels of Consumption, Production, and Self-Sufficiency
in Livestock Products for the Aggregate Total of 24 Latin American Countries for Selected Periods 1961-85
(Metric tons per Capita in Cereal Equivalent Units)
Indicators for Periods
Livestock Products 1961-65 1966-70 1971-75 1976-80
(1) (2) (3) (4)
1. Consumption per Capita .78 .79 .77 .84
2. Production per Capita .84 .86 .81 .88
3. Self Sufficiency (%) 108 108 106 104
Source: Same as Table 1.
1281-85
(5)
.79
.82
104
19
Table 3
Profile of Self Sufficiency in Cereal Products for the Total of 24 Latin American Countries for
Selected Periods (1961-85) by Level of Self Sufficiency(!)
Level of Periods and Number of Countries
Self Suffi~iency: (%) 1961-65 1966-70 1971-75 1976-80 1981-85
(1) (2) (3) (4) (5)
One or Above 5 3 2 2 2
.90 to .99
.80 to .89
.70 to .79
.60 to .69
Below .60
Total
Source:
Note: (l)
3 4 3 0 1
4 5 6 6 4
5 4 2 6 4
1 0 2 1 4
6 6 7 8 8
24 24 24 24 24
Same as Table 1.
A level of self sufficiency above one implies that the country is a net exporter of cereal products; an indicator less than one implies the country is a net importer.
Level of
Self Sufficien~ (%)
One or Above
.90 to .99
.80 to .89
Below .80
Total
20
Table 4
Profile of Self Sufficiency in Livestock Products for the Total of 24 Latin American Countries
for Selected Periods (1961-1985) by Level of Self Sufficiency<1)
Periods and Number of Countries
1961-65 1966-70 1971-75 1976-80
9 9 11 8
8 8 6 8
2 2 1 2
5 5 6 6
24 24 24 24
Sources: Same as Table 1.
Note: (l) See Note 1 to Table 3.
1981-8S
8
7
3
6
24
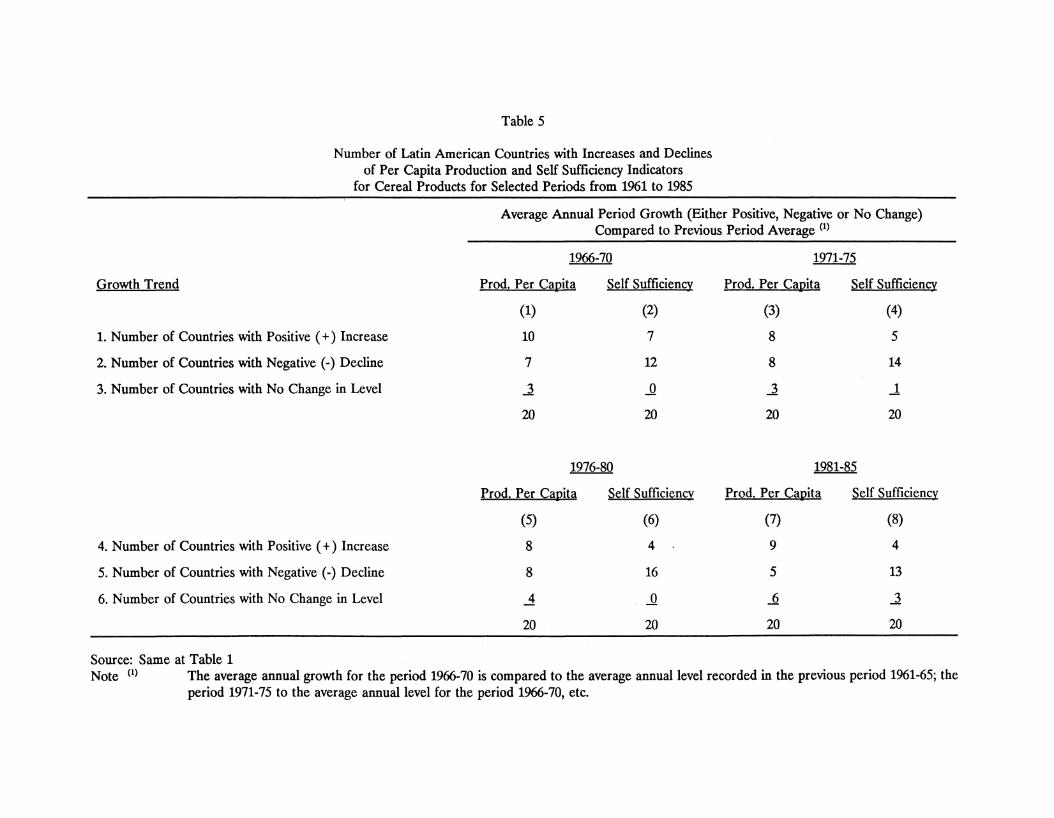
Table 5
Number of Latin American Countries with Increases and Declines of Per Capita Production and Self Sufficiency Indicators
for Cereal Products for Selected Periods from 1961 to 1985
Average Annual Period Growth (Either Positive, Negative or No Change) Compared to Previous Period Average (l)
1966-70 1971-75
Growth Trend Prod. Per Canita Self Sufficien~ Prod. Per ~anita Self Sufficiencv
(1) (2) (3) (4)
1. Number of Countries with Positive ( +) Increase 10 7 8 5
2. Number of Countries with Negative(-) Decline 7 12 8 14
3. Number of Countries with No Change in Level .1 ...Q .1 ...1
20 20 20 20
1976-80 1981-85
Prod. Per ~anita Self Sufficien~ Prod. Per Canita Self Sufficiencv
(5) (6) (7) (8)
4. Number of Countries with Positive ( +) Increase 8 4 9 4
5. Number of Countries with Negative (-) Decline 8 16 5 13
6. Number of Countries with No Change in Level ...4 ...Q _Q .1
20 20 20 20
Source: Same at Table 1 Note (l) The average annual growth for the period 1966-70 is compared to the average annual level recorded in the previous period 1961-65; the
period 1971-75 to the average annual level for the period 1966-70, etc.
22
Table 6
Selected Profile of Trends in Production Per Capita and Self Sufficiency in Cereal Products (in Cereal Equivelent Metric Tons)
for 20 Latin American Countries Over the Period 1961-85
I. Rising Production Per Capita with an Increase in Self Sufficiency
Argentina
Paraguay
Uruguay
II. Rising Production Per Capita with a Major Decline in Self Sufficiency
Dominican Republic
III. Relatively Constant Production Per Capita with a Modest Decline in Self Sufficiency
Bolivia
Brazil
Costa Rica
Guatemala
IV. Relatively Constant Production Per Capita with a Major Decline in Self Sufficiency
Columbia
El Salvador
Guyana
Peru
Mexico
Venezuela
V. Decline in Production Per Capita and a Major Decline in Self Sufficiency
Chile
Ecuador
Haiti
Honduras
Nicaragua
Panama
23
Table 7
Latin American Countries Experiencing a Long Run Modest Decline or an Increase in Self Sufficiency in Cereal Products
Over the Period 1961-85 (Listed by Rank Order in 1961-65)
Levels of Self Sufficiency
Countries 1261-65 1266-70 1971-75 1276-80 1281-85
(1) (2) (3) (4) (5)
A Modest Declines
Brazil .91 .93 .93 .89 .86
Guatemala .91 .88 .90 .84 .82
Bolivia .73 .72 .74 .70 .69
Costa Rica .68 .71 .65 .79 .70
B. In~reases
Argentina 1.51 1.85 1.93 1.92 2.50
Uruguay 1.26 1.05 1.07 1.25 1.51
Paraguay .76 .80 .89 .88 .93
Source: Same as Table 1.
24
Table 8
Latin American Countries Generally Experiencing a Major Long Run Decline in Self Sufficiency in Cereal Products Over the Period
1961-85 (Listed by Rank Order in 1961-65)
Levels of Self Sufficiency
Country 1961-6~ 1966-70 1971-75 1976-80 1281-85
(1) (2) (3) (4) (5)
Guyana 1.72 1.34 1.22 1.19 1.14
Mexico 1.07 1.06 .91 .86 .89
Honduras 1.07 .94 .85 .83 .81
Ecuador .99 .92 .82 .71 .71
Columbia .89 .87 .86 .85 .76
Haiti .89 .82 .74 .75 .72
Venezula .88 .95 .96 .88 .88
Chile .88 .83 .72 .70 .62
Nicaragua .87 .92 .81 .77 .73
Panama .82 .82 .74 .74 .72
El Salvador .76 .87 .84 .79 .68
Peru .72 .70 .68 .58 .58
Dominican Republic .72 .70 .58 .56 .56
Source: Same as Table 1.
25
Table 9 Consumption and Production Per Capita of Cereal Products and Self Sufficiency Indicators for Selected Cereal Products
for Oil Exporting Countries, 1961-85
Cereal Product
lndicators<1>
1. Mexico
a) Consumption/Capita
b) Production/Capita
c) Self Sufficiency(%)
Rice
Corn
Wheat
2. Venezuela
a) Consumption/Capita
b) Production/Capita
c) Self Sufficiency (%)
Rice
Corn
Wheat
3. Ecuador
a) Consumption/Capita
b) Production/Capita
c) Self Sufficiency(%)
Rice
Corn
Wheat
1961-66
(1)
.23
.25
110
106
118
.13
.08
143
92
0
.12
.12
120
100
56
Source: Same as Table 1
1966-70
(2)
.25
.26
101
106
110
.17
.10
125
94
0
.12
.11
103
100
59
Periods
1971-76
(3)
.25
.23
102
92
82
.16
.08
109
74
0
.12
.10
96
101
32
127(i-80
(4)
.25
.22
90
86
83
.20
.09
108
52
0
.13
.09
97
95
16
1981-85
(5)
.29
.26
99
88
87
.22
.08
92
35
0
.13
.09
94
80
11
Note: (t) Consumption and production indicators are expressed in metric tons of cereal equivalent units per person per year for the indicated periods.
26
Table 10 Consumption and Production Per Capita of Cereal Products and Self Sufficiency Indicators for Selected Cereal Products
for Selected Oil Importing Countries 1961~85
Cereal Product Periods
Indicators(!) 1961-65 1966-70 ~ 1976-80 1981-85
(1) (2) (3) (4) (5)
1. Colombia
a) Consumption/Capita .11 .11 .12 .13 .14
b) Production/Capita .10 .09 .10 .11 .10
c) Self Sufficiency(%)
Rice 99 100 107 107 95
Com 98 99 % 92 91
Wheat 39 28 14 9 11
2. Chile
a) Consumption/Capita .23 .27 .27 .26 .28
b) Production/Capita .21 .23 .19 .18 .17
c) Self Sufficiency(%)
Rice 85 63 57 92 84
Com 92 83 77 65 84
Wheat 85 83 63 57 42
3. Peru
a) Consumption/Capita .16 .16 .15 .16 .17
b) Production/Capita .12 .11 .11 .10 .10
c) Self Sufficiency(%)
Rice 91 92 80 79 90
Com 98 98 95 77 67
Wheat 26 20 17 13 9
4. Dominican Rel!ublic
a) Consumption/Capita .07 .08 .11 .14 .16
b) Production/Capita .05 .06 .06 .08 .09
c) Self Sufficiency(%)
Rice 87 98 84 87 94
Com 114 84 57 34 22
Wheat 0 0 0 0 0
Source: Same as Table 1. Note: (1) Consumption and production indicators are expressed in metric tons of cereal equivalent units per person per year
for the indicated periods.
27
Table 11
Consumption and Production Per Capita of Cereal Products and Self Sufficiency Indicators for Selected Cereal Products
for Selected Central American Countries, 1961-85
Cereal Product
Indicators<1>
1. Honduras
a) Consumption/Capita
b) Production/Capita
c) Self Sufficiency(%)
Rice
Corn
Wheat
2. Nicaragua
a) Consumption/Capita
b) Production/Capita
c) Self Sufficiency(%)
Rice
Corn
Wheat
3. El Salvador
a) Consumption/Capita
b) Production/Capita
c) Self Sufficiency(%)
Rice
Corn
Wheat
1961-66
(1)
.14
.15
82
121
3
.14
.12
95
101
0
.11
.08
109
87
0
Source: Same as Table 1
1966-70
(2)
.16
.15
55
110
1
.16
.15
99
107
0
.12
.10
150
99
0
Periods
1971-75
(3)
.16
.13
84
98
1
.15
.12
111
88
0
.13
.11
104
99
0
1976-80
(4)
.16
.13
77
95
1
.14
.11
86
89
0
.15
.11
90
96
0
1981-85
(5)
.16
.13
85
94
0
.17
.12
88
79
0
.15
.10
69
84
0
Note: (l) Consumption and production indicators are expressed in cereal equivalent metric tons per person per year for the indicated periods.
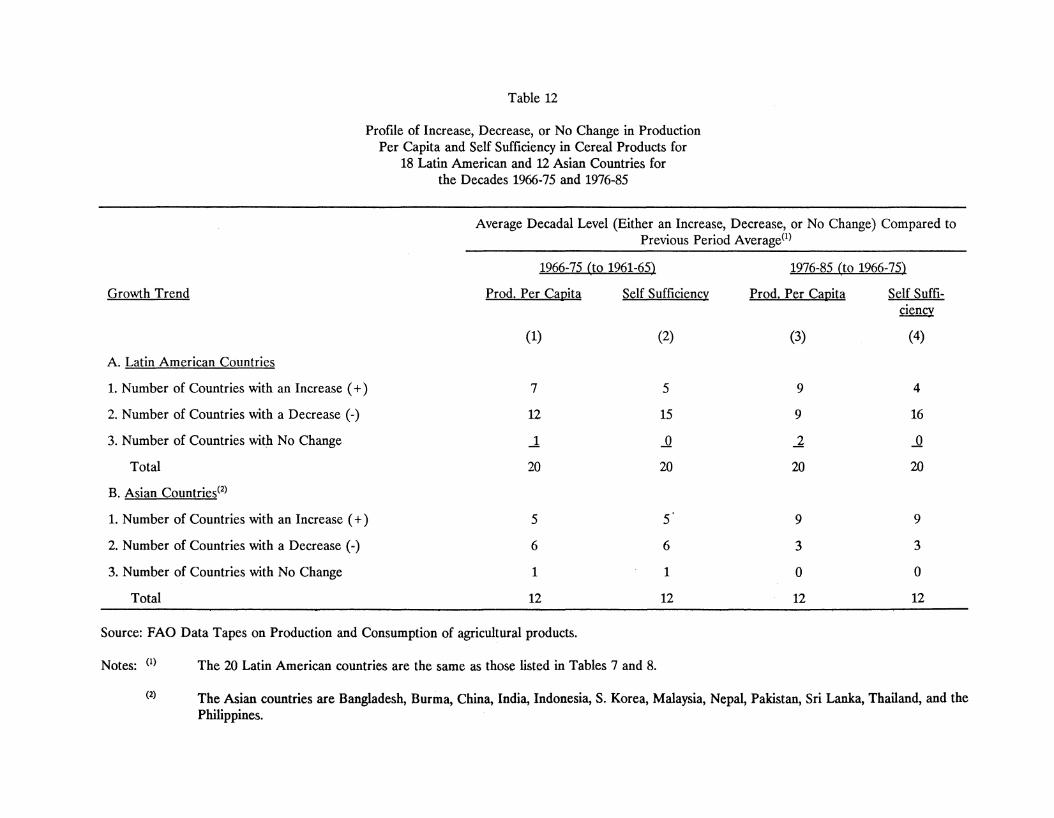
Table 12
Profile of Increase, Decrease, or No Change in Production Per Capita and Self Sufficiency in Cereal Products for
18 Latin American and 12 Asian Countries for the Decades 1966-75 and 1976-85
Average Decadal Level (Either an Increase, Decrease, or No Change) Compared to Previous Period Average<'>
1966-75 (to 1961-65)
Growth Trend Prod. Per Caoita Self Sufficiencv
A. Latin American Countries
1. Number of Countries with an Increase ( +)
2. Number of Countries with a Decrease(-)
3. Number of Countries wit]l No Change
Total
B. Asian Countries<2>
1. Number of Countries with an Increase ( +)
2. Number of Countries with a Decrease (-)
3. Number of Countries with No Change
Total
(1)
7
12
.1
20
5
6
1
12
Source: FAO Data Tapes on Production and Consumption of agricultural products.
Notes: <1> The 20 Latin American countries are the same as those listed in Tables 7 and 8.
(2)
5
15
_Q
20
5.
6
1
12
1976-85 (to 1966-75)
Prod. Per Ca11ita Self Suffi-ciency
(3) (4)
9 4
9 16
.2 _Q
20 20
9 9
3 3
0 0
12 12
(2) The Asian countries are Bangladesh, Burma, China, India, Indonesia, S. Korea, Malaysia, Nepal, Pakistan, Sri Lanka, Thailand, and the Philippines.
29
BIBLIOGRAPHY
AAEA, The Argentine Agricultural Economy: An Analysis on its Evolution and Present Situation, Asociacion Argentina de Economia Agraria, Buenos Aires, 1988.
Corrales, Jorge, Politicas de Precios y de Subsidios en Costa Rica, Academia de Centroamerica, San Jose, 1985.
Food and Agricultural Organization of the United Nations, Food Balance Data (computer tapes), Rome, Italy, 1985.
Graham, Douglas H., et al., "Thirty Years of Agricultural Growth in Brazil: Crop Performance, Regional Profile, and Recent Policy Review," Economic Development and Cultural Change, Vol. 36, No. 1 (October 1987), 1-34.
Heath, John Richard, "Current Contradictions in Mexican Food Policy," Politics in Mexico, G. Philip (ed.), Croom Helm, London, 1985.
Heath, John Richard, "An Overview of the Mexican Agricultural Crisis," The Mexican Economy, G. Philip (ed.), Croom Helm, London, 1989.
de Janvry, Alain de, The Agrarian Question and Reformism in Latin America, Johns Hopkins University Press, 1981.
Jarvis, Lovell S., Chilean Agriculture Under Military Rule: From Reform to Reaction 1973-1980, Institute of International Studies, University of California, Berkeley, 1985.
Rask, Norman, "Dynamics of Self Sufficiency and Income Growth," (This Volume).
Senaver, Benjamin, "Foodgrain Price and Trade Policy in the Dominican Republic,'' Food Policy, November 1983, 313-325.
Spalding, Rose, "Structural Barriers to Food Programming: An Analysis of the Mexican Food System," World Development, Vol. 13, No. 12 (December 1988), 1249-1263.
World Bank, Brazil: A Review of Agricultural Policies, A World Bank Country Study, The World Bank, Washington, D.C., 1982.
Yates, P. Lamartine, Mexico's Agricultural Dilemma, University of Arizona Press, Tucson, 1981.