Embed Size (px)
Citation preview

Agricultural production in household plots totaled 7185 thousand somoni which is by 15,2 % more compared to the respective period of 2012, including: crop production 6507 thousand somoni or 14,0% increase and livestock production 678 thousand somoni or 29,8% increase.During January – December 2013 the production totaled: grains – 619 tons, potato – 3039 tons, vegetables – 114 tons, fruits – 600 tons, meat – 24 tons, milk - 15 tons and honey – 5,1 tons.
Fish-farming Fish-farming production volume over the January-December 2013 composed 27,3 million somoni, or increased by 54,3 % compared to the same period of the last year. In January-December 2013, the fish catch in the whole country estimated as 1723 tons.
.
FOOD SECURITY AND AGRICULTURE HIGHLIGHTS
Project: Support to Strengthening of the National Food Security Information System
January 2014
OVERALL SOCIO-ECONOMIC SITUATION
Poverty level in 2013 (%)
Operational GDP, mln. Somoni (January-December)
Total population as of 1 October 2013, (m)
Foreign trade turnover, (January-December)($m)
Foreign trade balance, (January-Decemberr) ($ m)
Share of food products in export (%)
Share of food products in import (%)
Consumer Price Index (relative to the previous month)
Unemployment by the end of November 2013 ('000)
Average monthly wage per employee in November 2013 ( somoni)
Average monthly wage per employee in November (agriculture, forestry
and hunting sector) (somoni)
Gross agricultural output in over January-December, (m somoni)
Growth of gross agricultural output compared to January-December2012 (%)
-crop production (m somoni)
Growth compared to January-December 2012 (%)
-livestock production (m somoni)
Growth compared to January-December 2012 (%)
Fish-farming, (m somoni)
Growth compared to January-December 2012 (%)
December 2013
35,6
40524,5
8,1
5284,7
-2957,9
4,7
19,4
100,3
55,7
748,63
209,43
16756,6
7,6
11502,5
7,6
5254,1
7,5
27,3
54,3
FOOD PRICE TRENDS AND CONSUMER PRICES
(Source: Agency on Statistics under the President of the Republic of Tajikistan)
(according to the data of the Agency on Statistics under the President of the Republic of Tajikistan)
The Consumer Price Index in December 2013 composed 100,3 %, including food commodities – 100,4 %, non-food commodities – 100 % and fee-based services for population – 100,1 %.
In 2013 compared to 2012 year, the consumer price index comprised 103,7 %, including food commodities – 103,2 %, non-food commodities – 100,0 % and fee-based services for population - 100,8%.
In December 2013 the inflation rate in consumer prices was 0,3% which was caused by adjustment in prices for food commodities by 0,4%.
The inflation rate over the 2013 was estimated to be 3,7%.
Price indexes for food commodities, non-food commodities and fee-based services (at the end of the month, in % to December 2011)
Prices for food commodities (including alcohol) increased by 0,4 % in December 2013. In December compared to November 2013 prices increased for the following food commodities: potato – 6,8%, onion – 5,8% and vegetables – 1,5%. Along with the mentioned, during the past month prices fell for: eggs – 5,8%, carrot – 4,9%, rice – 2,5%, cabbage – 1,2% and wheat flour of 1st grade – 1,0%.
In 2013 prices mostly increased for the following food commodities: carrot -43%, milk – 22,2%, eggs – 11,2%, potato – 10,2%, rice – 9,4%, pasta – 7,8%, cabbage – 4,9%, cottonseed oil – 4,3%, lamb – 3,1%, sugar -2,1%, and beef – 1,9%. Along with this, prices fell for onion by 21,1% and wheat flour of 1st grade by 11,7%.
1
This newsletter is issued by the Ministry of Agriculture, Ministry of Economic Development and Trade, Agency on Statistics under the President of the Republic of Tajikistan and the State Administration for Hydrometeorology with the support of the FAO project " Support to Strengthening of the National Food Security Information System", financed by the European Union.
The contents of this publication are the sole responsibility of authors and can no way be taken to reflect the views of the European Union or the United Nations.
4
43
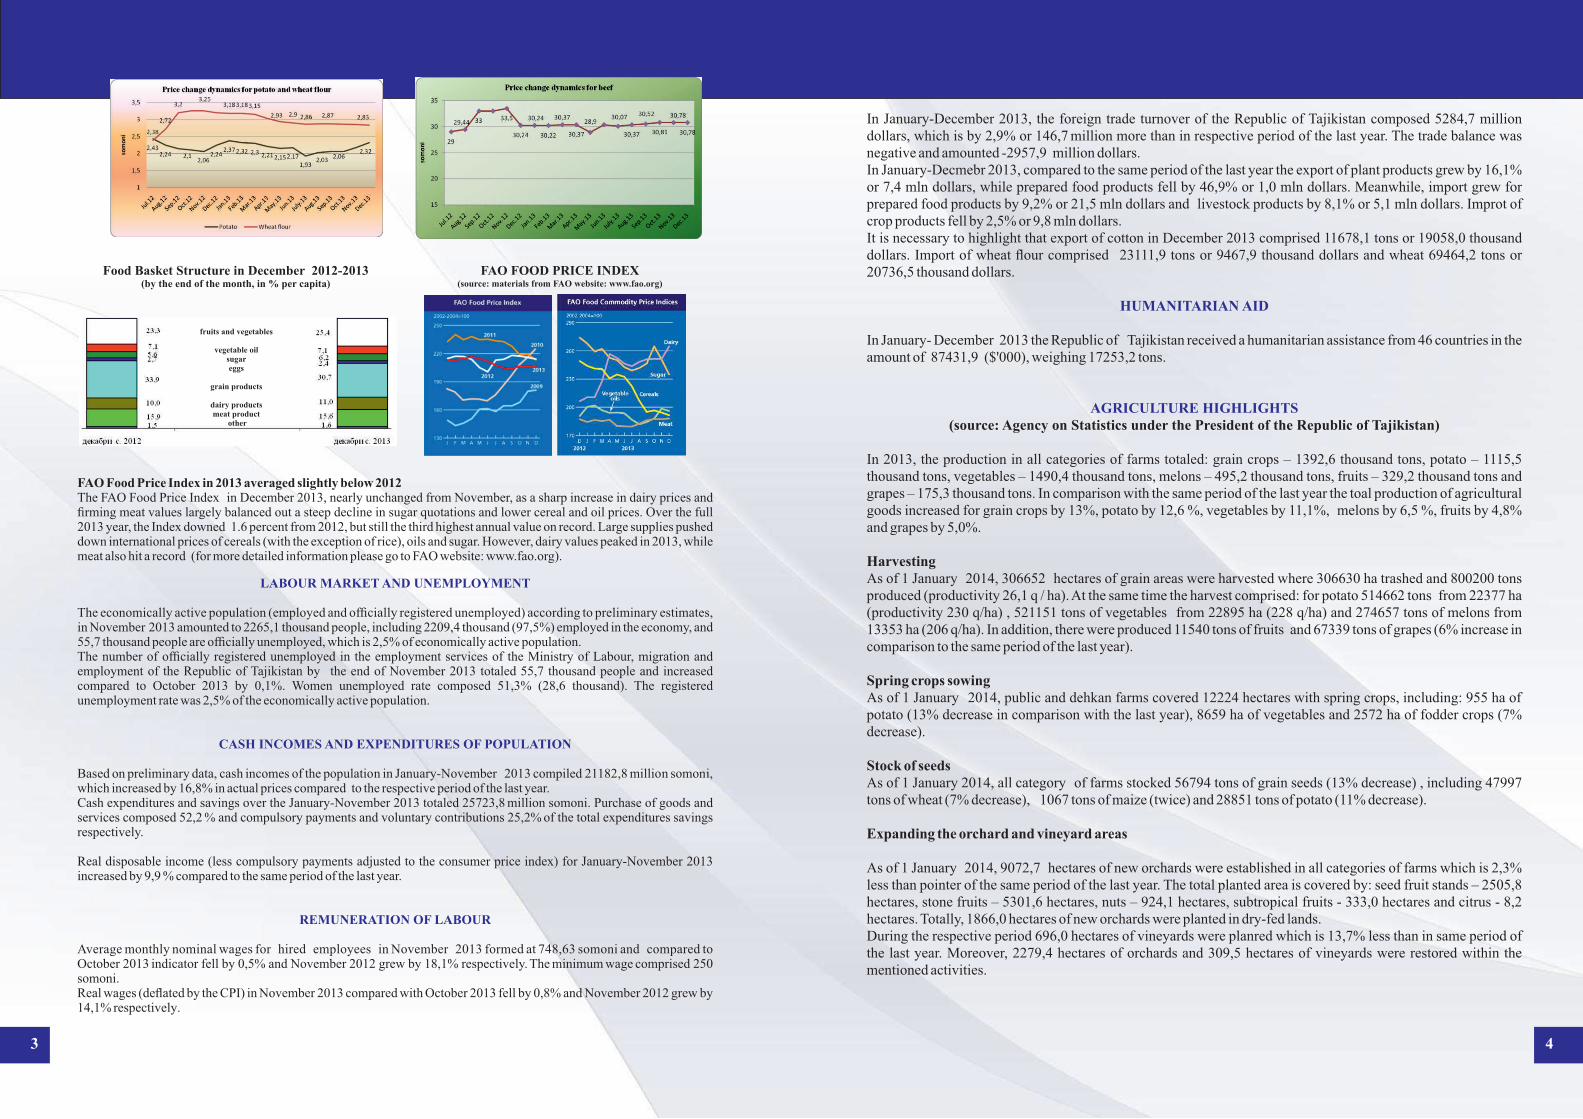
Food Basket Structure in December 2012-2013(by the end of the month, in % per capita)
FAO FOOD PRICE INDEX
fruits and vegetables
vegetable oilsugareggs
grain products
dairy productsmeat product
other
FAO Food Price Index in 2013 averaged slightly below 2012The FAO Food Price Index in December 2013, nearly unchanged from November, as a sharp increase in dairy prices and firming meat values largely balanced out a steep decline in sugar quotations and lower cereal and oil prices. Over the full 2013 year, the Index downed 1.6 percent from 2012, but still the third highest annual value on record. Large supplies pushed down international prices of cereals (with the exception of rice), oils and sugar. However, dairy values peaked in 2013, while meat also hit a record (for more detailed information please go to FAO website: ).www.fao.org
(source: materials from FAO website: )www.fao.org
LABOUR MARKET AND UNEMPLOYMENT
The economically active population (employed and officially registered unemployed) according to preliminary estimates, in November 2013 amounted to 2265,1 thousand people, including 2209,4 thousand (97,5%) employed in the economy, and 55,7 thousand people are officially unemployed, which is 2,5% of economically active population.The number of officially registered unemployed in the employment services of the Ministry of Labour, migration and employment of the Republic of Tajikistan by the end of November 2013 totaled 55,7 thousand people and increased compared to October 2013 by 0,1%. Women unemployed rate composed 51,3% (28,6 thousand). The registered unemployment rate was 2,5% of the economically active population.
CASH INCOMES AND EXPENDITURES OF POPULATION
Based on preliminary data, cash incomes of the population in January-November 2013 compiled 21182,8 million somoni, which increased by 16,8% in actual prices compared to the respective period of the last year. Cash expenditures and savings over the January-November 2013 totaled 25723,8 million somoni. Purchase of goods and services composed 52,2 % and compulsory payments and voluntary contributions 25,2% of the total expenditures savings respectively.
Real disposable income (less compulsory payments adjusted to the consumer price index) for January-November 2013 increased by 9,9 % compared to the same period of the last year.
REMUNERATION OF LABOUR
Average monthly nominal wages for hired employees in November 2013 formed at 748,63 somoni and compared to October 2013 indicator fell by 0,5% and November 2012 grew by 18,1% respectively. The minimum wage comprised 250 somoni.Real wages (deflated by the CPI) in November 2013 compared with October 2013 fell by 0,8% and November 2012 grew by 14,1% respectively.
FOREIGN ECONOMIC ACTIVITY
In January-December 2013, the foreign trade turnover of the Republic of Tajikistan composed 5284,7 million dollars, which is by 2,9% or 146,7 million more than in respective period of the last year. The trade balance was negative and amounted -2957,9 million dollars. In January-Decmebr 2013, compared to the same period of the last year the export of plant products grew by 16,1% or 7,4 mln dollars, while prepared food products fell by 46,9% or 1,0 mln dollars. Meanwhile, import grew for prepared food products by 9,2% or 21,5 mln dollars and livestock products by 8,1% or 5,1 mln dollars. Improt of crop products fell by 2,5% or 9,8 mln dollars. It is necessary to highlight that export of cotton in December 2013 comprised 11678,1 tons or 19058,0 thousand dollars. Import of wheat flour comprised 23111,9 tons or 9467,9 thousand dollars and wheat 69464,2 tons or 20736,5 thousand dollars.
HUMANITARIAN AID
In January- December 2013 the Republic of Tajikistan received a humanitarian assistance from 46 countries in the amount of 87431,9 ($'000), weighing 17253,2 tons.
AGRICULTURE HIGHLIGHTS(source: Agency on Statistics under the President of the Republic of Tajikistan)
In 2013, the production in all categories of farms totaled: grain crops – 1392,6 thousand tons, potato – 1115,5 thousand tons, vegetables – 1490,4 thousand tons, melons – 495,2 thousand tons, fruits – 329,2 thousand tons and grapes – 175,3 thousand tons. In comparison with the same period of the last year the toal production of agricultural goods increased for grain crops by 13%, potato by 12,6 %, vegetables by 11,1%, melons by 6,5 %, fruits by 4,8% and grapes by 5,0%.
Harvesting As of 1 January 2014, 306652 hectares of grain areas were harvested where 306630 ha trashed and 800200 tons produced (productivity 26,1 q / ha). At the same time the harvest comprised: for potato 514662 tons from 22377 ha (productivity 230 q/ha) , 521151 tons of vegetables from 22895 ha (228 q/ha) and 274657 tons of melons from 13353 ha (206 q/ha). In addition, there were produced 11540 tons of fruits and 67339 tons of grapes (6% increase in comparison to the same period of the last year).
Spring crops sowing As of 1 January 2014, public and dehkan farms covered 12224 hectares with spring crops, including: 955 ha of potato (13% decrease in comparison with the last year), 8659 ha of vegetables and 2572 ha of fodder crops (7% decrease).
Stock of seeds As of 1 January 2014, all category of farms stocked 56794 tons of grain seeds (13% decrease) , including 47997 tons of wheat (7% decrease), 1067 tons of maize (twice) and 28851 tons of potato (11% decrease).
Expanding the orchard and vineyard areas
As of 1 January 2014, 9072,7 hectares of new orchards were established in all categories of farms which is 2,3% less than pointer of the same period of the last year. The total planted area is covered by: seed fruit stands – 2505,8 hectares, stone fruits – 5301,6 hectares, nuts – 924,1 hectares, subtropical fruits - 333,0 hectares and citrus - 8,2 hectares. Totally, 1866,0 hectares of new orchards were planted in dry-fed lands. During the respective period 696,0 hectares of vineyards were planred which is 13,7% less than in same period of the last year. Moreover, 2279,4 hectares of orchards and 309,5 hectares of vineyards were restored within the mentioned activities.