Embed Size (px)
Citation preview
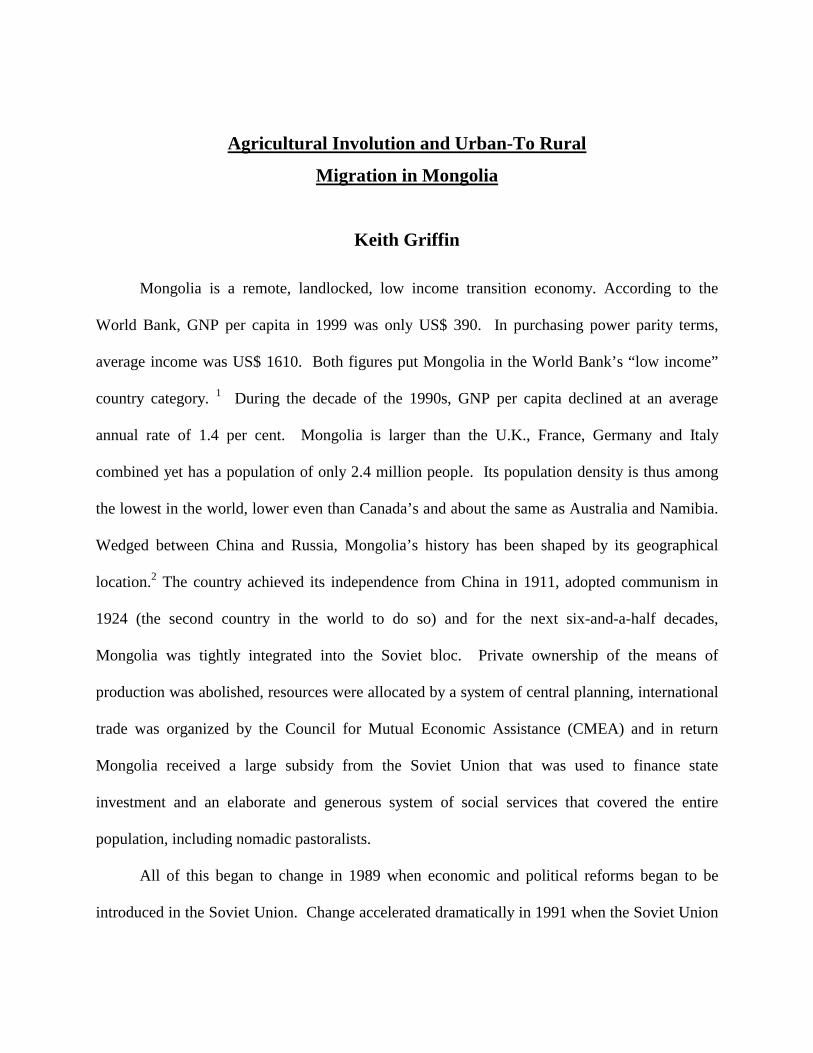
Agricultural Involution and Urban-To Rural
Migration in Mongolia
Keith Griffin
Mongolia is a remote, landlocked, low income transition economy. According to the
World Bank, GNP per capita in 1999 was only US$ 390. In purchasing power parity terms,
average income was US$ 1610. Both figures put Mongolia in the World Bank’s “low income”
country category. 1 During the decade of the 1990s, GNP per capita declined at an average
annual rate of 1.4 per cent. Mongolia is larger than the U.K., France, Germany and Italy
combined yet has a population of only 2.4 million people. Its population density is thus among
the lowest in the world, lower even than Canada’s and about the same as Australia and Namibia.
Wedged between China and Russia, Mongolia’s history has been shaped by its geographical
location.2 The country achieved its independence from China in 1911, adopted communism in
1924 (the second country in the world to do so) and for the next six-and-a-half decades,
Mongolia was tightly integrated into the Soviet bloc. Private ownership of the means of
production was abolished, resources were allocated by a system of central planning, international
trade was organized by the Council for Mutual Economic Assistance (CMEA) and in return
Mongolia received a large subsidy from the Soviet Union that was used to finance state
investment and an elaborate and generous system of social services that covered the entire
population, including nomadic pastoralists.
All of this began to change in 1989 when economic and political reforms began to be
introduced in the Soviet Union. Change accelerated dramatically in 1991 when the Soviet Union
2
disintegrated. Mongolia’s subsidy was abruptly terminated, Soviet technical assistance was
withdrawn, the CMEA collapsed, and Mongolia lost her export markets and her sources of
imports. In response to the crisis, and with the strong encouragement of the West, Mongolia
decided to follow the example of Russia and adopt a strategy of “shock therapy” to effect a
transition from central planning to a market oriented economic system. Perhaps for historical
reasons, it chose to ignore the successful experience of China with “sequential reform”, begun
more than ten years earlier in late 1978. In practice “shock therapy” in Mongolia has consisted
of four elements, namely, macroeconomic stabilization, rapid price liberalization, wholesale
privatization of state and collectively owned assets and non-intervention by government in the
economy. Similar policies have been pursued in Latin America and elsewhere under the label of
“structural adjustment” and “liberalization”.
This essay contains an analysis of the effects of shock therapy on the agricultural sector of
Mongolia. Agriculture in Mongolia consists almost entirely of nomadic livestock herding;3 crop
cultivation accounts for about ten per cent of the sector’s output and is declining. Herding, on
the other hand, accounts for a rising share of total output and employment in the country. The
expansion of the livestock sector is misleading, however, because it has been accompanied by
declining productivity of labour, rising poverty and a deterioration of the stock of public goods.
Some of the Latin American countries with which Albert Berry is familiar experienced similar
hardships in the “lost decade” of the 1980s, but the extent of decline in Mongolia is exceptional.
The purpose of shock therapy in Mongolia was not only to bring about systemic change
but also to initiate a process of long term economic development similar to that enjoyed by other
countries in East Asia. Economic development is of course accompanied by structural change.
A consistent pattern, observed for many decades and in many countries, is that as development
3
proceeds the proportion of the population residing in urban areas rises and the proportion in rural
areas falls. Similarly, the share of agriculture in GDP declines while the shares of industry and
services rise. Finally, the proportion of the labour force engaged in agricultural activities falls
even faster than agriculture’s share in GDP, and hence the productivity of labour in agriculture
tends to rise quite rapidly. Indeed, eventually the productivity of labour becomes roughly equal
in all sectors. 4
None of these patterns can be observed in Mongolia. Ever since the country embarked on
a transition to a market guided economy, the normal patterns of development have been reversed.
In fact, one could argue that from the perspective of structural change, Mongolia has entered into
a process of underdevelopment. During the first decade of shock therapy the country became
less urban and more rural. Throughout the entire transition period the composition of output has
shifted away from industry and the relative importance of the agricultural sector has increased
dramatically. Mongolia is becoming de-industrialized. Within agriculture, the absorption of
labour has increased and the productivity of labour has declined. A process of agricultural
involution has occurred.5
Urban–to–rural migration
The collapse of industry soon after the introduction of shock therapy caused thousands of
people to lose their jobs in manufacturing, construction and public administration. The number
of unemployed persons (whether officially registered or not) rose sharply. 6 Most displaced
workers, however, did not remain unemployed for long. Because of the lack of an adequate
social safety net, they were forced to develop a survival strategy to sustain a livelihood, even
though this implied a much lower standard of living and increased economic insecurity.
4
At the beginning of the transition Mongolia was predominantly an urban country: in 1989
the urban population constituted 57 per cent of the total. The economic crisis however induced
many urban people to move to the countryside and retreat into herding. Labour proved to be
highly mobile across space and occupations and the survival strategy adopted by many people
was subsistence livestock. This led to very rapid urban–to–rural migration during the years when
shock therapy was most vigorously pursued. By 1998 the proportion of the population living in
urban areas had fallen to 49.6 per cent. That is, between 1989 and 1998 the share of the urban
population in the total fell by 13 per cent. The data for each year are presented in Table 1.
In 1996 the rural population exceeded the urban and Mongolia ceased, even if only
temporarily, to be a predominantly urban country. Indeed the process of ruralization continued
for another two years and by 1998 the rural population accounted for 50.4 per cent of the total.
Between 1989 and 1998 the share of the rural population in the total population rose by a
remarkable 17.2 per cent. Mongolia experienced in those ten years a massive relocation of the
population and a pace of urban–to–rural migration that is perhaps unprecedented.
5
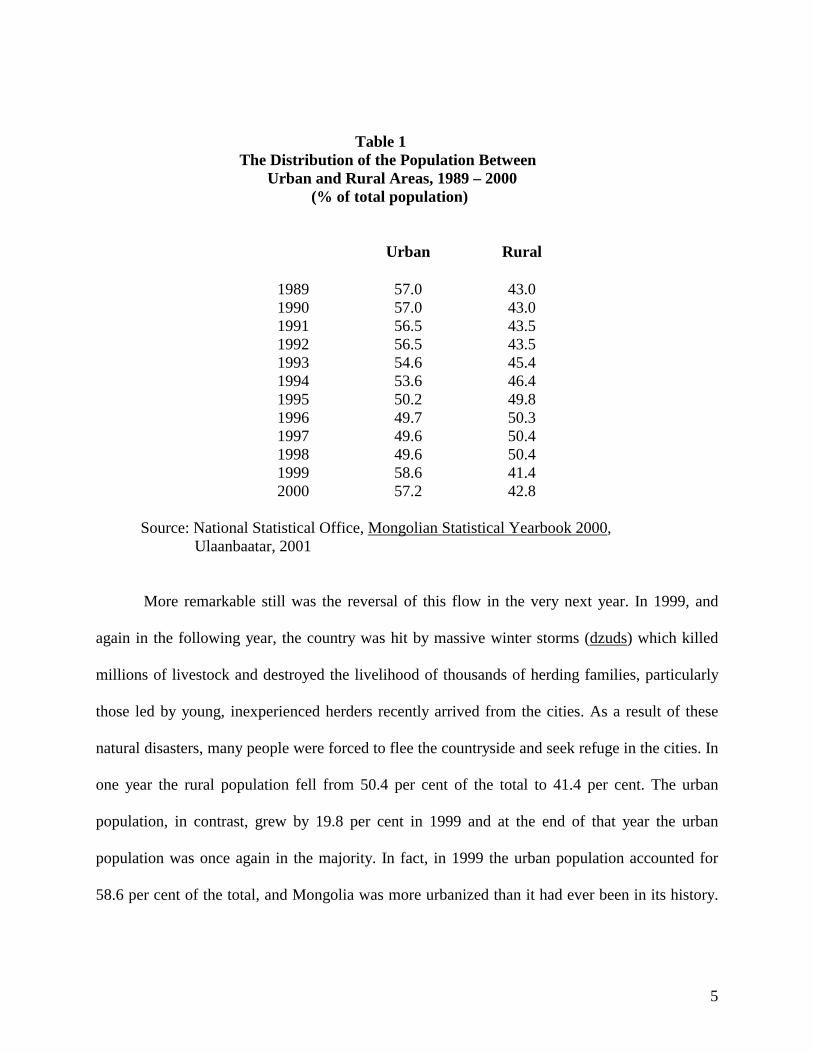
Table 1
The Distribution of the Population Between Urban and Rural Areas, 1989 – 2000
(% of total population)
Urban Rural
1989 57.0 43.0 1990 57.0 43.0 1991 56.5 43.5 1992 56.5 43.5 1993 54.6 45.4 1994 53.6 46.4 1995 50.2 49.8 1996 49.7 50.3 1997 49.6 50.4 1998 49.6 50.4 1999 58.6 41.4 2000 57.2 42.8
Source: National Statistical Office, Mongolian Statistical Yearbook 2000,
Ulaanbaatar, 2001
More remarkable still was the reversal of this flow in the very next year. In 1999, and
again in the following year, the country was hit by massive winter storms (dzuds) which killed
millions of livestock and destroyed the livelihood of thousands of herding families, particularly
those led by young, inexperienced herders recently arrived from the cities. As a result of these
natural disasters, many people were forced to flee the countryside and seek refuge in the cities. In
one year the rural population fell from 50.4 per cent of the total to 41.4 per cent. The urban
population, in contrast, grew by 19.8 per cent in 1999 and at the end of that year the urban
population was once again in the majority. In fact, in 1999 the urban population accounted for
58.6 per cent of the total, and Mongolia was more urbanized than it had ever been in its history.
6
The share of the urban population in 2000 fell slightly to 57.2 per cent, but Mongolia continued
to be a predominantly urban country.
These rapid changes in the degree of urbanization reflect the geographical mobility of the
population, a mobility which perhaps is not surprising in a country with a nomadic past and a
large herding population. Changes in the degree of urbanization also reflect, however, the
absence of sharp boundaries in Mongolia between the urban and the rural. Movements of
population into or away from provincial capitals would, in other countries, signify major changes
in ways of life, e.g., the transformation of the peasantry into an urban industrial proletariat in
Europe. In Mongolia, however, the provincial capitals (aimag centers) are mostly small rural
towns with populations which vary between 15,000 and 25,000 people. Small fluctuations in the
population of these small towns can lead to large apparent changes in the degree of urbanization.
In fact many urban residents live in gers (round felt tents) and if one wishes to leave town and
return to the countryside, all one need do is disassemble the ger, get on one’s horse and ride to
the nearest steppe.
It is instructive to compare changes in the population of Ulaanbaatar (the national capital)
with changes in several aimag centers (provincial capitals) between 1990 (the previous peak of
urbanization) and 1998 (the peak of ruralization). This is done in Table 2 below. Ulaanbaatar
never ceased to grow and between 1990 and 1998 the population of the capital increased by more
than 20 per cent. In eight aimag centers (listed in the Table) the population declined absolutely,
by as little as 3.6 per cent in Altai and by as much as 35.5 per cent in Mandalgovi. In the
remaining aimags (not listed in the Table) population actually increased in absolute terms. None
the less, it would be easy to conclude from the data that Mongolia during this period was
becoming polarized between a rapidly growing rural population and a large and growing capital
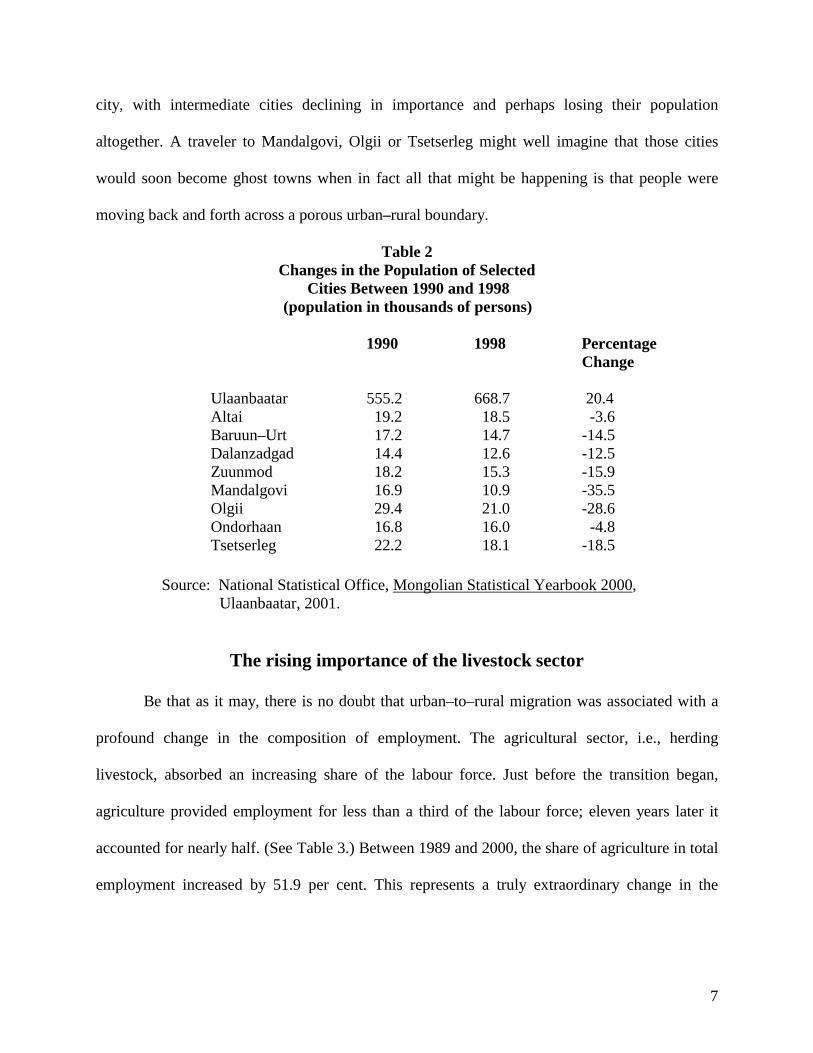
7
city, with intermediate cities declining in importance and perhaps losing their population
altogether. A traveler to Mandalgovi, Olgii or Tsetserleg might well imagine that those cities
would soon become ghost towns when in fact all that might be happening is that people were
moving back and forth across a porous urban–rural boundary.
Table 2 Changes in the Population of Selected
Cities Between 1990 and 1998 (population in thousands of persons)
1990 1998 Percentage
Change
Ulaanbaatar 555.2 668.7 20.4 Altai 19.2 18.5 -3.6 Baruun–Urt 17.2 14.7 -14.5 Dalanzadgad 14.4 12.6 -12.5 Zuunmod 18.2 15.3 -15.9 Mandalgovi 16.9 10.9 -35.5 Olgii 29.4 21.0 -28.6 Ondorhaan 16.8 16.0 -4.8 Tsetserleg 22.2 18.1 -18.5
Source: National Statistical Office, Mongolian Statistical Yearbook 2000,
Ulaanbaatar, 2001.
The rising importance of the livestock sector
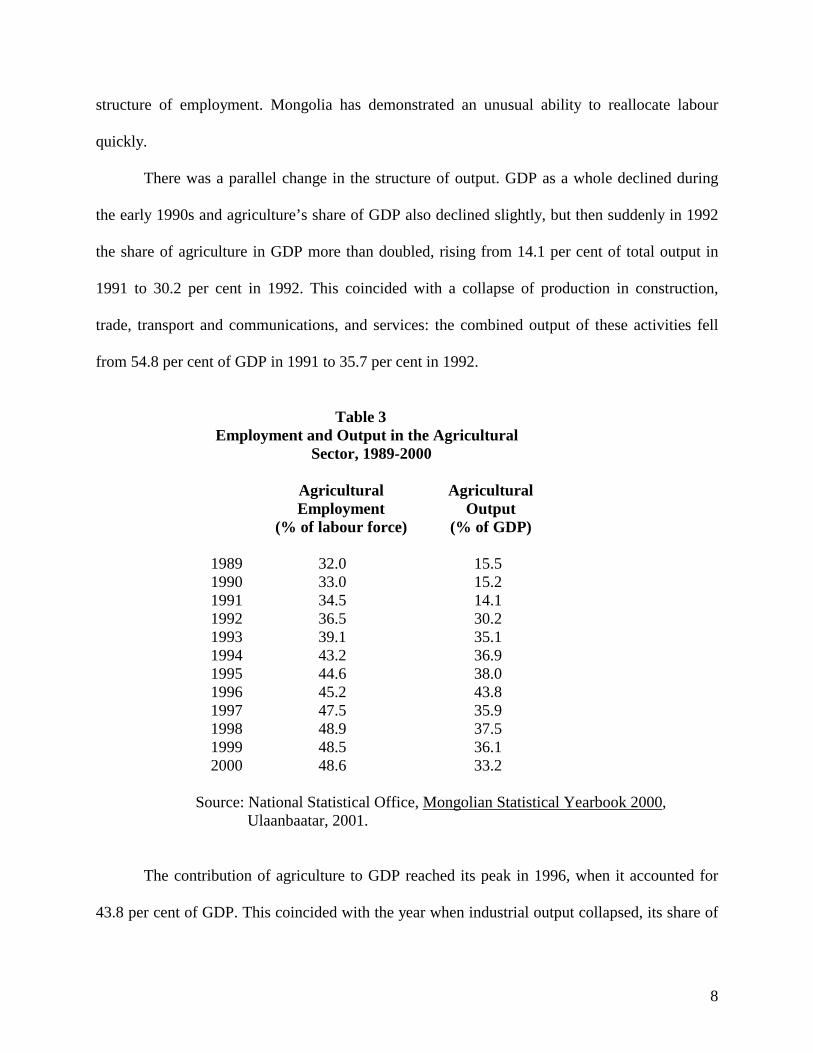
Be that as it may, there is no doubt that urban–to–rural migration was associated with a
profound change in the composition of employment. The agricultural sector, i.e., herding
livestock, absorbed an increasing share of the labour force. Just before the transition began,
agriculture provided employment for less than a third of the labour force; eleven years later it
accounted for nearly half. (See Table 3.) Between 1989 and 2000, the share of agriculture in total
employment increased by 51.9 per cent. This represents a truly extraordinary change in the
8
structure of employment. Mongolia has demonstrated an unusual ability to reallocate labour
quickly.
There was a parallel change in the structure of output. GDP as a whole declined during
the early 1990s and agriculture’s share of GDP also declined slightly, but then suddenly in 1992
the share of agriculture in GDP more than doubled, rising from 14.1 per cent of total output in
1991 to 30.2 per cent in 1992. This coincided with a collapse of production in construction,
trade, transport and communications, and services: the combined output of these activities fell
from 54.8 per cent of GDP in 1991 to 35.7 per cent in 1992.
Table 3
Employment and Output in the Agricultural Sector, 1989-2000
Agricultural
Employment (% of labour force)
Agricultural Output
(% of GDP)
1989 32.0 15.5 1990 33.0 15.2 1991 34.5 14.1 1992 36.5 30.2 1993 39.1 35.1 1994 43.2 36.9 1995 44.6 38.0 1996 45.2 43.8 1997 47.5 35.9 1998 48.9 37.5 1999 48.5 36.1 2000 48.6 33.2
Source: National Statistical Office, Mongolian Statistical Yearbook 2000,
Ulaanbaatar, 2001.
The contribution of agriculture to GDP reached its peak in 1996, when it accounted for
43.8 per cent of GDP. This coincided with the year when industrial output collapsed, its share of
9
GDP falling from 32.4 per cent in 1995 to 20.6 per cent in 1996. Throughout the transition
period, the agricultural sector provided an element of relative stability. Within the agricultural
sector, livestock (always dominant) became increasingly important. In 1989, livestock
production accounted for 70.1 per cent of total agricultural output; by 1999, livestock accounted
for 90 per cent of agricultural output. By then agriculture was by far the largest sector in the
economy and within agriculture there was almost complete specialization on livestock.
One might have hoped that the increased specialization on livestock within the economy
as a whole would have been accompanied by an increase in the productivity of labour in the
agricultural sector. Unfortunately, there are not sufficient data to make accurate calculations of
labour productivity in livestock activities or even in the agricultural sector as a whole. Rough
estimates suggest, however, that between 1992 and 1999 there was a significant decline in the
productivity of labour. There may have been some tendency for productivity to rise from 1992 to
1996 (the year when agricultural output as a share of GDP reached its peak), but thereafter
productivity declined. That is, considering the period as a whole, labour productivity declined,
probably substantially. The sector absorbed labour like a sponge and was able to use the
additional inputs of labour to increase output, but it was not able to lift output per herder above a
subsistence level. In effect, agriculture became a sink for poverty and growth exhibited the
symptoms of agricultural involution. That is, the movement into nomadic herding should be seen
as part of a household survival strategy, not as part of a national development strategy.
10
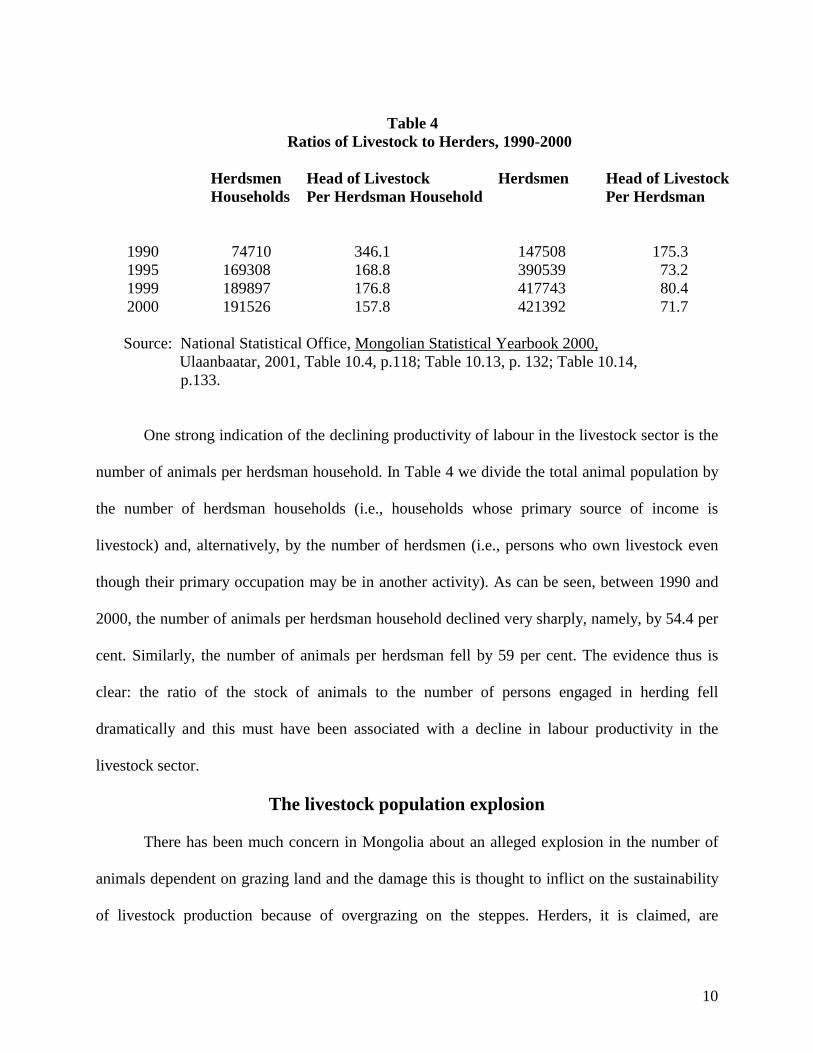
Table 4
Ratios of Livestock to Herders, 1990-2000
Herdsmen Head of Livestock Herdsmen Head of Livestock Households Per Herdsman Household Per Herdsman
1990 74710 346.1 147508 175.3 1995 169308 168.8 390539 73.2 1999 189897 176.8 417743 80.4 2000 191526 157.8 421392 71.7
Source: National Statistical Office, Mongolian Statistical Yearbook 2000,
Ulaanbaatar, 2001, Table 10.4, p.118; Table 10.13, p. 132; Table 10.14, p.133.
One strong indication of the declining productivity of labour in the livestock sector is the
number of animals per herdsman household. In Table 4 we divide the total animal population by
the number of herdsman households (i.e., households whose primary source of income is
livestock) and, alternatively, by the number of herdsmen (i.e., persons who own livestock even
though their primary occupation may be in another activity). As can be seen, between 1990 and
2000, the number of animals per herdsman household declined very sharply, namely, by 54.4 per
cent. Similarly, the number of animals per herdsman fell by 59 per cent. The evidence thus is
clear: the ratio of the stock of animals to the number of persons engaged in herding fell
dramatically and this must have been associated with a decline in labour productivity in the
livestock sector.
The livestock population explosion
There has been much concern in Mongolia about an alleged explosion in the number of
animals dependent on grazing land and the damage this is thought to inflict on the sustainability
of livestock production because of overgrazing on the steppes. Herders, it is claimed, are
11
irrational and are concerned only with the number of animals they own rather than the long term
economic returns they could obtain from better management of smaller herds.
The dual claims of a population explosion and severe overgrazing should be viewed with
scepticism, we think, and we certainly do not believe that an assumption of irrationality of
herders is a sound basis for policy formulation that affects the largest sector of the economy.
Claims that the current aggregate herd size “far exceeds the carrying capacity of the pasture
land”,7 if true, are alarming, but such claims should be carefully scrutinized. It is more likely that
the size and composition of the national herd respond both to environmental and economic
circumstances and that the intensity of grazing varies considerably from one region of the
country to another, reflecting institutional arrangements and market forces.
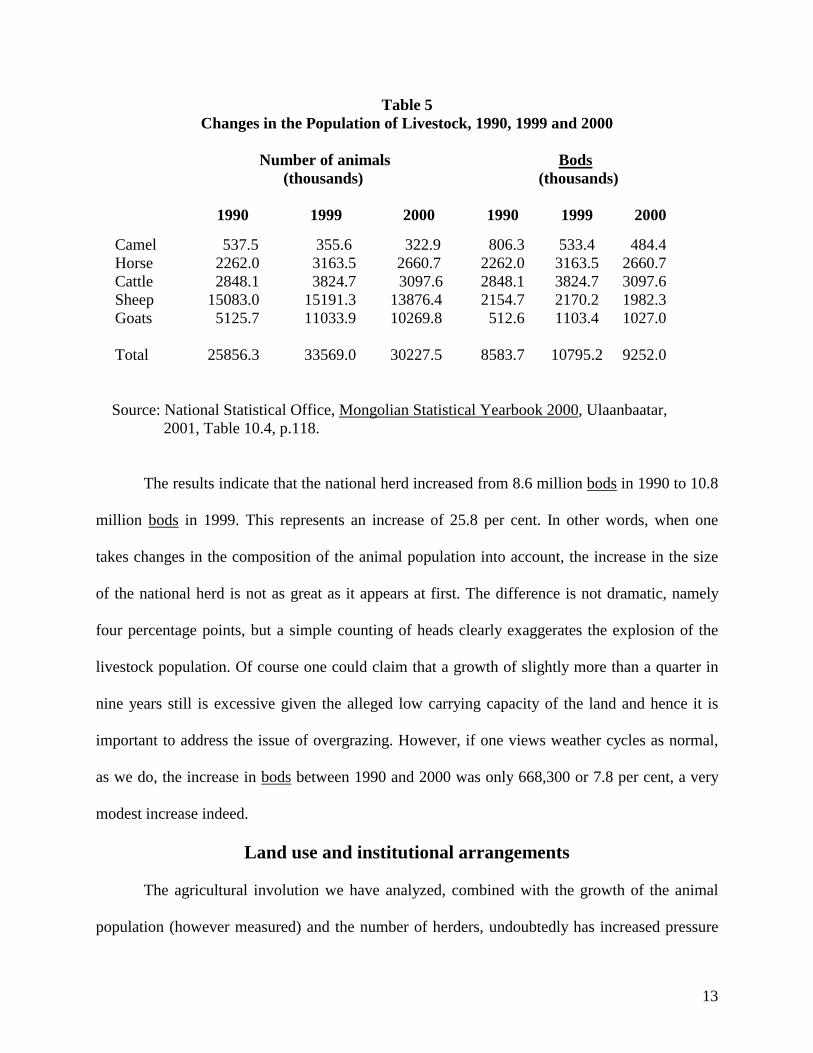
Let us begin by considering changes in the aggregate size of the national herd between
1990 and 1999. We also include data for 2000, which reflect the decline in the size of the herd
that year due to the severe winter weather. (See Table 5.) The total number of animals increased
from 25.9 million at the beginning of the period to 33.6 million in 1999. This represents an
overall increase of 29.8 per cent spread over nine years. The increase in the population of
herders, as we have seen, was of course much larger than this, reflecting the survival strategies
people adopted during a time of economic crisis. The livestock sector became a “poverty sink”,
agriculture turned in on itself, the number of animals per herder fell, labour productivity declined
and poverty increased. These tendencies were exacerbated in 2000 and 2001 when severe winter
weather reduced the size of the national herd by nearly ten per cent in 2000 alone.
The composition of the herd changed considerably between 1990 and 1999. The number
of sheep remained roughly constant, reflecting difficult conditions in the domestic textile
industry and consequently a decline in the market for wool. The number of goats, in contrast,
12
increased by 115 per cent as herders responded to newly available opportunities to export
cashmere to China. Cattle numbers (cows and yaks) increased by 34 per cent; camel numbers
declined by 33.8 per cent, again reflecting difficult conditions in the textile industry. Finally, the
number of horses rose by 39.9 per cent, reflecting at least in part the need of the growing number
of herders for horses to tend their herds. In other words, changes in the composition of the
animal population strongly suggest that the behaviour of herders is fully rational and can be
explained as responses to market signals. The increased aggregate size of the herd reflects
economic changes in the country as a whole, and in any case the growth of the herd was checked
by the dzuds in 1999-2000 and 2000-01. Indeed the number of livestock in the year 2000 was ten
per cent lower than it had been in 1999. Herders are well aware that the high variability of
climatic conditions in Mongolia means that herd size will fluctuate dramatically in response to
periodic external “shocks”. It makes good sense to increase the size of herds in climatically
benign times, knowing that they will contract when the weather cycle turns against them, as
indeed it did with a vengeance. 8
Mongolian herders know that not all animals are equal. Counting heads can be
misleading when the composition of the herd changes: a horse is not equivalent to a goat.
Herders often use a horse unit called a bod to calculate the size of a herd. According to the bod
scale, one horse = one cattle (cow or yak) = 7 sheep = 10 goats = 0.67 camels (or one camel =
1.5 horses).9 In the last three columns of Table 5 we have converted the number of animals in
1990, 1999 and 2000 into bods in an attempt to capture the significance, above all, in the rapid
rise of the goat population and the decline of the camel population, the two species at the
extremes of the bod scale.
13
Table 5 Changes in the Population of Livestock, 1990, 1999 and 2000
Number of animals Bods
(thousands) (thousands)
1990 1999 2000 1990 1999 2000
Camel 537.5 355.6 322.9 806.3 533.4 484.4 Horse 2262.0 3163.5 2660.7 2262.0 3163.5 2660.7 Cattle 2848.1 3824.7 3097.6 2848.1 3824.7 3097.6 Sheep 15083.0 15191.3 13876.4 2154.7 2170.2 1982.3 Goats
5125.7 11033.9 10269.8 512.6 1103.4 1027.0
Total 25856.3 33569.0 30227.5 8583.7 10795.2 9252.0
Source: National Statistical Office, Mongolian Statistical Yearbook 2000, Ulaanbaatar, 2001, Table 10.4, p.118.
The results indicate that the national herd increased from 8.6 million bods in 1990 to 10.8
million bods in 1999. This represents an increase of 25.8 per cent. In other words, when one
takes changes in the composition of the animal population into account, the increase in the size
of the national herd is not as great as it appears at first. The difference is not dramatic, namely
four percentage points, but a simple counting of heads clearly exaggerates the explosion of the
livestock population. Of course one could claim that a growth of slightly more than a quarter in
nine years still is excessive given the alleged low carrying capacity of the land and hence it is
important to address the issue of overgrazing. However, if one views weather cycles as normal,
as we do, the increase in bods between 1990 and 2000 was only 668,300 or 7.8 per cent, a very
modest increase indeed.
Land use and institutional arrangements
The agricultural involution we have analyzed, combined with the growth of the animal
population (however measured) and the number of herders, undoubtedly has increased pressure
14
on the grasslands. It is misleading to suggest, however, that the increase in average pressure has
been uniform in all regions, or that the level of pressure on grazing land is the same in all
regions. On the contrary, we have seen that labour is highly mobile in Mongolia, whether one is
concerned with urban-to-rural migration (and its recent reversal) or circulation of people within
the countryside between small towns and scattered encampments on the steppes. Similarly, there
is evidence that herders are highly mobile on the steppes themselves, moving from one grazing
area to another in response to changing climatic conditions (droughts and winter storms), the
availability of physical infrastructure (watering points and animal shelters) and economic forces
(proximity to markets, cost of transport and the relative prices of meat, wool, hides and milk).
All the evidence we have shows that herders (and other Mongolians) are responsive to changing
circumstances and that they respond quickly. Indeed, they have little alternative given the harsh
conditions in the country.
An implication of this view is that one should expect wide variation in the condition of
the pasture from one region to another rather than uniform overgrazing. In some areas grazing
intensity may be less today than it was before the transition to a market economy began, e.g.,
because wells have gone out of use for lack of maintenance or because in remote areas the
trekking system has disappeared and not been replaced by alternative marketing arrangements. In
other areas, in contrast, there may be intense localized overgrazing. This is likely to occur near
urban centers and be associated with less frequent rotation of herds among pastures and the
establishment of permanent dwellings by herders. This overgrazing has nothing to do with herd
sizes exceeding the “carrying capacity of the land” in general; it is a response to specific
economic incentives and institutional weaknesses.
15
Since privatization and the dissolution of the livestock collectives or negdels, veterinary
services have disappeared from many parts of the countryside. Herders concerned about the
health of their animals have an incentive to move them close to cities where veterinary services
are more likely to exist. Similarly, in regions of the Gobi desert where watering points have
fallen into disrepair, herders have an incentive to move their animals to areas where average
rainfall is higher or where water supplies are more secure. This, of course, puts greater pressure
than otherwise on the pastures surrounding the secure water points. Between 1990 and 2000 the
number of wells declined by 25.7 per cent and the capacity of the wells declined by 62.2 per
cent.10 That is, it was the larger, more technically complex wells that were poorly maintained
and that went out of service. This altered the structure of incentives. Changes in the marketing
system also have affected incentives. After the trekking system disappeared with the dissolution
of the negdels, private marketing intermediaries gradually appeared. Today many animals are
slaughtered on site where the herds are grazed and the carcasses are transported by truck to
market. Poor or non-existent roads and high fuel costs mean that marketing costs in regions
distant from a main road are high. Remoteness also means that competition among private
intermediaries is likely to be absent and hence herders will be confronted by a monopsonistic
market. The effect of high transport costs and little competition is that herders are unlikely to
receive an attractive price for their product. They thus have an incentive to move their herds
close to the main markets. This puts pressure on the grasslands near those markets.
The issue can be expressed in another way. The dissolution of the negdels, the
privatization of marketing and the deterioration of veterinary services and watering points have
altered the herders’ terms of trade and introduced wide variations in the terms of trade across
space. High costs of transport in particular mean that the price received by herders for their
16
products is lower the more distant are herders from a town and the price herders have to pay for
essential consumer goods is higher the more distant they are from town. This creates a strong
incentive for herders to congregate near towns, thereby causing problems of overgrazing around
those towns.
Many people who rejoiced at the dissolution of the negdels now wring their hands over
the declining productivity of pastures. The rejoicing was foolish and the wringing of hands is
unhelpful. Changes in the pattern of land use are a response to changes in the structure of
incentives. The structure of incentives, in turn, has been strongly affected by the disappearance
of many “public goods” formerly provided by the negdels. These public goods include the
development and maintenance of watering facilities, the creation and maintenance of fodder
storage facilities to cope with seasonal fodder shortages and occasional but predictable climatic
disasters, the provision of veterinary services, the provision of information services to keep
herders in touch with changes in market prices, and possibly the provision and maintenance of
animal shelters. In other words, many features of the negdels will have to be reinvented if land
use is to be improved. This will require imagination in the design of new institutions. It will also
require public investment in rural development. The experience since 1989 has shown that
unregulated markets are not efficient at supplying public goods.
Land tenure and resource mobilization
The localized overgrazing and the inefficient use of natural resources in general is partly
a consequence of poorly defined land rights. In the past, under the negdels, land use rights were
clear. Each negdel had a defined territory which included pasture reserves for use in an
emergency. Members of one negdel could not use land belonging to another without prior
agreement and within a negdel most pasture management decisions were somewhat
17
decentralized, being made at the brigade level. This system of land management has of course
vanished. The problem is that it has been replaced by the worst possible system imaginable,
namely, open access commons.11
No one in Mongolia owns the vast grasslands of the steppes; no one regulates the use of
the land. Anyone may graze their livestock on this common land and everyone is free to graze as
many animals as they wish. The main input into the livestock industry—grass from natural
pastures—is free and it is hardly surprising that when an input is free no one has an incentive to
economize on its use. The result is that, in the absence of climatic or other external constraints,
land will tend to be overused and overgrazing will occur.
In the majority of places where open access commons are said to exist, there are in fact
customary tenure institutions which regulate the use of the resource and ensure its long-term
sustainability.12 Only outer space, the great oceans and the Mongolian steppes are genuine
examples of open access commons! Elsewhere, property rights have been created which regulate
the ownership or use of natural assets and ensure that resources are allocated efficiently.13 True,
even in Mongolia customary groups of herders attempt to control access to their common grazing
land, but Mongolian custom, reinforced by the 1994 Land Law, makes it impossible to prevent
free-riding or to exclude outsiders from grazing land.
Mongolian herders understand the livestock industry. They have mastered techniques of
production and the management of natural resources under extremely difficult conditions. They
are not irrational, they respond to economic incentives and they have a good understanding of the
problems they face. Herders, in fact, do not like open access commons. Intuitively they
understand the dangers of pasture degradation and the “tragedy of the commons”. There is an
abundance of evidence from field studies that most herders would much prefer to build
18
communal institutions to manage grazing land efficiently rather than continue with an open
access commons.14 Not only would such an arrangement be more efficient, it would also be more
equitable and environmentally sustainable.15
Indeed customary groupings among herders such as khot ails have a long pedigree. They
existed before the negdels were invented, continued as informal institutions under the negdels
and in some regions have been revived after the dissolution of the negdels. They are however
small, weak and need strengthening. The best way is to amalgamate several khot ails and other
small groups of herders into much larger groups and then give these larger groups legal rights
and access to productive resources. The primary productive resource is of course different types
of pastureland needed during each of the four seasons and control of these resources should be
the foundation of rural institutions in the livestock sector.
Specifically, we suggest that herders should be encouraged to organize themselves into
groups and that these groups should enter into long term contracts with local government to
manage sizeable areas of grazing land and water sources. In return for a lease giving a group of
herders exclusive right to use the designated land and water resources, the herders would be
required to pay an annual leasing fee.16 This leasing fee would replace the existing but
unenforced animal head tax and would be a substitute for the land tax found in other countries.
These leases should be long term (say, up to 40 years) so that the group has a strong incentive
not to misuse the assets they control. Leases should be renewed well before the contract expires,
subject to a satisfactory review of management performance. These periodic renewals and
appraisals would increase the tenure security of leaseholders while enabling local government (as
guardian of the public interest) to assure itself that national land and water assets are properly
maintained.
19
In return for these privileges, the leaseholders would pay an annual leasing fee that
reflects the income generating capacity of the assets entrusted to them. Leaseholders in
geographically inhospitable regions, distant from markets and poorly provided with physical
infrastructure facilities would pay a relatively low leasing fee while leaseholders located in good
grazing areas, conveniently located near markets and well served by infrastructure facilities
would pay a higher fee. The level of fees would be adjusted to reflect changing conditions at the
time of the periodic review.
The revenue raised by local government from leasing fees could be reinvested in the
agricultural sector in order to raise average incomes and reduce poverty. Priority in the first
instance should be to finance the “public goods” formerly supplied by the negdels, because
without these public goods it will be difficult to bring the agricultural involution to a halt and
initiate a rising spiral of higher productivity, higher incomes, and greater investment leading to
higher productivity, etc. For example, the livestock sector surely has the potential to penetrate
lucrative export markets for lamb, beef and horsemeat, but this will not be possible unless
Mongolia can meet foreign standards for animal hygiene. That, in turn, will require an improved
veterinary service, improved slaughtering facilities and adequate transport. In other words
institutional transformation, land tenure reform and domestic resource mobilization are the keys
to rural development on the steppes of Mongolia.
Conclusions and policy suggestions
If one thinks of development as entailing structural change in which the relative
importance of agriculture declines, Mongolia in recent years has exhibited the symptoms of a
country engaged in a process of underdevelopment. During most of the period of transition to a
market economy, there has been rapid urban–to–rural migration. Agriculture’s share of GDP has
20
risen and, within agriculture, crop production has declined and the country has become
increasingly specialized as a producer of livestock. Agricultural employment (mostly herders)
has risen rapidly and agricultural employment now accounts for nearly half of total employment.
The productivity of labour in the livestock sector has fallen in recent years and a process of
agricultural involution is occurring.
The claim that there has been a livestock explosion is exaggerated. When adjusted for
changes in the composition of the herd, the animal population increased by just over a quarter
between 1990 and 1999 and then fell by 14.3 per cent in 2000, in terms of horse equivalent. Over
the entire period, 1990–2000, the animal population increased by only 16.9 per cent in terms of
numbers and by 7.8 per cent in terms of bods. This is hardly a population explosion.
The claim of widespread overgrazing also is exaggerated. Pressure has increased on some
grazing lands and diminished on others. Herders have moved their animals in response to
changing climatic conditions, changes in the quality of wells and other physical infrastructure
and to changes in market incentives.
The provision of “public goods” to the livestock sector has greatly diminished since the
livestock collectives were dissolved. A reduction of the high incidence of poverty in the sector
will require substantial public investment in watering facilities, emergency fodder storage
facilities, veterinary services and the like. The private sector will not provide an optimal supply
of these public goods. The first thing that needs to be done therefore is for policy makers to give
high priority to state investment in public goods for the livestock sector.
Land tenure arrangements on the Mongolian steppes are highly defective. The major
grazing areas are open access commons and thus, everything else being equal, the incentive to
overgraze is strong. Although overgrazing at present appears to be localized and not generalized,
21
the potential for a “tragedy of the commons” exists. The problem can be solved by creating
secure use–rights over defined areas of grassland and the associated watering points.
We think, second, that the most desirable way to do this is to encourage herders to
organize themselves into groups and these groups should then enter into long term leasehold
contracts to manage pasture and water resources. Third, the leaseholders should be required to
pay an annual leasing fee that reflects the income generating capacity of the resources turned
over to them.
Finally, the revenues produced by the leasing fees should be used by local government to
finance the investment in public goods recommended above. These four recommendations thus
reinforce one another. Public investment will help the livestock sector to participate fully in a
market economy by raising the productivity of herders and reducing poverty. The land tenure
reforms centered on long term contracts with group leaseholders will provide incentives to use
the land efficiently while ensuring that all herders have equitable access to water and pasture
resources. This should prevent overgrazing and the tragedy of the commons. Charging a leasing
fee for the use–rights of land and water resources will generate revenues that can be used to
finance rural development at the local level. The combination of public investment, institutional
reforms and taxation (or leasing fees) to finance further investment should enable the livestock
sector, the backbone of the economy, to move out of its vicious circle of involution and enter
into a virtuous circle of development.
22
Notes 1 World Bank, World Development Indicators 2001, Washington, D.C.: World Bank,
2001, Table 1.1
2 See B. Baabar, History of Mongolia, Cambridge: White Horse Press, 1999.
3 For a study of livestock collectives (negdels) and nomadic pastoralism in Mongolia at the
very beginning of the transition to a market economy see Melvyn C. Goldstein and
Cynthia M. Beall, The Changing World of Mongolia’s Nomads, Berkeley and Los
Angeles: University of California Press, 1994.
4 The classic studies of the structural changes that accompany development include Colin
Clark, The Conditions of Economic Progress, London: Macmillan, 1940; Simon
Kuznets, Modern Economic Growth: Rate, Structure and Spread, New Haven: Yale
University Press, 1966; Hollis Chenery and Lance Taylor, “Development Patterns:
Among Countries and Over Time, Review of Economics and Statistics, Vol. 50, No. 4,
November 1968.
5 The term agricultural involution was coined by Clifford Geertz to describe introverted or
inward looking development in Java. See Clifford Geertz, Agricultural Involution: The
Process of Ecological Change in Indonesia, Berkeley: University of California Press,
1968.
6 In the early 1990s the “true” rate of unemployment may have been 25-50 per cent higher
than registered unemployment. See Wouter von Ginneken, “Employment Promotion and
the Social Safety-Net” in Keith Griffin, ed., Poverty and the Transition to a Market
Economy in Mongolia, London: Macmillan, 1995.
23
7 UNDP, Common Country Assessment for Mongolia, Preliminary Draft for Discussion,
Ulaanbaatar, October 2000, p.35.
8 It is gradually becoming accepted that grazing land in nomadic societies is in perpetual
disequilibrium and hence the concept of “carrying capacity” has little practical meaning.
See, for example, R.H. Behnke, I. Scoones and C. Kerven, Rangeland Ecology at
Disequilibrium: New Models of Natural Variability and Pastoral Adaptation in African
Savannas, London: Overseas Development Institute, 1993.
9 See Jeremy Swift, “Rural Development: The Livestock Sector,” in Keith Griffin, ed., op.
cit., p.133, n.3.
10 National Statistical Office, Mongolian Statistical Yearbook 2000, Ulaanbaatar, 2001,
Table 10.20, p. 137.
11 See Garett Hardin, “The Tragedy of the Commons,” Science, Vol. 162, December 1968. 12 For a general discussion of the characteristics of common pool resources such as
grasslands and ways of managing these resources see Elinor Ostrom, Governing the
Commons: The Evolution of Institutions for Collective Action, Cambridge: Cambridge
University Press, 1990.
13 See, for example, Daniel Bromley, Environment and Economy: Property Rights and
Public Policy, Oxford: Basil Blackwell, 1991.
14 The same is true in Xinjiang, China, a region similar in some respects to parts of
Mongolia. For evidence that Chinese pastoralists resist individual household tenure in
favour of small group tenure despite government policy favouring the assignment of long
term (50 year) use rights to rangelands to individual households, see Tony Banks,
24
“Property Rights and the Environment in Pastoral China: Evidence from the Field,”
Development and Change, Vol. 32, No. 4, September 2001.
15 For evidence that common property rights can be successful in managing common pool
resources such as pastureland see E. Ostrom, J. Burges, C.B. Field, R.B. Norgaard and D.
Policansky, “Revisiting the Commons: Local Lessons, Global Challenges,” Science, Vol.
284, 1999.
16 Note that rangeland use fees have been introduced in China, payable by individual
households rather than by the herding group as we advocate. See Tony Banks, op. cit., p.
731.