Embed Size (px)
Citation preview
Agricultural Growth in India:
Examining the Post-Green Revolution Transition
Nicholas E. Rada
Economic Research Service, USDA
Selected Paper prepared for presentation at the Agricultural & Applied Economics Association’s 2013
AAEA & CAES Joint Annual Meeting, Washington, DC, August 4-6, 2013
The views expressed are those of the authors and not necessarily those of the Economic Research
Service or the U.S. Department of Agriculture.
Agricultural Growth in India:
Examining the Post-Green Revolution Transition
Abstract
India has enjoyed rapid economic growth over the past forty years, GDP per capita (PPP$)
accelerating from less than 1% in the 1970s to over 5.8% in the 2000s. As incomes have risen,
consumer demand has shifted from staple grains toward higher valued foods, such as
horticultural and livestock products. Indian farmers appear to be meeting these new growth
opportunities. But as production shifts, questions are being raised about agriculture’s ability to
meet the basic food needs of India’s 1.24 billion citizens. Central to these questions has been the
waning impact of cereal grain technologies typified by the Green Revolution. Our purpose is to
examine the productivity growth implications of farmers’ decisions to diversify production and
to assess new sources of growth in Indian agriculture. In doing so, we construct new production
and productivity accounts and evaluate total factor productivity (TFP) growth, from 1980 to
2008, at the national, regional, and state levels. Results suggest renewed growth in aggregate
TFP growth despite a slowdown in cereal grain yield growth. TFP growth appears to have
shifted to the Indian South and West, led by growth in horticultural and livestock products.
Keywords: agricultural growth, India, Tornqvist-Thiel, TFP growth, agricultural diversification
1
Agricultural Growth in India:
Examining the Post-Green Revolution Transition
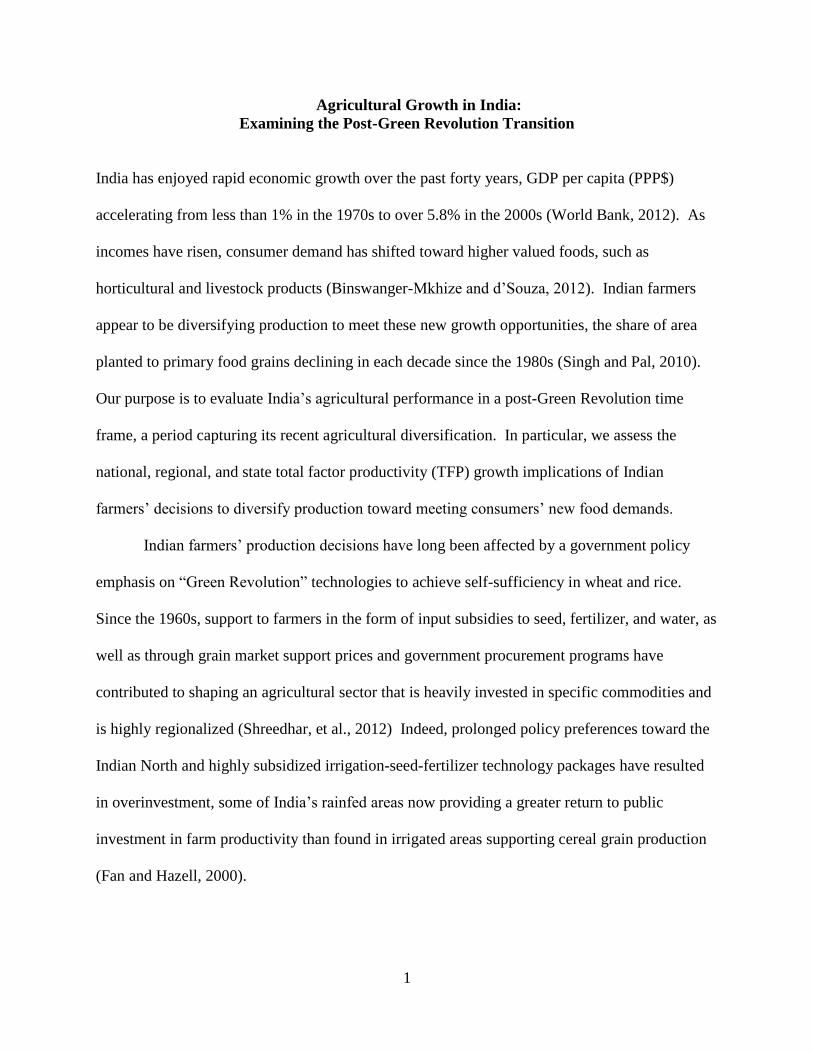
India has enjoyed rapid economic growth over the past forty years, GDP per capita (PPP$)
accelerating from less than 1% in the 1970s to over 5.8% in the 2000s (World Bank, 2012). As
incomes have risen, consumer demand has shifted toward higher valued foods, such as
horticultural and livestock products (Binswanger-Mkhize and d’Souza, 2012). Indian farmers
appear to be diversifying production to meet these new growth opportunities, the share of area
planted to primary food grains declining in each decade since the 1980s (Singh and Pal, 2010).
Our purpose is to evaluate India’s agricultural performance in a post-Green Revolution time
frame, a period capturing its recent agricultural diversification. In particular, we assess the
national, regional, and state total factor productivity (TFP) growth implications of Indian
farmers’ decisions to diversify production toward meeting consumers’ new food demands.
Indian farmers’ production decisions have long been affected by a government policy
emphasis on “Green Revolution” technologies to achieve self-sufficiency in wheat and rice.
Since the 1960s, support to farmers in the form of input subsidies to seed, fertilizer, and water, as
well as through grain market support prices and government procurement programs have
contributed to shaping an agricultural sector that is heavily invested in specific commodities and
is highly regionalized (Shreedhar, et al., 2012) Indeed, prolonged policy preferences toward the
Indian North and highly subsidized irrigation-seed-fertilizer technology packages have resulted
in overinvestment, some of India’s rainfed areas now providing a greater return to public
investment in farm productivity than found in irrigated areas supporting cereal grain production
(Fan and Hazell, 2000).
2
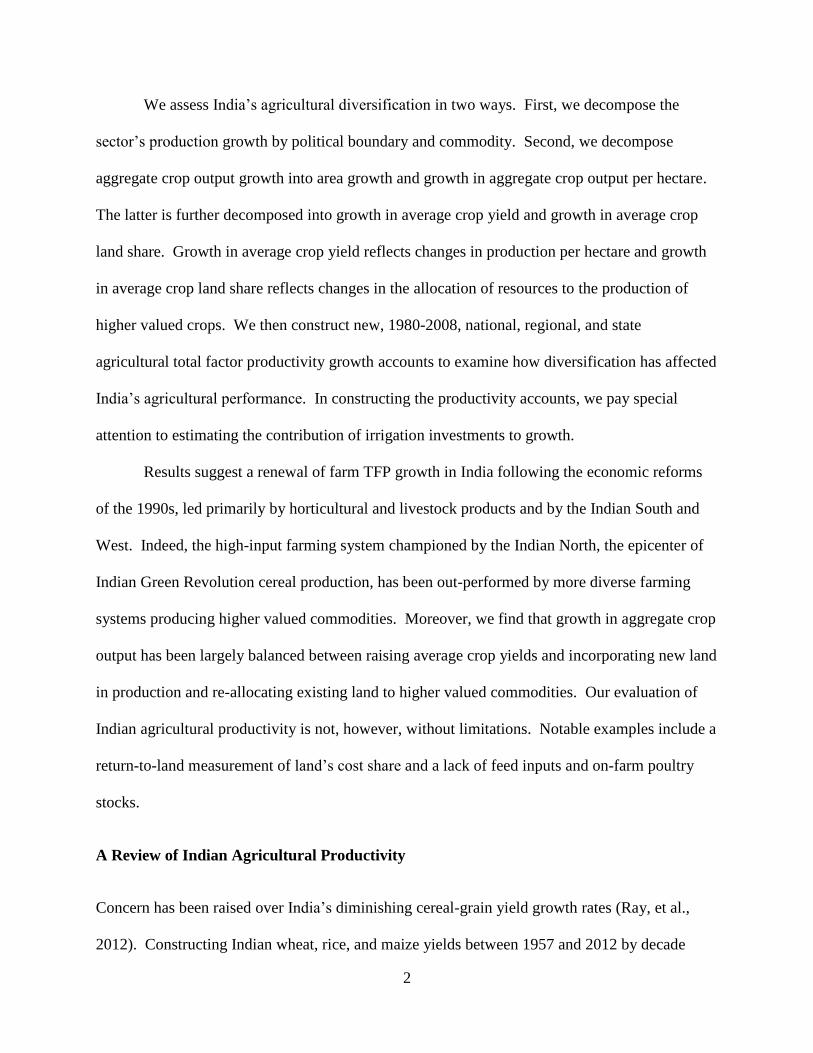
We assess India’s agricultural diversification in two ways. First, we decompose the
sector’s production growth by political boundary and commodity. Second, we decompose
aggregate crop output growth into area growth and growth in aggregate crop output per hectare.
The latter is further decomposed into growth in average crop yield and growth in average crop
land share. Growth in average crop yield reflects changes in production per hectare and growth
in average crop land share reflects changes in the allocation of resources to the production of
higher valued crops. We then construct new, 1980-2008, national, regional, and state
agricultural total factor productivity growth accounts to examine how diversification has affected
India’s agricultural performance. In constructing the productivity accounts, we pay special
attention to estimating the contribution of irrigation investments to growth.
Results suggest a renewal of farm TFP growth in India following the economic reforms
of the 1990s, led primarily by horticultural and livestock products and by the Indian South and
West. Indeed, the high-input farming system championed by the Indian North, the epicenter of
Indian Green Revolution cereal production, has been out-performed by more diverse farming
systems producing higher valued commodities. Moreover, we find that growth in aggregate crop
output has been largely balanced between raising average crop yields and incorporating new land
in production and re-allocating existing land to higher valued commodities. Our evaluation of
Indian agricultural productivity is not, however, without limitations. Notable examples include a
return-to-land measurement of land’s cost share and a lack of feed inputs and on-farm poultry
stocks.
A Review of Indian Agricultural Productivity
Concern has been raised over India’s diminishing cereal-grain yield growth rates (Ray, et al.,
2012). Constructing Indian wheat, rice, and maize yields between 1957 and 2012 by decade
3
suggests that indeed, there does appear to be reason for concern, particularly regarding the
performance of wheat and rice (Table 1).1 Re-affirming that concern, Chand, et al. (2011) find
average annual TFP growth of Indian wheat declined from 0.74% in the 1986-1995 period to
0.4% in the 1996-2005 period, while rice TFP growth fell from 2.51% in the early period to
1.61% in the later period.
If, however, we employ a more statistical approach to framing the yield growth estimates,
a different impression emerges (Table 1). Chand and Parappurathu (2012) provide new
estimates that differentiate India’s 1960-2011 agricultural growth into six separate periods of
development. Representing the yield growth estimates by these development periods suggests
that post-2005 rice and wheat yields have achieved growth rates not experienced since the 1980s,
and the number of states experiencing stagnant or negative growth has fallen to their lowest
historical levels.
While the recent improved performance of wheat and rice yields is encouraging,
evaluating agricultural performance from such partial productivity measures obscures
information contained in critical capital, labor, and material inputs and therefore offers only
limited insight into productive efficiency. A more informative farm performance measure is
total factor productivity, or output per unit of aggregate input. But not only should all inputs be
accounted for, there should also be ample commodity coverage to allow for the implications of
farmers’ decisions to alter their production composition. That is, evaluating agricultural
performance from commodity-specific TFP growth rates omits potential sources of sectoral
growth that may occur through diversification. We thus focus our Indian agricultural
productivity review on nine studies that measure national TFP growth for a broad set of
4
commodities or for the entire sector.2 Four of these studies employ data from the Food and
Agricultural Organization (FAO) and five employ data from Indian national accounts.
The four FAO-based studies report significant variations in India’s agricultural TFP
growth estimates, even among similar methods and datasets. Coelli and Rao (2005) and Nin-
Pratt, et al. (2010) estimate TFP using Malmquist indexes. Their results differ, Nin-Pratt, et al.’s
estimate indicating growth to be half of what Coelli and Rao estimate (Table 2). Because both
Malmquist estimates were extracted from broader, global analyses, individual country estimates
may be affected by the dimensionality issue, or the number of commodities and countries
included in the analysis (Lusigi and Thirtle, 1997). Moreover, Coelli and Rao (2005) note that if
shadow prices are indeed correctly estimated, for many countries the estimates may significantly
differ from the sample average due to country-specific factor abundance or scarcity. Indeed,
these two issues may be why the TFP growth estimates from Coelli and Rao differ by method,
their Tornqvist index (using Malmquist-derived cost shares) indicating slower TFP growth than
does their Malmquist index (Table 2).
It is also interesting to note that the three Tornqvist approaches using FAO data from
Table 2 examine the same time periods but also generate widely different TFP growth estimates.
Coelli and Rao’s (2005) average annual Tornqvist estimate of 0.90% is less than Fuglie’s (2012)
estimate of 1.39% per annum TFP growth, which itself is significantly slower than Avila and
Evenson’s (2010) estimate of 2.41% per annum. Differences between them must therefore lie in
factor quality adjustments and the cost shares employed. Fuglie quality adjusts land inputs to
account for irrigation investments, lowering TFP growth in countries with substantial
investments in irrigated cropland, such as India. The three studies’ respective cost shares
weighting factor growth also differ, Coelli and Rao employ shadow cost shares from their
5
Malmquist index, Avila and Evenson source their cost shares from Evenson and Kislev (1975)
and Fuglie’s source from Evenson, Pray, and Rosegrant (1999).
The five remaining studies employ data from Indian national accounts and a Tornqvist
index approach to measurement. Among those studies, however, the time periods differ and
each study focuses on a select group of crops or livestock products. The differing years and
commodities included make direct comparisons difficult. We therefore only briefly note that
Rosegrant and Evenson (1992) select 15 crops between 1957 and 1985 and find TFP growth of
those crops rose 0.98% between 1975 and 1985. Evenson, et al. (1999) select 18 crops and find
over the 1977 to 1987 period a similarly low growth rate (Table 2). Chand, et al. (2010) estimate
between 1985 and 2006 a low 0.53% average annual TFP growth rate, although their estimate
uniquely derives from value, not volume, data and the number of commodities included is
unknown. Birthall, et al. (1999) examines 9 livestock products and finds TFP rose by 1.79%
between 1980/81 and 1995/96.
Of all the studies, only Fan, et al. (1999) evaluated TFP growth at the state level,
accounted for both crops and livestock products, and published the annual growth estimates.
State-level TFP measures are important because they allow for concise results reporting yet
sufficient degrees of freedom for econometric policy analysis; accounting for the entire
agricultural sector allows for a broader representation of growth, an important factor as India
diversifies toward higher-valued commodities; and making public such estimates enables new
policy analyses.
Our examination of farm productivity growth in India includes the broadest composition
of commodities and Indian states to-date and updates the current knowledge of Indian state and
regional agricultural performance by 14 years. More specifically, we examine 59 crops and 4
6
livestock products, between 1980 and 2008, across 16 Indian states, 5 regions, and at the national
level. Importantly, we note that great care was taken to ensure consistent commodity coverage
across the national, regional, and state productivity accounts.
Measuring Total Factor Productivity Growth
Our strategy is to assume that Indian farmers are producing under constant-returns-to-scale
technologies to maximize profits in competitive markets. In this case, total farm revenues equal
total farm costs, marginal rates of substitution are equal to corresponding price ratios, and
productivity growth may be measured using observed farm prices and quantities (Jorgenson and
Griliches, 1967). We measure India’s agricultural total factor productivity growth using the
chain-weighted Tornqvist-Theil quantity index. This particular index offers several advantages,
such as being superlative, exact for the linear homogenous translog production function
(Diewert, 1976). It has also been shown to be superlative under general production structures
(e.g. non-homogenous and non-constant returns to scale) (Caves, et al., 1982). Moreover,
because nominal prices are used in constructing the weights, it accounts for input quality
changes, to the extent that factor quality improvements are reflected in higher wages and rental
rates (Capalbo and Vo, 1988). And by chain-weighting the index, we avoid possible index
number bias arising from the use of fixed weights to aggregate quantity growth rates (Alston, et
al. 1995).
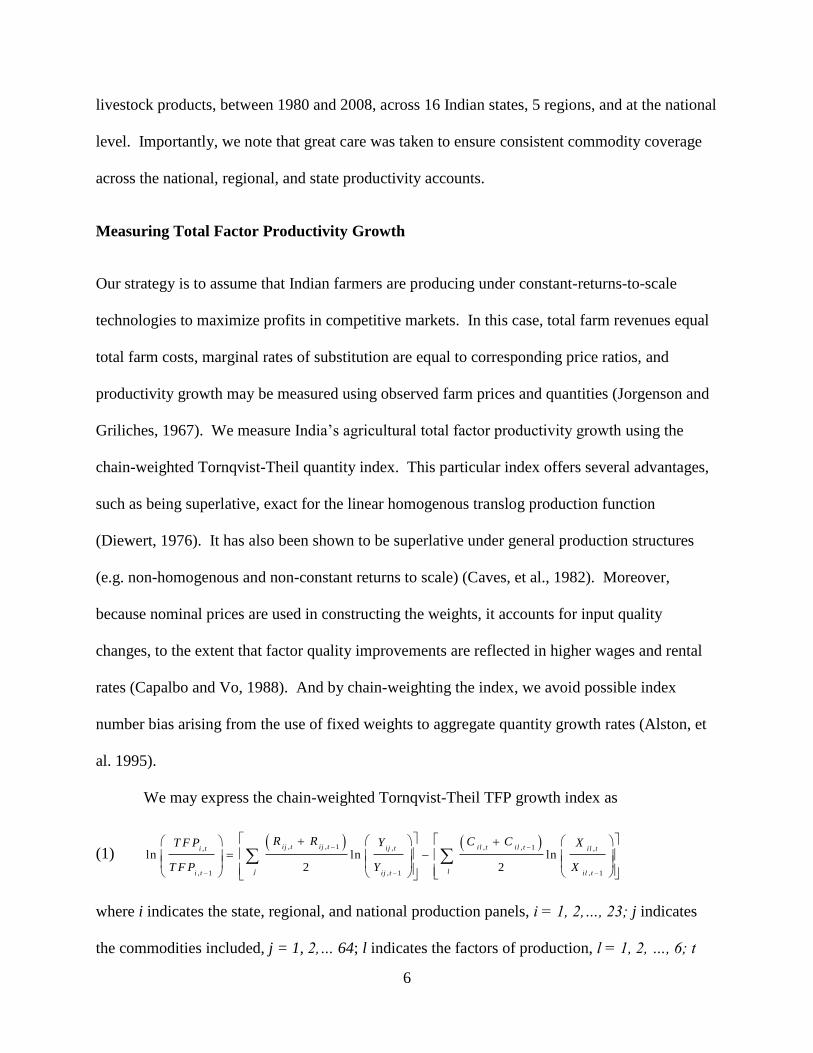
We may express the chain-weighted Tornqvist-Theil TFP growth index as
(1) , , 1 , , 1,, ,
, 1 , 1 , 1
ln ln ln2 2
ij t ij t il t il tij ti t il t
j li t ij t il t
R R C CYT F P X
T F P Y X
where i indicates the state, regional, and national production panels, i = 1, 2,…, 23; j indicates
the commodities included, j = 1, 2,… 64; l indicates the factors of production, l = 1, 2, …, 6; t
7
indicates time, t = 1980, 1981,…, 2008; R is the revenue share; Y is output; C is the cost share,
and X is input. Equation (1) expresses aggregate TFP growth of observation i, between time
periods t and t-1, as the difference between aggregate output growth and aggregate input growth.
Aggregate output (input) growth is defined as the sum of all commodity output (factor input)
growth rates, each growth rate weighted by its respective average revenue (cost) share in the
reference time periods.
We exploit the aggregate output growth measure from equation (1) to provide insight into
the proportion of that growth accounted for by changes in crop area, changes in crop yields, and
changes in land allocations to higher valued commodities. To this end, we first decompose
aggregate output growth in log form into its area growth and aggregate crop output per hectare
growth components
(2) , , ,
, 1 , 1 , 1
ln ln + lnim t im t im t
im t im t im t
Y A A Y
Y A A Y
where Y is output, A is area, AY is aggregate crop output per hectare, and subscript 1, 2 , ...5 9m
represents the possible set of crops produced in political entity i and year t. Aggregate crop
output per hectare is defined here as the summed product of each crop’s yield CY and each
crop’s land share CS; that is, i t im t im t
m
A Y C Y C S . Substituting into equation (2) our definition
of aggregate crop output per hectare AY provides
(3) , , , ,
, 1 , 1 , 1 , 1
ln ln + ln + lnim t im t im t im t
im t im t im t im t
Y A C Y C S
Y A C Y C S
.
Equation (3) states that output growth is the sum of the change in area, change in crop yield, and
change in crop land share. Note that we maintain conformity with the Tornqvist-Theil approach
to aggregation in equation (1) but suppress the weighting notation in equations (2) and (3).
8
Therefore, equation (3) informs us as to proportion of aggregate output growth accounted for by
expanding area in production, by improving the performance of average crop yields, and by
diversifying production to higher valued crops.
Agricultural Data
We evaluate India’s agricultural performance and production diversification by constructing,
from 1980 to 2008, consistent agricultural production accounts at the national, regional, and state
levels (Figure 1). It is important to note that the national panel includes all Indian states and
production, but the regional and state panels include only those states present in Figure 1. To
validate the data, we sum all state data and compare that sample sum against national aggregate
information. The 59 crop commodities and 4 livestock products included in the accounts are
recorded at the state and national levels, are measured in metric tons, and their farm-gate prices
are reported in rupees per quintal.3 Appendix Table 1 provides the data sources. For the
purposes of temporal data consistency, Bihar is combined with Jharkhand to form Old Bihar,
Madhya Pradesh with Chhattisgarh to form Old Madhya Pradesh (Old MP), and Uttar Pradesh
with Uttaranchal to form Old Uttar Pradesh (Old UP). These states split in year 2000.
India’s farm commodities are aggregated into six production categories: grains, pulses,
horticultural & spices, oilseeds, specialty crops, and livestock products (Table 3). For those
commodities and years in which Indian national data were missing, statistics were interpolated
using FAO growth rates. For those data unavailable at the state level, we interpolate using the
national growth rate. Only three commodities included in the analysis directly assume national
FAO quantities (melons, mangoes & guavas, and pears & quince). They were included because
of their presence in the state-level production accounts.
9
India is the world’s largest exporter of beef (FAS, 2013). Yet Indian data of meat
production, recorded by the Ministry of Agriculture’s Department of Animal Husbandry,
Dairying, & Fisheries, is available only since 1992 and is reported as an aggregate; individual
animal production statistics did not begin until 1998. Meat production therefore reflects the
aggregate production from buffaloes, cattle, goats, lamb, pigs, and poultry. Meat values,
collected by the Central Statistical Organization’s Department of Statistics, are available since
1990.
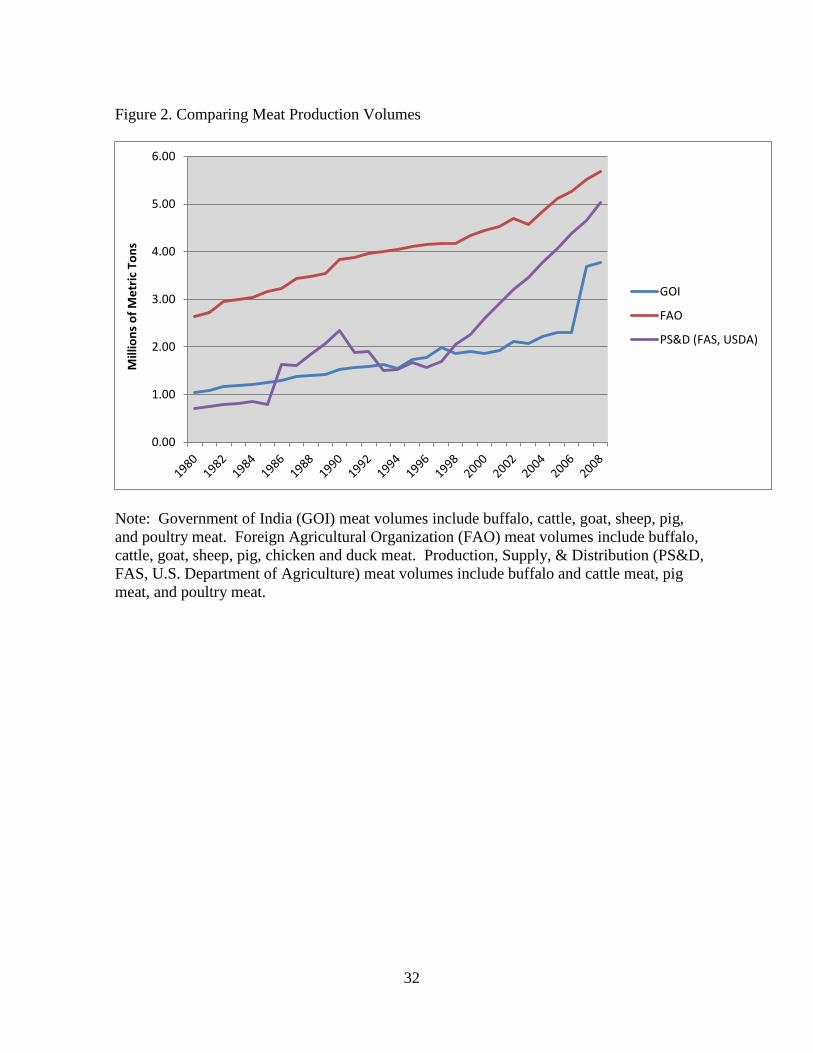
Comparing the Government of Indian (GOI) national meat production volumes with
those constructed from FAO and PS&D databases provide little confidence in the GOI data
(Figure 2). We direct the reader’s attention to Figure 2 and the significant jump in the GOI meat
volumes after 2005. While this was a period of growth, these changes also reflect a significant
change in the collection of poultry data (Mehta, et al., 2003). For instance, Gujarat, Haryana,
Kerala, Punjab, and Tamil Nadu show substantial production changes between 2005 and 2007,
driving up the national poultry production volumes from 537 thousand tons to 1.7 million tons.4
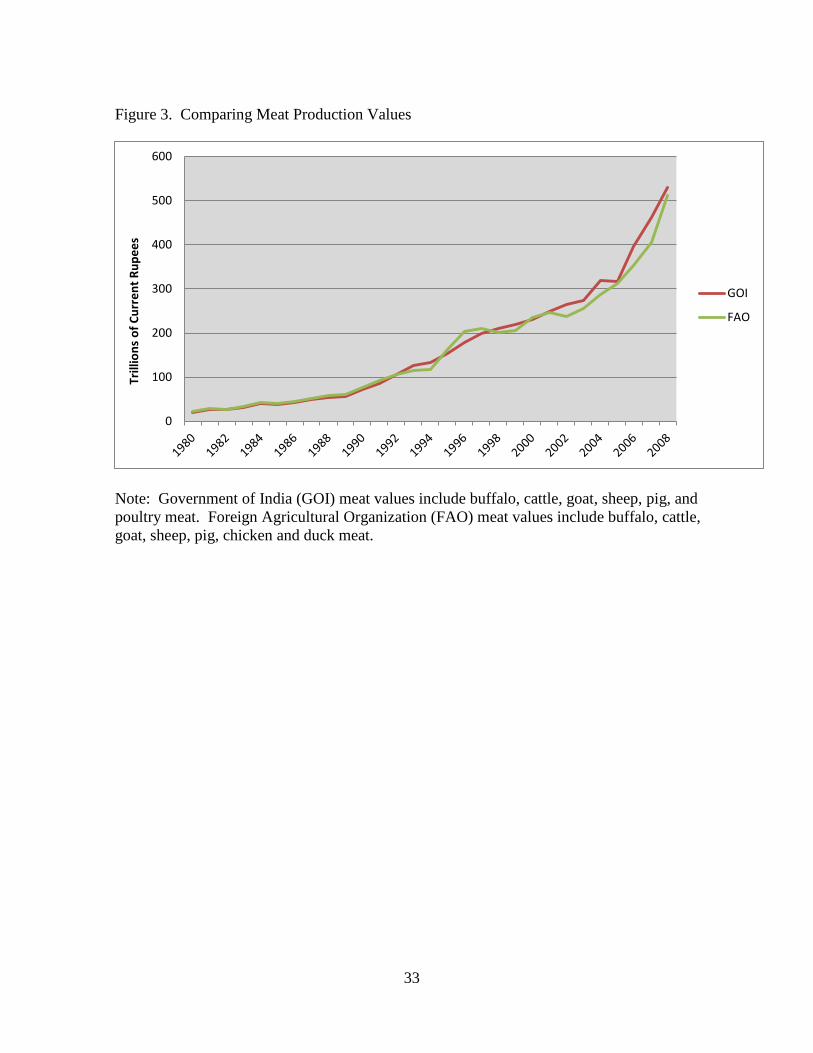
Estimates of total meat values, collected by India’s Central Statistical Organization, are,
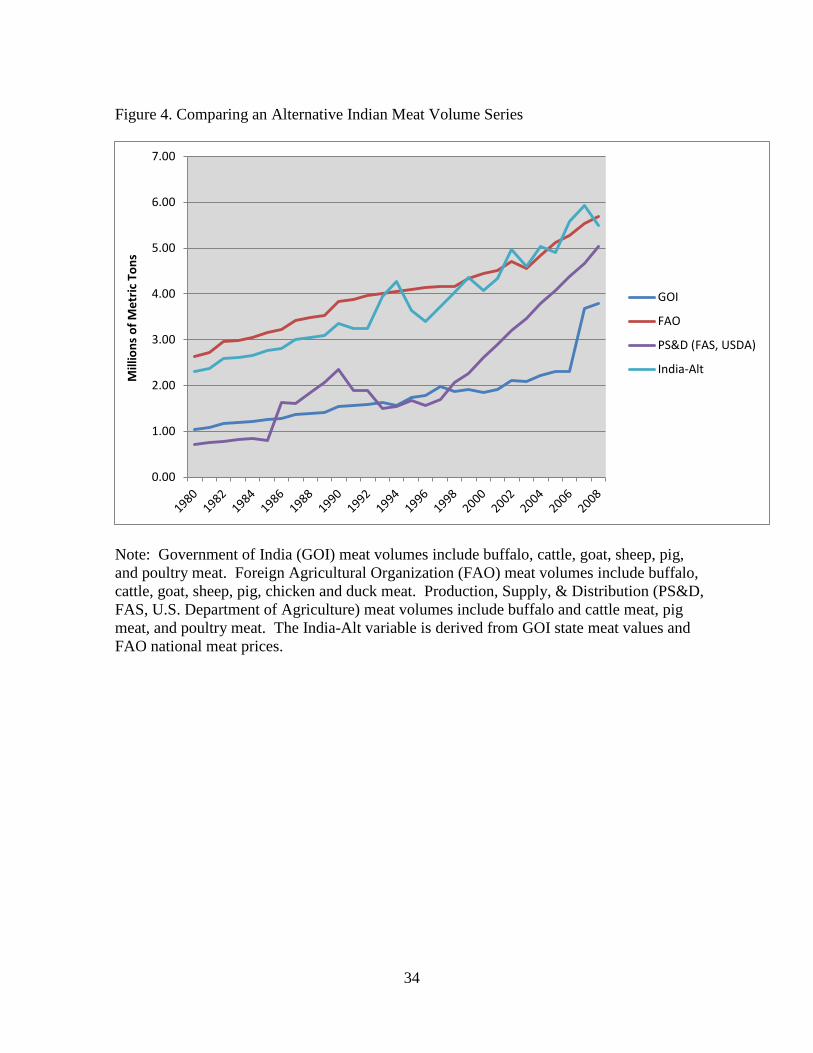
however, very similar to those reported by the FAO (Figure 3). We therefore choose to construct
a new meat volume series based on the FAO national meat price - averaged across buffaloes,
cattle, goat and sheep, and poultry - and the Indian national and state meat values (Figure 4).
The FAO average national meat price is derived from FAO average meat values and volumes.
Unfortunately, FAO meat values between 1980 and 1990 are unavailable. We extend the cattle
and buffalo meat values back from 1990 to 1980 by applying the growth rate from the product of
FAO-reported volumes and border (export) prices, while goat, sheep, and poultry FAO meat
10
values are extended back by applying growth from the consumer price index specific to India
(World Bank, 2012).
Labor
Labor inputs consist of adult male and female laborers and are obtained from the 43rd
(1987-88),
50th
(1993-94), 55th
(1999-00), 61st
(2004-05), and 66th
(2009-10) rounds of the National
Statistical Survey (NSS). Because the earliest state-level labor count data available to include
was from the 1987 survey, state-specific growth rates were employed, following careful
consideration of state-wise and time-wise variations, from Fan, et al. (1999) to extend our state
labor counts back to 1980. Fan, et al., provide agricultural employment from the NSS by Indian
state and nationally for survey years 1972, 1977, 1983, 1987, and 1993. Survey years 1977 and
1983 enable our labor data to be extended back from 1987, and years 1987 and 1993 enable
state-wise and time-wise labor validation. We generate continuous time-series of the labor
counts through linear interpolation of survey years.
Developing a flow of labor inputs from the stock of laborers requires knowing how much
time labor works in a given year, or labor’s intensity. Evenson, et al. (1999) provides a fixed
number of days worked for male laborers by Indian state.5 Weighting each state’s labor-days
worked by their respective share of the total labor force suggests that males, at the national level,
work 227 days per year. India’s Ministry of Labour and Employment reports that male (female)
waged agricultural laborers worked 227 (182) days per year in 1977/1978, falling to 215 (177)
days worked per year in 2004/2005 (GOI, 2010). We thus employ Evenson, et al.’s (1999) state
variation in male days worked for year 1978 and apply the Ministry of Labour and
Employment’s national average annual growth rate of days worked per year to obtain annual and
state-wise variation in male labor-days worked (Table 4). Because the number of female labor
11
days worked by state are unknown, we assume the national number of days worked and apply
the national growth rates from the Ministry of Labour and Employment. Our labor input thus
accounts not only for the number of male and female laborers but also their respective labor
intensities.
Wages for male laborers are reported as daily wages in rupees and are available annually
by state. The national wage rate for each year is computed as a labor-quantity weighted average
of state wages. Labor wages are simple averages across all operations (plowing, sowing,
reaping, harvesting, weeding, and transplanting). Female wages are unavailable for most years
and states. We employ the female-to-male labor wage ratios estimated by Mahajan and
Ramaswami (2012), enabling the use of adjusted male wages. Female-to-male wage ratios for
Himachal Pradesh are not provided by Mahajan and Ramaswami, so we assume the average of
neighbor states Haryana, Punjab, and Old UP.
Land
Land area is recorded in hectares, available annually, and quality-differentiated into four groups:
irrigated cropland, rainfed cropland, pasture, and fallow land. For the purposes of the present
analysis, we employ net land in production; that is, if a single hectare of land experiences
multiple cropping it is accounted for only once. This approach allows us to estimate the
contribution to input growth accounted for by investments in irrigation, the principal factor
enabling multiple plantings throughout a given year in much of India. Per-hectare land rental
value is estimated as revenue net of the expenditures of the five inputs for which prices are
available (labor, fertilizer, energy, livestock, and machinery) and divided by the quality-adjusted
hectares of rainfed-cropland equivalents.
12
Land quality weights are estimated following a similar method to that described in Fuglie
(2012). In the present analysis, we estimate the relative productivity impacts of differing types
of land by regressing, for each state, the logged real (2004) value of aggregate yields against the
share of land designated as rainfed cropland (RC), irrigated cropland (IC), pasture (P), and
fallow land (F),
(4) 7 ,
7 , 7 , 7 , 7 , 7 ,
7 ,
ln i t
i t i t i t i t i t
i t
T RR C IC P F
A
where TR is total revenues, specified in 2004 constant rupees; A is the sum of each land type; ,
, , and are coefficients to be estimated; i-7 indicates the inclusion of only the 16 Indian
states; t indicates time; and i t
is a normal error with mean zero and variance 2 . The
estimated coefficients from equation (4), once normalized by rainfed cropland’s parameter value,
provide the following quality weights used to aggregate each land type: irrigated cropland (3.83),
rainfed cropland (1.00), pasture (0.36), and fallow land (0.15). That is, irrigated land is assumed
3.82 times more productive than rainfed cropland, which in turn is more productive than other
land types. Our estimated irrigated-cropland weight is somewhat higher than the 2.99 weight
estimated by Fuglie (2012) for all developing Asian countries.
Materials
Material inputs consist of synthetic crop fertilizers and electricity consumed in the agricultural
sector and are recorded annually. Nitrogen, phosphate, and potash usage is recorded in metric
tons of active ingredient. Fertilizer prices are recorded in rupees per metric ton and are regulated
at the national level, although some state-wise variation of fertilizer prices exists due to state and
local taxes. Electricity consumption is recorded as kilowatt hours (kwh) per capita. State
electricity usage is estimated as per-capita consumption weighted by state population. Electricity
13
tariffs are specific to agriculture, are recorded as rupees per kwh, and are available from 1991 to
2008. 1980-1990 agricultural electricity tariff rates assume the general electricity tariff growth
rate for those years.
Capital
Capital inputs consist of farm machinery and livestock capital. Farm machinery is proxied by
the number of tractors in-use. Tractor service prices are from Evenson, et al. (1999) and the
FAO. Evenson, et al., note that tractor prices are invariant across Indian states and thus estimate
a single national rate from 1957 to 1987. That rate represents the price of an Eicher 24-
horsepower tractor, adjusted upwards to reflect the market share of machinery of higher
horsepower, and deflated by 25% to account for depreciation and debt services (Evenson, et al.,
1999). To extend this rate forward from 1987 to 2008, we assume the growth rate of the border
(export) price of an FAO agricultural tractor specific to India, converted from dollars to rupees
using World Bank (2012) conversion factors, and similarly depreciated.
Livestock capital inputs consist of on-farm stocks of cattle, buffalo, sheep, goats, and
pigs. These data are aggregated to cattle equivalents using Hayami and Ruttan’s (1985, p. 450)
cattle-normalized weights. An historical cattle sale price series, based on domestic or border
(export) information, is unavailable from Indian sources. Neither is one available from the FAO,
Indian cattle export data stop after 1995 and resume only sparsely after 2002. Rather, we employ
the Asian regional cattle export price, deflated by 15% to account for depreciation and any debt
services, as our livestock capital service price.
14
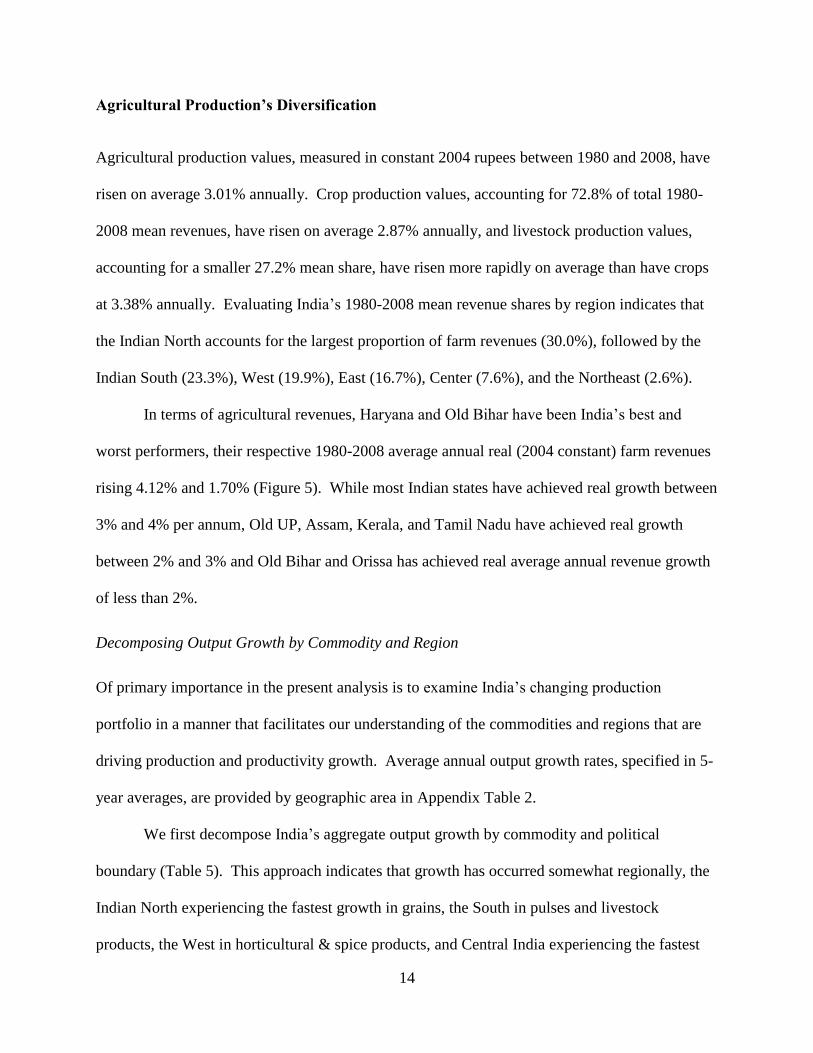
Agricultural Production’s Diversification
Agricultural production values, measured in constant 2004 rupees between 1980 and 2008, have
risen on average 3.01% annually. Crop production values, accounting for 72.8% of total 1980-
2008 mean revenues, have risen on average 2.87% annually, and livestock production values,
accounting for a smaller 27.2% mean share, have risen more rapidly on average than have crops
at 3.38% annually. Evaluating India’s 1980-2008 mean revenue shares by region indicates that
the Indian North accounts for the largest proportion of farm revenues (30.0%), followed by the
Indian South (23.3%), West (19.9%), East (16.7%), Center (7.6%), and the Northeast (2.6%).
In terms of agricultural revenues, Haryana and Old Bihar have been India’s best and
worst performers, their respective 1980-2008 average annual real (2004 constant) farm revenues
rising 4.12% and 1.70% (Figure 5). While most Indian states have achieved real growth between
3% and 4% per annum, Old UP, Assam, Kerala, and Tamil Nadu have achieved real growth
between 2% and 3% and Old Bihar and Orissa has achieved real average annual revenue growth
of less than 2%.
Decomposing Output Growth by Commodity and Region
Of primary importance in the present analysis is to examine India’s changing production
portfolio in a manner that facilitates our understanding of the commodities and regions that are
driving production and productivity growth. Average annual output growth rates, specified in 5-
year averages, are provided by geographic area in Appendix Table 2.
We first decompose India’s aggregate output growth by commodity and political
boundary (Table 5). This approach indicates that growth has occurred somewhat regionally, the
Indian North experiencing the fastest growth in grains, the South in pulses and livestock
products, the West in horticultural & spice products, and Central India experiencing the fastest
15
growth in oilseed production. Despite these regional differences, livestock production growth
has exceeded that of aggregate crop production in all regions apart from the Northeast. And
among crops, horticultural & spice production growth has experienced the most rapid growth in
all regions apart from the Indian North and Northeast. At the state level, this is particularly true
for Gujarat, Rajasthan, Maharashtra, and Andhra Pradesh.
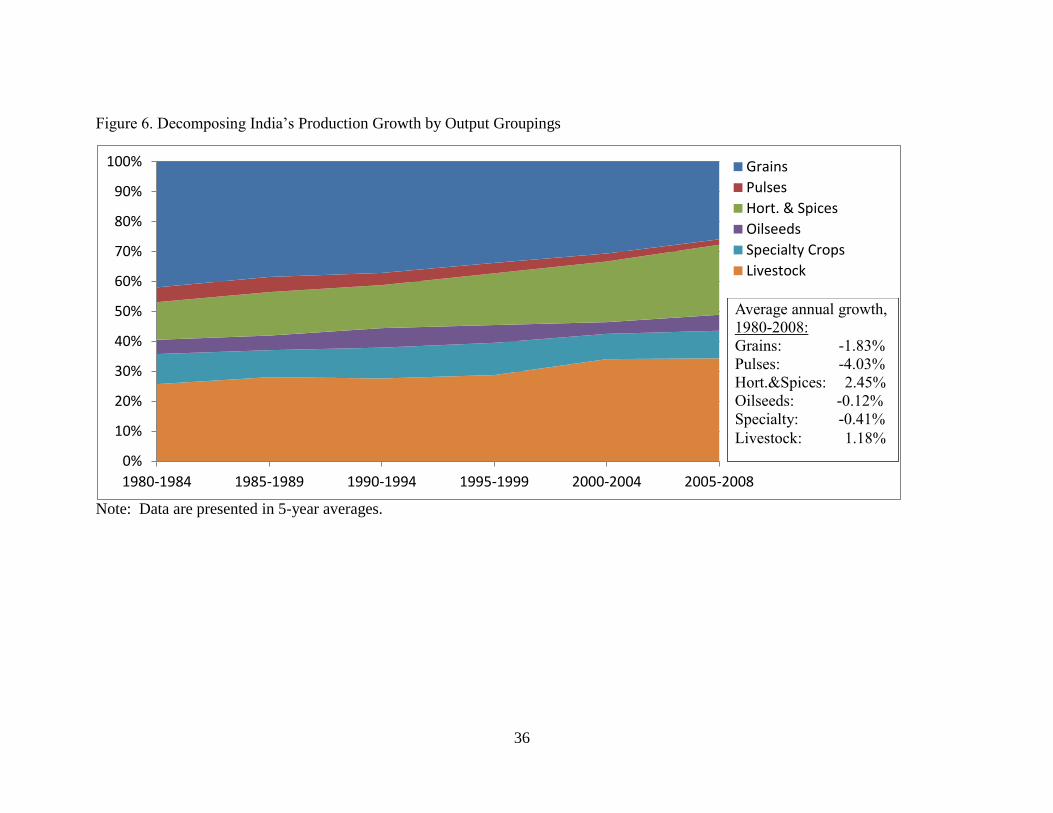
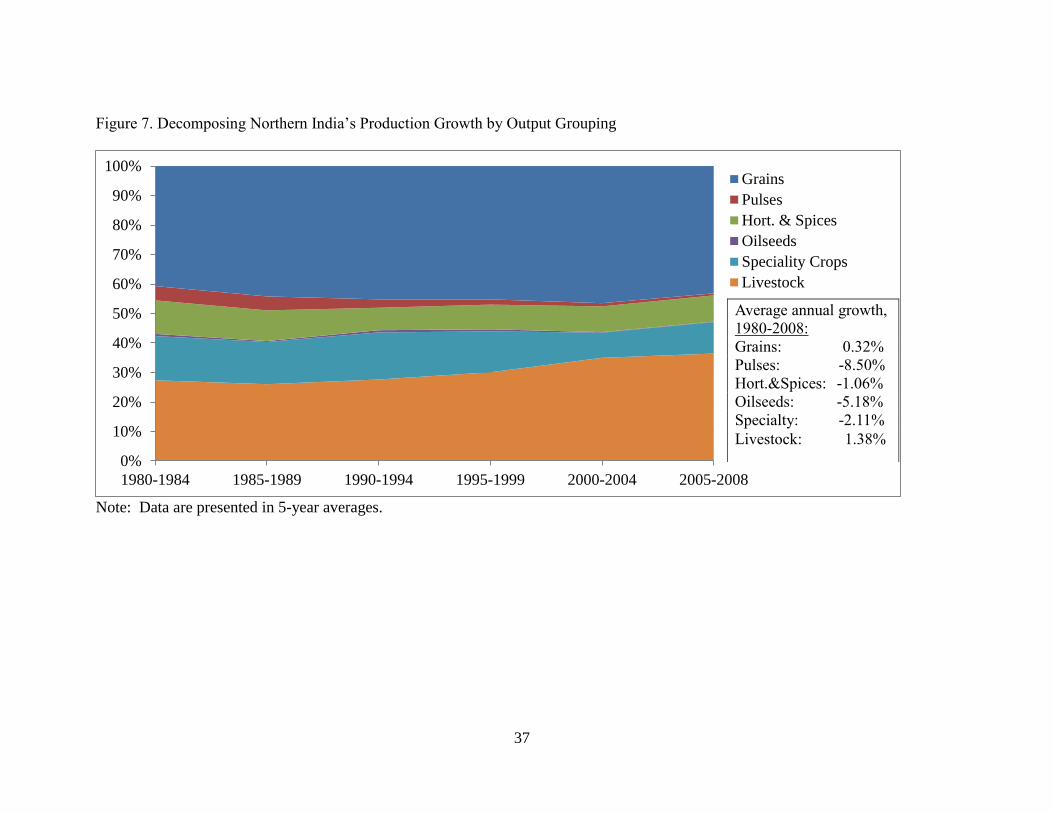
We further examine India’s shifting commodity production shares over time (Table 6).
At the national level, production of grains, pulses, oilseeds, and specialty crops have given way
to that of horticultural and livestock products (Figure 6). But this characterization does not hold
for all regions. For example, India’s North uniquely has been increasing its specialization in
grains (Figure 7), a strategy that has achieved the highest regional 1980-2008 mean revenue
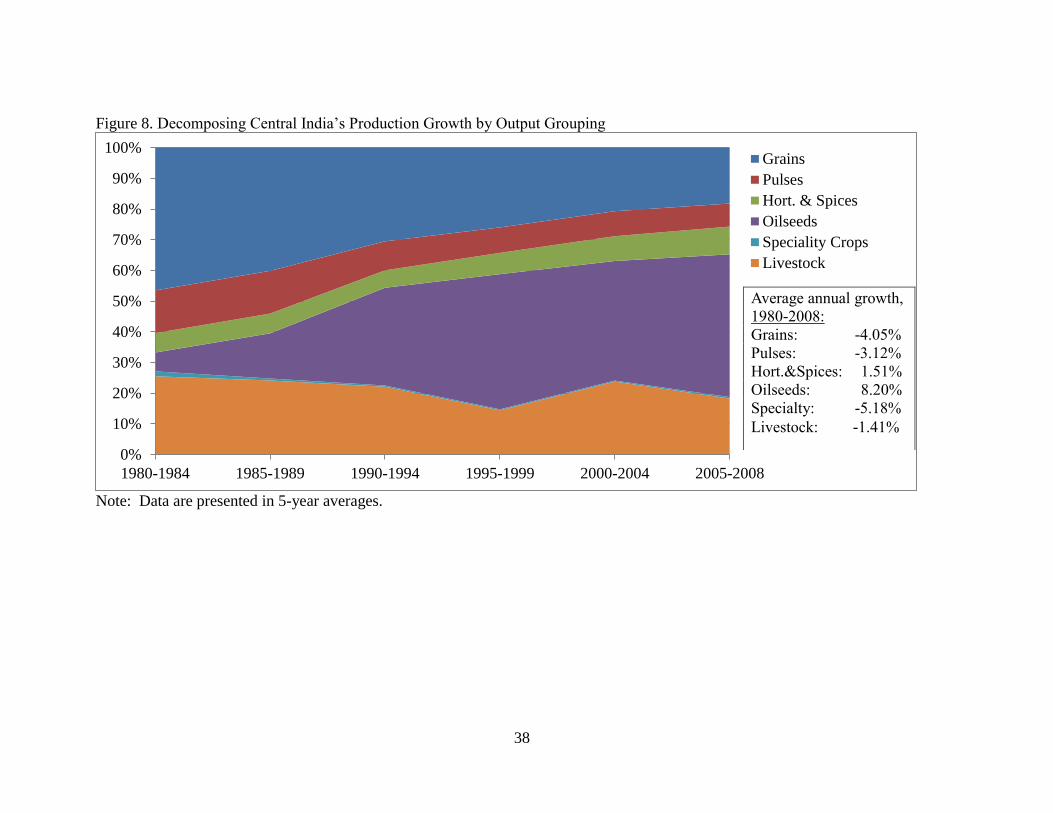
share but also a lower than national average output growth rate (Table 5). Central India’s (i.e.
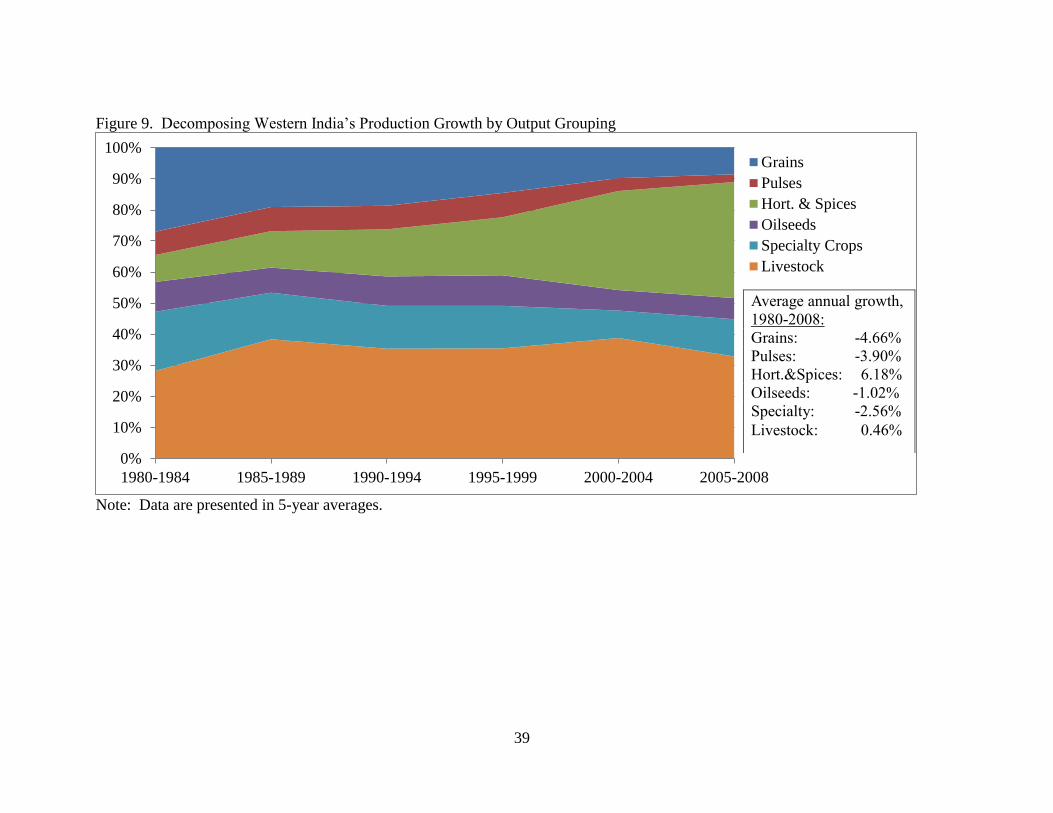
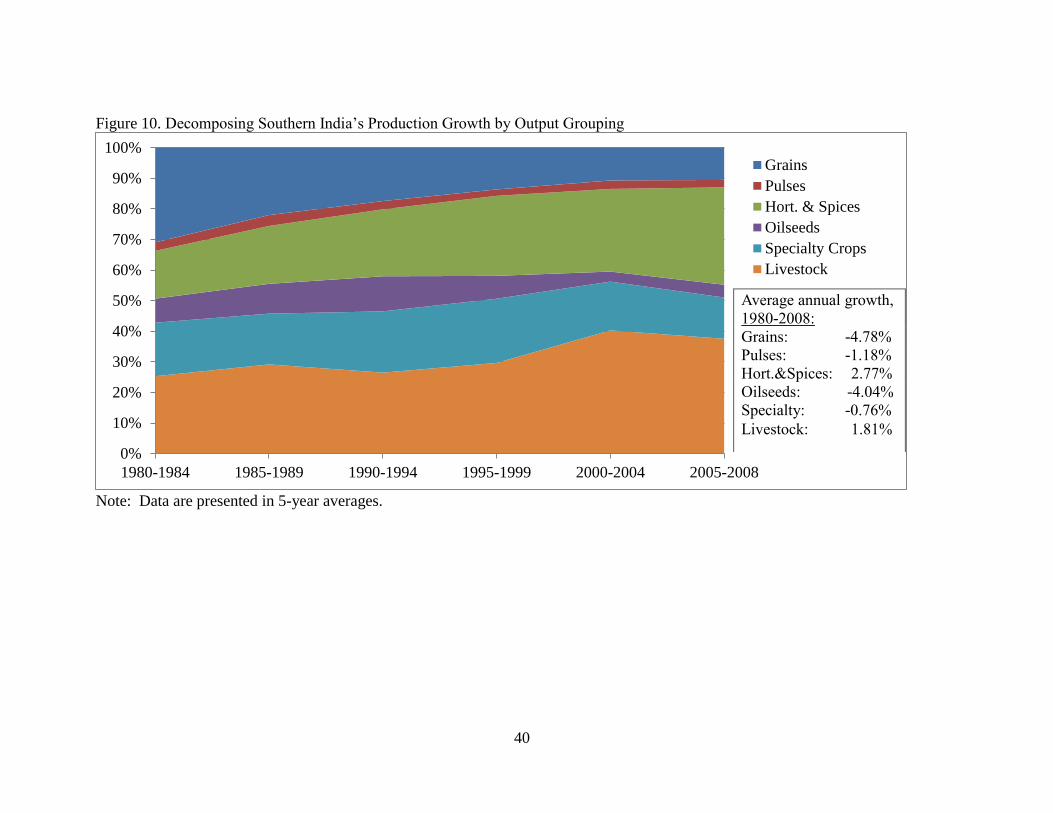
Madhya Pradesh) increasing concentration of oilseed production (Figure 8), and Western and
Southern India’s increasing concentration of horticultural commodities (Figures 9 and 10,
respectively) suggest that diversifying away from grain production may hold one key to India’s
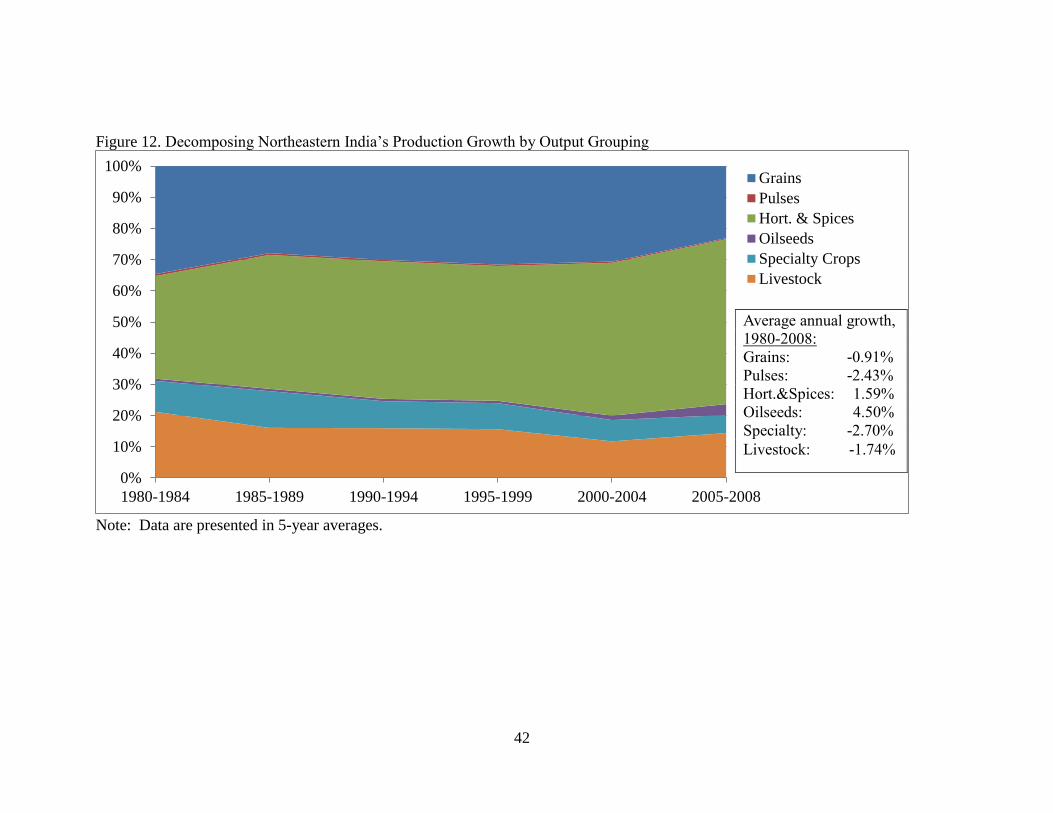
agricultural productivity renewal. This does not, however, appear to hold, as both Eastern and
Northeastern India have also experienced greater specialization in higher valued commodities
(Figures 11 and 12, respectively) yet aggregate production growth has been below that of the
Indian North (Table 5). While explaining TFP differences across states is beyond the scope of
the present analysis, the policy prescriptions required to boost growth in Eastern and
Northeastern India have long centered around greater investments in agricultural research and
improving market and transportation infrastructure (Chand, et al., 2011; Easter, et al., 1977).
16
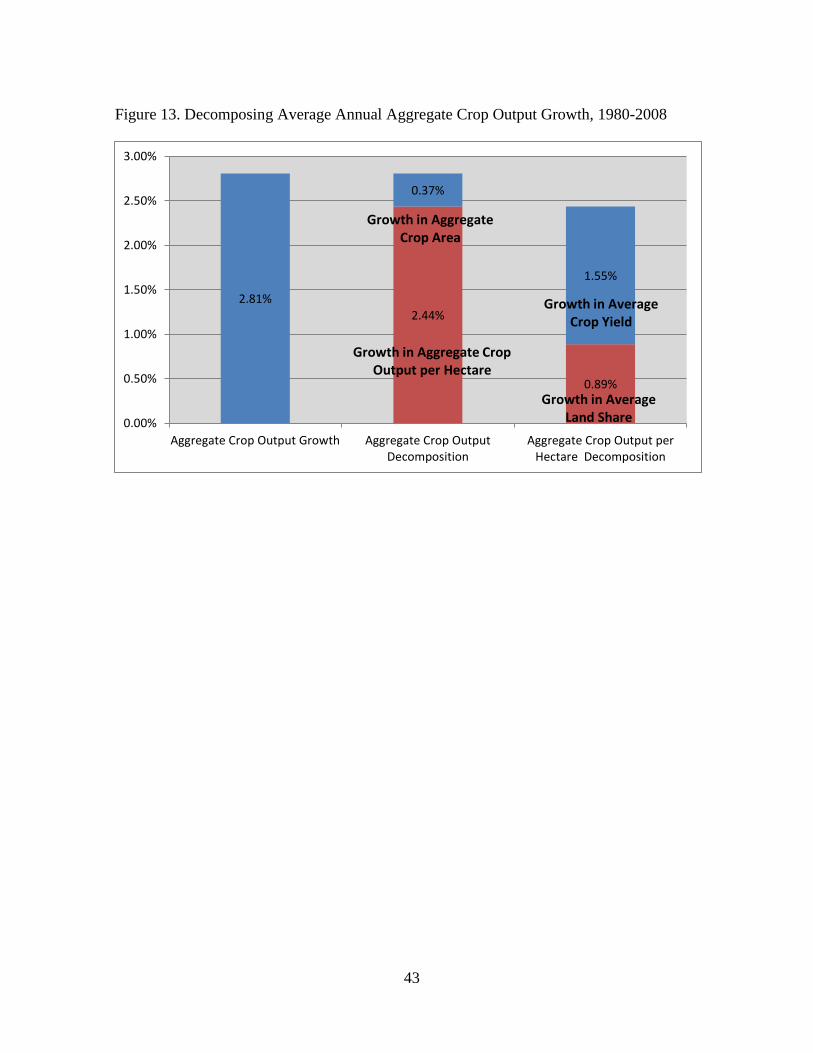
Decomposing Growth in Aggregate Crop Output per Hectare
A second approach to examining India’s output growth is by decomposing it into growth due to
area expansion (extensification) and growth due to raising aggregate crop output per hectare
(intensification). Growth in aggregate crop output per hectare is further decomposed into
changes in average commodity yields and changes in land allocations to higher valued
commodities. Employing equation (4) and specifying land as gross area sown for each crop, we
find that 13% of India’s output growth is accounted for by expanding land in production, 55% by
raising average crop yields, and 32% by re-allocating resources to produce higher valued
commodities (Table 13).6 These results indicate that half of India’s aggregate output growth is
due to improving average crop yields and half is due to incorporating new land in production and
shifting existing land in production to higher valued commodities.
At the commodity level, to the extent that we may characterize India’s production
diversification as one from grains to horticultural products, we find grain production is largely
propelled by improving technologies and management practices and increasing the materials,
labor, and capital applied, while horticulture production is largely propelled by land
extensification and shifting existing land in production to higher valued crops. More
specifically, we find that 87% of grain production growth has been due to increasing average
crop yields, whereas 76% of horticulture & spice production growth has been due to increasing
area planted and re-allocating land to higher valued commodities. Growth in pulses, oilseeds,
and specialty crops appears nearly equally divided between crop yield growth and extensification
plus shifting land shares, pulses leaning more toward crop yield growth and oilseeds and
specialty crops more toward land expansion and land re-allocation.
17
Factor Accumulation
Among India’s farm production factors, machinery capital inputs have grown on average the
fastest at 8.9% per annum, 2008 tractors in-use reaching 4.6 million, up from 374 thousand in-
use in 1980. Machinery growth has been greatest in Orissa, Himachal Pradesh, and Old Madhya
Pradesh, their respective 1980-2008 average annual growth rates rising 15%, 13%, and 11%.
Interestingly, the slowest growth in machinery capital has come from Punjab, the number of
tractor in use in that state rising only 5.2% on average each year over the reference period. Of
course, evaluating only growth rates obscures the fact that Punjab accounted for 27% of 1980
Indian tractors in-use.
Energy and fertilizer consumption has also accelerated rapidly, total kilowatt hours
consumed between 1980 and 2008 in the agricultural sector rising on average 7% per annum and
synthetic fertilizer applications of active ingredient rising on average 4.3% per annum.
Karnataka appears to have had the greatest increase in energy consumption, total kilowatt hours
consumed rising 11.6% per annum. Old Madhya Pradesh and West Bengal were not far behind,
their respective energy consumption rising by 10.9% and 10.5% per annum. Old Bihar is the
Indian state with the lowest growth in energy consumption. Fertilizer applications rose very
rapidly in Assam, average annual growth reaching 10.8%. Most states, however, experienced
growth rates near the national average and ranged from 1.74% per annum growth in Tamil Nadu
to 6.9% per annum growth in Rajasthan.7
Growth in India’s livestock capital (herd size in cattle-equivalents) has been marginal at
0.7% per annum. There has, however, been substantial variation among states. For instance,
Kerala’s livestock capital has decreased on average by 2.8% each year, whereas Old Bihar’s
livestock capital growth rate has exceeded all Indian states at 1.8% each year, just greater than
18
Gujarat’s rate of 1.6% each year. These figures, however, lack stocks of poultry on farms and
therefore likely underestimate livestock capital input growth, particularly since poultry has been
a primary driver of livestock production growth over the previous thirty years.
Labor inputs have increased by an average annual 0.67% between 1980 and 2008.
Because the labor inputs are a product of labor counts (employment) and labor intensity (days
worked), it is interesting to note that total employment rose by 0.85% per annum but that the
annual number of days worked fell by 0.27% per annum. Aggregate labor input growth was
primarily driven by a 1.6% increase in female labor, male labor increasing by a much lower
0.23%. Interestingly, though, we find that since 1999, not only has the intensity of labor
decreased, but employment levels have also declined. More specifically, total employment
between 1999 and 2008 fell by an average of 1.34% per annum, driven primarily by a release of
female labor. Among Indian states, Kerala and Tamil Nadu were alone in experiencing a decline
in labor over the entire 1980-2008 period.
Total quality-adjusted hectares, in rainfed-equivalents, have grown slowly, rising
between 1980 and 2008 on average 0.8% each year. Only in Assam has the number of rainfed-
equivalent hectares declined, falling on average 1.5% per annum, led by an average annual 7.3%
decrease in net irrigated area. The highest average annual growth rate of land in production has
occurred in West Bengal (1.5%) and Rajasthan (1.4%), these states experiencing the fastest
average annual growth in net irrigated area of 2.82% and 2.88%, respectively.
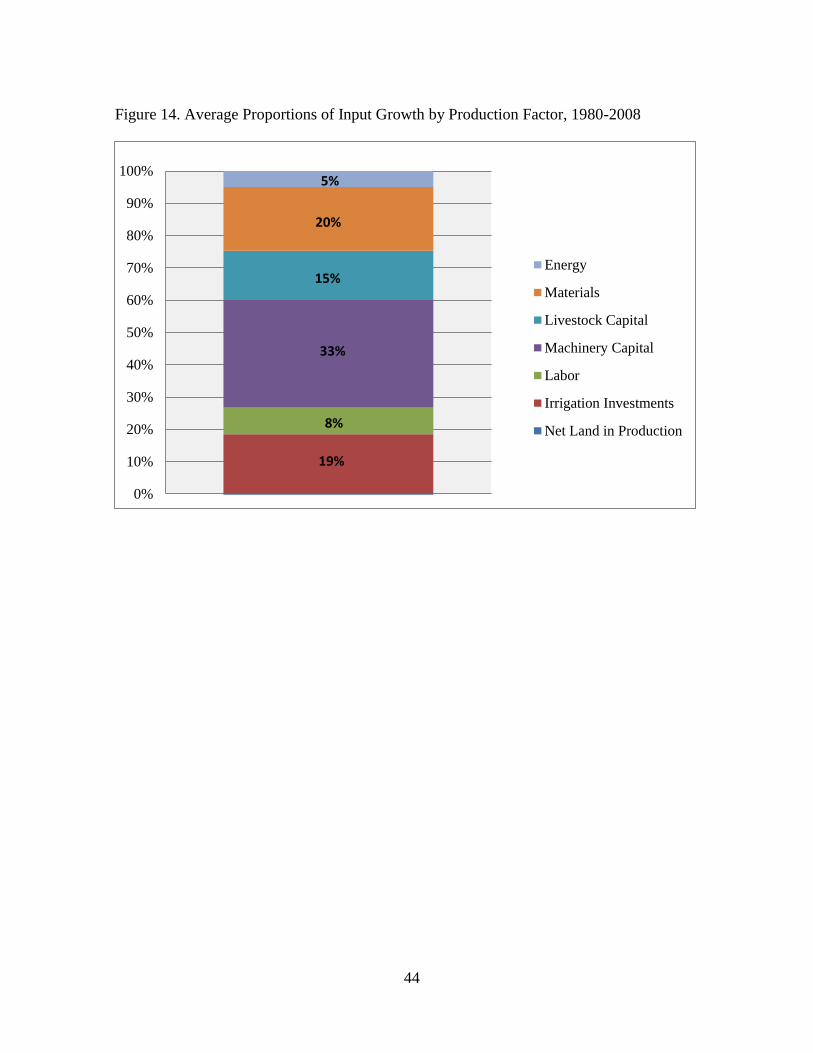
Our purpose in estimating quality-adjusted land is to account for irrigation investments
that enable multiple crop plantings and, in concert with seed-fertilizer technologies, aid in
boosting crop yields. Net cropland in production has actually remained stagnant over the 1980-
2008 period, falling by 0.02% per annum. The difference between the cost-share weighted net
19
cropland growth rate and the cost-share weighted rainfed-equivalent growth rate is the estimated
contribution to input growth accounted for by irrigation investments. We estimate that irrigation
investments accounted for 19% of India’s 1980-2008 mean input growth rate (Figure 14). Note
that because net land in production remained stagnant, it did not contribute to input growth.
Because we employ a ‘returns-to-land’ approach to measuring land’s cost share, some
states experienced negative land cost shares. Five states experienced a substantial number of
years in which land’s cost share was negative (Himachal Pradesh, Rajasthan, Old Madhya
Pradesh, Old Bihar, and Kerala), nearly one per region. For Himachal Pradesh, Rajasthan, Old
Bihar, and Kerala, we assume each state’s respective regional cost share. Old Madhya Pradesh,
however, is its own region. We therefore apply the average of neighbor states (Old UP, Old
Bihar, Rajasthan, Maharashtra, Andhra Pradesh, and Orissa). For those states that experienced a
one- or two-year negative land cost share, we average the prior and subsequent year’s values in
that state.
Weighting each of the inputs described above are factor cost shares, available in 5-year
averages from Table 8. The cost share estimates suggest that labor expenditures are largely
driving farm labor costs. However, labor cost shares appear to have declined concurrent with
machinery capital’s acceleration. We note that our 1985-1989 cost shares are very similar to the
1987 shares presented by Evenson, et al. (1999).
Combining the input growth rates with the cost shares depicted in Table 8, we estimate
that India’s average annual Tornqvist-Theil input growth between 1980 and 2008 has increased
1.23%. We find that while labor has had the greatest cost share, the swiftly rising tractor inputs
have contributed the most to national input growth, accounting for 33% of that 1.23% average
annual rate (Figure 14). Materials have contributed a further 20% to that growth rate, and
20
irrigation investments – or the capital stock of irrigation – have contributed another 19%.
Somewhat surprisingly, labor has only accounted for 8% of national input growth. Energy and
livestock capital inputs account for the remaining contributions to input growth.
Total Factor Productivity Growth
Total factor productivity indexes and average annual growth rates, for the entire agricultural
sector and across the 1980-2008 period, are provided at the national and regional levels in Table
9, and by region and state in Tables 10-14.
As India has transitioned to a more diversified production composition, agriculture has
experienced a renewal of TFP growth. We find that India’s experienced strong average annual
TFP growth of 3.60% in the 1980s, that growth slowing to 1.32% in the 1990s, but then
accelerating to 3.08% between 2000 and 2008. For the entire 1980-2008 period, India’s average
annual TFP growth rate has been 1.9%. Among Indian states, only Orissa has achieved TFP
growth of less than 1% on average each year, whereas Andhra Pradesh and Kerala have achieved
TFP growth exceeding 3% per year. All remaining states achieved productivity growth rates
between 1% per annum and 3% per annum over the reference period.
Surprisingly, India’s northern region achieved the regional-lowest average annual 1980-
2008 TFP growth rate of 1.38% (Table 9). The North’s low productivity growth rate is a
reflection of its deepening specialization in grains and its high-input intensification production
processes. Indeed, as farmers transitioned to higher valued commodities, the fastest TFP growth
rates have occurred in the Indian South and West, both regions driving the national average
(Table 9). These results together indicate that as India has transitioned out of the Green
Revolution, productivity growth has accelerated most rapidly in those regions which have
21
focused on meeting consumer demands for higher valued commodities such as horticultural and
livestock products.
Prominent in Western India’s productivity indexes are wide variations in year-to-year
production typical rainfed agriculture. While Rajasthan and Maharashtra have achieved greater
average annual productivity growth over the entire reference period, Gujarat has experienced the
greatest growth since year 2000 (Table 11). Gujarat’s 2000-2008 average annual TFP growth
rate has accelerated at a 9.8% rate, far greater than the 1.1% and 1.4% decadal-average TFP
growth rates it experienced in the 1980s and 1990s. What may account for such a high TFP
growth rate? Singh and Pal (2010) note that since 1999 Gujarat has experienced 9.6% per-
annum growth in agricultural GDP. Moreover, Gujarat has experienced low average annual
input growth in the 2000s of 0.4%. Driving that low input growth have been declining labor
inputs (-1.4%/annum) that have nearly offset growth contributions from all other inputs.
The Indian South has been the top regional agricultural performer over the previous three
decades, its TFP growth rate between 1980 and 2008 reaching an average of 2.86% each year,
well above all other regions and driving the national average. While productivity growth in this
region has been driven by the performance of Andhra Pradesh and Kerala, the factors behind
each of their TFP growth rates differ. For instance, while both states increased their production
of livestock products, Andhra Pradesh achieved the highest average annual output growth rate
(4.10%) among southern states by increasing its specialization in horticultural crops, whereas
Kerala achieved the lowest growth rate (2.38%) as it increased its specialization in specialty
crops (Table 5). Moreover, while both states experienced negative input growth over the 2000s,
Andhra Pradesh’s 2000-2008 average annual input growth rate decline of 0.24% is much smaller
than Kerala’s substantial average annual input growth rate decline of 2.08%. Indeed, Kerala’s
22
exiting labor force (-1.47%/annum) and declining animal stocks (-2.78%/annum) have more than
offset increases in land (0.43%/annum), machinery (6.48%/annum), materials (2.13%/annum),
and energy (3.50%/annum). Thus, while Andhra Pradesh achieved high TFP growth through
increasing production, Kerala achieved high TFP growth through decreasing input usage.
India’s East, Center, and Northeast regions achieved productivity growth rates below the
national average (Table 9). That is not to say there was not a high-performing state in these
regions. Indeed there was, West Bengal achieving a strong average annual TFP growth rate of
2.74%, much higher than the East’s 1.79% rate (Table 11). West Bengal increased its
specialization in horticultural crops at the expense of greater grain and livestock production,
leading it to have the highest crop production growth rate between 1980 and 2008 among all
Indian states (Table 5).
Conclusions and Extensions
India has experienced substantial economic and agricultural growth over the previous thirty
years. As consumers have shifted preferences to higher-valued goods such as horticultural and
livestock products, the agricultural sector has responded to meet those demands, particularly in
the Indian South and West. In doing so, these two regions have also achieved India’s highest
agricultural TFP growth rates. Yet the routes by which some states achieved their high growth
rates differ; some accelerated productivity growth by boosting production while others limited
input growth. This leads one to question the long-term sustainability of the productivity growth
experienced by states which minimized input usage.
A potential concern for Indian policymakers has been the relatively poor farm
performance of the Indian North. As this region has deepened its specialization in grain
production to meet policymakers’ goal of wheat and rice self-sufficiency, it has achieved the
23
regional-lowest TFP growth rate over the previous three decades. If this region is to continue
providing the cereal grains consumed throughout India, greater emphasis should be placed on
reversing the declining trend in cereal grain yield and TFP growth rates experienced over the
previous decades. We do present, however, some new evidence that suggests recent wheat and
rice yield growth rates may already be improving.
India’s agricultural production growth has been led by the livestock sub-sector, although
crops have also achieved strong growth. But not all of the crop production growth has been
technologically driven; transitioning to higher valued crops has accounted for 36.5% of India’s
growth in aggregate crop production per hectare. Moreover, the 2000-2008 period may be
dubbed a ‘growth-favoring’ period, as reflected by the paltry 0.17% average annual input growth
rate and the robust 3.25% average annual output growth rate. Driving down aggregate input
growth over this period has been a release of labor since 1999. Indeed, only Assam and Haryana
did not experience that release of labor, their labor counts continuing to growth. One potential
factor helping motivate India’s agricultural growth renewal has been declining discrimination
against agriculture from macro and price policies. India’s nominal rates of assistance to
agriculture, a measure indicating the distortion to gross agricultural returns induced by policy
interventions, suggest that 2002 was the first year Indian farmers have experienced positive
terms of trade (Anderson and Valenzuela, 2008). Positive agricultural terms of trade incentivize
increased private investment in new technologies and innovative management practices that
assist in boosting production possibilities.
One of the strongest criticisms that may be leveled at the present analysis is the use of a
returns-to-land approach to measuring land’s cost share. An alternative approach to explore is
employing cost of production information to generate land rental rates. Other important
24
limitations of the present analysis include a lack of feed input to livestock production and on-
farm poultry stocks. Including these two should boost the stagnant growth in livestock capital
and account for more of the robust growth in meat production. Despite these possible changes,
presented in the present analysis is the broadest and most up-to-date depiction of agricultural
growth and agricultural TFP growth across Indian regions and states.
Extensions to this research include estimating the marginal impacts of irrigation
investments by type (tube-well, irrigation canal, etc.) and agricultural research investments at the
national and state levels. Understanding the role of various types of irrigation in India is
important, particularly given the increasing reliance on private investment in tube-well irrigation
(Akermann, 2012). Other policies that may be examined include agricultural development
investments, market and transportation infrastructural investments, and human capital
investments.
25
Acknowledgements
I would like to express my gratitude to Keith Fuglie of USDA’s Economic Research Service
(ERS) for his helpful insights and comments throughout the process of developing this
study. I would also like to extend special thanks to the International Food Policy Research
Institute in New Delhi, India (IFPRI-Delhi) for their data collection efforts, and in particular
to Ganesh Kumar Anand and Sanjay Kumar Prasad. I am also grateful for information
provided by Madhur Gautum of the World Bank, Bharat Ramaswami of the Indian
Statistical Institute, Rajesh Mehta of India’s Research and Information System for
Developing Countries (RIS), Maurice Landes of USDA’s Economic Research Service
(ERS), Chris Dicken of USDA’s Economic Research Service (ERS), and Claire Mezoughem
of USDA’s Foreign Agricultural Service (FAS). This project was funded by a cooperative
agreement between the International Food Policy Research Institute-New Delhi and the
Economic Research Service, USDA.
26
References
Akermann, R., 2012. New Directions for Water Management in Indian Agriculture. Global
Journal of Emerging Market Economies 4 (2): 227-288.
Alston, J., G. Norton and P. Pardey, 1995. Science under Scarcity:
Principles and Practice for Agricultural Research Evaluation and Priority Setting,
Cornell University Press, Ithaca NY.
Alston, J., J. Beddow, and P. Pardey, 2009. Agricultural Research, Productivity, and Food
Prices in the Long Run, Science, vol. 325, September 4, 2009. Available at:
http://www.sciencemag.org.
Avila, A., and R. Evenson, 2010. Total Factor Productivity Growth in Agriculture: The
Role of Technology Capital, in Handbook of Agricultural Economics, (eds.) Pingali
and Evenson, volume 4, p. 475-486. Elsevier, Amsterdam, the Netherlands.
Binswanger-Mkhize, H. and A. d’Souza. 2012. Structural Transformation and Agricultural
Productivity in India, in Productivity Growth in Agriculture: An International
Perspective, (eds.) Fuglie, Wang, and Ball, Chapter 9, p. 181-198.
Birthall, P., A. Kumar, A. Ravishankar, and U. Pandey, 1999. Sources of Growth in
Livestock Sector. Policy Paper No. 9, New Delhi: National Centre for Agricultural
Economics and Policy Research (NCAP).
Capalbo, S., and T. Vo, 1988. A Review of the Evidence on Agricultural Productivity and
Aggregate Technology. In: S. Capalbo and J. Antle (Eds.), Agricultural Productivity:
Measurement and Explanation, Washington, D.C.: Resources for the Future.
27
Caves, D., L. Christensen, and W. Diewert, 1982. The Economic Theory of Index Numbers
and the Measurement of Input, Output, and Productivity. Econometrica 50 (6):
1393-1414.
Chand, R. and S. Parappurathu, 2012. Temporal and Spatial Variations in Agricultural
Growth and its Determinants, Review of Rural Affairs, Economic and Political
Weekly Supplement 47 (26 & 27): pp. 55-67. June 30, 2012.
Chand, R., P. Kumar, and S. Kumar, 2011. Total Factor Productivity and
Contribution of Research Investment to Agricultural Growth in India. National
Centre for Agricultural Economics and Policy Research (NCAP). Policy Paper 25.
Coelli, T., and D.S.P. Rao, 2005. Total Factor Productivity Growth in Agriculture:
Malmquist Index Analysis for 93 Countries, 1980-2000. Agricultural Economics 32,
115-134.
Deasi, B. and N. Namboodiri, 1998. “Determinants of Total Factor Productivity in
Indian Agriculture. Economic and Political Weekly, 32 (52): 165-171.
Diewert, W., 1976. Exact and Superlative Index Numbers. Journal of Econometrics, 4:
115-145.
Easter, W., M. Abel, and G. Norton, 1977. Regional Differences in
Agricultural Productivity in Selected Areas of India. American Journal of
Agricultural Economics, 59 (2): 257-265.
Evenson, R., and Y. Kislev, 1975. Agricultural Research and Productivity. Yale University
Press, New Haven, Connecticut.
28
Evenson, R., C. Pray, and M. Rosegrant, 1999. Agricultural Research and Productivity
Growth in India. International Food Policy Research Institute (IFPRI) Research
Report 119, Washington, D.C. Data were compiled by A. Sanghi, K. Kumar, and W.
McKinsey, Jr., and are available:
http://ipl.econ.duke.edu/dthomas/dev_data/datafiles/india_agric_climate.htm.
FAS, 2013. Production, Supply, and Distribution database, Foreign Agricultural Service
(FAS), U.S. Department of Agriculture. Available at:
http://www.fas.usda.gov/psdonline/psdHome.aspx. Accessed February, 2013.
Fan, S., P. Hazell, and S. Thorat, 1999. Linkages between Government
Spending, Growth, and Poverty in Rural India. International Food Policy Research
(IFPRI) Report 110. Washington, D.C.
Fan, S., and P. Hazell, 2000. Are Returns to Public Investment Lower in Less-Favored
Areas? An Empirical Analysis of India. Economic and Political Weekly 35: 1455-
1464.
Fuglie, K.O., 2004. Productivity Growth in Indonesian Agriculture, 1961-2000. Bulletin of
Indonesian Economic Studies 40 (2): 209-225.
Fuglie, K.O., 2012. Productivity Growth and Technology Capital in the Global Agricultural
Economy, in, Productivity Growth in Agriculture: An International Perspective
(eds.) Fuglie, Wang, and Ball, Chapter 16. CAB International, Oxfordshire, United
Kingdom.
GOI, 2010. Rural Labour Enquiry, Report on Wages & Earnings of Rural Labour
Households. Government of India (GOI), Ministry of Labour and Employment,
Labour Bureau, 2010.
29
Hayami, Y., and V. Ruttan, 1985. Agricultural Development. The Johns Hopkins
University Press, Baltimore, MD.
Jorgenson, D., and Z. Griliches, 1967. The Explanation of Productivity Change. The
Review of Economic Studies (34)3: 249-283.
Kumar, P., S. Mittal, and M. Hossain, 2008. Agricultural Growth
Accounting and Total Factor Productivity in South Asia: A Review and Policy
Implications. Agricultural Economics Research Review, 21: 145-172.
Mahajan, K., and B. Ramaswami, 2012. Caste, Female Labor Supply, and the Gender Wage
Gap in India: Boserup Revisted. Conference paper for the 7th
Institute for the Study
of Labor (IZA)/World Bank Conference: Employment and Development, November
4-6, 2012, New Delhi, India. Available at:
http://www.iza.org/conference_files/worldb2012/viewProgram?conf_id=2248.
Mehta, R., R Nambiar, C. Delgado, S. Subramanyam, 2003. Annex II: Livestock
Industrialization, Project Phase II – Policy, Technical, and Environmental
Determinants and Implications of the Scaling-up of Broiler and Egg Production in
India, in C. Delgado, C. Narrod, and M. Tiongco, 2003, Policy, Technical, and
Environmental Determinants and Implications of the Scaling-Up of Livestock
Production in Four Fast-Growing Developing Countries: A Synthesis Available at:
http://www.fao.org/WAIRDOCS/LEAD/X6170E/x6170e00.htm.
Murgai, R., M. Ali, and D. Byerlee, 2001. Productivity Growth and Sustainability in Post-
Green Revolution Agriculture: The Case of the Indian and Pakistan Punjabs. World
Bank Research Observer (16) 2: 199-218.
30
Ray, D., N. Ramankutty, N. Mueller, P. West, and J. Foley, 2012. Recent Patterns of Crop
Yield Growth and Stagnation. Nature Communications, 3 (1293), doi:
10.1038/ncomms2296.
Rosegrant, M., and R. Evenson, 1992. Agricultural Productivity and Sources of
Growth in South Asia. American Journal of Agricultural Economics, 74 (3): 757-
761.
Shreedhar, G., N. Gupta, H. Pullabhotla, A. Ganesh-Kumar, and A. Gulati, 2012. A Review
of Input and Output Policies for Cereals Production in India. International Food
Policy Research Institute (IFPRI) Discussion Paper 01159. New Delhi, India.
Singh, A., and S. Pal. 2010. The Changing Patter and Sources of Agricultural Growth in
India, in The Shifting Patterns of Agricultural Production and Productivity
Worldwide, eds., J. Alston, B. Babcock, and P. Pardey, The Midwest Agribusiness
Trade Research and Information Center, Iowa State University. Ames, Iowa.
World Bank, 2012. World Development Indicators On-Line. World Bank, Washington,
D.C. Available at: http://www.worldbank.org/. Accessed December, 2012.

31
Figure 1. Map of Indian Regions and States
Note: Note: For the purposes of data consistency, Jharkhand is combined with Bihar to
form Old Bihar, Madhya Pradesh with Chhattisgarh to form Old Madhya Pradesh, and Uttar
Pradesh with Uttaranchal to form Old Uttar Pradesh. These states split in year 2000.
32
Figure 2. Comparing Meat Production Volumes
Note: Government of India (GOI) meat volumes include buffalo, cattle, goat, sheep, pig,
and poultry meat. Foreign Agricultural Organization (FAO) meat volumes include buffalo,
cattle, goat, sheep, pig, chicken and duck meat. Production, Supply, & Distribution (PS&D,
FAS, U.S. Department of Agriculture) meat volumes include buffalo and cattle meat, pig
meat, and poultry meat.
0.00
1.00
2.00
3.00
4.00
5.00
6.00
Mill
ion
s o
f M
etr
ic T
on
s
GOI
FAO
PS&D (FAS, USDA)
33
Figure 3. Comparing Meat Production Values
Note: Government of India (GOI) meat values include buffalo, cattle, goat, sheep, pig, and
poultry meat. Foreign Agricultural Organization (FAO) meat values include buffalo, cattle,
goat, sheep, pig, chicken and duck meat.
0
100
200
300
400
500
600
Trill
ion
s o
f C
urr
en
t R
up
ee
s
GOI
FAO
34
Figure 4. Comparing an Alternative Indian Meat Volume Series
Note: Government of India (GOI) meat volumes include buffalo, cattle, goat, sheep, pig,
and poultry meat. Foreign Agricultural Organization (FAO) meat volumes include buffalo,
cattle, goat, sheep, pig, chicken and duck meat. Production, Supply, & Distribution (PS&D,
FAS, U.S. Department of Agriculture) meat volumes include buffalo and cattle meat, pig
meat, and poultry meat. The India-Alt variable is derived from GOI state meat values and
FAO national meat prices.
0.00
1.00
2.00
3.00
4.00
5.00
6.00
7.00
Mill
ion
s o
f M
etr
ic T
on
s
GOI
FAO
PS&D (FAS, USDA)
India-Alt

35
Figure 5. Average Annual Real (2004) Farm Revenue Growth by Indian State, 1980-2008
0.00%
0.50%
1.00%
1.50%
2.00%
2.50%
3.00%
3.50%
4.00%
4.50%
36
Figure 6. Decomposing India’s Production Growth by Output Groupings
Note: Data are presented in 5-year averages.
0%
10%
20%
30%
40%
50%
60%
70%
80%
90%
100%
1980-1984 1985-1989 1990-1994 1995-1999 2000-2004 2005-2008
Grains
Pulses
Hort. & Spices
Oilseeds
Specialty Crops
Livestock
Average annual growth,
1980-2008:
Grains: -1.83%
Pulses: -4.03%
Hort.&Spices: 2.45%
Oilseeds: -0.12%
Specialty: -0.41%
Livestock: 1.18%
37
Figure 7. Decomposing Northern India’s Production Growth by Output Grouping
Note: Data are presented in 5-year averages.
0%
10%
20%
30%
40%
50%
60%
70%
80%
90%
100%
1980-1984 1985-1989 1990-1994 1995-1999 2000-2004 2005-2008
Grains
Pulses
Hort. & Spices
Oilseeds
Speciality Crops
Livestock
Average annual growth,
1980-2008:
Grains: 0.32%
Pulses: -8.50%
Hort.&Spices: -1.06%
Oilseeds: -5.18%
Specialty: -2.11%
Livestock: 1.38%
38
Figure 8. Decomposing Central India’s Production Growth by Output Grouping
Note: Data are presented in 5-year averages.
0%
10%
20%
30%
40%
50%
60%
70%
80%
90%
100%
1980-1984 1985-1989 1990-1994 1995-1999 2000-2004 2005-2008
Grains
Pulses
Hort. & Spices
Oilseeds
Speciality Crops
Livestock
Average annual growth,
1980-2008:
Grains: -4.05%
Pulses: -3.12%
Hort.&Spices: 1.51%
Oilseeds: 8.20%
Specialty: -5.18%
Livestock: -1.41%
39
Figure 9. Decomposing Western India’s Production Growth by Output Grouping
Note: Data are presented in 5-year averages.
0%
10%
20%
30%
40%
50%
60%
70%
80%
90%
100%
1980-1984 1985-1989 1990-1994 1995-1999 2000-2004 2005-2008
Grains
Pulses
Hort. & Spices
Oilseeds
Specialty Crops
Livestock
Average annual growth,
1980-2008:
Grains: -4.66%
Pulses: -3.90%
Hort.&Spices: 6.18%
Oilseeds: -1.02%
Specialty: -2.56%
Livestock: 0.46%
40
Figure 10. Decomposing Southern India’s Production Growth by Output Grouping
Note: Data are presented in 5-year averages.
0%
10%
20%
30%
40%
50%
60%
70%
80%
90%
100%
1980-1984 1985-1989 1990-1994 1995-1999 2000-2004 2005-2008
Grains
Pulses
Hort. & Spices
Oilseeds
Specialty Crops
Livestock
Average annual growth,
1980-2008:
Grains: -4.78%
Pulses: -1.18%
Hort.&Spices: 2.77%
Oilseeds: -4.04%
Specialty: -0.76%
Livestock: 1.81%
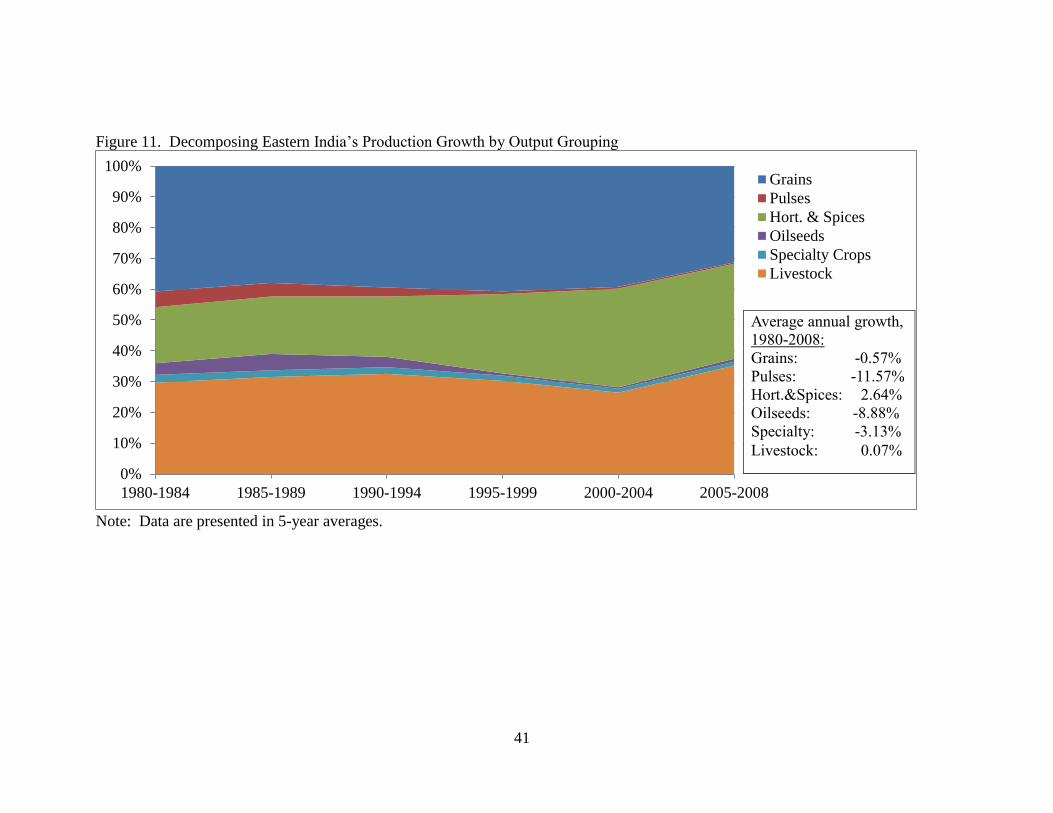
41
Figure 11. Decomposing Eastern India’s Production Growth by Output Grouping
Note: Data are presented in 5-year averages.
0%
10%
20%
30%
40%
50%
60%
70%
80%
90%
100%
1980-1984 1985-1989 1990-1994 1995-1999 2000-2004 2005-2008
Grains
Pulses
Hort. & Spices
Oilseeds
Specialty Crops
Livestock
Average annual growth,
1980-2008:
Grains: -0.57%
Pulses: -11.57%
Hort.&Spices: 2.64%
Oilseeds: -8.88%
Specialty: -3.13%
Livestock: 0.07%
42
Figure 12. Decomposing Northeastern India’s Production Growth by Output Grouping
Note: Data are presented in 5-year averages.
0%
10%
20%
30%
40%
50%
60%
70%
80%
90%
100%
1980-1984 1985-1989 1990-1994 1995-1999 2000-2004 2005-2008
Grains
Pulses
Hort. & Spices
Oilseeds
Specialty Crops
Livestock
Average annual growth,
1980-2008:
Grains: -0.91%
Pulses: -2.43%
Hort.&Spices: 1.59%
Oilseeds: 4.50%
Specialty: -2.70%
Livestock: -1.74%
43
Figure 13. Decomposing Average Annual Aggregate Crop Output Growth, 1980-2008
2.44%
0.89%
2.81%
0.37%
1.55%
0.00%
0.50%
1.00%
1.50%
2.00%
2.50%
3.00%
Aggregate Crop Output Growth Aggregate Crop OutputDecomposition
Aggregate Crop Output perHectare Decomposition
Growth in Average Land Share
Growth in Aggregate Crop Output per Hectare
Growth in Aggregate Crop Area
Growth in Average Crop Yield
44
Figure 14. Average Proportions of Input Growth by Production Factor, 1980-2008
0%
10%
20%
30%
40%
50%
60%
70%
80%
90%
100%
Energy
Materials
Livestock Capital
Machinery Capital
Labor
Irrigation Investments
Net Land in Production
19%
15%
20%
5%
33%
8%
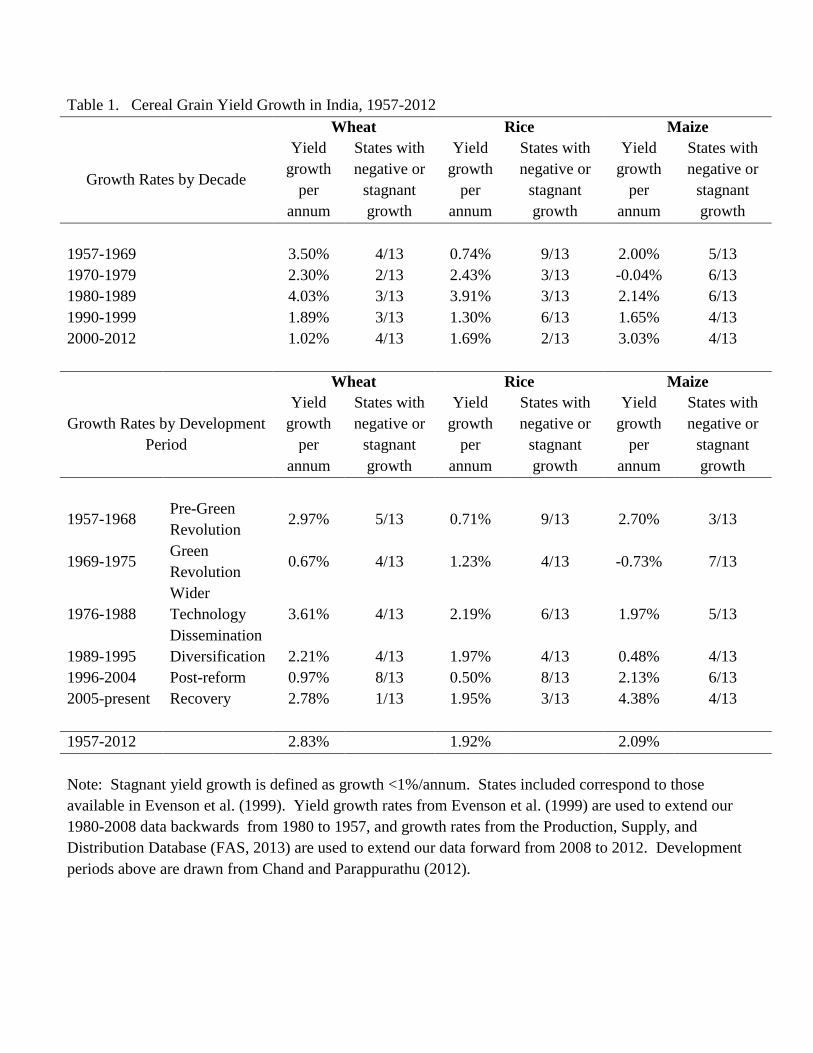
Table 1. Cereal Grain Yield Growth in India, 1957-2012
Wheat Rice Maize
Growth Rates by Decade
Yield
growth
per
annum
States with
negative or
stagnant
growth
Yield
growth
per
annum
States with
negative or
stagnant
growth
Yield
growth
per
annum
States with
negative or
stagnant
growth
1957-1969 3.50% 4/13 0.74% 9/13 2.00% 5/13
1970-1979 2.30% 2/13 2.43% 3/13 -0.04% 6/13
1980-1989 4.03% 3/13 3.91% 3/13 2.14% 6/13
1990-1999 1.89% 3/13 1.30% 6/13 1.65% 4/13
2000-2012 1.02% 4/13 1.69% 2/13 3.03% 4/13
Wheat Rice Maize
Growth Rates by Development
Period
Yield
growth
per
annum
States with
negative or
stagnant
growth
Yield
growth
per
annum
States with
negative or
stagnant
growth
Yield
growth
per
annum
States with
negative or
stagnant
growth
1957-1968 Pre-Green
Revolution 2.97% 5/13 0.71% 9/13 2.70% 3/13
1969-1975 Green
Revolution 0.67% 4/13 1.23% 4/13 -0.73% 7/13
1976-1988
Wider
Technology
Dissemination
3.61% 4/13 2.19% 6/13 1.97% 5/13
1989-1995 Diversification 2.21% 4/13 1.97% 4/13 0.48% 4/13
1996-2004 Post-reform 0.97% 8/13 0.50% 8/13 2.13% 6/13
2005-present Recovery 2.78% 1/13 1.95% 3/13 4.38% 4/13
1957-2012 2.83% 1.92% 2.09%
Note: Stagnant yield growth is defined as growth <1%/annum. States included correspond to those
available in Evenson et al. (1999). Yield growth rates from Evenson et al. (1999) are used to extend our
1980-2008 data backwards from 1980 to 1957, and growth rates from the Production, Supply, and
Distribution Database (FAS, 2013) are used to extend our data forward from 2008 to 2012. Development
periods above are drawn from Chand and Parappurathu (2012).
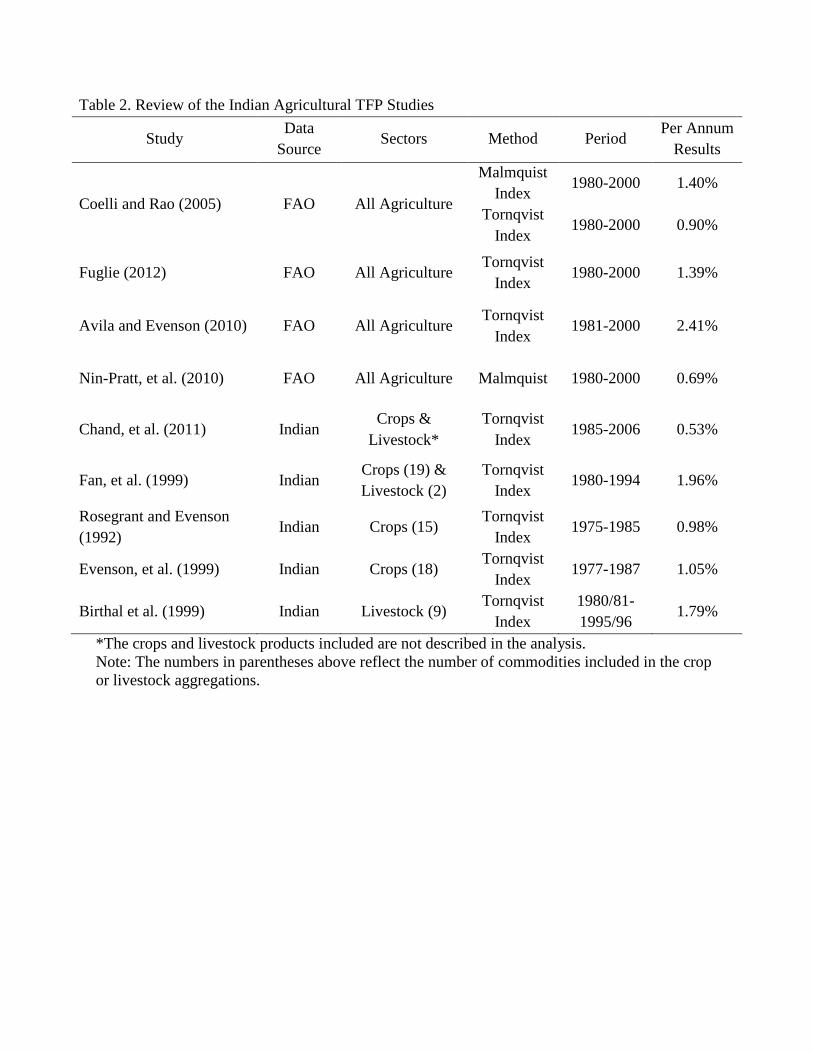
Table 2. Review of the Indian Agricultural TFP Studies
Study Data
Source Sectors Method Period
Per Annum
Results
Coelli and Rao (2005) FAO All Agriculture
Malmquist
Index 1980-2000 1.40%
Tornqvist
Index 1980-2000 0.90%
Fuglie (2012) FAO All Agriculture Tornqvist
Index 1980-2000 1.39%
Avila and Evenson (2010) FAO All Agriculture Tornqvist
Index 1981-2000 2.41%
Nin-Pratt, et al. (2010) FAO All Agriculture Malmquist 1980-2000 0.69%
Chand, et al. (2011) Indian Crops &
Livestock*
Tornqvist
Index 1985-2006 0.53%
Fan, et al. (1999) Indian Crops (19) &
Livestock (2)
Tornqvist
Index 1980-1994 1.96%
Rosegrant and Evenson
(1992) Indian Crops (15)
Tornqvist
Index 1975-1985 0.98%
Evenson, et al. (1999) Indian Crops (18) Tornqvist
Index 1977-1987 1.05%
Birthal et al. (1999) Indian Livestock (9) Tornqvist
Index
1980/81-
1995/96 1.79%
*The crops and livestock products included are not described in the analysis.
Note: The numbers in parentheses above reflect the number of commodities included in the crop
or livestock aggregations.
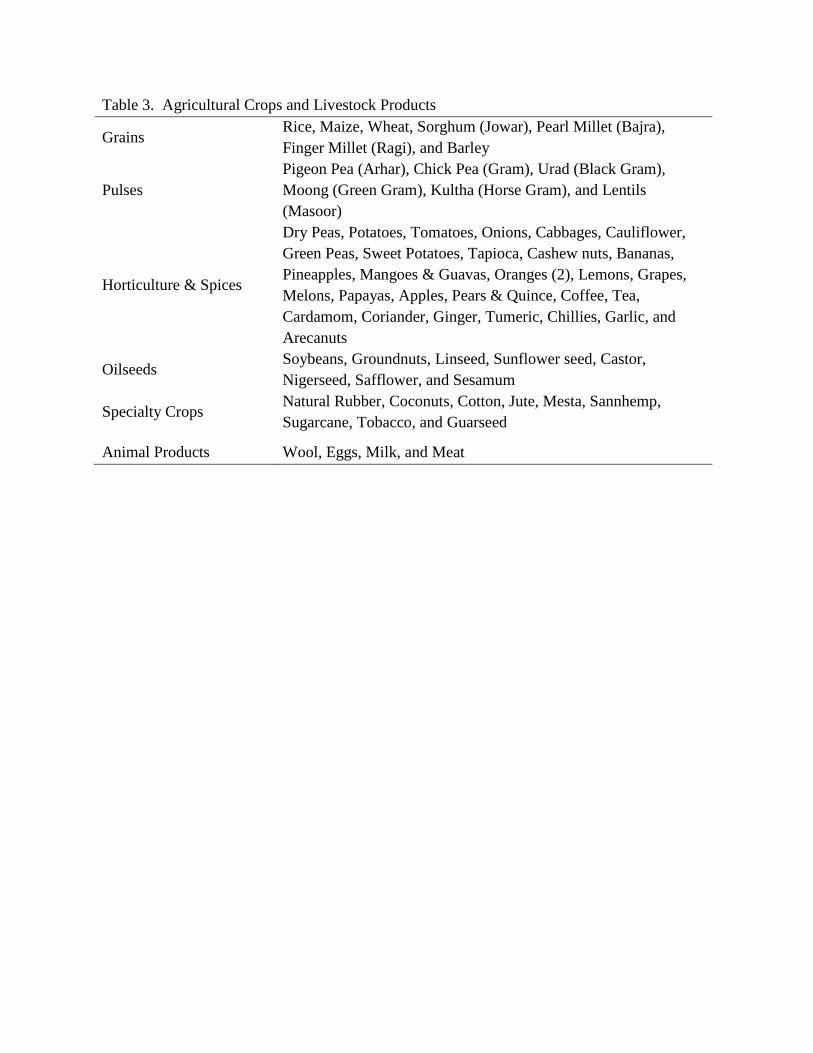
Table 3. Agricultural Crops and Livestock Products
Grains Rice, Maize, Wheat, Sorghum (Jowar), Pearl Millet (Bajra),
Finger Millet (Ragi), and Barley
Pulses
Pigeon Pea (Arhar), Chick Pea (Gram), Urad (Black Gram),
Moong (Green Gram), Kultha (Horse Gram), and Lentils
(Masoor)
Horticulture & Spices
Dry Peas, Potatoes, Tomatoes, Onions, Cabbages, Cauliflower,
Green Peas, Sweet Potatoes, Tapioca, Cashew nuts, Bananas,
Pineapples, Mangoes & Guavas, Oranges (2), Lemons, Grapes,
Melons, Papayas, Apples, Pears & Quince, Coffee, Tea,
Cardamom, Coriander, Ginger, Tumeric, Chillies, Garlic, and
Arecanuts
Oilseeds Soybeans, Groundnuts, Linseed, Sunflower seed, Castor,
Nigerseed, Safflower, and Sesamum
Specialty Crops Natural Rubber, Coconuts, Cotton, Jute, Mesta, Sannhemp,
Sugarcane, Tobacco, and Guarseed
Animal Products Wool, Eggs, Milk, and Meat
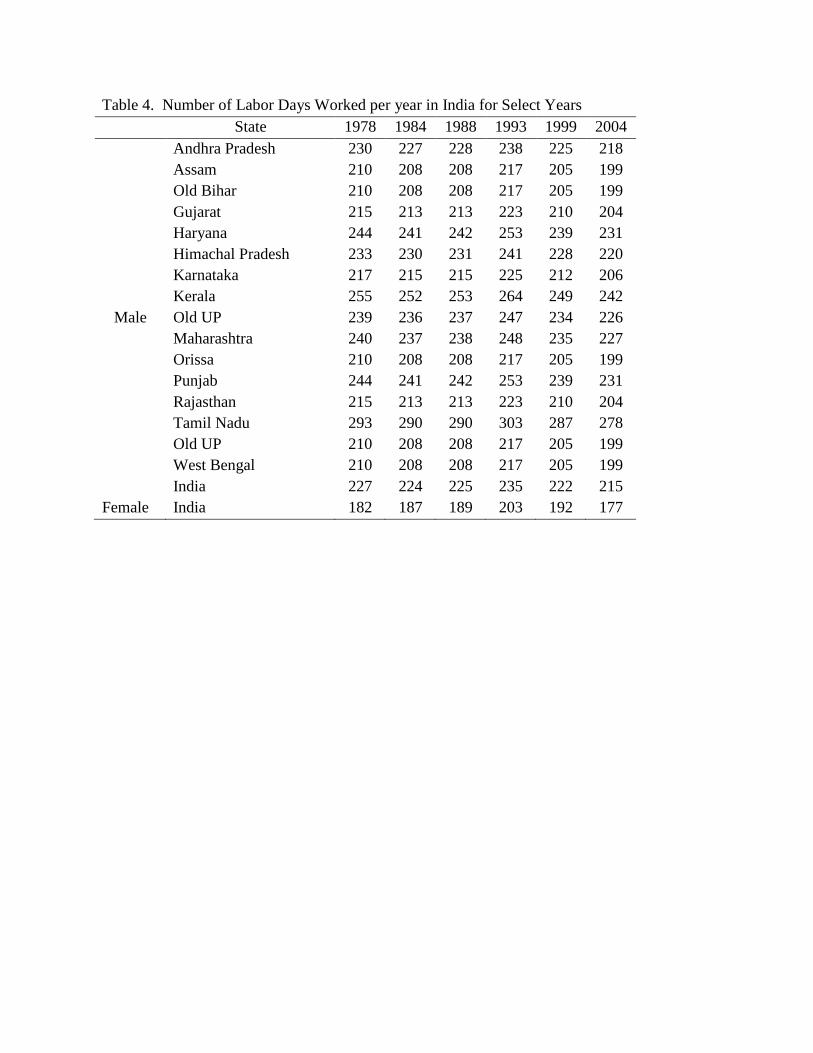
Table 4. Number of Labor Days Worked per year in India for Select Years
State 1978 1984 1988 1993 1999 2004
Male
Andhra Pradesh 230 227 228 238 225 218
Assam 210 208 208 217 205 199
Old Bihar 210 208 208 217 205 199
Gujarat 215 213 213 223 210 204
Haryana 244 241 242 253 239 231
Himachal Pradesh 233 230 231 241 228 220
Karnataka 217 215 215 225 212 206
Kerala 255 252 253 264 249 242
Old UP 239 236 237 247 234 226
Maharashtra 240 237 238 248 235 227
Orissa 210 208 208 217 205 199
Punjab 244 241 242 253 239 231
Rajasthan 215 213 213 223 210 204
Tamil Nadu 293 290 290 303 287 278
Old UP 210 208 208 217 205 199
West Bengal 210 208 208 217 205 199
India 227 224 225 235 222 215
Female India 182 187 189 203 192 177
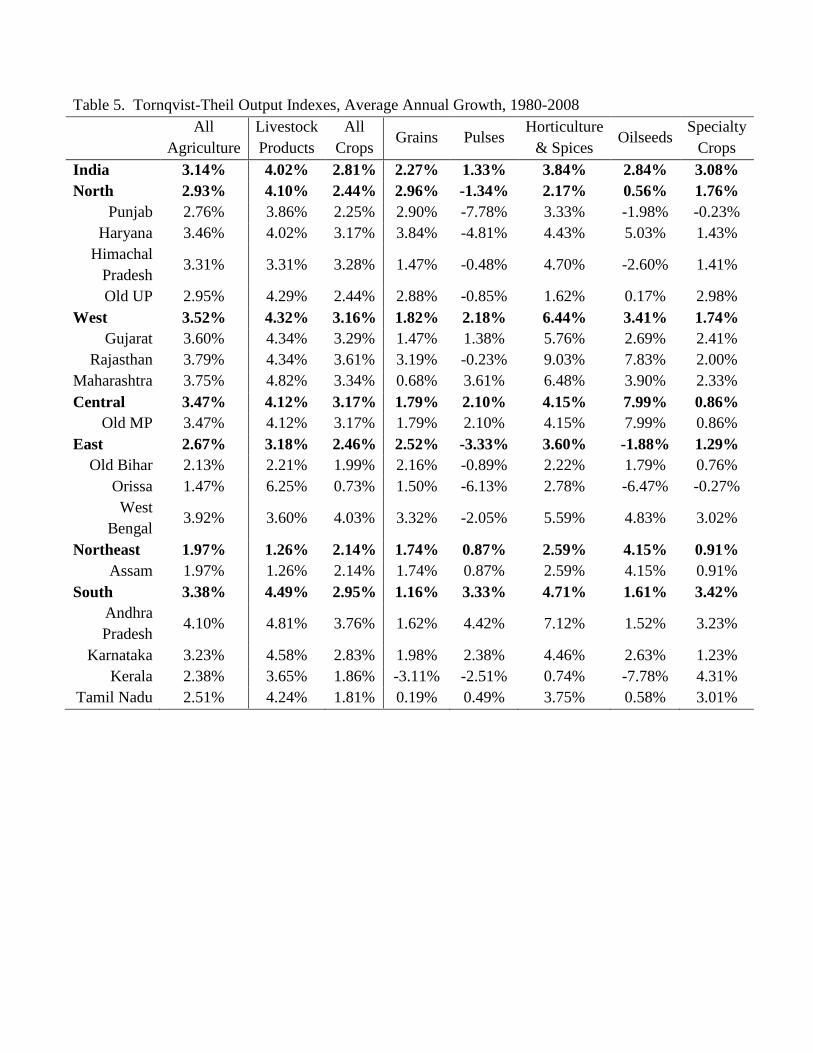
Table 5. Tornqvist-Theil Output Indexes, Average Annual Growth, 1980-2008
All
Agriculture
Livestock
Products
All
Crops Grains Pulses
Horticulture
& Spices Oilseeds
Specialty
Crops
India 3.14% 4.02% 2.81% 2.27% 1.33% 3.84% 2.84% 3.08%
North 2.93% 4.10% 2.44% 2.96% -1.34% 2.17% 0.56% 1.76%
Punjab 2.76% 3.86% 2.25% 2.90% -7.78% 3.33% -1.98% -0.23%
Haryana 3.46% 4.02% 3.17% 3.84% -4.81% 4.43% 5.03% 1.43%
Himachal
Pradesh 3.31% 3.31% 3.28% 1.47% -0.48% 4.70% -2.60% 1.41%
Old UP 2.95% 4.29% 2.44% 2.88% -0.85% 1.62% 0.17% 2.98%
West 3.52% 4.32% 3.16% 1.82% 2.18% 6.44% 3.41% 1.74%
Gujarat 3.60% 4.34% 3.29% 1.47% 1.38% 5.76% 2.69% 2.41%
Rajasthan 3.79% 4.34% 3.61% 3.19% -0.23% 9.03% 7.83% 2.00%
Maharashtra 3.75% 4.82% 3.34% 0.68% 3.61% 6.48% 3.90% 2.33%
Central 3.47% 4.12% 3.17% 1.79% 2.10% 4.15% 7.99% 0.86%
Old MP 3.47% 4.12% 3.17% 1.79% 2.10% 4.15% 7.99% 0.86%
East 2.67% 3.18% 2.46% 2.52% -3.33% 3.60% -1.88% 1.29%
Old Bihar 2.13% 2.21% 1.99% 2.16% -0.89% 2.22% 1.79% 0.76%
Orissa 1.47% 6.25% 0.73% 1.50% -6.13% 2.78% -6.47% -0.27%
West
Bengal 3.92% 3.60% 4.03% 3.32% -2.05% 5.59% 4.83% 3.02%
Northeast 1.97% 1.26% 2.14% 1.74% 0.87% 2.59% 4.15% 0.91%
Assam 1.97% 1.26% 2.14% 1.74% 0.87% 2.59% 4.15% 0.91%
South 3.38% 4.49% 2.95% 1.16% 3.33% 4.71% 1.61% 3.42%
Andhra
Pradesh 4.10% 4.81% 3.76% 1.62% 4.42% 7.12% 1.52% 3.23%
Karnataka 3.23% 4.58% 2.83% 1.98% 2.38% 4.46% 2.63% 1.23%
Kerala 2.38% 3.65% 1.86% -3.11% -2.51% 0.74% -7.78% 4.31%
Tamil Nadu 2.51% 4.24% 1.81% 0.19% 0.49% 3.75% 0.58% 3.01%
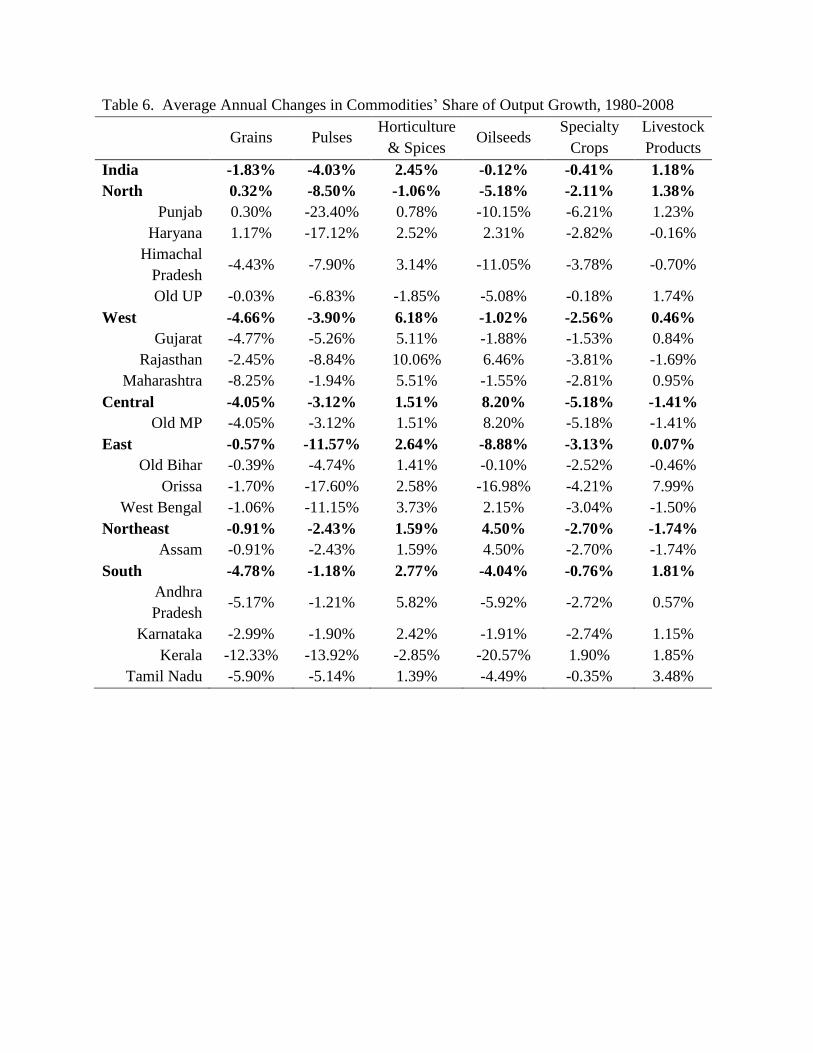
Table 6. Average Annual Changes in Commodities’ Share of Output Growth, 1980-2008
Grains Pulses Horticulture
& Spices Oilseeds
Specialty
Crops
Livestock
Products
India -1.83% -4.03% 2.45% -0.12% -0.41% 1.18%
North 0.32% -8.50% -1.06% -5.18% -2.11% 1.38%
Punjab 0.30% -23.40% 0.78% -10.15% -6.21% 1.23%
Haryana 1.17% -17.12% 2.52% 2.31% -2.82% -0.16%
Himachal
Pradesh -4.43% -7.90% 3.14% -11.05% -3.78% -0.70%
Old UP -0.03% -6.83% -1.85% -5.08% -0.18% 1.74%
West -4.66% -3.90% 6.18% -1.02% -2.56% 0.46%
Gujarat -4.77% -5.26% 5.11% -1.88% -1.53% 0.84%
Rajasthan -2.45% -8.84% 10.06% 6.46% -3.81% -1.69%
Maharashtra -8.25% -1.94% 5.51% -1.55% -2.81% 0.95%
Central -4.05% -3.12% 1.51% 8.20% -5.18% -1.41%
Old MP -4.05% -3.12% 1.51% 8.20% -5.18% -1.41%
East -0.57% -11.57% 2.64% -8.88% -3.13% 0.07%
Old Bihar -0.39% -4.74% 1.41% -0.10% -2.52% -0.46%
Orissa -1.70% -17.60% 2.58% -16.98% -4.21% 7.99%
West Bengal -1.06% -11.15% 3.73% 2.15% -3.04% -1.50%
Northeast -0.91% -2.43% 1.59% 4.50% -2.70% -1.74%
Assam -0.91% -2.43% 1.59% 4.50% -2.70% -1.74%
South -4.78% -1.18% 2.77% -4.04% -0.76% 1.81%
Andhra
Pradesh -5.17% -1.21% 5.82% -5.92% -2.72% 0.57%
Karnataka -2.99% -1.90% 2.42% -1.91% -2.74% 1.15%
Kerala -12.33% -13.92% -2.85% -20.57% 1.90% 1.85%
Tamil Nadu -5.90% -5.14% 1.39% -4.49% -0.35% 3.48%
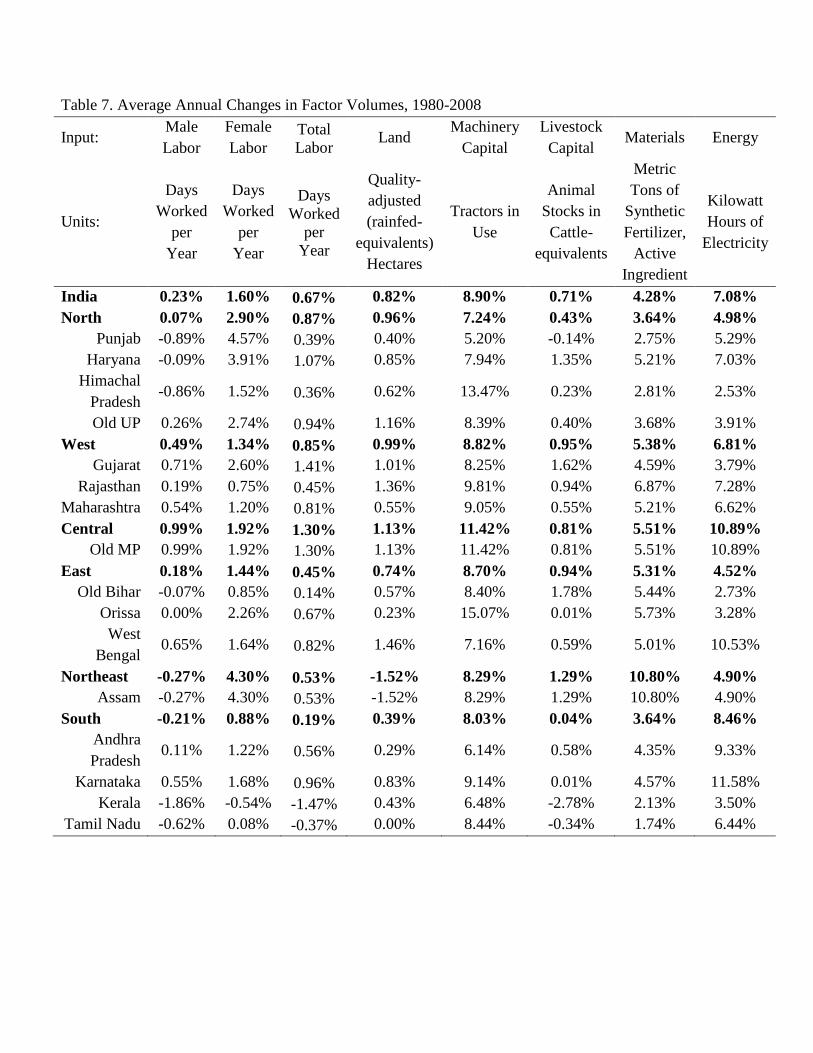
Table 7. Average Annual Changes in Factor Volumes, 1980-2008
Input: Male
Labor
Female
Labor
Total
Labor Land
Machinery
Capital
Livestock
Capital Materials Energy
Units:
Days
Worked
per
Year
Days
Worked
per
Year
Days
Worked
per
Year
Quality-
adjusted
(rainfed-
equivalents)
Hectares
Tractors in
Use
Animal
Stocks in
Cattle-
equivalents
Metric
Tons of
Synthetic
Fertilizer,
Active
Ingredient
Kilowatt
Hours of
Electricity
India 0.23% 1.60% 0.67% 0.82% 8.90% 0.71% 4.28% 7.08%
North 0.07% 2.90% 0.87% 0.96% 7.24% 0.43% 3.64% 4.98%
Punjab -0.89% 4.57% 0.39% 0.40% 5.20% -0.14% 2.75% 5.29%
Haryana -0.09% 3.91% 1.07% 0.85% 7.94% 1.35% 5.21% 7.03%
Himachal
Pradesh -0.86% 1.52% 0.36% 0.62% 13.47% 0.23% 2.81% 2.53%
Old UP 0.26% 2.74% 0.94% 1.16% 8.39% 0.40% 3.68% 3.91%
West 0.49% 1.34% 0.85% 0.99% 8.82% 0.95% 5.38% 6.81%
Gujarat 0.71% 2.60% 1.41% 1.01% 8.25% 1.62% 4.59% 3.79%
Rajasthan 0.19% 0.75% 0.45% 1.36% 9.81% 0.94% 6.87% 7.28%
Maharashtra 0.54% 1.20% 0.81% 0.55% 9.05% 0.55% 5.21% 6.62%
Central 0.99% 1.92% 1.30% 1.13% 11.42% 0.81% 5.51% 10.89%
Old MP 0.99% 1.92% 1.30% 1.13% 11.42% 0.81% 5.51% 10.89%
East 0.18% 1.44% 0.45% 0.74% 8.70% 0.94% 5.31% 4.52%
Old Bihar -0.07% 0.85% 0.14% 0.57% 8.40% 1.78% 5.44% 2.73%
Orissa 0.00% 2.26% 0.67% 0.23% 15.07% 0.01% 5.73% 3.28%
West
Bengal 0.65% 1.64% 0.82% 1.46% 7.16% 0.59% 5.01% 10.53%
Northeast -0.27% 4.30% 0.53% -1.52% 8.29% 1.29% 10.80% 4.90%
Assam -0.27% 4.30% 0.53% -1.52% 8.29% 1.29% 10.80% 4.90%
South -0.21% 0.88% 0.19% 0.39% 8.03% 0.04% 3.64% 8.46%
Andhra
Pradesh 0.11% 1.22% 0.56% 0.29% 6.14% 0.58% 4.35% 9.33%
Karnataka 0.55% 1.68% 0.96% 0.83% 9.14% 0.01% 4.57% 11.58%
Kerala -1.86% -0.54% -1.47% 0.43% 6.48% -2.78% 2.13% 3.50%
Tamil Nadu -0.62% 0.08% -0.37% 0.00% 8.44% -0.34% 1.74% 6.44%
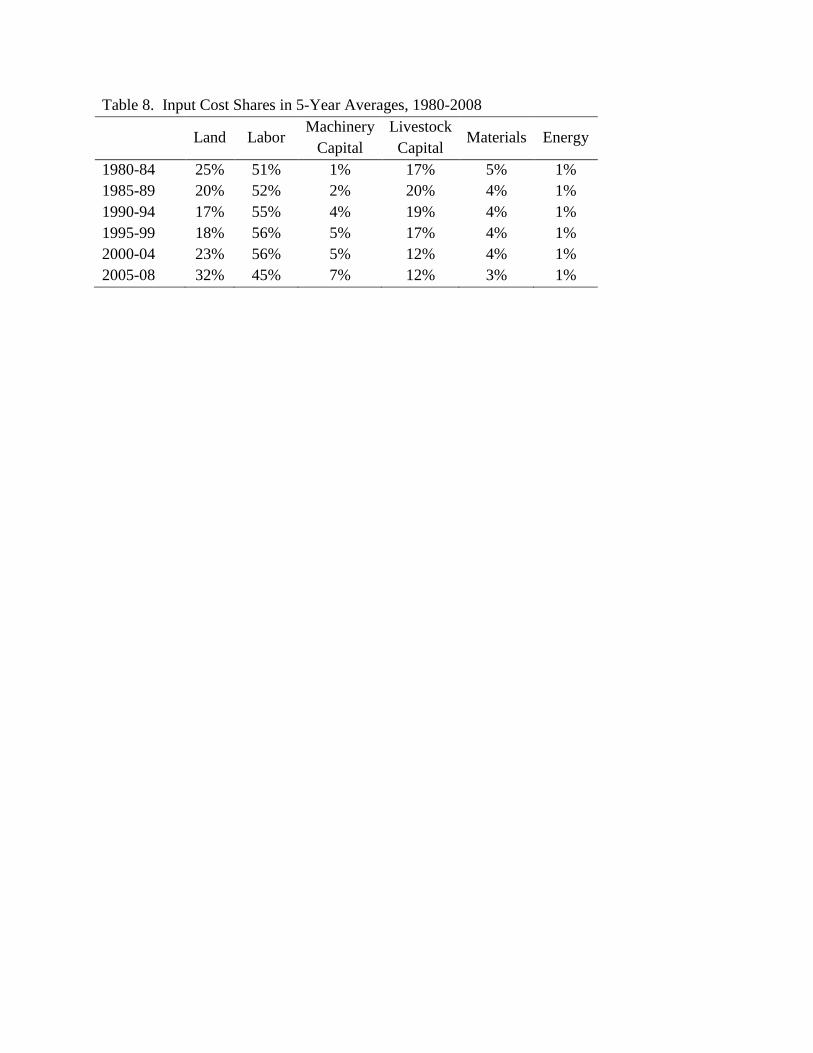
Table 8. Input Cost Shares in 5-Year Averages, 1980-2008
Land Labor Machinery
Capital
Livestock
Capital Materials Energy
1980-84 25% 51% 1% 17% 5% 1%
1985-89 20% 52% 2% 20% 4% 1%
1990-94 17% 55% 4% 19% 4% 1%
1995-99 18% 56% 5% 17% 4% 1%
2000-04 23% 56% 5% 12% 4% 1%
2005-08 32% 45% 7% 12% 3% 1%
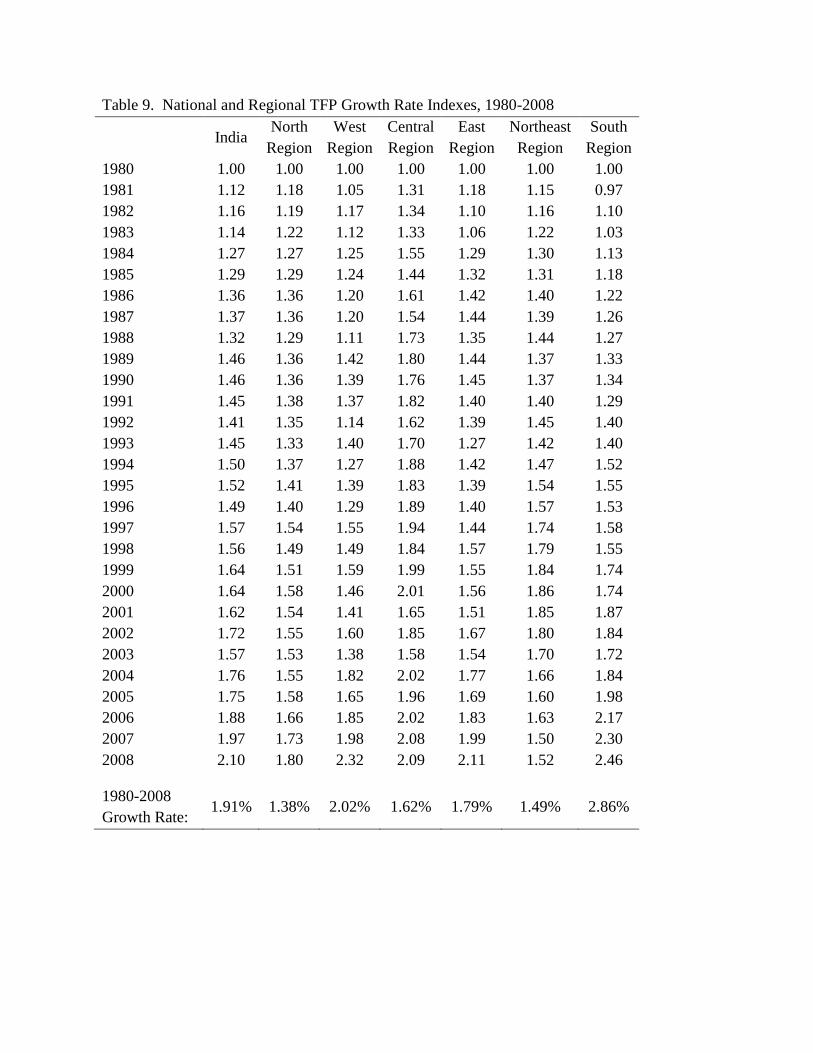
Table 9. National and Regional TFP Growth Rate Indexes, 1980-2008
India North
Region
West
Region
Central
Region
East
Region
Northeast
Region
South
Region
1980 1.00 1.00 1.00 1.00 1.00 1.00 1.00
1981 1.12 1.18 1.05 1.31 1.18 1.15 0.97
1982 1.16 1.19 1.17 1.34 1.10 1.16 1.10
1983 1.14 1.22 1.12 1.33 1.06 1.22 1.03
1984 1.27 1.27 1.25 1.55 1.29 1.30 1.13
1985 1.29 1.29 1.24 1.44 1.32 1.31 1.18
1986 1.36 1.36 1.20 1.61 1.42 1.40 1.22
1987 1.37 1.36 1.20 1.54 1.44 1.39 1.26
1988 1.32 1.29 1.11 1.73 1.35 1.44 1.27
1989 1.46 1.36 1.42 1.80 1.44 1.37 1.33
1990 1.46 1.36 1.39 1.76 1.45 1.37 1.34
1991 1.45 1.38 1.37 1.82 1.40 1.40 1.29
1992 1.41 1.35 1.14 1.62 1.39 1.45 1.40
1993 1.45 1.33 1.40 1.70 1.27 1.42 1.40
1994 1.50 1.37 1.27 1.88 1.42 1.47 1.52
1995 1.52 1.41 1.39 1.83 1.39 1.54 1.55
1996 1.49 1.40 1.29 1.89 1.40 1.57 1.53
1997 1.57 1.54 1.55 1.94 1.44 1.74 1.58
1998 1.56 1.49 1.49 1.84 1.57 1.79 1.55
1999 1.64 1.51 1.59 1.99 1.55 1.84 1.74
2000 1.64 1.58 1.46 2.01 1.56 1.86 1.74
2001 1.62 1.54 1.41 1.65 1.51 1.85 1.87
2002 1.72 1.55 1.60 1.85 1.67 1.80 1.84
2003 1.57 1.53 1.38 1.58 1.54 1.70 1.72
2004 1.76 1.55 1.82 2.02 1.77 1.66 1.84
2005 1.75 1.58 1.65 1.96 1.69 1.60 1.98
2006 1.88 1.66 1.85 2.02 1.83 1.63 2.17
2007 1.97 1.73 1.98 2.08 1.99 1.50 2.30
2008 2.10 1.80 2.32 2.09 2.11 1.52 2.46
1980-2008
Growth Rate: 1.91% 1.38% 2.02% 1.62% 1.79% 1.49% 2.86%
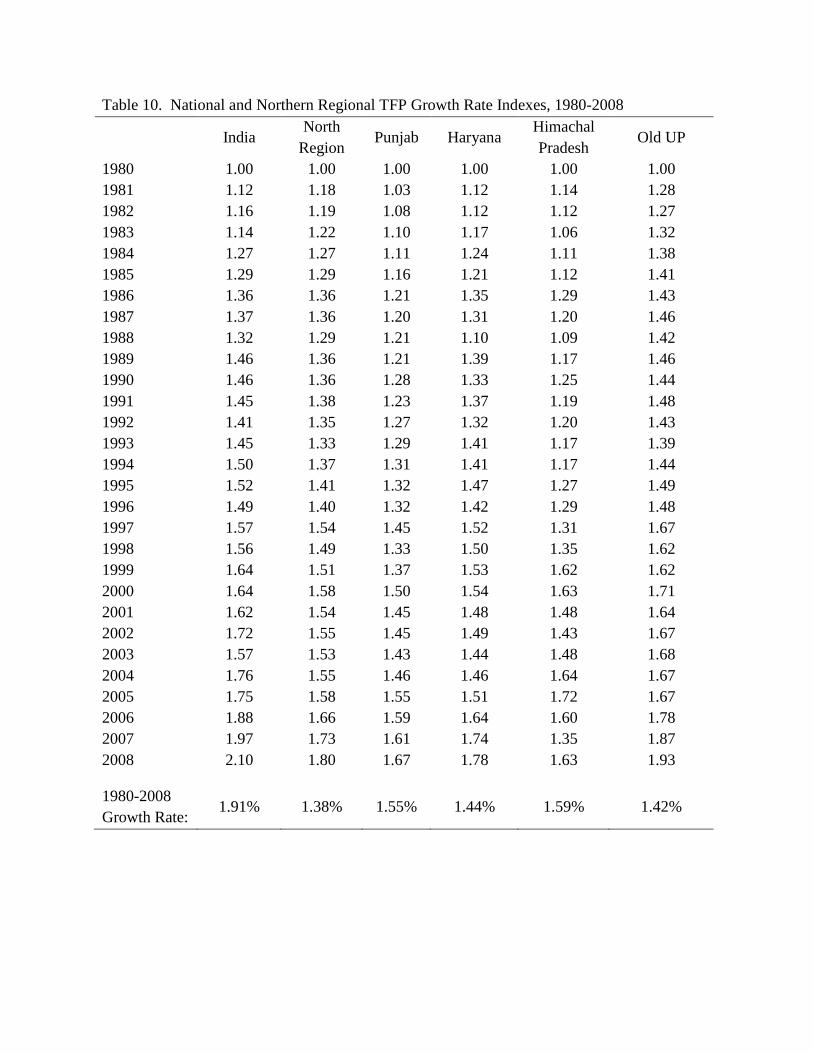
Table 10. National and Northern Regional TFP Growth Rate Indexes, 1980-2008
India North
Region Punjab Haryana
Himachal
Pradesh Old UP
1980 1.00 1.00 1.00 1.00 1.00 1.00
1981 1.12 1.18 1.03 1.12 1.14 1.28
1982 1.16 1.19 1.08 1.12 1.12 1.27
1983 1.14 1.22 1.10 1.17 1.06 1.32
1984 1.27 1.27 1.11 1.24 1.11 1.38
1985 1.29 1.29 1.16 1.21 1.12 1.41
1986 1.36 1.36 1.21 1.35 1.29 1.43
1987 1.37 1.36 1.20 1.31 1.20 1.46
1988 1.32 1.29 1.21 1.10 1.09 1.42
1989 1.46 1.36 1.21 1.39 1.17 1.46
1990 1.46 1.36 1.28 1.33 1.25 1.44
1991 1.45 1.38 1.23 1.37 1.19 1.48
1992 1.41 1.35 1.27 1.32 1.20 1.43
1993 1.45 1.33 1.29 1.41 1.17 1.39
1994 1.50 1.37 1.31 1.41 1.17 1.44
1995 1.52 1.41 1.32 1.47 1.27 1.49
1996 1.49 1.40 1.32 1.42 1.29 1.48
1997 1.57 1.54 1.45 1.52 1.31 1.67
1998 1.56 1.49 1.33 1.50 1.35 1.62
1999 1.64 1.51 1.37 1.53 1.62 1.62
2000 1.64 1.58 1.50 1.54 1.63 1.71
2001 1.62 1.54 1.45 1.48 1.48 1.64
2002 1.72 1.55 1.45 1.49 1.43 1.67
2003 1.57 1.53 1.43 1.44 1.48 1.68
2004 1.76 1.55 1.46 1.46 1.64 1.67
2005 1.75 1.58 1.55 1.51 1.72 1.67
2006 1.88 1.66 1.59 1.64 1.60 1.78
2007 1.97 1.73 1.61 1.74 1.35 1.87
2008 2.10 1.80 1.67 1.78 1.63 1.93
1980-2008
Growth Rate: 1.91% 1.38% 1.55% 1.44% 1.59% 1.42%
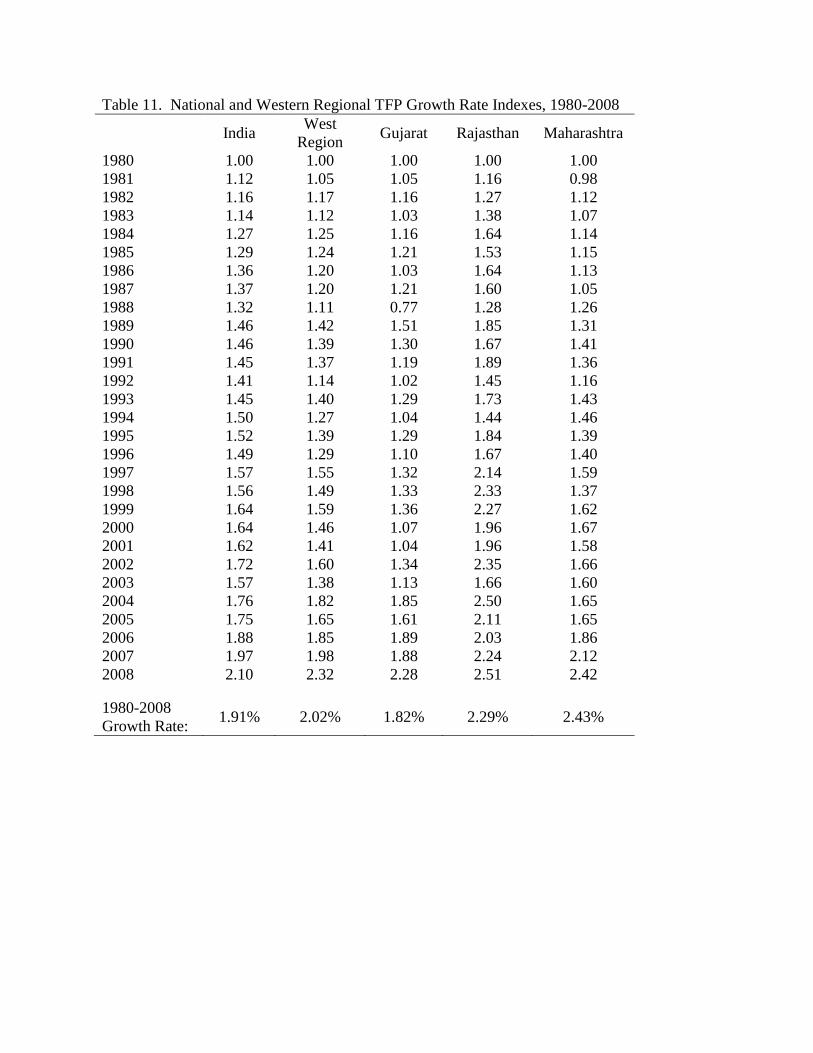
Table 11. National and Western Regional TFP Growth Rate Indexes, 1980-2008
India West
Region Gujarat Rajasthan Maharashtra
1980 1.00 1.00 1.00 1.00 1.00
1981 1.12 1.05 1.05 1.16 0.98
1982 1.16 1.17 1.16 1.27 1.12
1983 1.14 1.12 1.03 1.38 1.07
1984 1.27 1.25 1.16 1.64 1.14
1985 1.29 1.24 1.21 1.53 1.15
1986 1.36 1.20 1.03 1.64 1.13
1987 1.37 1.20 1.21 1.60 1.05
1988 1.32 1.11 0.77 1.28 1.26
1989 1.46 1.42 1.51 1.85 1.31
1990 1.46 1.39 1.30 1.67 1.41
1991 1.45 1.37 1.19 1.89 1.36
1992 1.41 1.14 1.02 1.45 1.16
1993 1.45 1.40 1.29 1.73 1.43
1994 1.50 1.27 1.04 1.44 1.46
1995 1.52 1.39 1.29 1.84 1.39
1996 1.49 1.29 1.10 1.67 1.40
1997 1.57 1.55 1.32 2.14 1.59
1998 1.56 1.49 1.33 2.33 1.37
1999 1.64 1.59 1.36 2.27 1.62
2000 1.64 1.46 1.07 1.96 1.67
2001 1.62 1.41 1.04 1.96 1.58
2002 1.72 1.60 1.34 2.35 1.66
2003 1.57 1.38 1.13 1.66 1.60
2004 1.76 1.82 1.85 2.50 1.65
2005 1.75 1.65 1.61 2.11 1.65
2006 1.88 1.85 1.89 2.03 1.86
2007 1.97 1.98 1.88 2.24 2.12
2008 2.10 2.32 2.28 2.51 2.42
1980-2008
Growth Rate: 1.91% 2.02% 1.82% 2.29% 2.43%
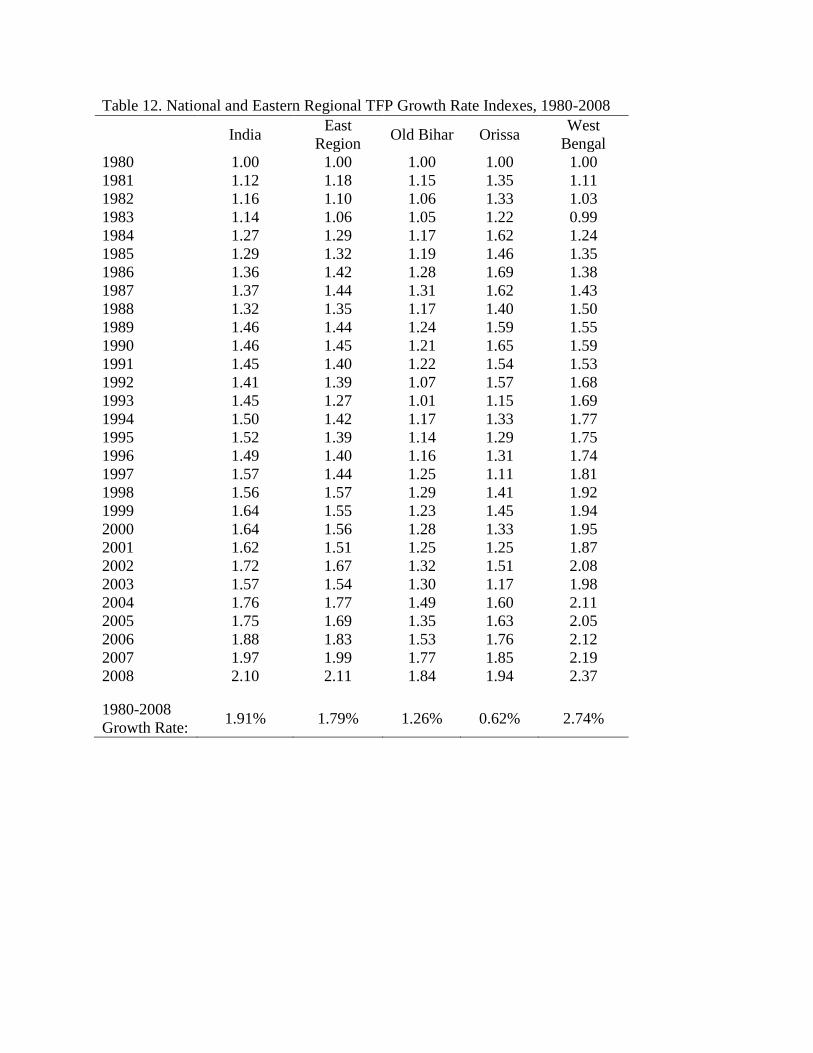
Table 12. National and Eastern Regional TFP Growth Rate Indexes, 1980-2008
India East
Region Old Bihar Orissa
West
Bengal
1980 1.00 1.00 1.00 1.00 1.00
1981 1.12 1.18 1.15 1.35 1.11
1982 1.16 1.10 1.06 1.33 1.03
1983 1.14 1.06 1.05 1.22 0.99
1984 1.27 1.29 1.17 1.62 1.24
1985 1.29 1.32 1.19 1.46 1.35
1986 1.36 1.42 1.28 1.69 1.38
1987 1.37 1.44 1.31 1.62 1.43
1988 1.32 1.35 1.17 1.40 1.50
1989 1.46 1.44 1.24 1.59 1.55
1990 1.46 1.45 1.21 1.65 1.59
1991 1.45 1.40 1.22 1.54 1.53
1992 1.41 1.39 1.07 1.57 1.68
1993 1.45 1.27 1.01 1.15 1.69
1994 1.50 1.42 1.17 1.33 1.77
1995 1.52 1.39 1.14 1.29 1.75
1996 1.49 1.40 1.16 1.31 1.74
1997 1.57 1.44 1.25 1.11 1.81
1998 1.56 1.57 1.29 1.41 1.92
1999 1.64 1.55 1.23 1.45 1.94
2000 1.64 1.56 1.28 1.33 1.95
2001 1.62 1.51 1.25 1.25 1.87
2002 1.72 1.67 1.32 1.51 2.08
2003 1.57 1.54 1.30 1.17 1.98
2004 1.76 1.77 1.49 1.60 2.11
2005 1.75 1.69 1.35 1.63 2.05
2006 1.88 1.83 1.53 1.76 2.12
2007 1.97 1.99 1.77 1.85 2.19
2008 2.10 2.11 1.84 1.94 2.37
1980-2008
Growth Rate: 1.91% 1.79% 1.26% 0.62% 2.74%
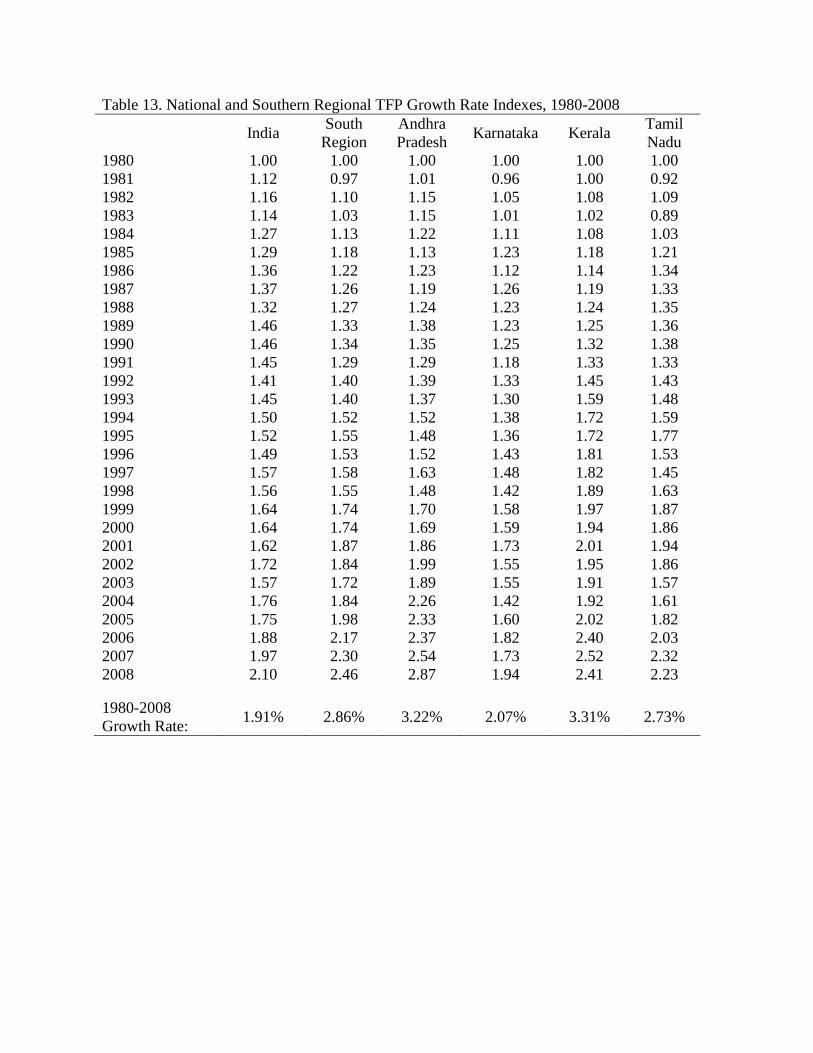
Table 13. National and Southern Regional TFP Growth Rate Indexes, 1980-2008
India South
Region
Andhra
Pradesh Karnataka Kerala
Tamil
Nadu
1980 1.00 1.00 1.00 1.00 1.00 1.00
1981 1.12 0.97 1.01 0.96 1.00 0.92
1982 1.16 1.10 1.15 1.05 1.08 1.09
1983 1.14 1.03 1.15 1.01 1.02 0.89
1984 1.27 1.13 1.22 1.11 1.08 1.03
1985 1.29 1.18 1.13 1.23 1.18 1.21
1986 1.36 1.22 1.23 1.12 1.14 1.34
1987 1.37 1.26 1.19 1.26 1.19 1.33
1988 1.32 1.27 1.24 1.23 1.24 1.35
1989 1.46 1.33 1.38 1.23 1.25 1.36
1990 1.46 1.34 1.35 1.25 1.32 1.38
1991 1.45 1.29 1.29 1.18 1.33 1.33
1992 1.41 1.40 1.39 1.33 1.45 1.43
1993 1.45 1.40 1.37 1.30 1.59 1.48
1994 1.50 1.52 1.52 1.38 1.72 1.59
1995 1.52 1.55 1.48 1.36 1.72 1.77
1996 1.49 1.53 1.52 1.43 1.81 1.53
1997 1.57 1.58 1.63 1.48 1.82 1.45
1998 1.56 1.55 1.48 1.42 1.89 1.63
1999 1.64 1.74 1.70 1.58 1.97 1.87
2000 1.64 1.74 1.69 1.59 1.94 1.86
2001 1.62 1.87 1.86 1.73 2.01 1.94
2002 1.72 1.84 1.99 1.55 1.95 1.86
2003 1.57 1.72 1.89 1.55 1.91 1.57
2004 1.76 1.84 2.26 1.42 1.92 1.61
2005 1.75 1.98 2.33 1.60 2.02 1.82
2006 1.88 2.17 2.37 1.82 2.40 2.03
2007 1.97 2.30 2.54 1.73 2.52 2.32
2008 2.10 2.46 2.87 1.94 2.41 2.23
1980-2008
Growth Rate: 1.91% 2.86% 3.22% 2.07% 3.31% 2.73%
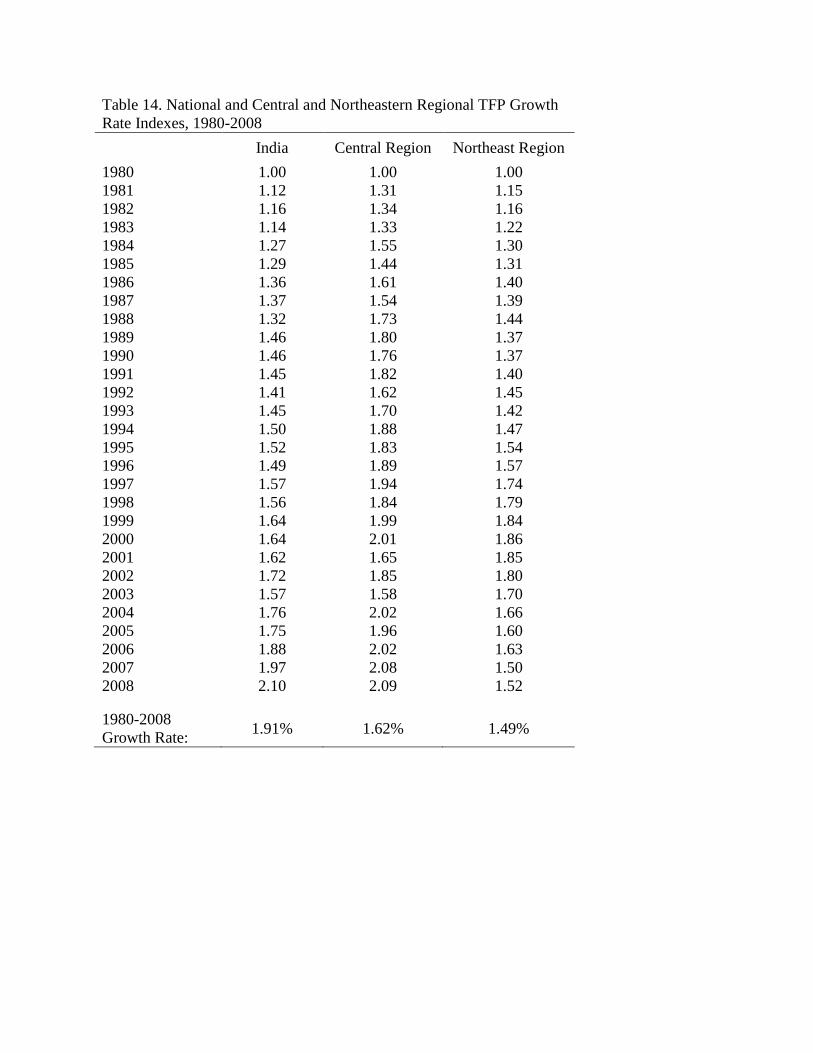
Table 14. National and Central and Northeastern Regional TFP Growth
Rate Indexes, 1980-2008
India Central Region Northeast Region
1980 1.00 1.00 1.00
1981 1.12 1.31 1.15
1982 1.16 1.34 1.16
1983 1.14 1.33 1.22
1984 1.27 1.55 1.30
1985 1.29 1.44 1.31
1986 1.36 1.61 1.40
1987 1.37 1.54 1.39
1988 1.32 1.73 1.44
1989 1.46 1.80 1.37
1990 1.46 1.76 1.37
1991 1.45 1.82 1.40
1992 1.41 1.62 1.45
1993 1.45 1.70 1.42
1994 1.50 1.88 1.47
1995 1.52 1.83 1.54
1996 1.49 1.89 1.57
1997 1.57 1.94 1.74
1998 1.56 1.84 1.79
1999 1.64 1.99 1.84
2000 1.64 2.01 1.86
2001 1.62 1.65 1.85
2002 1.72 1.85 1.80
2003 1.57 1.58 1.70
2004 1.76 2.02 1.66
2005 1.75 1.96 1.60
2006 1.88 2.02 1.63
2007 1.97 2.08 1.50
2008 2.10 2.09 1.52
1980-2008
Growth Rate: 1.91% 1.62% 1.49%
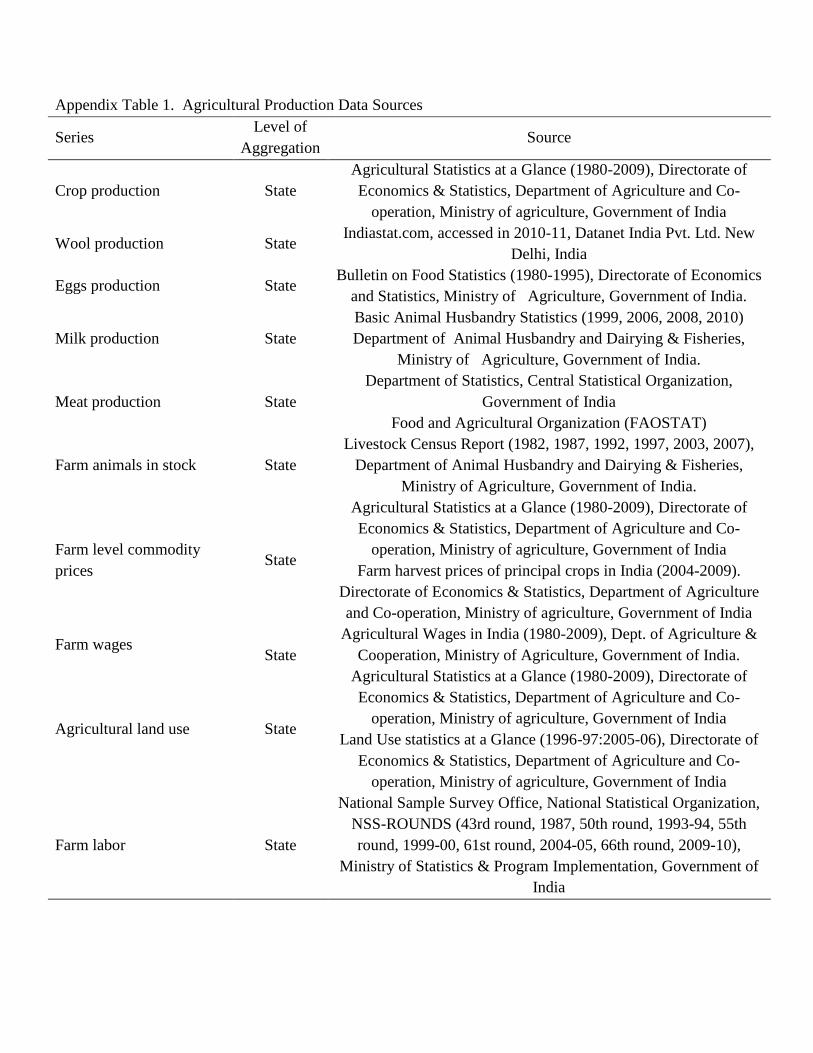
Appendix Table 1. Agricultural Production Data Sources
Series Level of
Aggregation Source
Crop production State
Agricultural Statistics at a Glance (1980-2009), Directorate of
Economics & Statistics, Department of Agriculture and Co-
operation, Ministry of agriculture, Government of India
Wool production State Indiastat.com, accessed in 2010-11, Datanet India Pvt. Ltd. New
Delhi, India
Eggs production State Bulletin on Food Statistics (1980-1995), Directorate of Economics
and Statistics, Ministry of Agriculture, Government of India.
Milk production State
Basic Animal Husbandry Statistics (1999, 2006, 2008, 2010)
Department of Animal Husbandry and Dairying & Fisheries,
Ministry of Agriculture, Government of India.
Meat production State
Department of Statistics, Central Statistical Organization,
Government of India
Food and Agricultural Organization (FAOSTAT)
Farm animals in stock State
Livestock Census Report (1982, 1987, 1992, 1997, 2003, 2007),
Department of Animal Husbandry and Dairying & Fisheries,
Ministry of Agriculture, Government of India.
Farm level commodity
prices State
Agricultural Statistics at a Glance (1980-2009), Directorate of
Economics & Statistics, Department of Agriculture and Co-
operation, Ministry of agriculture, Government of India
Farm harvest prices of principal crops in India (2004-2009).
Directorate of Economics & Statistics, Department of Agriculture
and Co-operation, Ministry of agriculture, Government of India
Farm wages
State
Agricultural Wages in India (1980-2009), Dept. of Agriculture &
Cooperation, Ministry of Agriculture, Government of India.
Agricultural land use State
Agricultural Statistics at a Glance (1980-2009), Directorate of
Economics & Statistics, Department of Agriculture and Co-
operation, Ministry of agriculture, Government of India
Land Use statistics at a Glance (1996-97:2005-06), Directorate of
Economics & Statistics, Department of Agriculture and Co-
operation, Ministry of agriculture, Government of India
Farm labor State
National Sample Survey Office, National Statistical Organization,
NSS-ROUNDS (43rd round, 1987, 50th round, 1993-94, 55th
round, 1999-00, 61st round, 2004-05, 66th round, 2009-10),
Ministry of Statistics & Program Implementation, Government of
India
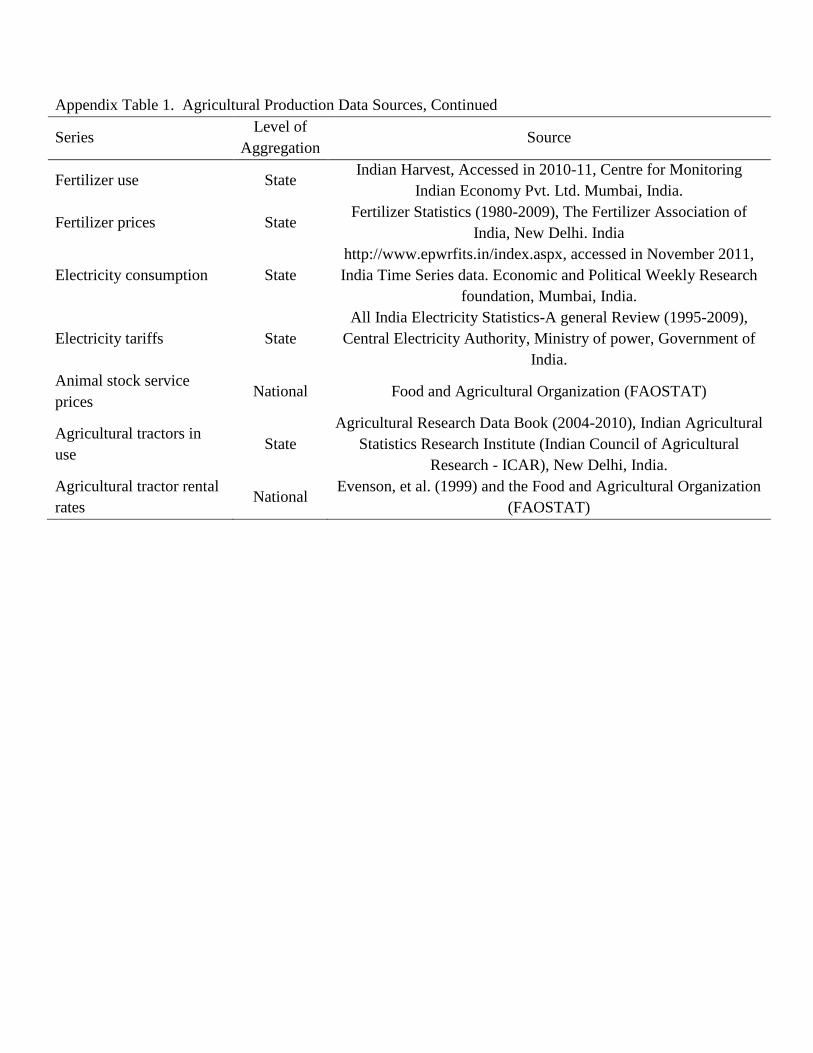
Appendix Table 1. Agricultural Production Data Sources, Continued
Series Level of
Aggregation Source
Fertilizer use State Indian Harvest, Accessed in 2010-11, Centre for Monitoring
Indian Economy Pvt. Ltd. Mumbai, India.
Fertilizer prices State Fertilizer Statistics (1980-2009), The Fertilizer Association of
India, New Delhi. India
Electricity consumption State
http://www.epwrfits.in/index.aspx, accessed in November 2011,
India Time Series data. Economic and Political Weekly Research
foundation, Mumbai, India.
Electricity tariffs State
All India Electricity Statistics-A general Review (1995-2009),
Central Electricity Authority, Ministry of power, Government of
India.
Animal stock service
prices National Food and Agricultural Organization (FAOSTAT)
Agricultural tractors in
use State
Agricultural Research Data Book (2004-2010), Indian Agricultural
Statistics Research Institute (Indian Council of Agricultural
Research - ICAR), New Delhi, India.
Agricultural tractor rental
rates National
Evenson, et al. (1999) and the Food and Agricultural Organization
(FAOSTAT)
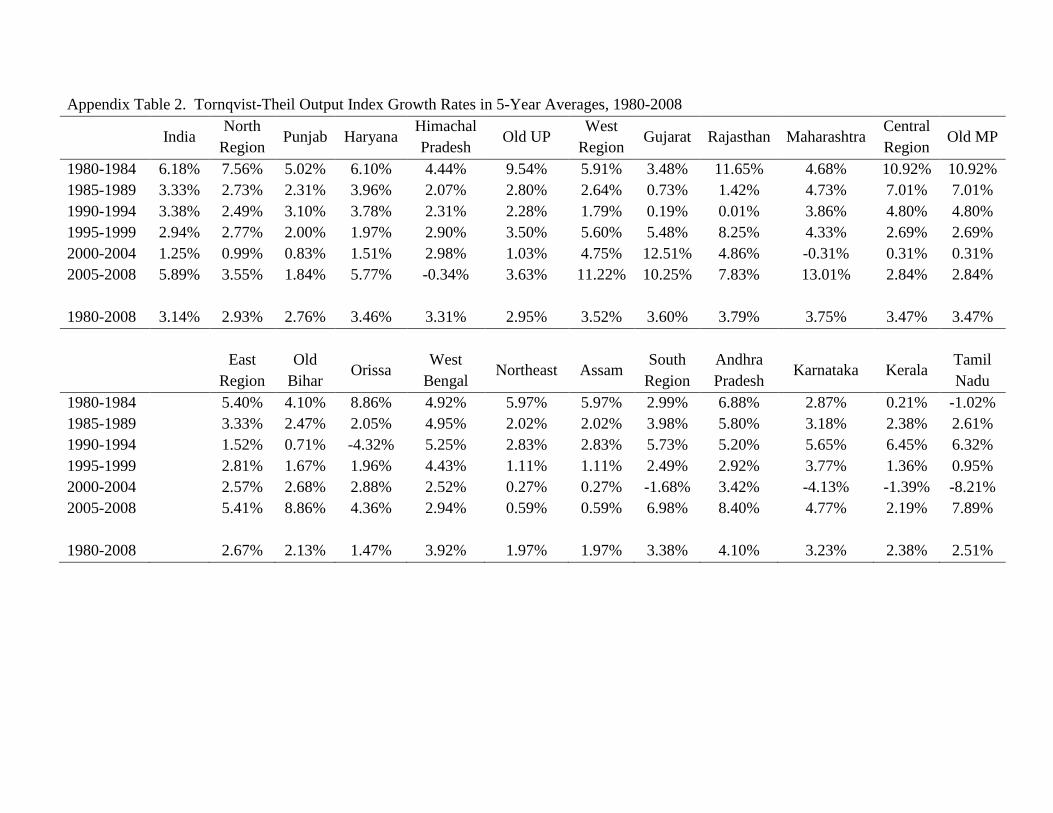
Appendix Table 2. Tornqvist-Theil Output Index Growth Rates in 5-Year Averages, 1980-2008
India North
Region Punjab Haryana
Himachal
Pradesh Old UP
West
Region Gujarat Rajasthan Maharashtra
Central
Region Old MP
1980-1984 6.18% 7.56% 5.02% 6.10% 4.44% 9.54% 5.91% 3.48% 11.65% 4.68% 10.92% 10.92%
1985-1989 3.33% 2.73% 2.31% 3.96% 2.07% 2.80% 2.64% 0.73% 1.42% 4.73% 7.01% 7.01%
1990-1994 3.38% 2.49% 3.10% 3.78% 2.31% 2.28% 1.79% 0.19% 0.01% 3.86% 4.80% 4.80%
1995-1999 2.94% 2.77% 2.00% 1.97% 2.90% 3.50% 5.60% 5.48% 8.25% 4.33% 2.69% 2.69%
2000-2004 1.25% 0.99% 0.83% 1.51% 2.98% 1.03% 4.75% 12.51% 4.86% -0.31% 0.31% 0.31%
2005-2008 5.89% 3.55% 1.84% 5.77% -0.34% 3.63% 11.22% 10.25% 7.83% 13.01% 2.84% 2.84%
1980-2008 3.14% 2.93% 2.76% 3.46% 3.31% 2.95% 3.52% 3.60% 3.79% 3.75% 3.47% 3.47%
East
Region
Old
Bihar Orissa
West
Bengal Northeast Assam
South
Region
Andhra
Pradesh Karnataka Kerala
Tamil
Nadu
1980-1984 5.40% 4.10% 8.86% 4.92% 5.97% 5.97% 2.99% 6.88% 2.87% 0.21% -1.02%
1985-1989 3.33% 2.47% 2.05% 4.95% 2.02% 2.02% 3.98% 5.80% 3.18% 2.38% 2.61%
1990-1994 1.52% 0.71% -4.32% 5.25% 2.83% 2.83% 5.73% 5.20% 5.65% 6.45% 6.32%
1995-1999 2.81% 1.67% 1.96% 4.43% 1.11% 1.11% 2.49% 2.92% 3.77% 1.36% 0.95%
2000-2004 2.57% 2.68% 2.88% 2.52% 0.27% 0.27% -1.68% 3.42% -4.13% -1.39% -8.21%
2005-2008 5.41% 8.86% 4.36% 2.94% 0.59% 0.59% 6.98% 8.40% 4.77% 2.19% 7.89%
1980-2008 2.67% 2.13% 1.47% 3.92% 1.97% 1.97% 3.38% 4.10% 3.23% 2.38% 2.51%
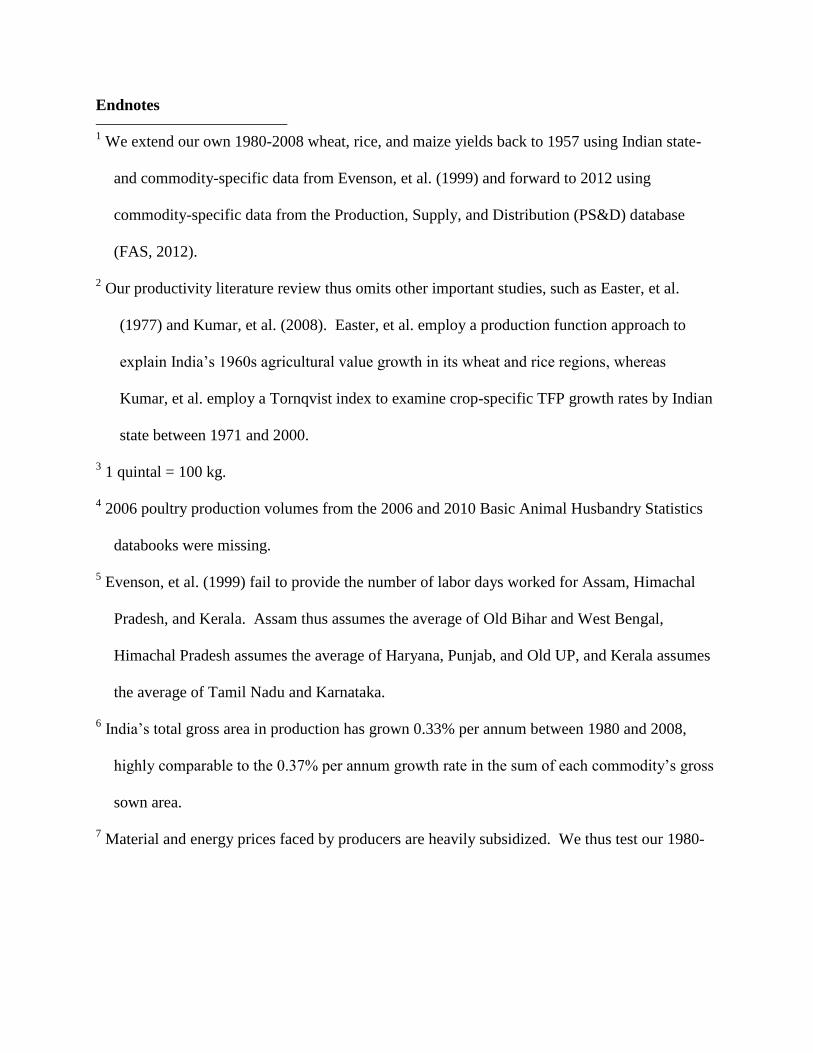
Endnotes
1 We extend our own 1980-2008 wheat, rice, and maize yields back to 1957 using Indian state-
and commodity-specific data from Evenson, et al. (1999) and forward to 2012 using
commodity-specific data from the Production, Supply, and Distribution (PS&D) database
(FAS, 2012).
2 Our productivity literature review thus omits other important studies, such as Easter, et al.
(1977) and Kumar, et al. (2008). Easter, et al. employ a production function approach to
explain India’s 1960s agricultural value growth in its wheat and rice regions, whereas
Kumar, et al. employ a Tornqvist index to examine crop-specific TFP growth rates by Indian
state between 1971 and 2000.
3 1 quintal = 100 kg.
4 2006 poultry production volumes from the 2006 and 2010 Basic Animal Husbandry Statistics
databooks were missing.
5 Evenson, et al. (1999) fail to provide the number of labor days worked for Assam, Himachal
Pradesh, and Kerala. Assam thus assumes the average of Old Bihar and West Bengal,
Himachal Pradesh assumes the average of Haryana, Punjab, and Old UP, and Kerala assumes
the average of Tamil Nadu and Karnataka.
6 India’s total gross area in production has grown 0.33% per annum between 1980 and 2008,
highly comparable to the 0.37% per annum growth rate in the sum of each commodity’s gross
sown area.
7 Material and energy prices faced by producers are heavily subsidized. We thus test our 1980-
2008 average annual TFP growth estimate by doubling fertilizer prices and employing the
general electricity tariff rather than the tariff specific to agriculture. These steps raise (lower)
our national-level average annual input (TFP) growth index by 0.20%.


![[New, Green and Smart Paradigm of Agricultural Water]](https://img.pdfslide.us/doc/110x75/6213894158a17348b22d611b/new-green-and-smart-paradigm-of-agricultural-water.jpg)